
Abstract
Do incumbents dominate non-partisan elections because of an especially large personal vote? This question has important implications for understanding the causes of incumbent success and the benefits or drawbacks of non-partisan elections. This paper uses a natural experiment, combined with three original datasets, to estimate the size, persistence, and consequences of the personal vote in a large non-partisan city election. We first use individual-level survey data to show that individuals assigned quasi-randomly to a new incumbent are substantially less likely to support the incumbent. We use a second survey, one year later, to demonstrate the persistence of this effect. Finally, we use historical election results to simulate the electoral consequences of the personal vote; we find that the personal vote is sufficiently large to affect one in four incumbent races. We conclude that the personal vote, while large and important, is not sufficient to explain incumbent dominance in non-partisan contests.
Keywords
Introduction
Few electoral arenas are more favorable to incumbents than non-partisan cities. Re-election rates among incumbent candidates in these contests regularly exceed ninety percent, and elections in which every incumbent candidate is successfully re-elected are so common as to merit little more than passing mention in post-election news coverage. For some, these success rates are a sign of serious trouble, an indication that non-partisan incumbents have little incentive to attend to their constituents’ preferences (Bednar 2014). Others suggest that the opposite is true: incumbent success reflects the fact that non-partisan city politicians are “closest to the people,” free from party discipline and distant travel and able to focus on the concrete interests and needs of their constituents (Oliver 2012).
The size of the “personal vote”—the relationship and reputation that incumbents cultivate with their constituents—thus has important implications for our understanding of incumbent success in non-partisan elections. If incumbents in these elections enjoy a substantial personal vote, this may indicate that local incumbent success rates are indeed a reflection of a distinctively close connection that non-partisan politicians enjoy with their constituents. By contrast, if incumbent success in non-partisan elections is driven by other factors, such as instantaneous incumbency cues or challenger scare-off, the case for non-partisanship as a means to improved democratic representation is more tenuous. Providing evidence with which to adjudicate among these possibilities is especially important in an era in which non-partisan city politics is held up as a positive example of non-polarized, pragmatic, democratic policymaking (Barber 2013).
In this paper, we combine individual survey data with quasi-random assignment to old or new incumbent candidates to provide a more precise and robust assessment of the size and persistence of the personal vote than has been possible in previous aggregate-level research. We use three original data sources to identify the size, persistence, and electoral consequences of the personal vote in Calgary, Alberta, the eighth-largest non-partisan city in North America. We first leverage a natural experiment created by a 2017 ward boundary revision process, in combination with novel individual-level survey data, to show that the probability of voting for an incumbent decreases by about ten percentage points in the absence of the personal vote. We then use a second original survey, undertaken one year after the election, to demonstrate that the effect we have identified reflects a persistent personal vote effect rather than an incumbency cue; even after a year, voters who are new to an incumbent are less likely to know about their councillor’s background and less likely to be familiar with their councillor’s ideology, policy issue positions, and performance in office. Finally, using a new dataset of nearly two hundred ward elections in the same city, we use a simulation to estimate the electoral consequences of the personal vote for incumbent candidates, finding that the personal vote is large enough to be decisive in just over one-quarter of incumbent races.
Taken together, our results suggest that the personal vote in non-partisan city elections is very large—roughly double the average personal vote estimated in U.S. Congressional elections. Municipal councillors in non-partisan cities are able to cultivate an especially strong reputation and relationship with their constituents. However, our results also suggest that the personal vote accounts for a minority fraction of incumbent success in non-partisan city elections. Despite the substantial size of the personal vote in these elections, other factors (such as incumbency cues and scare-off) appear to shape incumbent success even more powerfully. These findings have important consequences for theories of incumbency advantage and candidate-centered elections, strengthening recent arguments about the role of strong parties in providing a steady supply of high-quality electoral challengers (Carson, Engstrom, and Roberts 2007). While non-partisan incumbents do cultivate especially strong connections with their constituents, we argue, incumbent dominance in non-partisan elections is not primarily a result of being “closest to the people.”
Incumbency Advantage and the Personal Vote
Why are incumbents more likely to win elections than non-incumbents? While answers vary, most researchers agree that three factors are central to any satisfactory account of incumbents’ electoral success (Fowler 2016; Gelman and King 1990; Levitt and Wolfram 1997). The first is candidate quality. Since incumbent candidates became incumbents by first winning an open race or defeating a sitting incumbent, they may simply be stronger on average than their challengers. Like prizefighters, incumbents go on winning for the same reason they won the first time: superior quality (Zaller 1998). Whatever the relevant elements of candidate quality may be in a given electoral environment—ideological match with constituents, relevant past experience, longstanding residence in the community, and so on—these qualities appeal to voters when the candidate is first elected and continue to appeal to voters after the candidate has become an incumbent (Ansolabehere et al. 2006).
A second component of incumbent success is the instantaneous informational cue that incumbency provides to voters. As long as voters have some reason to prefer incumbents to non-incumbents—for instance, they may assume that incumbents are a lower-risk proposition (Eckles et al. 2014) or that having won in the past is an indicator of a baseline level of quality (Fowler 2018)—the mere fact of incumbency status may provide incumbent candidates with an advantage as long as the candidate’s incumbent status is known to voters.
Finally, incumbent candidates benefit from the personal vote that they are able to cultivate with their constituents: the familiarity and reputation that accrues to the incumbent by virtue of their constituent service, visibility in the district, and pro-district policy stances in their legislature (Ansolabehere, Snyder, and Stewart 2000; Carey and Shugart 1995; Desposato and Petrocik 2003). The personal vote is conceptually distinct from candidate quality because it is available only to incumbents and is not fixed in time; it is the benefit that the incumbent accrues as a result of increased familiarity with her performance and activities in office. The personal vote is also distinct from the incumbency cue, which represents the instantaneous benefit that a candidate enjoys once a voter is made aware of the fact that the candidate is the incumbent.
Components of Incumbency Advantage in Non-Partisan Elections
We have good reason to expect all three components of incumbency advantage to be operative in non-partisan elections—which we define as elections that not only exclude party labels from the ballot (formal non-partisanship) but in which the party affiliation of many candidates is unknown to voters (informal partisanship). In the absence of gatekeeping and recruitment from political parties, high-quality candidates might be unwilling to bear the costs of entering a difficult race against an incumbent, producing persistent differences in candidate quality between incumbents and challengers (Carson, Engstrom, and Roberts 2007). Similarly, with few partisan cues available to voters in non-partisan elections, especially at the ward level, the incumbency cue—the mere knowledge that a particular candidate is the incumbent—may provide an especially useful heuristic for information-starved municipal voters (Crowder-Meyer, Gadarian, and Trounstine 2020).
Most important for our purposes, however, is the role of the personal vote in non-partisan elections. Most models of elite political behavior assume that elected legislators occasionally face competing demands from constituents and party. Legislators who have an interest in increasing their policymaking authority and advancing their careers within a party have a strong incentive to support their party’s position even when it is not popular in their own district. However, legislators counterbalance these unpopular stances by securing goods and services for their districts and advocating for salient local issues in their legislatures. This personal vote provides some insulation from the occasional need to support locally unpopular party positions (Ansolabehere, Snyder, and Stewart 2000).
For critics of partisan politics, these competing pressures are precisely the problem with political parties. If parties create an incentive for politicians to take positions that they know to be unpopular with constituents, anti-partisan critics argue, the appropriate response is to weaken or abolish the parties. For more than a century, anti-partisan movements have sought to disrupt party systems with direct democracy, recall procedures, and plebiscitary processes of intra-partisan policy development. The result, these movements claim, will be politicians who are distinctively “close to the people,” cultivating a strong personal connection with their constituents (Copus et al. 2012).
Nowhere was the movement for non-partisanship stronger, and nowhere has it persisted with more success, than in municipal politics. In the United States, party affiliations are included on municipal election ballots in just eight of the country’s thirty largest cities (National League of Cities 2016). In Canada, non-partisan elections run even deeper; not only are provincial and federal political parties almost totally absent from municipal electoral politics, but the party affiliation of candidates in Canadian municipal elections is often unknown to voters (Lucas 2019). In many cases, these elections are both de jure non-partisan (no party labels on ballots) and de facto non-partisan (few partisan cues of any kind). This municipal non-partisanship is regularly celebrated both by high-profile municipal politicians and by academic observers as a strength of municipal politics, a model of pragmatism and democratic responsiveness from which other more polarized and partisan governments have much to learn (Barber 2013). On this view, incumbent success rates in these elections reflect the distinctive advantages of non-partisanship, serving as an indicator of constituent satisfaction with incumbent performance and the careful cultivation of a strong personal vote (Oliver 2012).
This interpretation, however, may be too optimistic. Survey research on municipal voters in Canada and the United States has not discovered that voters are distinctively enthusiastic about the performance of their municipal councils. Moreover, research on the development of the American party system by Carson, Engstrom, and Roberts (2007) suggests that increasingly candidate-centered elections in the U.S. Congress produced increased incumbency advantage, as political parties were less able to persuade high-quality challengers to contest elections against incumbents. If this logic holds true in non-partisan elections today, then incumbent success in non-partisan races may arise not because of an especially strong personal vote but rather from the absence of incentives for high-quality challengers to face off against incumbents. Combined with other disadvantages of non-partisan elections—such as decreased turnout (Caren 2007), increased ballot name-order effects (Chen et al. 2014), and reduced citizen engagement (Schaffner and Wright 2002)—a finding that the personal vote does not explain incumbent success in non-partisan elections would strengthen the view that the benefits of non-partisanship probably do not outweigh its costs.
Identifying the Personal Vote
In the past decade, several studies have estimated the size of the incumbency advantage in municipal elections. The first of these studies, by Jessica Trounstine (2011), found that incumbency increases a candidate’s probability of re-election by 32 percent; more recent studies have found similar results (Benedictis-Kessner 2017; Warshaw 2019). In Canada, Jack Lucas (2019) used similar methods to show that incumbency increases the probability of re-election in large Canadian cities by 41 percent and suggests that this especially large incumbency advantage may be due in part to the distinctively non-partisan character of Canadian city elections. All of these studies agree that incumbency has a dramatic effect on candidates’ future success, even beyond whatever quality advantages may have helped them get elected in the first place.
What is less clear, at present, is the relative importance of the three main components of incumbent success in city elections. One challenge is methodological; while the distinction among candidate quality, incumbency cues, and the personal vote is clear at a conceptual level, developing empirical strategies to distinguish among the three has proven to be a challenge. In Congressional elections, Ansolabehere et al. proposed a novel approach using district-level data: after district boundaries have changed, identify portions of each district in which voters are new to the incumbent and compare the incumbent’s vote share among those “new voters” to portions of the district in which the incumbent retains her “old voters.” Since informational cues and candidate quality would be constant within each district, the difference in incumbent vote share between old and new areas would thus represent the personal vote (Ansolabehere, Snyder, and Stewart 2000). This approach, which uncovered a personal vote of about four percent in U.S. House elections, was employed in subsequent analyses by Carson, Engstrom, and Roberts (2007) and at a finer-grained geographic level by Desposato and Petrocik (2003).
Ansolabehere et al.’s approach to the personal vote, while innovative, is vulnerable to two criticisms. First, if a district’s new voters are less likely to know which candidate is the incumbent than old voters in the same district—and subsequent research by McKee (2008) suggests that this may indeed be the case—the difference in vote share between the two portions of the district may represent the effects of an instantaneous incumbency cue rather than the personal vote. Ansolabehere et al. address this issue in their own article, demonstrating that the difference between old and new voters persists over time in a manner consistent with the personal vote as opposed to the incumbency cue. We provide a similar demonstration in our own analysis below.
A more difficult criticism of the Ansolabehere et al. approach has been articulated by Sekhon and Titiunik (2012). Even if assignment to “old voter” and “new voter” status were as good as random, this randomization process does not guarantee that members of the two groups in a particular district are comparable; the two groups have different histories and may react to the incumbent in their district in different ways as a result of those histories. “Random assignment,” they argue, “does not make the previous history of both groups comparable . . . such comparability must be assumed in addition to the randomization” (Sekhon and Titiunik 2012, 37). This assumption of comparability, they argue, severely weakens the claim that the comparison of new voters and old voters in a district provides a clean estimate of the personal vote. The most important consequence of Sekhon and Titiunik’s critique is that the comparability of old and new voters must be demonstrated, rather than assumed, if the Ansolabehere et al. approach to the personal vote is to be persuasive. This is difficult to do with the aggregate data used in previous research on redistricting and the personal vote. In our case, however, we have the advantage of individual-level survey data with which to carry out such an analysis. As we will explain in more detail below, we can identify each respondent in incumbent races as either a new voter or an old voter and then systematically investigate the plausibility of the claim that members of the two groups do not differ on observable characteristics that are likely to be related to their vote choice. Robustness tests, including individual and ward-level controls and matching procedures, can provide additional confidence that our estimates capture the personal vote rather than other factors that may differ across the two groups. We explain these analyses in more detail below.
Data and Methods
Our data are drawn primarily from two related survey projects: the Canadian Municipal Election Study’s Calgary pre-election (September 29 to October 15) and post-election (October 17 to November 2) surveys corresponding to the city’s election on October 16, 2017; and a follow-up survey, the Calgary Year in Review, which was fielded in the same city from November 14 to December 13, 2018. Respondents for these surveys were recruited by Forum Research via random digit dial and, upon agreeing to participate, received a link to complete the survey online. After quality checks, a total of 2,031 individuals completed the 2017 pre-election survey, 1,577 completed the 2017 post-election survey, and 1,975 completed the 2018 year in review survey. We provide full question texts for the relevant survey questions, along with detail on coding decisions for each variable, in the supplementary material (SM9). 1
The city of Calgary is divided into more than two hundred official communities, each of which is assigned to one of the city’s fourteen wards. These communities are well known to Calgary residents and, in most cases, are identical with informal neighborhoods. This enabled us to ask each respondent about their community of residence and then assign each respondent to one of three categories: “open race voters” who voted in one of Calgary’s four open races in 2017 and are excluded from this analysis; “old voters” whose incumbent had not changed; and “new voters” whose incumbent had changed as a result of redistricting. This allowed us to distinguish among voter types without relying on voters’ own recall of whether or not they were redistricted. The distinction between old voters and new voters is the treatment variable of interest in all of the analyses below; in total, we have 1,494 respondents in these two groups in the 2017 pre-election survey, 968 in the 2017 post-election survey, and 1,458 in the 2018 survey. About 21 percent of these respondents are “new voters” in both the 2017 and 2018 surveys.
Our principal outcome variables of interest are vote intention and vote choice in incumbent ward races in Calgary’s 2017 municipal election. We code vote intention as (1) if the respondent indicated in the 2017 pre-election survey that they intended to vote for the incumbent, and (0) if they selected another candidate or had not yet decided. 2 We code vote choice as (1) if the respondent indicated in the 2017 post-election survey that they voted for the incumbent candidate, and (0) if they voted for any other candidate in the race. To maximize our sample size, we use vote intention as our main outcome variable in the analyses below, but we also show that our findings are substantively identical when using vote choice rather than vote intention.
In our follow-up analysis, we leverage data from our 2018 survey to demonstrate that the effect we identify in the 2017 data reflects the personal vote rather than an incumbency cue; lower levels of knowledge and familiarity with incumbents—symptoms of the absence of a personal vote effect—persist over an extended period of time among new voters. These analyses are based on a series of questions about respondents’ familiarity with their city councillor as well as their city councillor’s issue position, ideology, and performance in office. We will discuss each of these variables in more detail below, but in most cases, our outcome variable of interest is the probability that a respondent will provide an answer to these questions rather than selecting “don’t know.”
Finally, our simulation-based assessment of the consequences of the personal vote for actual election outcomes in Calgary is based on a dataset of ward-level election results for each of the 196 ward races in Calgary since the city adopted its current 14-ward structure in 1977. These results are drawn from paper records available in the City of Calgary archives and the Calgary Public Library local history records, and include candidate names, incumbency status, ward name, election year, and vote share for each of the 732 individuals who participated in a ward race since 1977. We use these data to estimate the consequences of the personal vote for election outcomes in Calgary; we explain these simulations in more detail below.
Redistricting in Calgary: A Natural Experiment?
Calgary, Alberta, a city of 1.2 million in western Canada, holds council elections in fourteen single-member wards every four years. According to the city’s ward boundary review policy, a commission is to be appointed to draw revised ward boundaries after every second election, or a little less than once each decade. The city’s policy requires that ward boundaries be drawn with an eye to equal population (with a target deviation of no more than 10–15 percent and a maximum deviation of 25 percent), and also includes standard redistricting objectives such as respecting community boundaries, drawing boundaries using identifiable features of the natural and built environment (such as rivers and arterial roads), and respecting historical ward boundaries when possible (City of Calgary 1993).
In 2015, an independent commission reviewed Calgary’s ward boundaries and proposed redistricting scenarios to council and the public; these were then adjusted by city staff and council and the new boundaries were confirmed in the spring of 2016. This redistricting process meant that some residents became “new voters”—individuals whose ward election in 2017 was an incumbent race, but whose incumbent had changed—and other residents remained “old voters” whose incumbent did not change. 3 Our task in this section is to evaluate the extent to which assignment to these “new voter” or “old voter” groups was as good as random; that is, we need to assess whether assignment to these groups was related directly or indirectly to factors that could affect a voter’s probability of incumbent support. Following Dunning (2012), we do so in three ways: by assessing the opportunity for subjects to self-select into the two groups; by assessing the possibility that policy-makers assigned subjects to the two groups for reasons related to incumbent support; and lastly, by assessing whether the two groups are balanced on variables that we expect to be related to incumbent support.
Two interrelated reasons suggest that individual subjects had almost no capacity to self-select into a new incumbent ward or remain in their current ward. First, because the city’s ward boundary policy requires that community boundaries be respected as much as possible, it is usually whole neighborhoods, rather than particular blocks or streets, that are moved from one ward to another. A resident or group of residents who wished to self-select into a particular group would need to persuade their whole neighborhood to advocate strongly for such a change. Second, and relatedly, there is no evidence that any communities engaged in such advocacy. The new ward boundaries came as a surprise to Calgary’s community associations, who complained that a consultation process in the summer of 2015 gave them insufficient time to comment on the redistricting process (Klingbeil and McIntosh 2015). Thus, we have little evidence to suggest that individuals had the interest or the capacity to self-select into particular incumbent races.
Since Calgary’s city council has final authority to approve the city’s ward boundaries, we might also worry about strategic redistricting in which councillors “eject” low-support areas to other wards and welcome more congenial areas to their own. Here too, however, we have uncovered no evidence to suggest that this occurred in the 2015–2016 process. The reason that city council decided to “tweak” the ward boundaries proposed by the independent commission had to do with population, not electoral calculation; the commission had proposed ward boundaries with high levels of population deviation (on the grounds that those boundaries would be more durable to future population growth), but councillors felt that the deviations would create unfair workload imbalances and sought to adjust the wards to create more balanced populations across wards (Howell 2015a, 2015b). Through the entire process, just one incumbency-related accusation emerged—a city councillor accused the mayor of proposing that a neighborhood be redistricted because the councillor lived in that neighborhood, and thus would no longer live in his own ward—and the neighborhood was ultimately left within the councillor’s ward (Kauffman 2016). 4 Just eight of our survey respondents live in this particular neighborhood, and unsurprisingly, our findings are robust to its exclusion from the analysis. Thus, despite some public wrangling about the city’s new ward boundaries in 2015 and 2016, qualitative evidence from newspaper sources and council meetings suggests that controversy about ward boundaries was almost exclusively related to councillors’ concerns about their jobs—concerns about equitable distribution of workload—rather than about how the changes would affect their electoral prospects.
Readers who are familiar with partisan redistricting in the United States may doubt that strategic calculations were generally absent in Calgary. For this reason, we must emphasize four additional pieces of evidence in support of our interpretation. First, as we noted above, incumbent elections in Canadian cities are often uncompetitive, decreasing the incentives for strategic redistricting, and increasing incentives for incumbents to think about how the new boundaries will affect their day-to-day work—precisely what they focused on in Calgary. Second, while city council has final approval of ward boundaries, proposals are drafted by independent commissions or city staff; deviations from this “menu” of options is closely scrutinized by journalists, making strategic redistricting more difficult. Third, a new round of boundary revisions in 2020 followed exactly the same pattern as the 2015 changes; once again, there was no evidence of electorally motivated changes (Smith 2020). Finally, and perhaps most importantly, Canadian provincial and federal district boundaries have been drawn by non-partisan commissions for decades; while this does not prevent strategic municipal redistricting, it does dramatically increase the costs involved in doing so, as public disapproval of “gerrymandering” is very high (Courtney 2001). Thus, while we have no doubt that councillors are aware of the political geography of support in their wards, their ability to shape ward boundaries to their advantage are limited, and the costs involved in being seen to do so are extremely high.
We can also assess the plausibility of as-good-as-random assignment to old and new voter status using quantitative data from our surveys. In Table 1, we report the results of a series of bivariate balance tests on a suite of variables related to incumbent support on the left-hand side of the table, along with the same analyses with ward fixed effects on the right-hand side. 5 The first of these are the sociodemographic variables age, gender, and education; past research has shown these variables to be related to risk tolerance (Kam and Simas 2010), which is itself related to the probability of incumbent support (Eckles et al. 2014). The second set of variables measure individual partisanship and ideology; individuals who are strongly anchored to a particular party or ideological position are less likely to be swayed by their incumbent’s performance or responsiveness in office (Desposato and Petrocik 2003). Here we test for balance on party identification with Canada’s three major national parties—the Liberal Party, the Conservative Party, and the New Democratic Party (NDP)—as well as a general variable capturing if the individual is a partisan of any stripe (“partisan”). 6 For our ideology balance test, we include ideological self-placement on a 0 to 10 scale (“ideology”) along with the respondent’s distance from the ideological center (“ideologue”). Third, we include a set of variables related to performance satisfaction and retrospective voting: the voter’s perception of how home values have changed in the past year, the performance of the Calgary economy in the past year, and satisfaction with the mayor’s performance. Finally, we include each incumbent’s margin of victory in 2017, since imbalance on this variable—for example, if new voters were disproportionately in more competitive wards than old voters—would have obvious confounding effects on our estimates. In each case, the table reports ordinary least squares regression coefficients, p values, and for any variables within striking distance of a generous 90 percent interpretation of statistical significance, the direction of the relationship.
Balance Tests: New Voters versus Old Voter.
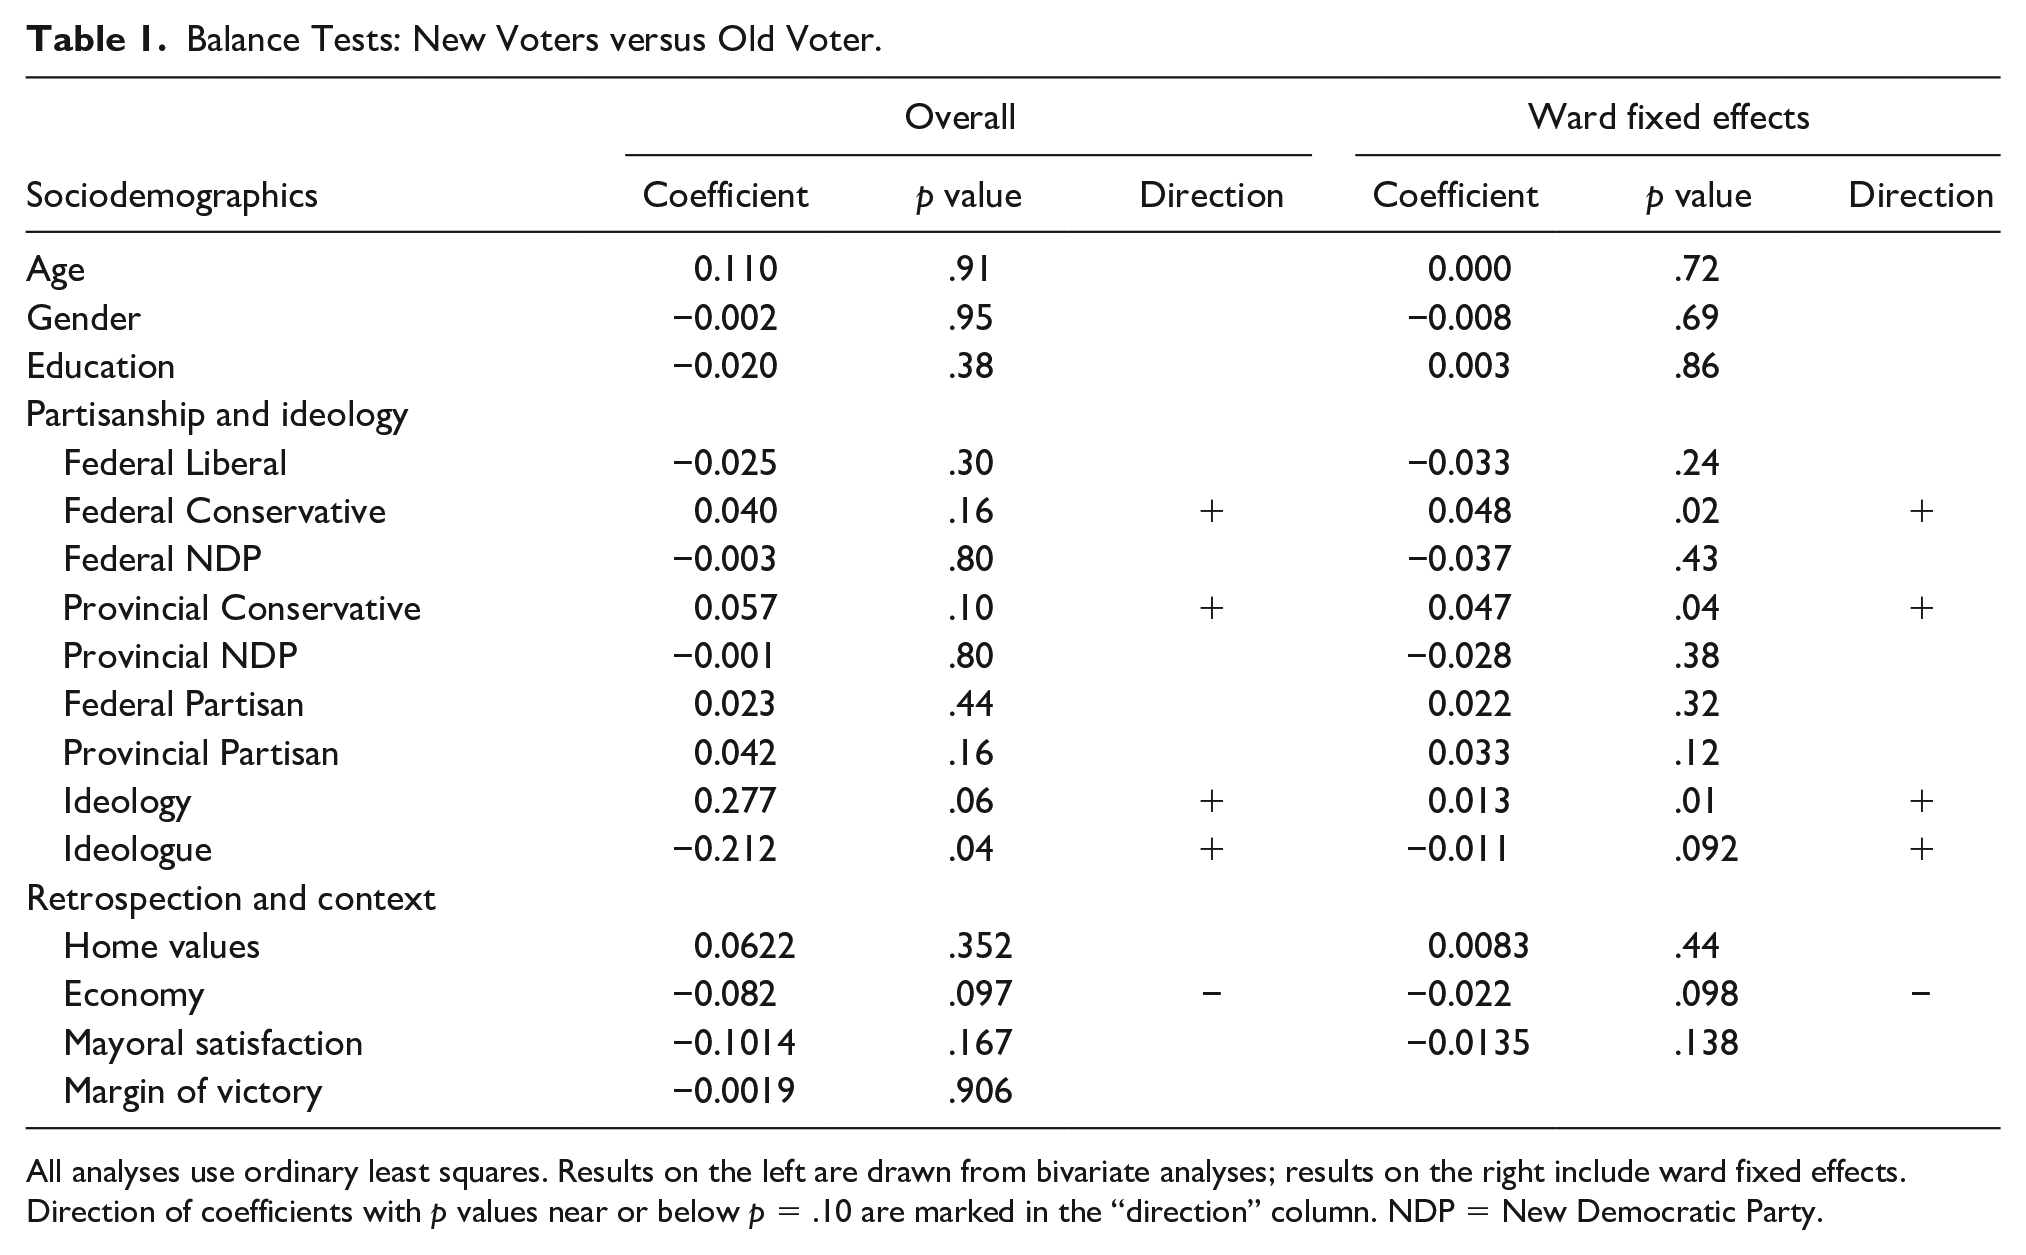
All analyses use ordinary least squares. Results on the left are drawn from bivariate analyses; results on the right include ward fixed effects. Direction of coefficients with p values near or below p = .10 are marked in the “direction” column. NDP = New Democratic Party.
In general, the results suggest that new voters and old voters in our sample are similar: old voters do not differ from new voters in terms of sociodemographic characteristics, most aspects of ideology and partisanship, most retrospective variables, or their ward’s margin of victory. A test of joint significance including all variables in Table 1 is also far from statistical significance (p = .59). However, new voters do appear to be slightly more likely to be both partisan and ideological conservatives; new voters have a 4 percent to 5 percent higher probability of being partisan Conservatives and are about 0.3 points to the right of old voters on a 0 to 10 ideological self-placement scale. New voters are also slightly more pessimistic about the performance of the local economy than old voters. 7 These are substantively modest differences, and we provide additional evidence in the supplementary material (SM2) that they are the result of chance variation rather than some selection process. In any case, we provide analyses that control for these potentially imbalanced variables below.
Before moving to our results, we must also briefly discuss the right-hand column of Table 1, which reports the same balance tests with ward fixed effects. Intuitively, ward fixed effects would seem to be a good approach in our analysis, since a fixed effects model would allow us to compare “apples to apples” within each distinctive ward-level electoral environment. However, as Sekhon and Titiunik (2012) have persuasively argued, district-level analysis does not create an apples to apples comparison, and as the table demonstrates, ward fixed effects do not improve balance on partisan, ideology, or retrospection variables. While we will report results with ward fixed effects to demonstrate the robustness of our results below, we believe that the pooled city-wide estimates, comparing all new voters to all old voters, provide the best estimate of the personal vote given the well-balanced individual-level data available to us.
Results
We now turn to our findings. Figure 1 reports the results of a regression of incumbent vote intention (top coefficient) and vote choice (bottom coefficient) on our treatment variable (old vs. new voter) using several specifications. 8 In the first plot, a simple bivariate regression, we find that new voters are ten percentage points less likely to support the incumbent than old voters. The second plot adds controls for the three variables—Conservative partisanship, ideology, and economic retrospection—for which we noted balance concerns above, and the third contains controls for the full suite of variables listed in Table 1. In both cases, the estimates are substantively similar and statistically indistinguishable from those in the first plot.
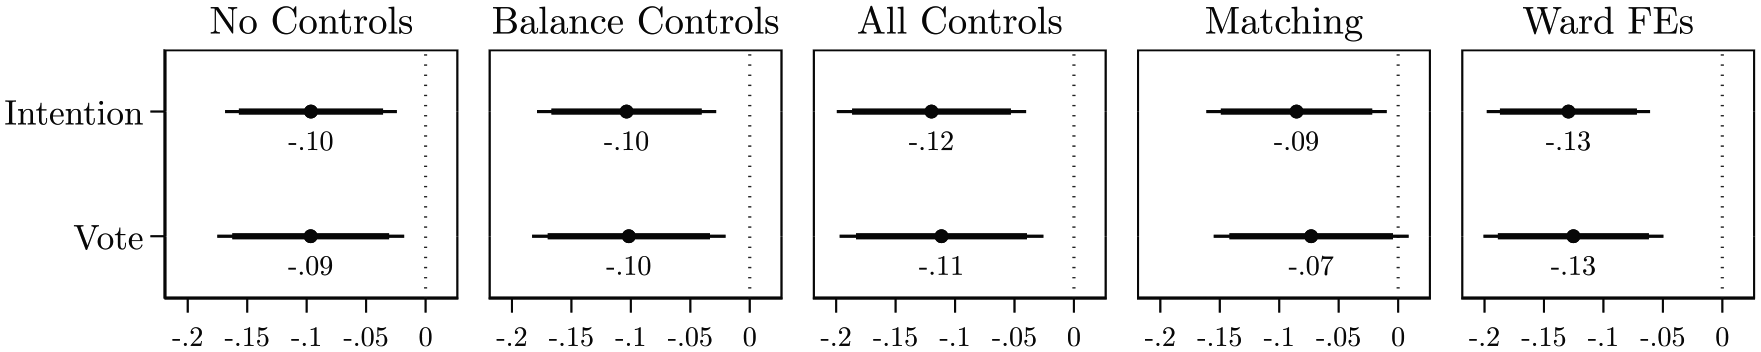
Decreased likelihood of incumbent vote among new voters.
In the fourth plot, we use coarsened exact matching to further test the robustness of our estimate (Blackwell et al. 2009). We began by coarsening one of our three imbalanced variables, ideology, into three categories: left (0–3), center (4–6), and right (7–10). We also coarsened ward-level margins of victory into close races (0%–10% margin of victory), moderately competitive races (11%–25% margin of victory), and blowouts (above 25% margin of victory). With these coarsened variables in hand, we matched each respondent to other respondents who were an exact match on three individual variables (coarsened ideology, Conservative partisan, and economic retrospection) and two ward-level variables (coarsened margin of victory and number of incumbent terms). The fourth plot displays the estimates of the difference between new voters and old voters within each of the resulting matched groups; once again the resulting point estimate is similar to and statistically indistinguishable from the estimates in the first three plots. 9 As an additional robustness test, the fifth plot displays estimates of the average difference between new voters and old voters with ward fixed effects; here too, the point estimate is statistically indistinguishable from those on the other plots.
A final test of the robustness of our findings takes advantage of Calgary’s mayoral incumbent election in 2017. Since ward boundary changes had no effect on Calgarians’ relationship to their mayoral incumbent, new voter status should be unrelated to mayoral incumbent support. In the supplementary material (SM4), we show that new voter status has no effect on mayoral incumbent intention or vote, providing additional confidence that we are capturing the personal vote in the estimates above, rather than some other factor that affects new voters’ incumbent preferences or satisfaction with council in general.
Across all plots in Figure 1, then, our results indicate that new voters are substantially less likely than old voters to support their incumbent candidate. This is a very large personal vote effect, roughly double the effect uncovered by Ansolabehere et al. (2000) and Desposato and Petrocik (2003) in aggregate analyses of American Congressional elections. Put simply, incumbent councillors in non-partisan elections do appear to be able to cultivate an especially strong connection with their voters.
Variation in the Personal Vote
Past research on the personal vote has found that the size of the personal vote varies in relation to district competitiveness; as a district becomes more competitive, the personal vote tends to increase, perhaps as a reflection of the added effort required of incumbents in competitive districts to cultivate a personal connection in a more “hostile” environment (Ansolabehere, Snyder, and Stewart 2000; Desposato and Petrocik 2003). We expect a similar dynamic in non-partisan elections. Incumbents who anticipate that their election will be competitive—an expectation based on past electoral experience and their knowledge of current sentiment in the ward—have an incentive to work especially hard to cultivate a good reputation and personal relationship with their constituents.
In non-partisan contests, we cannot use standard partisan proxies for district competitiveness, such as the proportion of registered Democrats in the district (not least because such data simply do not exist in Canada). Thus, to test for the possibility of variation in the size of the personal vote effect, we constructed a multilevel model that includes our treatment variable (old or new voter), the incumbent’s margin of victory, and the interaction between the two; we allow ward intercepts and the slope of the margin of victory coefficient to vary by ward. The resulting interaction is displayed in Figure 2. On the y-axis, we plot the difference in the probability of an incumbent vote among new voters as compared with old voters. On the x-axis, we plot the margin of victory by which the incumbent won the race. Each point in the figure can thus be interpreted as the predicted change in incumbent support between old and new voters for a given margin of victory.
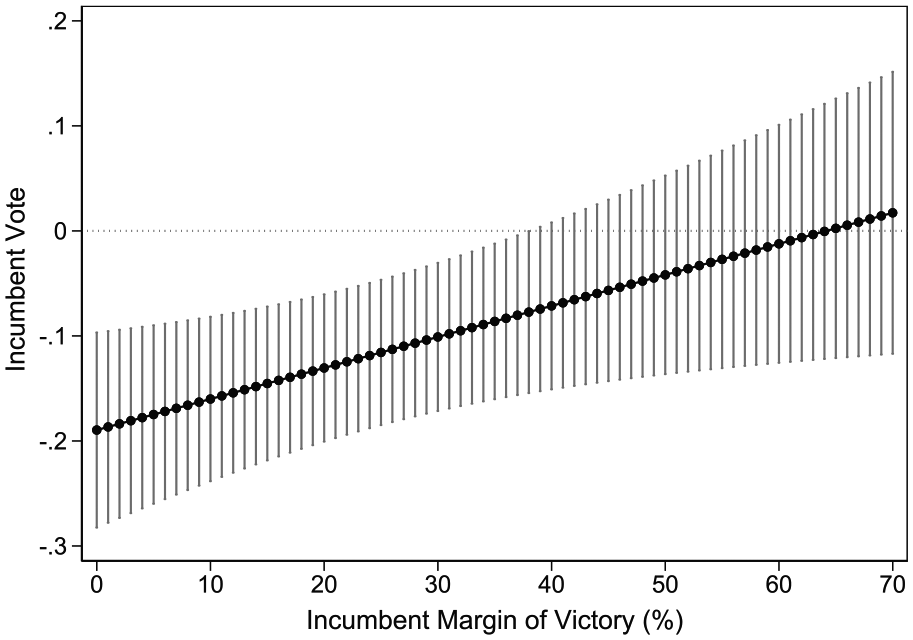
Decreased incumbent support among new voters, by incumbent margin of victory.
As expected, the size of the personal vote effect is largest in competitive races and decreases as the incumbent’s margin of victory grows. In the most competitive races, the estimated difference between new voters and old voters approaches twenty percent; the difference reduces to zero at a margin of victory of about 65 percent, but ceases to be statistically significant at a margin of victory of 40 percent. To ensure that this finding is robust to alternative measures of district competitiveness, we provide a similar analysis in the supplementary material (SM7) using survey-based estimates of ward-level ideological diversity in place of margin of victory—which we show to be strongly correlated with historical patterns of ward-level competitiveness—and our personal vote estimates using this alternative measure are very similar to those reported in Figure 2. Taken together, these results confirm our expectation, based on past research, that the personal vote varies systematically across electoral contexts and is larger in more competitive electoral districts. We will return to this finding in our simulation below.
Personal Vote or Instantaneous Cue?
Thus far, we have shown that new voters are substantially less likely than old voters to support their incumbent, and that this difference between new voters and old voters varies by district competitiveness. It is possible, however, that this difference is attributable to an incumbency cue—the mere awareness of which candidate is the incumbent in a particular race—rather than the personal vote. To test for this possibility, and to provide additional insight into the character of the personal vote, we now turn to data from our follow-up survey undertaken in Calgary one year after the municipal election. 10
Five questions in the 2018 follow-up survey are directly relevant to our analysis here. 11 First, we asked respondents if they agreed or disagreed with two statements about their councillor: whether they felt that they knew a lot about their councillor’s background and character, and whether they would recognize their councillor if they passed each other on the street. To eliminate possible incumbency cue effects (such as a difference in name retrieval among new and old voters), we programmed the survey to provide respondents with their incumbent’s full name in the preamble to these questions. If the personal vote reflects a relationship and reputation among voters which takes substantial time and effort to cultivate, we would expect to see lower levels of agreement with both of these statements among new voters when compared with old voters.
Three additional questions in the 2018 survey are relevant to our analysis. Because our 2018 survey was fielded immediately after a high-profile plebiscite on a possible bid for the 2026 Winter Olympics in Calgary, we asked respondents if, to their knowledge, their councillor supported or opposed an Olympic bid. This question provides us with information on respondents’ knowledge of their councillor’s issue position on an important and high-profile issue in Calgary. However, while some councillors were very public in their support or opposition to the Olympic bid, others were less public about their views, and some vacillated between support and opposition in the months before the plebiscite. We thus measure respondent knowledge on the Olympic issue in two ways: the probability of providing any response to the question, rather than choosing “don’t know,” and the probability of providing the correct response, based on our assessment of council debates and public discussion of the Olympic issue by Calgary councillors.
We also asked respondents to place their councillor on a 0 to 10 left-right ideology scale, providing us with information on respondent’s knowledge of their councillor’s perceived ideological position. Finally, we asked respondents how satisfied they were with their councillor’s performance. For each of these questions, we provided respondents with a “don’t know” option. 12 Once again, if the difference we have found between new and old voters is due to personal vote rather than incumbency cues, and if a personal relationship and reputation take substantial time to cultivate, we would expect new voters to be less familiar with their councillor than old voters, and thus more likely to select “don’t know” in response to these questions about their councillor’s issue position, ideological position, and performance in office.
Figure 3 reports the results of this analysis. Once again our treatment variable is coded (1) for new voters and (0) for old voters, and each of the outcome variables is coded positively if the respondent agreed with the recognition and knowledge questions, provided a response other than “don’t know” for the issue position (Olympics A), ideology, and performance questions, or correctly stated their councillor’s position on the Olympics issue (Olympics B). The negative coefficients across all six outcome variables indicate that new voters are consistently less familiar with their councillors than old voters. 13
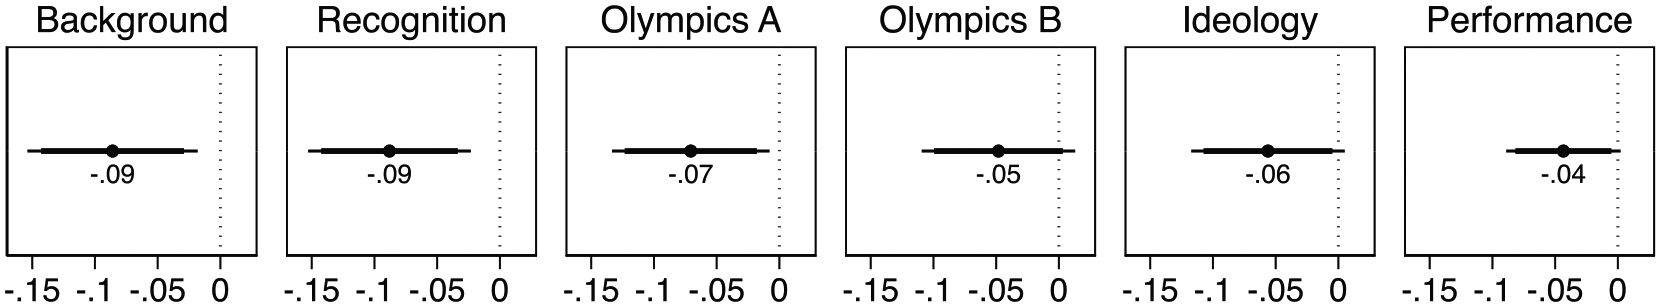
Persistent new/old voter differences in councillor knowledge, 2018.
These results provide strong evidence that our main estimate in the analysis above is capturing the personal vote rather than the incumbency cue. Even a full year after the election, and even when respondents are provided with their councillor’s name, we see consistent differences between new voters and old voters. As with the 2017 results, we are confident that these results are driven by a voter’s “new voter” or “old voter” status; in the supplementary materials, we show that the findings are substantively identical in models containing ward fixed effects, covariate controls, and controls for variables known to be associated with the propensity to guess on knowledge-based questions. The results are also consistent with aggregate-level studies in the United States, which have found that personal vote effects among new voters can persist even after a full term in office (Ansolabehere, Snyder, and Stewart 2000). Our individual-level data deepen these past findings by demonstrating that the personal vote affects constituents’ familiarity with their representative across a wide range of politically salient dimensions, from basic recognition to issue position, ideology, and performance.
The Consequences of the Personal Vote
New voter status—that is, the absence of the personal vote—substantially decreases the probability of incumbent support and durably reduces individuals’ familiarity with their representatives. These findings confirm that the personal vote is an important component of incumbent success in non-partisan elections. Thus far, however, our findings tell us little about the consequences of the personal vote for actual election outcomes in non-partisan cities. Given the estimates above, how much does the personal vote shape who actually wins and loses elections?
To address this question, we combine two data sources to simulate how election outcomes might change in the absence of the personal vote. The first source of information is the personal vote estimate described above. The second is a new dataset we have compiled from official archival sources containing complete election results for each of the 196 ward races in Calgary since the city adopted its current fourteen-ward structure in 1977. The dataset contains a total of 149 incumbent races, 133 of which were incumbent victories. 14 To translate our personal vote estimates above into an aggregate figure for the simulation, it is useful to notice that an aggregate vote share of, say, 60 percent for a given candidate means that the average probability that each individual voter will support that candidate is also 60 percent. If we reduce the individual probability of incumbent support by ten percent, this translates into an aggregate loss of ten percentage points in the incumbent’s vote share. Thus, by combining these two data sources—an estimate of the personal vote and a distribution of actual vote shares—we can sample from the distribution of vote shares and subtract the personal vote to simulate the consequences of the personal vote on election outcomes. More specifically, the simulation unfolds as follows:
Create a normal distribution of the personal vote using the estimates above with a mean equal to the point estimate of the personal vote coefficient above (−0.0964) and a standard deviation equal to the standard error of that estimate (0.0368).
Make a random draw of one incumbent victory from the election results dataset.
Make a random draw of an estimated personal vote from the personal vote distribution in step one. Subtract this estimate from the vote share of the incumbent selected in step two.
Reallocate the subtracted votes from the incumbent to the challenger candidates in proportion to their share of the challenger vote—that is, the total vote received by candidates other than the incumbent.
Code the outcome as (1) if, after subtraction and reallocation, the runner-up’s vote share is higher than the incumbent’s vote share; otherwise code the outcome as (0). Thus, (1) indicates that the election outcome (an incumbent victory) would have been different (an incumbent loss) in the absence of the personal vote.
Repeat steps two through five 1,000 times, storing the 0 or 1 result from step five each time.
Calculate the mean value of the 1,000 draws to estimate the proportion of elections in which the outcome has changed as a result of the subtraction and reallocation of the personal vote.
Repeat steps two through seven 1,000 times, storing each estimate to create an overall distribution of the average proportion of election outcomes affected by the personal vote.
An example may help illustrate this simulation procedure. Let us assume that a personal vote effect of −10 percent was randomly drawn from the personal vote distribution and that we have randomly drawn an election result in which the incumbent “Jane” received 50 percent, the runner-up “Joe” received 40 percent, and a third candidate “Sally” received 10 percent. Subtracting the personal vote reduces incumbent Jane’s vote share to 40 percent. We then reallocate the personal vote to the challengers; since Joe received four fifths of the challenger vote, he receives four fifths of the reallocated vote share—eight percent—increasing his vote share to 48 percent. Since Joe’s vote share is now larger than Jane’s, the subtraction and reallocation process in this case has resulted in a changed outcome—an incumbent loss, rather than an incumbent victory and would therefore be entered as a (1). We repeat this procedure 1,000 times to generate a vector of 0s and 1s, which we then use to calculate the percentage of elections changed; assume for the sake of the example that the resulting overall percentage equals 19 percent. We then store that number, 19 percent, in a new vector and repeat the entire process 999 more times, adding each new overall percentage to the final vector to create a distribution of average changed election outcomes. The result of this procedure is a distribution of plausible estimates of the proportion of incumbent election outcomes affected by a personal vote of the size that we have estimated in our analysis above.
This first simulation assumes that the size of the personal vote varies randomly around a single mean value. However, given past findings in the literature, as well as our discussion of variation in the personal vote above, we undertake a second simulation which seeks to incorporate variation in the personal vote in relation to the competitiveness of the election. In our second simulation, we follow the same procedure as above, but instead of drawing from a single personal vote distribution, we use the estimates described in Figure 2 to create a distinct distribution for each of the thirty-nine increments of margin of victory for which the effect of the personal vote is statistically significant (that is, margins of victory of 0%–38%). We can then draw from those more specific distributions in our simulation to capture the variation we reported in Figure 2: variation in the size of the personal vote effect at varying levels of competitiveness. We provide more detail on the steps involved in this second simulation in the supplementary materials (SM11).
Figure 4 provides a visual summary of the distributions produced by the two simulations. The figure on the left, which does not account for the competitiveness of the race, ranges from 17 percent to 25 percent, with a mean value of 21 percent. Thus, the figure suggests that the personal vote is large enough to affect the outcome of about one in every five incumbent victories. However, this proportion is larger in the right-hand figure, which incorporates variation in the personal vote based on the competitiveness of the race; in that case, the distribution ranges from 23 percent to 32 percent, with a mean value of 27 percent. The right-hand plot thus suggests that once we take competitiveness into account, the personal vote is sufficiently large to affect the outcomes of just over one-quarter of incumbent victories.
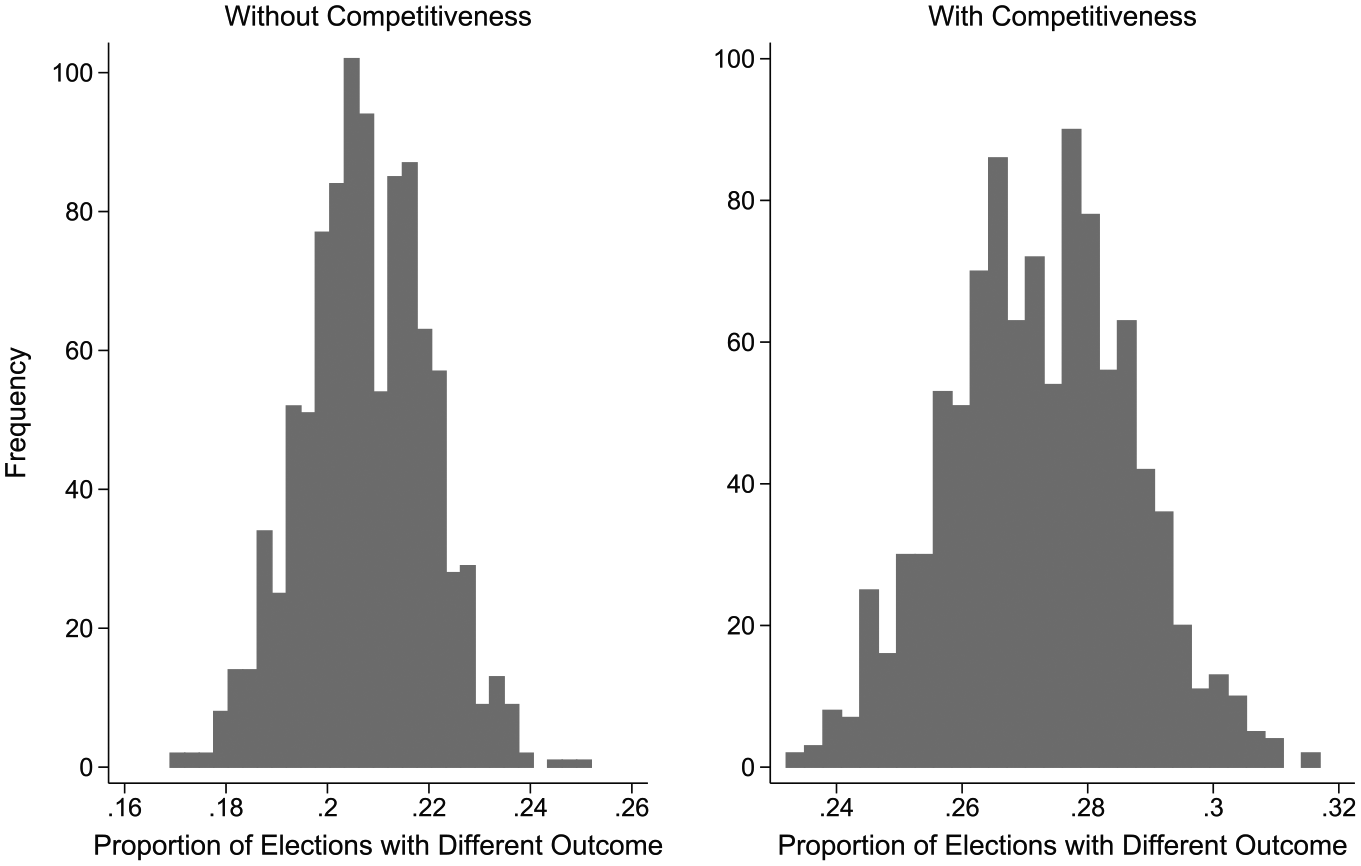
Simulating election outcomes without the personal vote.
It is important to be clear about the meaning of this simulation. Our intention is not to simulate what the world might look like in the absence of the personal vote; if the personal vote were somehow to disappear, many related aspects of non-partisan elections would change as well, such as challenger scare-off effects. Instead, our goal is more modest: to provide a data-informed picture of how much the personal vote is likely to shape election outcomes based on actual election results from the same city as the survey data discussed above. Our intention is thus to provide some sense of the size of the personal vote relative to the size of incumbent victories themselves. The results in Figure 4 suggest that the personal vote, while substantively large and important, accounts for a minority fraction of the overall success of incumbent candidates in Calgary.
Discussion and Conclusion
How important is the personal vote for incumbent success in non-partisan elections? Our analysis has used individual-level data rather than aggregate election results to provide a new, robust answer to this question. We leveraged a ward boundary revision process, in combination with an original survey, to estimate that the absence of the personal vote decreases the probability of incumbent support by about ten percentage points. This effect is more than double the size of personal vote estimates for the United States Congress, suggesting that non-partisan incumbents are indeed able to cultivate especially large personal votes. We also found, in keeping with past research, that the size of the personal vote effect varies substantially, peaking at 18 percent in highly competitive races and no longer statistically significant when incumbent margins of victory exceed 40 percent.
Our second survey, undertaken one year after the 2017 election, provided further confirmation of the importance and durability of the effects of the personal vote in non-partisan contests. Even after a full year, new voters—those with a new incumbent, rather than their former incumbent, as a result of the redistricting process—remained significantly less likely to be familiar with their councillors along a number of dimensions, including general knowledge and recognition, issue position, ideology, and performance. These findings demonstrate that the personal vote is distinct from an instantaneous incumbency cue and takes substantial time for politicians to cultivate.
Past studies of the incumbency advantage in municipal elections have found that incumbency causes an increase of 30 percent to 40 percent in the probability of re-election (Benedictis-Kessner 2017; Lucas 2019; Trounstine 2011; Warshaw 2019). Personal vote effects are typically theorized as comprising a portion of this incumbency advantage, alongside instantaneous incumbency cues and scare-off advantages (Fowler 2016, 2018). Our results suggest that this portion is not small: a personal vote effect of about ten percentage points would constitute something in the range of one-third to one-quarter of the overall incumbency advantage in city elections. Future research will clarify the role of other components of incumbency advantage in non-partisan city elections, allowing us to add more precision to our understanding of the relative contribution of each component to the overall incumbency advantage.
Those who celebrate the non-partisan character of elections in major cities such as Calgary might interpret these results as strong support for the view that non-partisan local politicians are distinctly “close to the people” and that especially high rates of incumbent success in non-partisan elections is principally a result of this personal connection. However, our simulations suggested that this interpretation is only part of the story. Even with a personal vote of the size that we estimate in Calgary, our simulations indicate that the personal vote is sufficiently large to plausibly affect the outcome of one in every four incumbent victories. Put simply, the personal vote appears to explain a substantial but minority fraction of incumbent success in non-partisan cities. The personal vote we have uncovered is, to be clear, a very large effect—but it is not large enough to be the “end of the story” for explaining local incumbency advantage.
Why would so large a personal vote affect the outcome of only a minority of non-partisan elections? We believe that the answer lies in the other ways that non-partisan elections affect both candidate and voter behavior. In the absence of political parties to recruit, encourage, and support high-quality challengers—and in some cases, to provide assurances that the candidate will have other opportunities should their electoral challenge fail—high-quality challengers are much less likely to volunteer to bear the costs of an uphill battle against an incumbent (Carson, Engstrom, and Roberts 2007). In the absence of these party motivations to run candidates of at least moderate quality in every race, incentives for strong challengers to face off against incumbents are minimal, and scare-off effects have the potential to be enormous.
Relatedly, the absence of partisan cues makes for a much more challenging information environment. Voters in large, non-partisan elections such as Calgary must work especially hard to learn about challenger candidates even when high-quality challengers are in the race. Past research in the United States has confirmed the consequences of this informational deficit on voter engagement, turnout, and incumbent support (Schaffner, Streb, and Wright 2001; Schaffner and Wright 2002), and the consequences are likely to be even more pronounced when elections are not just formally non-partisan (that is, parties are absent from the ballot), but, as in Calgary, the party affiliations of most candidates are unknown to voters. In these genuinely non-partisan elections, incumbency often looms large as the only easily accessible and high-quality informational cue available. This, too, has the potential to powerfully benefit incumbents.
Thus, while we have uncovered strong evidence that incumbents in non-partisan elections are able to cultivate an especially strong personal vote, this personal vote is not sufficiently large to assuage concerns about incumbent dominance and possible accountability deficits in non-partisan city elections. In the face of accumulating evidence that non-partisan city elections are much more than mere referenda on the managerial performance of incumbents and have important policy consequences for constituents (Benedictis-Kessner and Warshaw 2020), we see little reason to celebrate the extraordinary success rates of incumbent candidates in these elections.
Much work remains to be done. While the circumstances we have exploited in this paper are relatively rare—a redistricting process occurring simultaneously with individual-level data collection, along with an administrative environment allowing us to distinguish old voters from new voters without depending on respondents’ own recall—we expect that opportunities for replication and extension of our personal vote estimates will surely arise among the thousands of non-partisan elections that are contested across North American and European democracies. Additional work on the relationship between competitiveness and the personal vote would be particularly informative, helping to illuminate the mechanisms that connect the one to the other. Replications of our individual-level approach in other non-partisan and partisan contexts—across multiple levels and scales of electoral politics—would also strengthen and clarify the findings we have discussed here.
Additional research on the role of other components of incumbency advantage in non-partisan elections is also worth pursuing. Studies of incumbent name recognition and incumbency cues across election types (non-partisan vs. partisan, mayoral vs. council) and levels of government (local, regional, national) will help us more clearly distinguish between instantaneous cues and deeper personal vote connections; Fowler (2018) has recently provided a useful model for such work. Analysis of scare-off effects in non-partisan races is also vital, and requires careful thinking about the measurement of candidate quality in local and other non-partisan races. This research promises to improve our knowledge not only of incumbency advantage in non-partisan elections, but also to inform ongoing and increasingly important debates about the advantages and disadvantages of non-partisanship in an era of considerable skepticism about the value of political parties for democratic representation and accountability.
Supplemental Material
sj-pdf-1-prq-10.1177_1065912921990751 – Supplemental material for Closest to the People? Incumbency Advantage and the Personal Vote in Non-Partisan Elections
Supplemental material, sj-pdf-1-prq-10.1177_1065912921990751 for Closest to the People? Incumbency Advantage and the Personal Vote in Non-Partisan Elections by Jack Lucas, R. Michael McGregor and Kim-Lee Tuxhorn in Political Research Quarterly
Footnotes
Declaration of Conflicting Interests
The author(s) declared no potential conflicts of interest with respect to the research, authorship, and/or publication of this article.
Funding
The author(s) disclosed receipt of the following financial support for the research, authorship, and/or publication of this article: This research was supported by a SSHRC Insight Grant (435-2017-0993) and by the University of Calgary School of Public Policy.
Supplemental Material
Notes
References
Supplementary Material
Please find the following supplemental material available below.
For Open Access articles published under a Creative Commons License, all supplemental material carries the same license as the article it is associated with.
For non-Open Access articles published, all supplemental material carries a non-exclusive license, and permission requests for re-use of supplemental material or any part of supplemental material shall be sent directly to the copyright owner as specified in the copyright notice associated with the article.