
Abstract
Asking citizens “the way democracy works” is the basis of a wide literature on the support citizens have for their political institutions and is one of the most common survey items in political science. Moreover, it is a key indicator for the purported global decline in legitimacy. Yet, its trends, levels, and dynamics are still debated, and conclusions may be erroneous. In this paper, we compile a unique global dataset between 1973 and 2018 encompassing all major cross-national datasets and national election studies in twelve countries to study the dynamics and consistency of “satisfaction with democracy” (SWD) measures globally. Our results show that while trends and between-country differences in democratic satisfaction are largely similar, the levels of satisfaction vary substantially between survey projects, and both trends and levels vary significantly in several widely studied countries. We show that this has consequences at the individual level: opting for one survey over another may alter our conclusions about the relationship between key demographics and SWD. Thus, researchers studying SWD should endeavor to consult diverse survey sources and should be cautious about their conclusions when they do not, especially when it comes to making claims about changes in SWD over time.
Introduction
One of the most common measures of public opinion administered in social science surveys is “satisfaction with democracy” (SWD). This measure is widely used 1 within social science research as an indicator of political support and the political health of a democratic society (Aarts and Thomassen 2008; Anderson and Guillory 1997; Bernauer and Vatter 2012; Bol et al. 2018; Dassonneville and McAllister 2020; Grönlund and Setaïa 2007; Karp, Banducci, and Bowler 2003; Reher 2015; Zmerli, Newton, and Montero 2007). In media and popular discourse, a lack of satisfaction with political institutions and the elites which occupy them has been cited as a cause and consequence of the rise of challenger parties, the stupefaction of status quo institutions, and the catalyst of discrete events like the “Brexit” vote and Donald Trump’s presidency (Kaltwasser and Van Hauwaert 2020; Knot 2016; McCall 2020). In addition, this survey item forms the backbone of much of the debate on whether there is a “crisis of democracy” (or a “legitimacy crisis”) or merely a myth of one (Ercan and Gagnon 2014; Merkel 2014; van Ham et al. 2017). Despite this vast academic and public contestation, there is still considerable ambiguity about the validity of measures of public political support and how consistent they are across different survey programs. As a large body of empirical work relies on SWD measures either as explanatory or outcome variables, we set out to provide a foundation for understanding the comparability and validity of the SWD measure across different survey programs, time, and space.
We assemble a global dataset consisting of essentially all cross-national survey projects 2 that have administered this question as well as data from 135 national election study (NES) surveys conducted in eleven European countries and Australia. Unlike most previous research, which has primarily relied on single datasets or single waves within a dataset, we combine all these major cross-national studies and individual NES into one dataset consisting of over 6 million respondents interviewed in 3,213 surveys across 155 countries since 1948. 3 The SWD measure is included in 2,086 of these surveys, conducted in 1,615 country–years in 140 countries between 1973 and 2018.
Our primary contribution is to a long-standing methodological literature on the SWD measure (Ariely 2015; Ariely and Davidov 2011; Canache, Mondak, and Seligson 2001; Ferrin and Kriesi 2016; Lagos 2003; Linde and Ekman 2003; Quaranta 2018; Schedler and Sarsfield 2007; van Ham et al. 2017). This previous literature has implicitly tended to focus on whether the given measure(s) adequately capture the concept of interest (content validation; for example, Canache, Mondak, and Seligson 2001; Linde and Ekman 2003). Unlike this literature, we instead turn to the more practical question of how our empirical results about SWD depend on data choice. To put it in the nomenclature of validity, we focus on convergent and construct validity of different measures of SWD—in this case, survey questions from different social science research projects, often formulated in different ways. In addition, most previous methodological research has relied on a single dataset or wave within a dataset, whereas we use most major datasets available. We build on this previous research by including a much wider variety of data sources and systematically examining the relationships between those sources, differentiating between survey programs, and studying the consequences for individual-level inference. Overall, we provide a valuable methodological contribution to the literature by bringing to the fore discrepancies across datasets, examining when and where we can use this measure.
Focusing first on convergent validity—that scores from alternative measures are empirically associated (Adcock and Collier 2001)—our findings indicate that trends and between-country differences are largely consistent between survey projects, but the levels of SWD within a country tend to differ substantially depending on which data source one uses. Furthermore, while the trends are similar in most countries, they are substantially different in several important countries. Second, we turn to construct validity—that we should expect associations with other variables to consistently align with theoretical expectations. Our analyses of the effects of a range of demographic variables on SWD in the same country and year yield differing results depending on survey, albeit not usually in different directions. These differences may be due to various factors such as survey mode, timing of fieldwork, precise question wording, and response scales. While we outline some of these differences here, a systematic comparison of these different potential explanations is beyond the scope of this paper. We aim to provide the first step toward those explanations by establishing if, where, and when there are substantive differences in the SWD measure between surveys and how critical these may be for existing research.
These findings also inform the substantive literature on global trends in SWD. Recent decades have seen recurring and arguably growing debates in academia about whether we are (or have been) experiencing a legitimacy crisis, a “crisis of democracy,” or merely a myth of one (Dryzek et al. 2019; Ercan and Gagnon 2014; van der Meer 2017; van Ham et al. 2017). We do not aim to settle these debates or test in any definitive way the latent trends of SWD, but our methodological findings about (in)consistencies in the trends of SWD inform that debate and should be taken into account in future research. This question could hardly be more important normatively and empirically. Democratic satisfaction, it is argued, concerns “the way the national democratic system works and whether it enjoys the support of its citizens” (Armingeon and Guthmann 2014, 429; Linde and Ekman 2003). Declining support for the performance of democracy might signify more fundamental threats to the health and sustainability of democratic societies (Fieldhouse, Tranmer, and Russell 2007; Hay 2007; Martin 2015). Understanding whether the trends and dynamics of SWD measures point to a legitimacy crisis for modern democracy is therefore fundamental for our field.
The paper is structured as follows. In the next section, we review existing literature which this paper contributes to, and in the third section, we discuss our data and methods. The remainder of the paper is spent exploring cross-national trends across the datasets and their consistency, as well as exploring whether using different data sources leads to different substantive conclusions.
Existing Literature
Numerous survey projects and political science studies employ measures of SWD, but substantial ambiguities about the consistency and substantive relevance of these measures remain. Seminal and widely cited texts in political science utilize the measure (Crozier, Huntington, and Watanuki 1975; Dalton 2004; Newton 2014; Norris 2011), and more recent book-length treatments have applied sophisticated quantitative methods to increasingly large amounts of data (Ferrin and Kriesi 2016; Martini and Quaranta 2020; van Ham et al. 2017; Vowles and Xezonakis 2016; see also Foa et al. 2020). However, most of these studies rely on a single survey project; to our knowledge, only two of these use data from multiple survey projects (Foa et al. 2020; van Ham et al. 2017). Although there is less “ambiguity and contradiction” now than when Canache, Mondak, and Seligson (2001, 510) provided their analysis of the meaning of the SWD measure, there is still confusion over the different trends and levels reported between different survey projects, regions, and time periods (see also Linde and Ekman 2003). Our central point of departure is that relying on one measure may have consequences for substantive inferences, and thus we set out to test the comparability and validity of these different measures.
Although it is not common for existing research to specifically frame their analyses in the nomenclature of validity, it is implicit in much of it. In political science, discussion of validity generally follows Adcock and Collier (2001), who set out a standard of measurement validation. They describe three types of validation: content validation, whether a measure captures a concept; convergent/discriminant validation, whether scores produced by different measurements are empirically associated; and construct validation, whether the measures fit well-established relationships.
The majority of methodological studies, to our knowledge, focus on content validation: the ambiguous nature of how survey measures of democratic satisfaction tap the underlying concept they are intended to measure. For instance, Linde and Ekman (2003) highlight how SWD can variously been treated as an indicator of satisfaction with the practical working of democracy or as support for democratic principles (arguing for the former understanding). Similarly, Ferrin and Kriesi (2016) show how different elements and conceptions of democracy drive the SWD measure in the European Social Survey (ESS). Ariely (2015) takes a different approach and studies both the meaning respondents attribute to democracy and how the measure is related to important democratic institutions. Thus, these studies shed light on the content validity of SWD measures as well as some aspects of their construct validity, while largely leaving convergent validity unexplored. We list some of the methodological contributions to the SWD literature in Table 1.
Methodological Contributions to the Satisfaction with Democracy Literature.
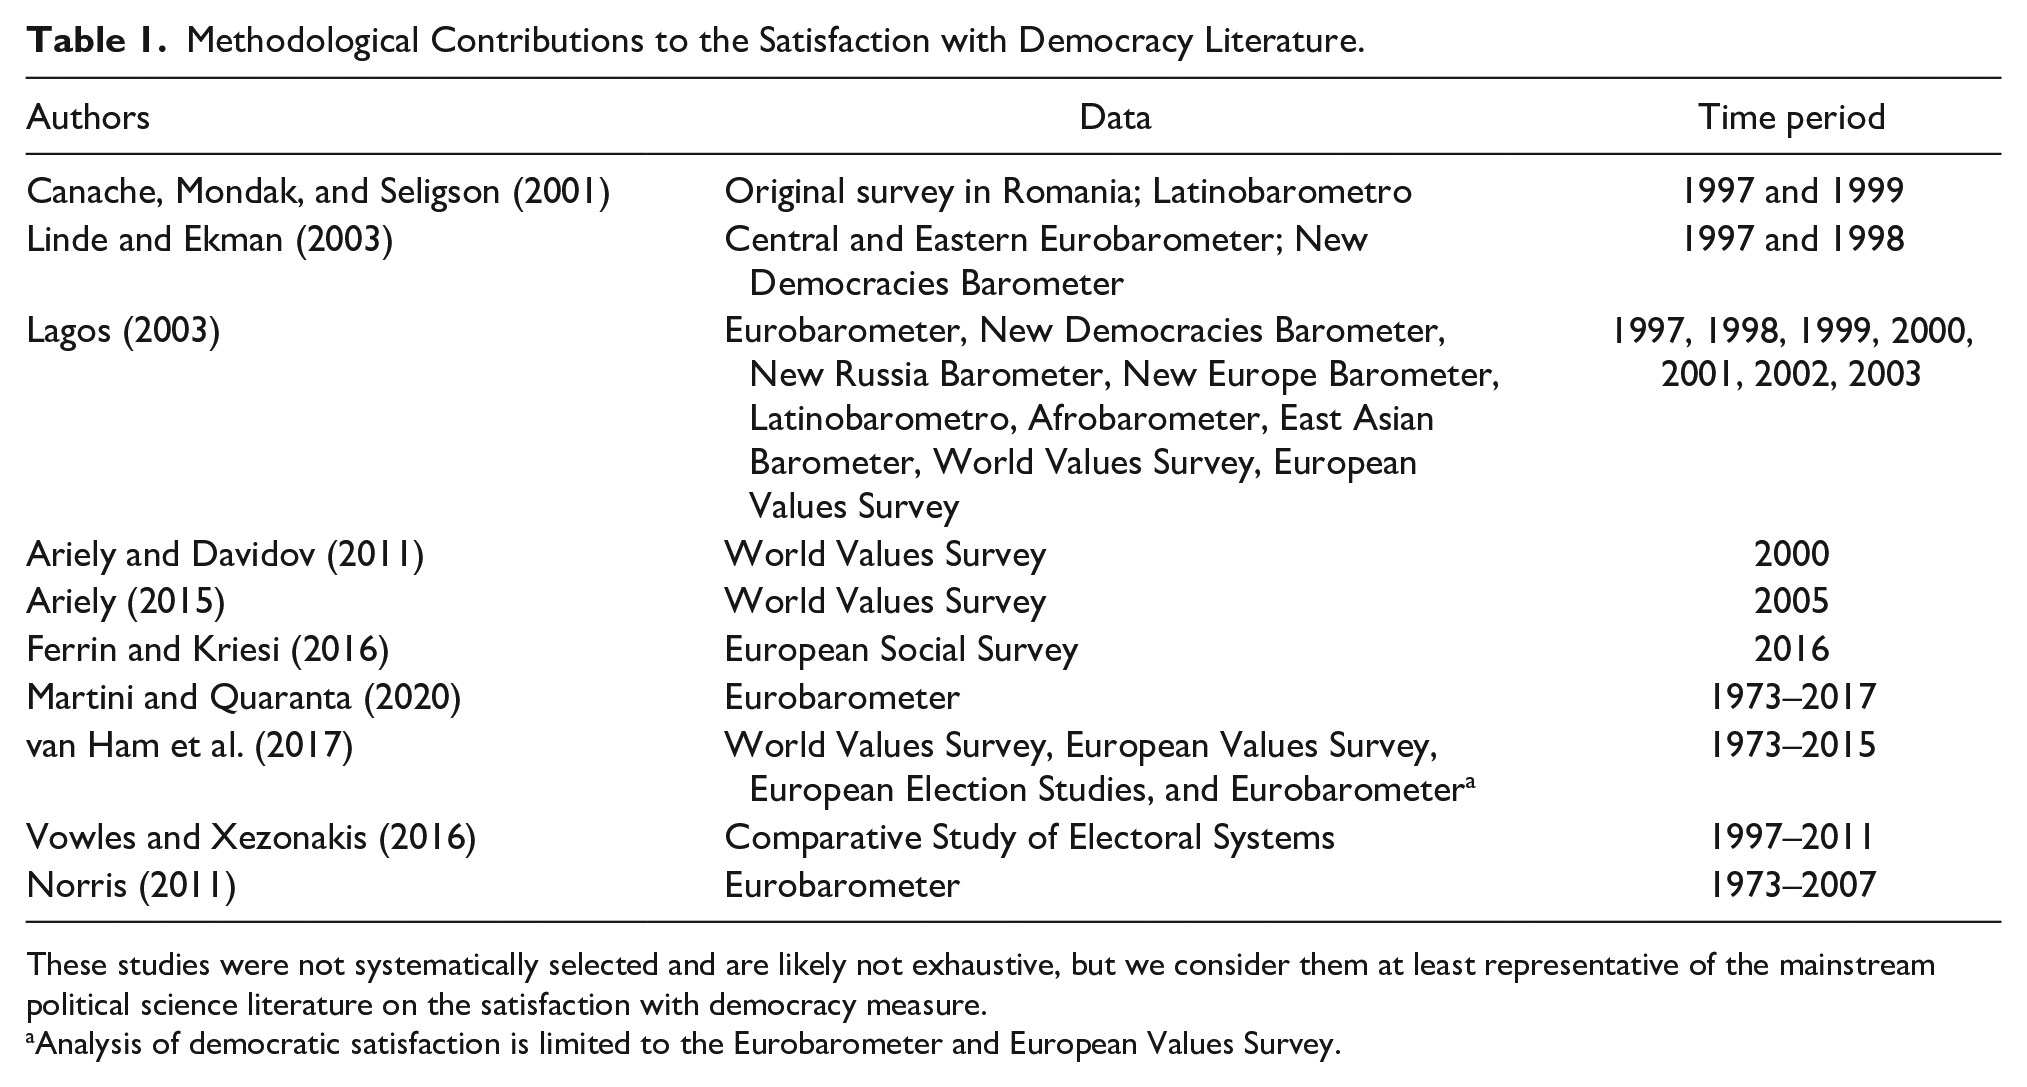
These studies were not systematically selected and are likely not exhaustive, but we consider them at least representative of the mainstream political science literature on the satisfaction with democracy measure.
Analysis of democratic satisfaction is limited to the Eurobarometer and European Values Survey.
In addition to focusing on content validation, the table also indicates that the vast majority of existing methodological studies rely on single datasets, often of limited time periods. An exception to this is Claassen’s (2020) study of support for democracy as a regime, which does include SWD measures in additional analysis and supplementary materials, but the focus of that study is on the former variable. The other main exception harnesses a lot of data, but their exploration of SWD uses only the Eurobarometer (EB) and European Values Survey (van Ham et al. 2017). On the contrary, while Lagos (2003) uses many sources, these are cross-sectional, from different time periods, and cover just seven years between 1997 and 2003. As noted, one of the major contributions to the methodological literature on SWD uses the 2016 wave of the ESS to explore how people understand the SWD measure (Ferrin and Kriesi 2016). In this study, we take a step forward in terms of the empirical scope of the study of satisfaction with the workings of democracy in our field.
The most recent contribution to the literature in this vein is a report by Foa et al. (2020) widely reported in the media (McCall 2020; Mounk and Foa 2020; Olusoga 2020; Scialom 2020). The report used more extensive data than any of the contributions listed above, and argue that across the globe, SWD has been declining. The report is an important substantive contribution and represents an impressive empirical achievement. The reason we do not consider this a methodological contribution is that it does not explicitly address validity or comparability concerns, and many of the issues we highlight here apply: their main findings are based on country–year averages of all survey data over time. While they do account for sampling bias resulting from differential country inclusion, there is no indication that they account for bias resulting from differential survey inclusion in each year. This raises concern because many of the surveys they include in their analysis are only included in a few recent years and not equally across all countries (see Foa et al. 2020, 6), and they do not examine trends separated by survey source. Therefore, their substantive results might be influenced by differential survey inclusion and influenced by the comparability and validity concerns we discuss in this paper.
In contrast, the present study aims to understand the convergent and construct validity of SWD as a measure by comparing measures of the concept from different survey projects. To meet convergent validity, different formulations of the SWD measure administered by different research projects should be empirically associated. To meet construct validity, the association of these different measures to other basic survey measures should be consistent between projects or measures. In other words, what we intend to do is understand, first, to what extent the different measures of SWD are related and therefore how comparable they are; and second, whether expected relationships are the same across different survey programs. This endeavor broadly follows Lagos (2003) who compares different cross-sectional measures of SWD to conclude that “we realize the importance and the difficulties of comparability” of SWD, a conclusion we echo seventeen years later, using a dataset hundreds of times larger.
Ambiguities about the comparability and validity of SWD measures raise questions for studies of the broader and normatively crucial debate about developments in democratic satisfaction. One of the most prominent types of debates in our field revolves around if and how citizens’ democratic attitudes and behaviors have been changing systematically in recent decades. Notions of a “crisis of democracy” in established democracies have been prevalent since at least 1975 (Crozier, Huntington, and Watanuki 1975; Dryzek et al. 2019; Ercan and Gagnon 2014; Merkel 2014), while others have disputed any clear or uniform trend of decline in political support (Hibbing and Theiss-Morse 2002; Newton 2014; Norris 2011). Norris (2011) argues for trendless fluctuations and persistent country differences, while van Ham et al. (2017) and Martini and Quaranta (2020) used data from the EB to conclude that SWD had in fact been increasing across established democracies, an opposite conclusion to the Foa et al. (2020) report discussed.
Our starting position is to take these studies at face value and ask whether these different conclusions are merely the product of different data sources. Therefore, while our focus is on the methodological concerns already highlighted, we complement the literature with an empirical examination of the descriptive global trends in SWD suggested by different survey projects and the substantive implications of these differences for the “crisis of democracy” debate. Previous methodological literature focusing on the conceptual aspects of the measure has usually relied on a relatively limited data range. Those that are indeed interested in trends have often relied on data from only one or two survey projects, with the exception of Foa et al. (2020) noted above, which does not take into account potential issues with differential survey source inclusion over time. Here, we aim to analyze the consistency of SWD measures between different data sources, while also shedding a light on the debate about trends in SWD and providing a guide for caution in future research utilizing the measure.
Data and Method
The analysis of this study brings together a vast amount of data from different sources, countries, and years that contain measures of SWD. We have assembled a global dataset that consists of the great majority of available data from cross-national surveys that have administered the SWD measure: all EB waves from 1970 to 2018, 4 the Latinobarometro from 1995 to 2018, the Afrobarometer from 1999 to 2018, the Asian Barometer Survey from 2001 to 2019, and the Latin American Public Opinion Project (LAPOP) AmericasBarometer from 2004 to 2019; all waves of the Comparative Study of Electoral Systems (CSES) and, uniquely, data from 135 NES surveys conducted in Australia, the United Kingdom, Ireland, Germany, France, The Netherlands, Belgium, Denmark, Finland, Sweden, Norway, and Iceland 5 ; all waves of the ESS; all waves of the World Values Survey (WVS) and the European Values Study (EVS); and the two “Citizenship” waves of the International Social Survey Program (ISSP) which include the SWD measure. 6
This results in a combined dataset consisting of over 6 million respondents interviewed in 3,213 surveys across 155 countries since 1948; the SWD measure is included in 2,086 of these surveys, conducted in 1,615 country–years in 140 countries between 1973 and 2018, and valid for 3,106,989 respondents. When aggregated by survey project, country, and year, this results in 2,086 country–year–study observations for SWD across the globe. The vast majority of academic research uses one of these survey programs.
While most surveys administering the SWD measure ask respondents how satisfied they are with “how democracy works in [their country],” there are some variations in this wording and the response options; these are by no means uniform between studies, countries, and years. In fact, this is one of the concerns motivating this study and a potential source of differences in the measure between survey projects. We note the following differences in wording (Table 2).
Question Wording of SWD Measures.
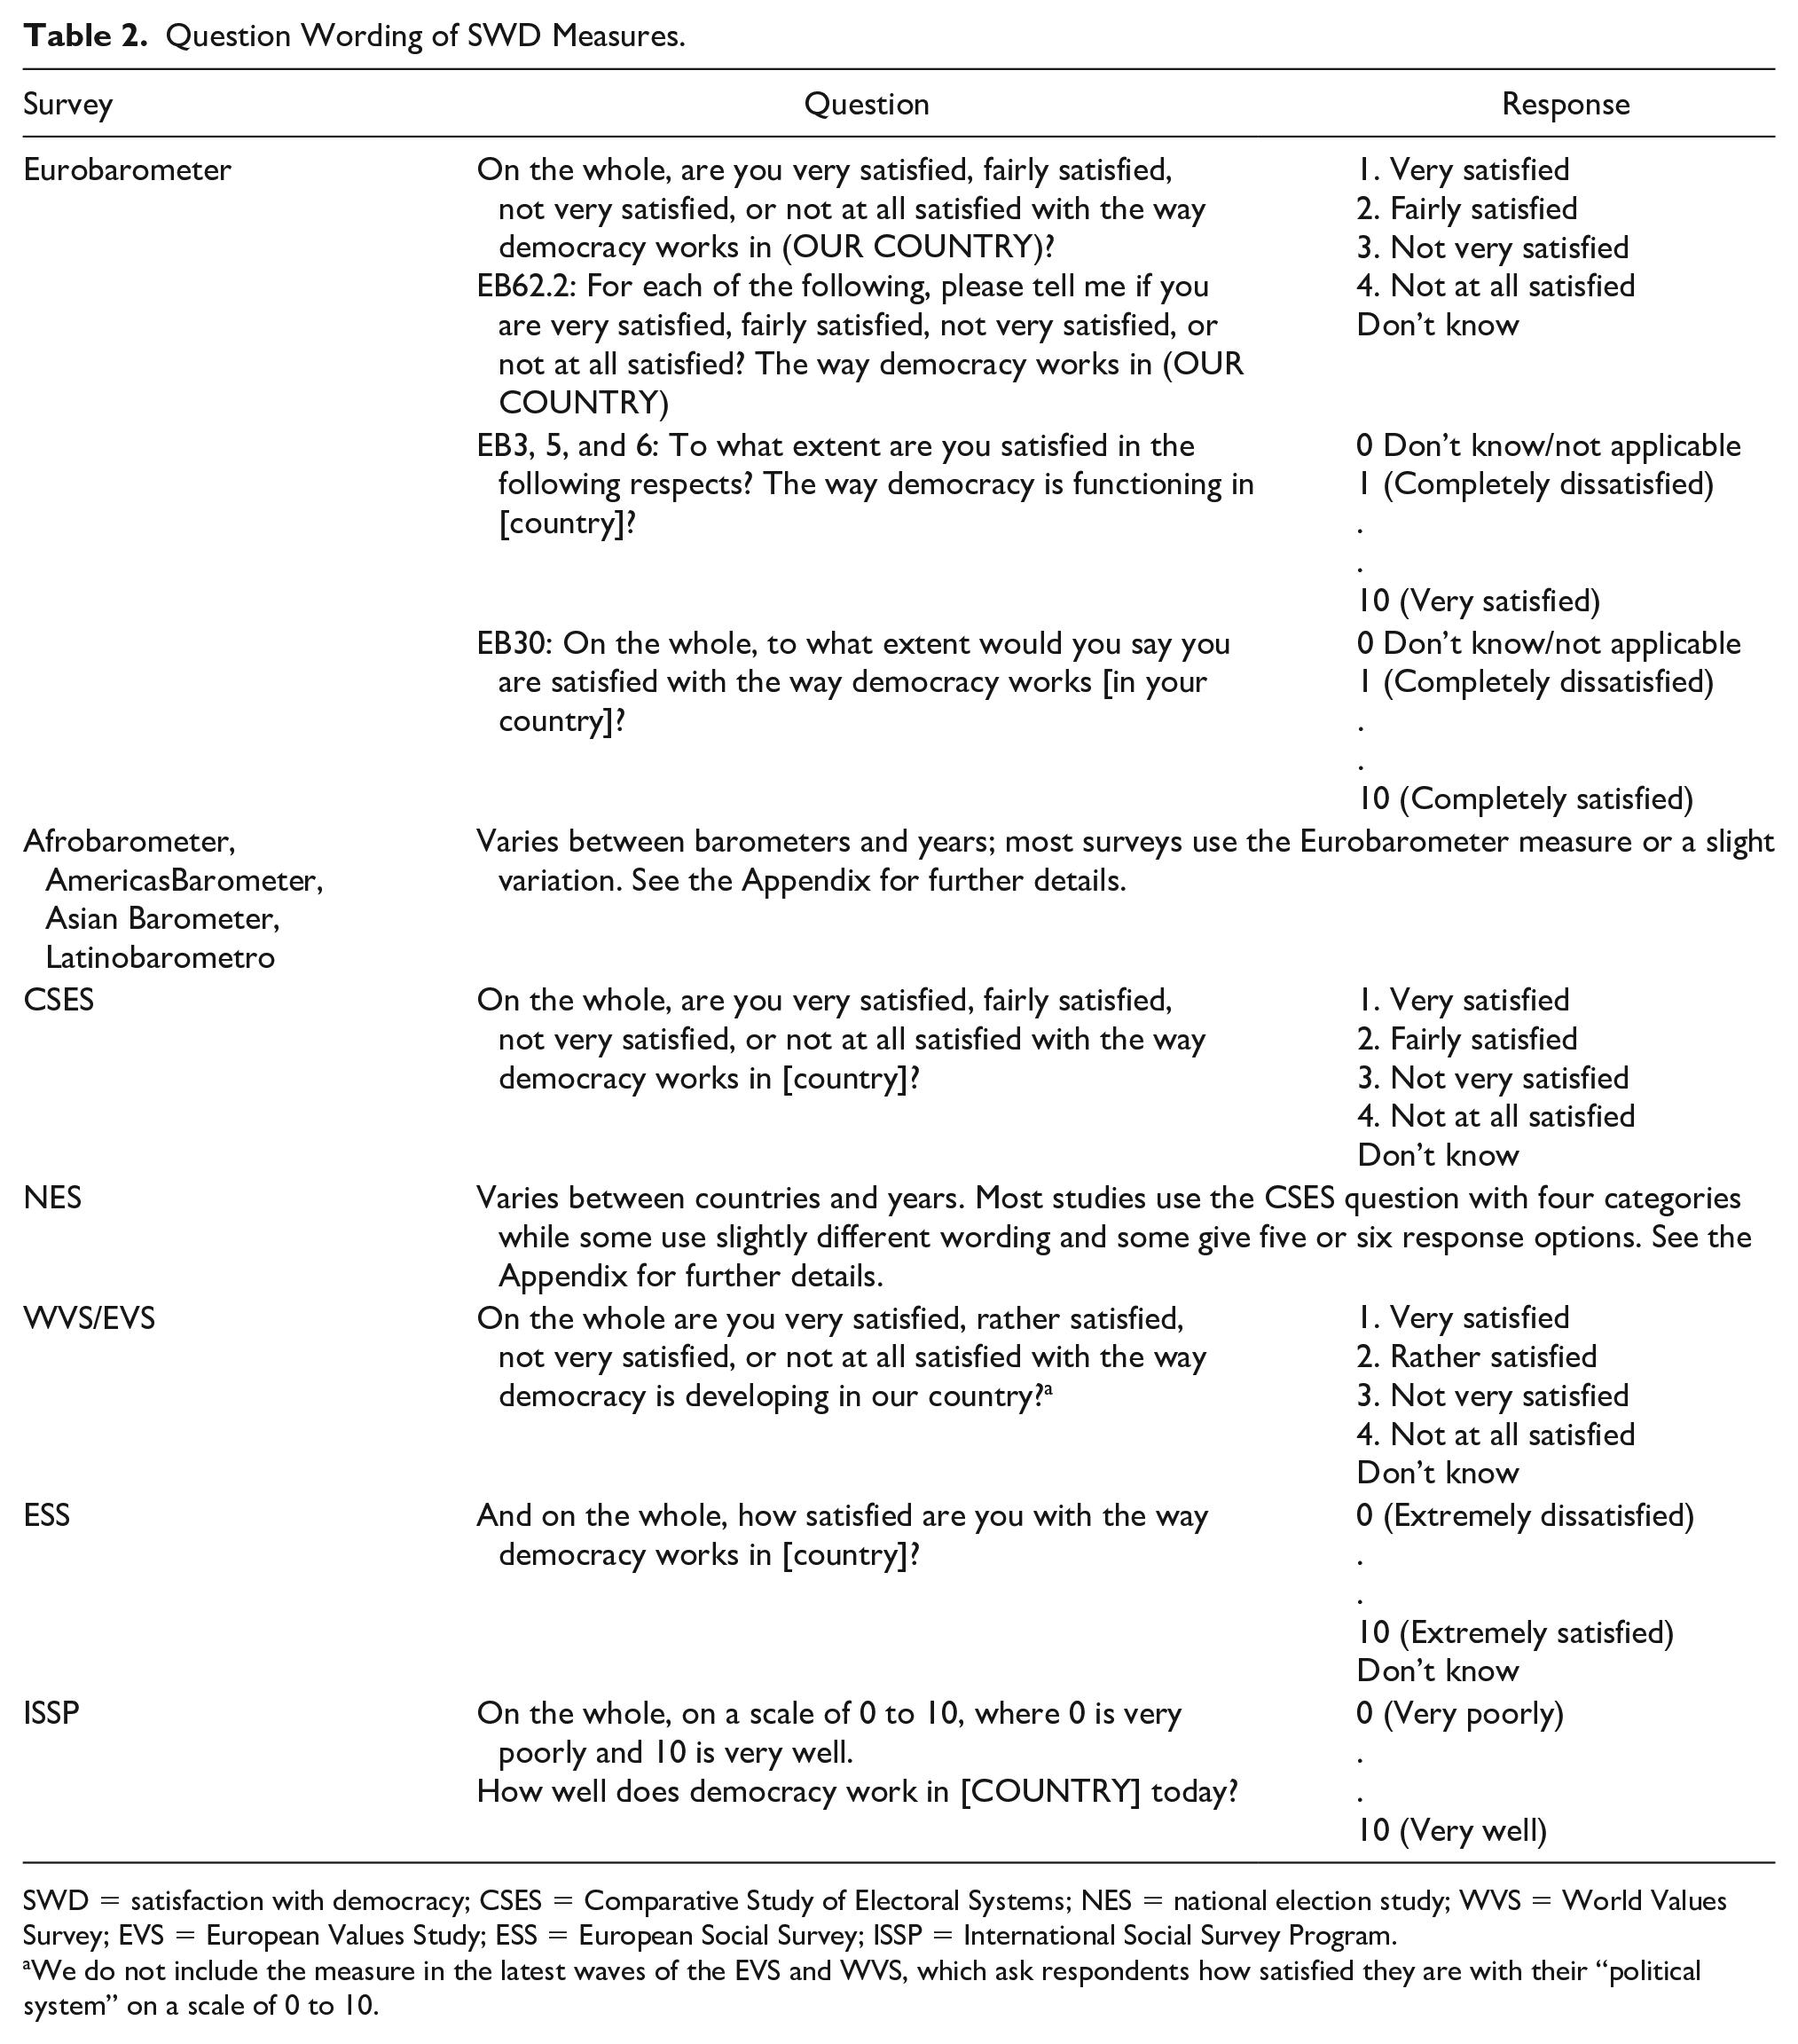
SWD = satisfaction with democracy; CSES = Comparative Study of Electoral Systems; NES = national election study; WVS = World Values Survey; EVS = European Values Study; ESS = European Social Survey; ISSP = International Social Survey Program.
We do not include the measure in the latest waves of the EVS and WVS, which ask respondents how satisfied they are with their “political system” on a scale of 0 to 10.
In the merged dataset, we create a binary variable from all these different variables; 0 indicates dissatisfaction with democracy and 1 equals satisfaction: those who say they are “very” or “fairly/rather” satisfied with democracy or who choose the upper end of a scale are coded as satisfied, whereas those who choose “not very” or “not at all” satisfied or the lower half of a scale are coded as dissatisfied. Those who chose a midpoint in a scale where it is available—for instance, in an eleven-point scale or a five-point worded scale—are coded as missing on this variable. 7 While we recognize that this is a fairly crude amalgamation of different measurements and we should expect some differences to arise from the different question wordings and response options detailed above, the point of this analysis is precisely to investigate that expectation: to what extent SWD measures from different surveys can be treated indiscriminately and comparatively, as is often the case in the prior studies discussed. Furthermore, this dichotomization conveys the intuitive information that any respondents coded as 1 on this variable have chosen an option that indicates SWD; while some nuanced differences between different measures are to be expected, differences in this basic binary evaluation should be of concern.
We conduct our analysis in two stages. The first stage is focused on descriptive trends and differences between aggregated measures of SWD between survey projects. We start by presenting descriptive trends of the proportion of satisfied respondents in each country–year from different survey projects. We first look at countries outside of Europe for which SWD measures are patchily available, and then focus in on selected, established European democracies for which those measures are much more widely available: the United Kingdom, Ireland, France, Germany, Belgium, The Netherlands, Austria, the Czech Republic, Portugal, Greece, Spain, Italy, Denmark, Finland, Sweden, and Norway. Aside from being the subject of a great deal of political science research, these countries generally have by far the most available SWD measures from different survey projects: around 70 percent of the country–year–study observations in the aggregate dataset are from the group of current (as of September 2019) European Union countries, largely due to the prevalence of EB data (42.1% of those observations are from that project).
For this dominant group of country observations in the dataset, we graph trends of the standard deviation between different studies within the same country in each year. This quantifies the extent to which the SWD measures from different projects provide (in)consistent levels in a given time and place and whether this consistency is different between countries or has changed over time. We then proceed to statistically compare these aggregated measures in the entire global dataset: first with pairwise correlations in all country–years where an SWD measure has been fielded by more than one survey project, and then multi-level regression models to determine whether reported levels or trends in SWD are systematically different between survey projects.
The second stage of the analysis turns to asking whether survey choice affects inferences at the individual level. We do so by identifying country–years in which multiple survey projects are fielded and running identical models within each program, allowing us to compare whether the coefficients are statistically different and lead to different substantive conclusions. We compare coefficients on sex, education, and age, because these are common in almost all surveys and analyses of democratic satisfaction.
SWD across Different Survey Projects
SWD: Country-Level Trends between Surveys
We start our analysis by presenting descriptive trends of SWD in six large countries around the world, separated by dataset. As there are 140 countries included in our data, space does not allow us to present trends for all of them, but below we focus on sixteen European countries and in the Appendix we present trends for fifty-two additional countries. Figure 1 presents the aggregate SWD values for six large countries outside Europe that have data from different survey projects over time. 8 Levels of satisfaction appear relatively stable in Australia over time and between surveys, although data from the Australian National Election Study indicate a recent decline in satisfaction. Data for the United States are almost exclusively available from the CSES and indicate relative stability over time, although there are also indications of a recent decline. The data from Japan are difficult to interpret, but the Asian Barometer data seem to suggest increasing satisfaction, while the data from South Africa indicate a recent decline and the same is true for data from the Latinobarometro and the LAPOP AmericasBarometer in Brazil; on the contrary, all of the available survey projects indicate a consistent rise in SWD in Russia.
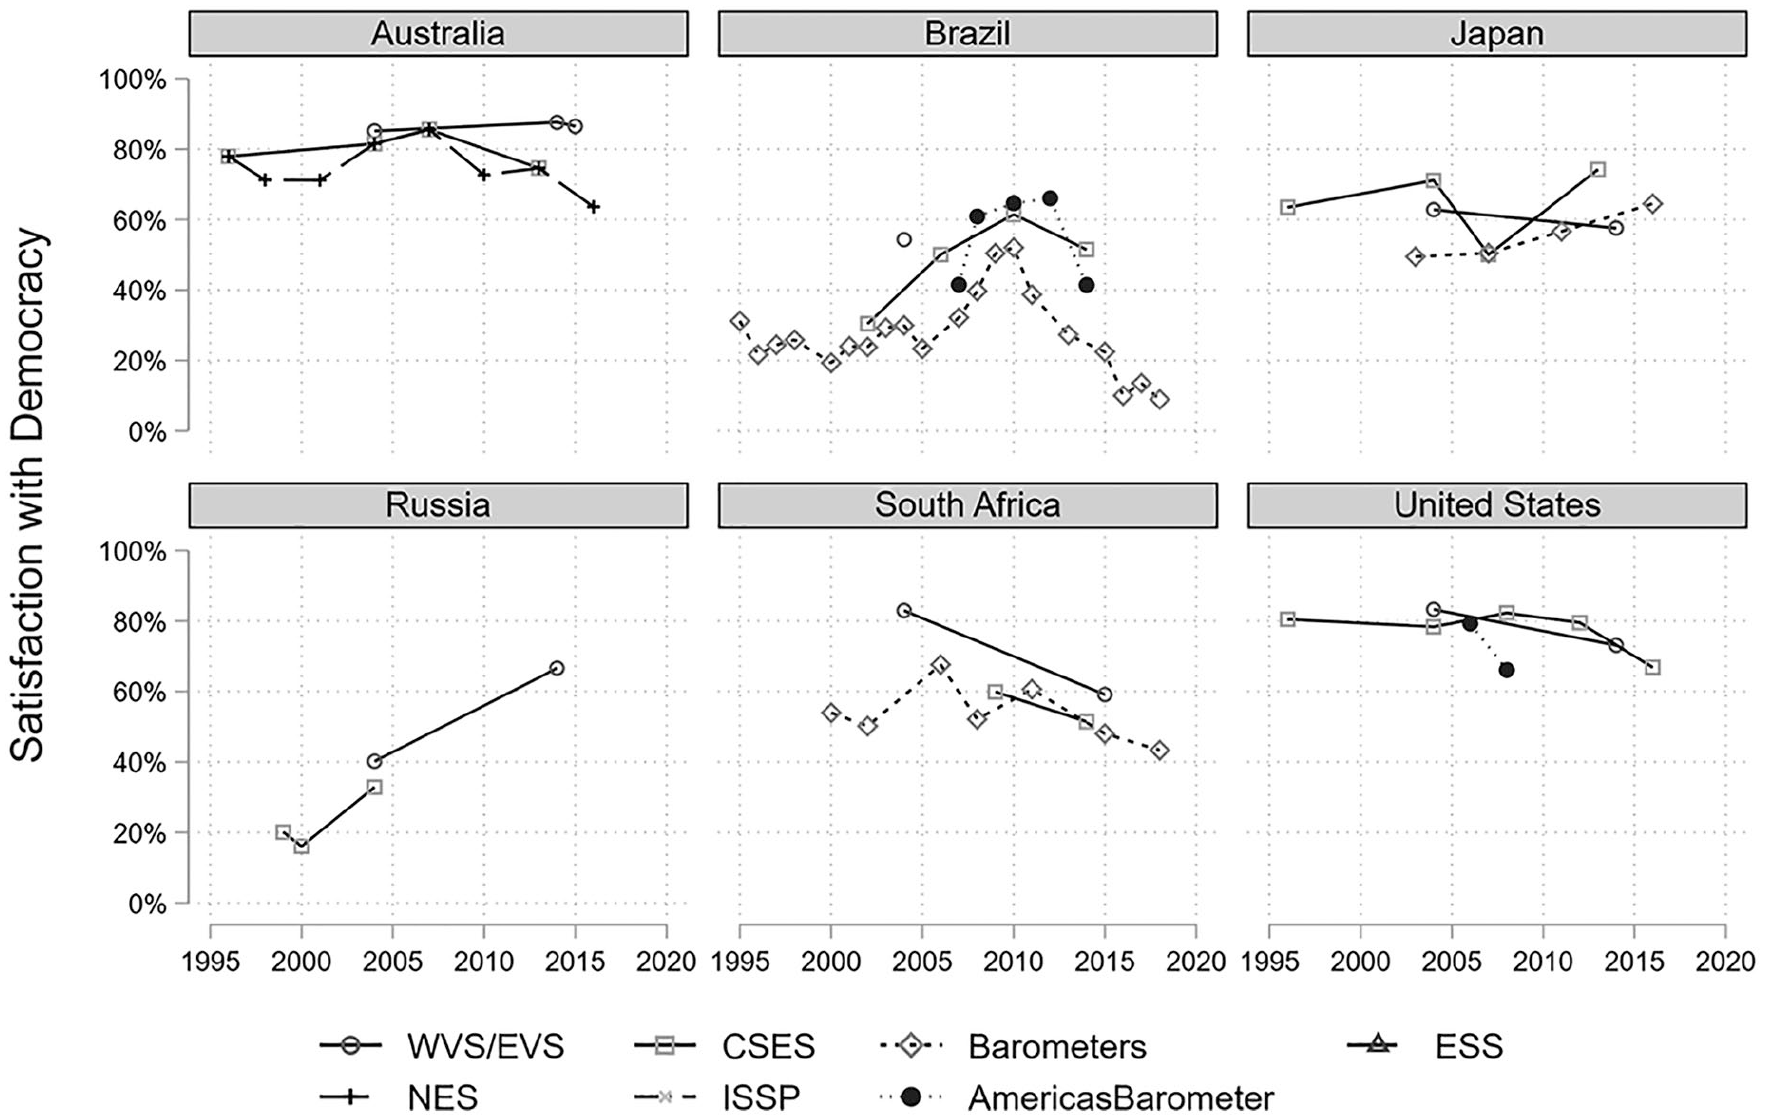
Trends in satisfaction with democracy in selected countries, separated by data source.
In these countries, we can see that the general patterns of country differences and trends appear to be fairly consistent between survey projects. We can also see important differences in levels between survey projects, especially in Russia and Japan. For instance, in Russia, the difference between the EVS and ESS in the years between 2005 and 2010 is approximately 10 percentage points, even though they trend in the same direction, and the ISSP in 2014 reports much higher levels than the other survey projects. Visual inspection of these trends in other countries, presented in the Appendix, suggests similar patterns. The LAPOP AmericasBarometer appears to generally report higher levels of SWD in many Latin American countries than the Latinobarometro, and the ISSP reports much higher levels of SWD in Israel than the CSES does.
SWD measures are by far most widely available in European countries, and in Figure 2, we turn to the trends in sixteen of these countries for which there is most ample data. These indicate that there is a large degree of consistency between the different survey projects when it comes to the comparative levels of SWD between countries. Despite some variation, the trends in SWD are also largely consistent in most countries, despite different survey modes and sampling procedures. In the relatively few countries where different projects appear to agree on trends, SWD appears to be rising in Denmark, Finland, Sweden, Norway, Switzerland, Germany, and the Netherlands but decreasing in Greece, Spain, and perhaps Portugal (though the latter two appear to be bouncing back from the 2008 economic crisis). However, most countries appear to exhibit trendless fluctuations, whereas many show important but non-linear trends: included in the Appendix, countries such as Brazil, Portugal, Uruguay, Venezuela, Colombia, and several African countries appear to show both clear increases and clear decreases of SWD within the same country at different periods in recent decades. 9
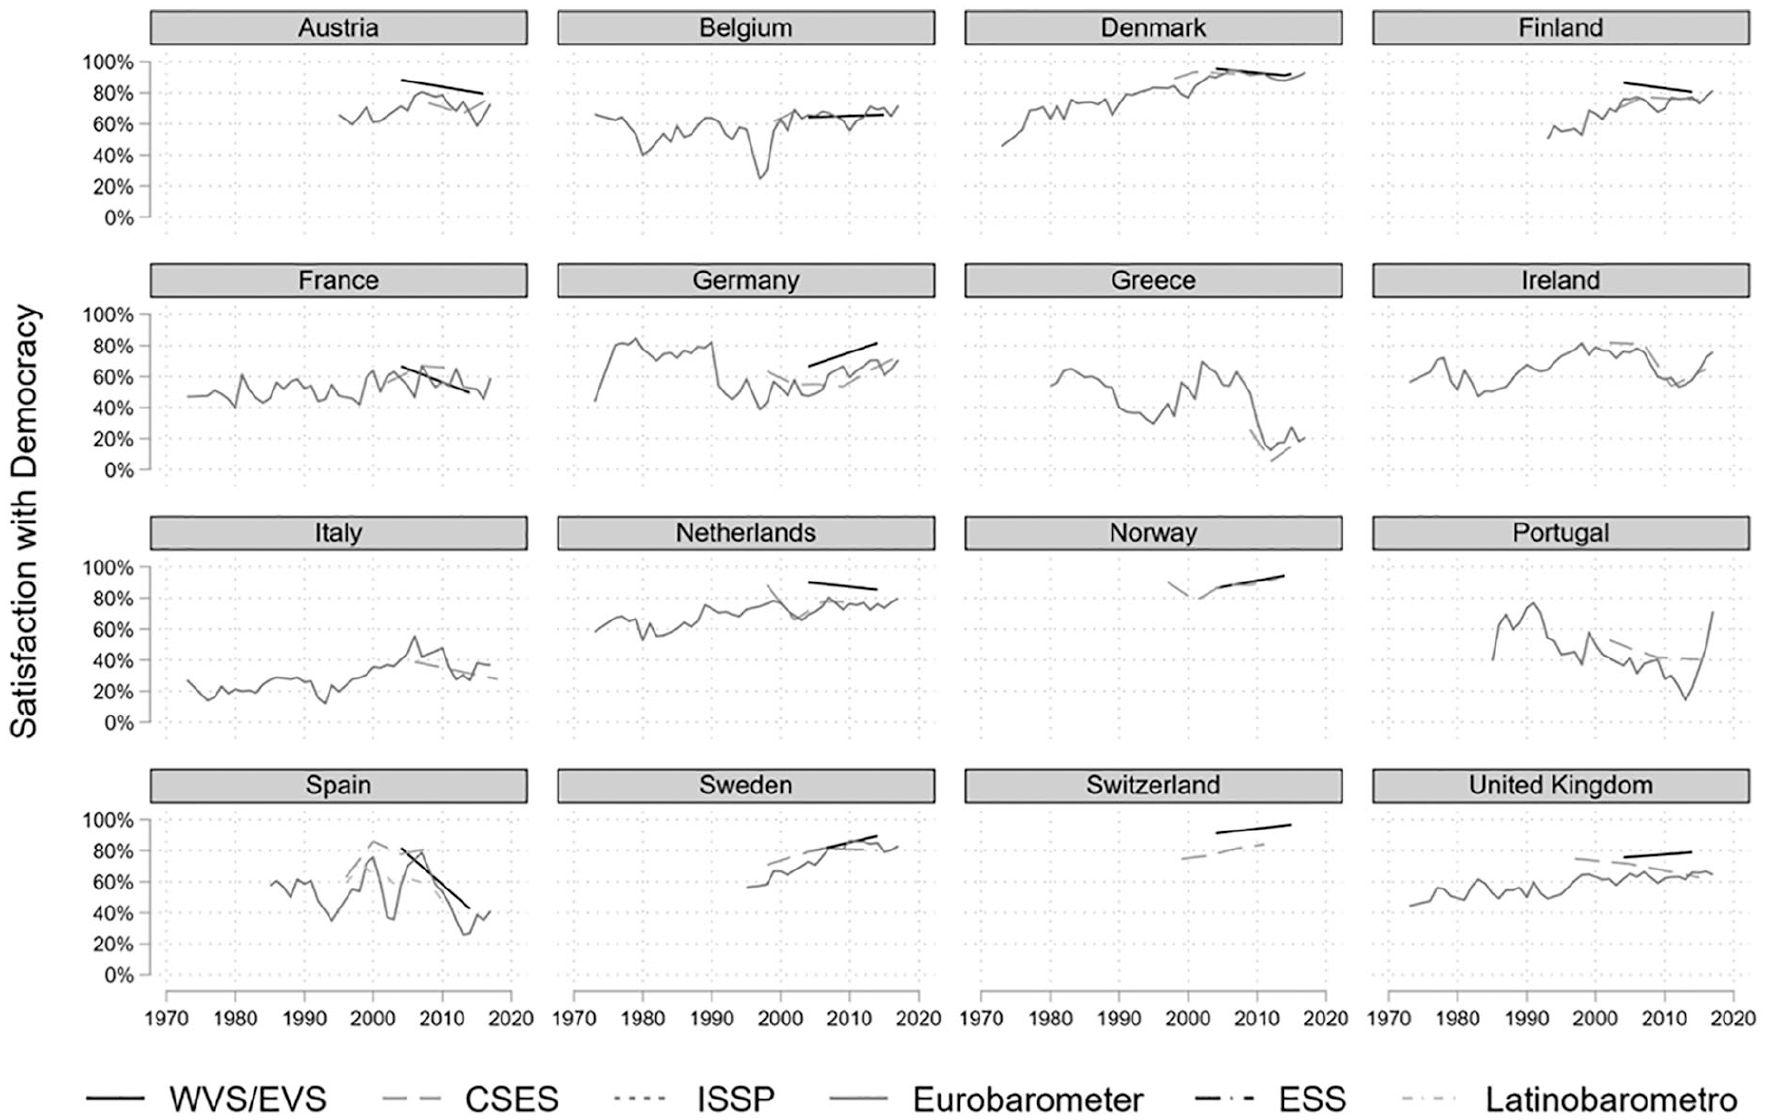
Trends in satisfaction with democracy in sixteen European countries, compared between different survey projects.
Whereas SWD measures from different survey projects appear largely consistent in most countries, there are several important exceptions: in the United Kingdom, Ireland, Italy, Austria, Spain, and Portugal, there are fairly large inconsistencies between different data sources. 10 In Austria, the eleven-point ISSP and EVS measures stand out; in Spain, the different projects appear to be in agreement on satisfaction having plummeted around the time of the financial crash. In Italy, the ESS measure (which employs an eleven-point scale) stands out with considerably higher levels of satisfaction, and in the United Kingdom, there is a sharp drop in the EVS between 2008 and 2009; this appears to be an interesting result of the fact that some of the interviews in the fourth EVS wave (N = 424) were conducted in 2008 but most of them (N = 1,431) in 2009, during a time of economic crisis and political turmoil. Regardless, there are considerable overall differences in both the United Kingdom and France between virtually all survey projects in the period, although there are indications that these have become more consistent in recent years.
In Figure 3, we quantify these differences between surveys by calculating and graphing the standard deviations of the aggregate values in each country–year. We see that in most of these sixteen countries, the differences between surveys are relatively stable (or even declining) and rarely exceed 0.1 standard deviations. Nevertheless, there are several country–years in which they are substantial. Perhaps most notably, there are curious spikes in inconsistencies in the United Kingdom and Spain in the 2000s, and in Austria, France, and Italy in recent years. The bit of comfort the field can take from this, however, is that these differences appear to be declining over time in almost all countries we analyze.
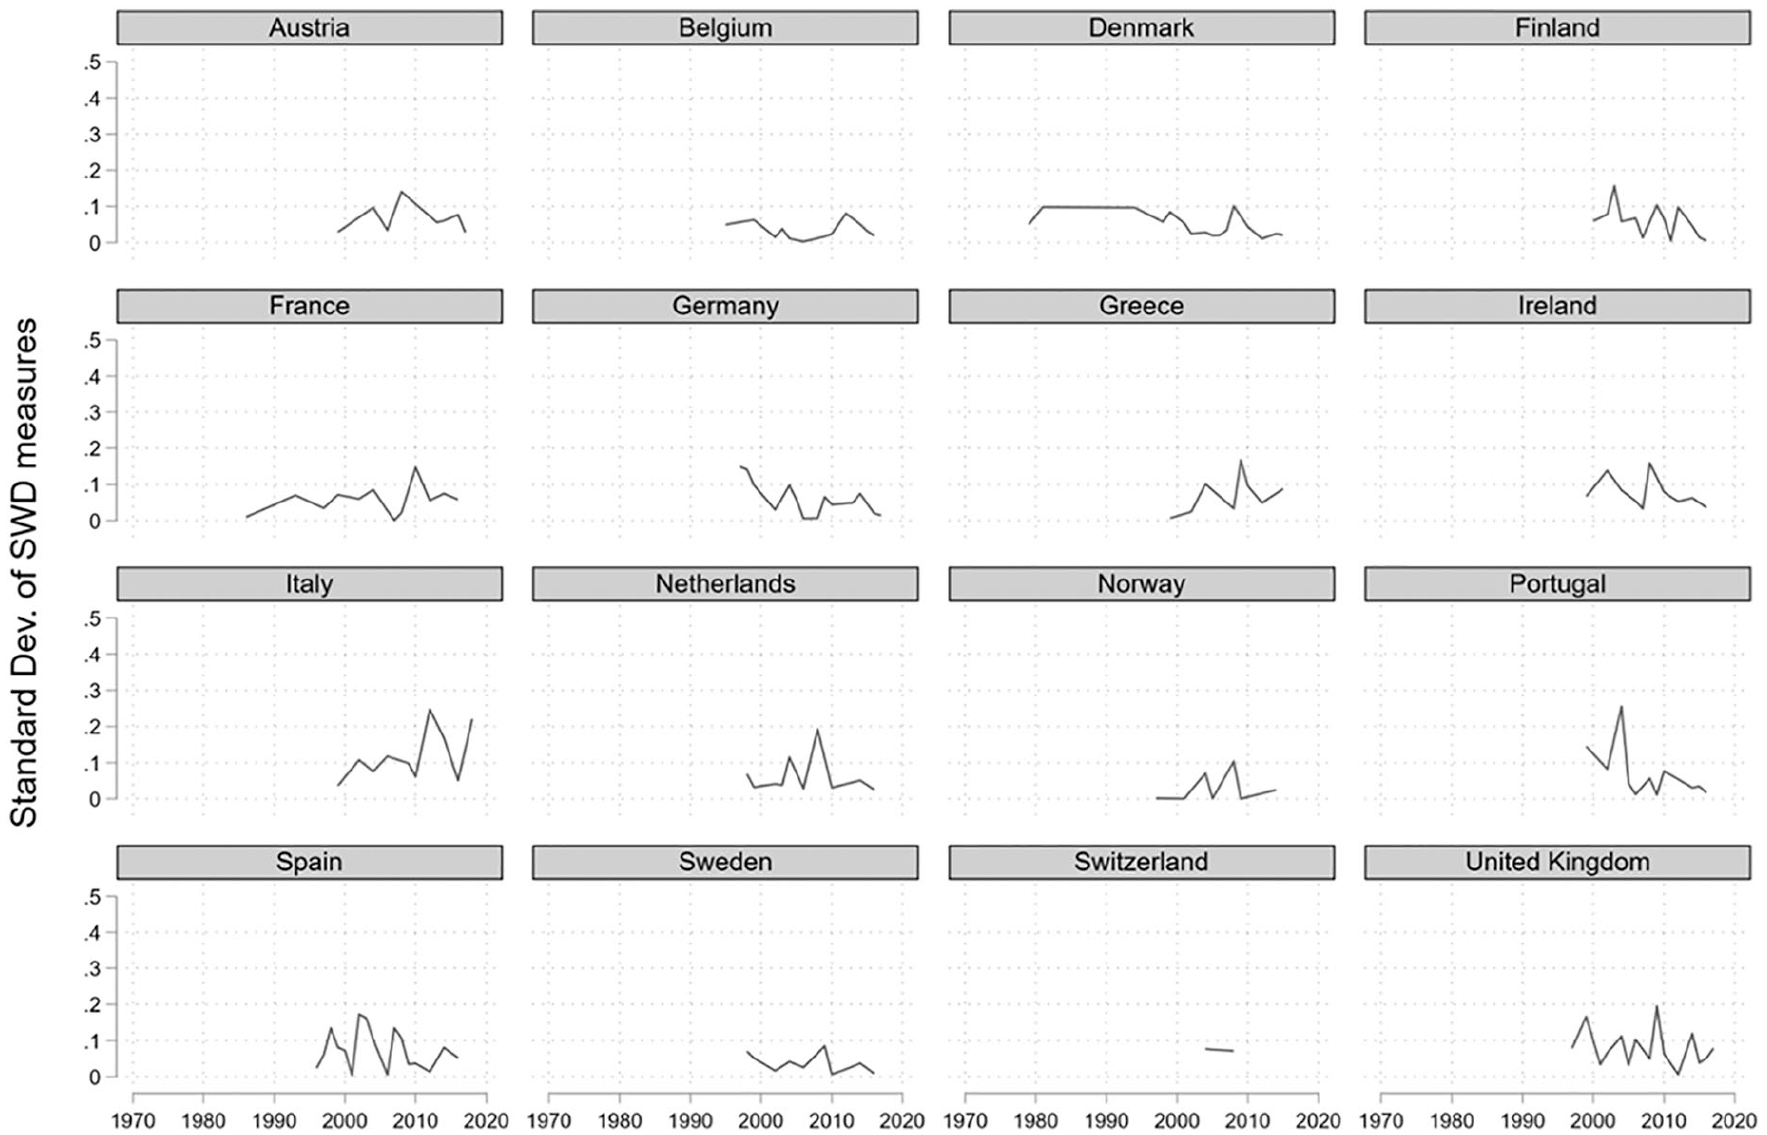
Standard deviations of aggregate country–year SWD values between different survey projects, graphed over time in sixteen European countries.
Table 3 presents the pairwise Pearson’s r correlation coefficients between the aggregated SWD measure from each major survey project in the entire global dataset for all observations where measures from different projects are available in the same country–year. While some pairs (such as the Barometers and the ESS) show stronger correlations, there are some worrying pairs, considering that all of these measures are intended to measure the same underlying concept: the correlation between the NES and ESS measures is only .6 and .67 between the EVS and barometers (in this case, the EB). While these may be reasonably large correlations, we do not consider them encouraging given that the projects are often used interchangeably for identical purposes.
Pairwise Correlations between SWD Measures in Country–Year Observations.
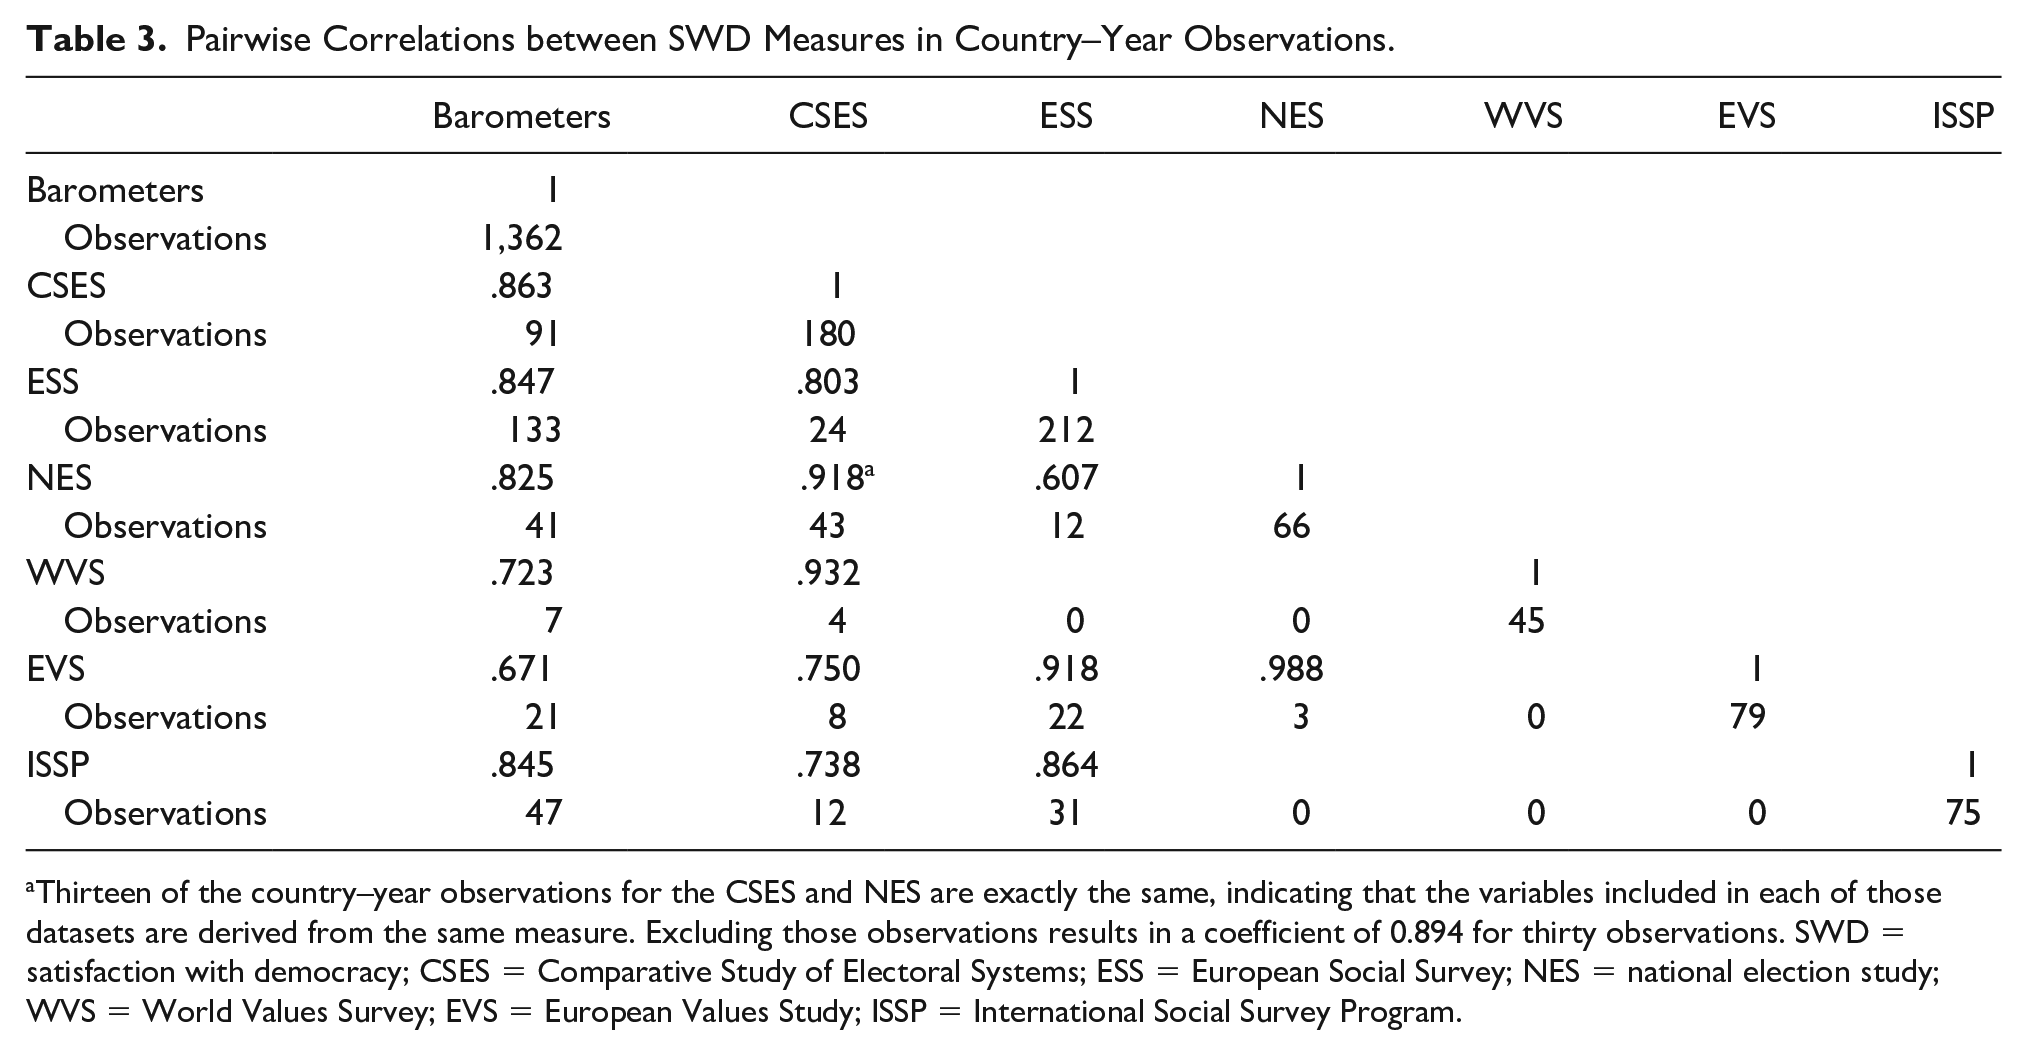
Thirteen of the country–year observations for the CSES and NES are exactly the same, indicating that the variables included in each of those datasets are derived from the same measure. Excluding those observations results in a coefficient of 0.894 for thirty observations. SWD = satisfaction with democracy; CSES = Comparative Study of Electoral Systems; ESS = European Social Survey; NES = national election study; WVS = World Values Survey; EVS = European Values Study; ISSP = International Social Survey Program.
Finally, to get a clearer sense of whether these differences reflect systematic biases in terms of levels and trends of SWD, we conduct multi-level regression models of SWD, where observations are nested within country and the effects of year (the trend), survey source, and their interaction are allowed to vary by country. We run the models on three different samples: the entire dataset, the sixteen European countries we have focused on here, and finally on the six of those countries which showed the biggest differences between survey source (noted above). The full output from those models is presented in the Appendix. In short, all of these models suggest that barometer data reflect a significantly more positive trend in SWD than other data sources do, but most of those differences are insignificant in the first two models. Four out of five comparisons (between the EB on one hand and each of the CSES, ESS, EVS, and ISSP on the other) are significant in the third model, however. Figure 4 illustrates this by presenting the marginal predicted probabilities of aggregate SWD over time from this third model, separated by survey source (we do not present predictions from the ISSP or the EVS here, as they are based on observations from only two waves). As the outcome variable is binary, the y-axis indicates predicted percentage of “satisfied” respondents and thus varies between zero and 100. Predictions based on SWD measures from the CSES and ESS show an apparent decline in overall satisfaction in these six countries, whereas NES data show no trend, but the EB data suggest a substantial rise in SWD.
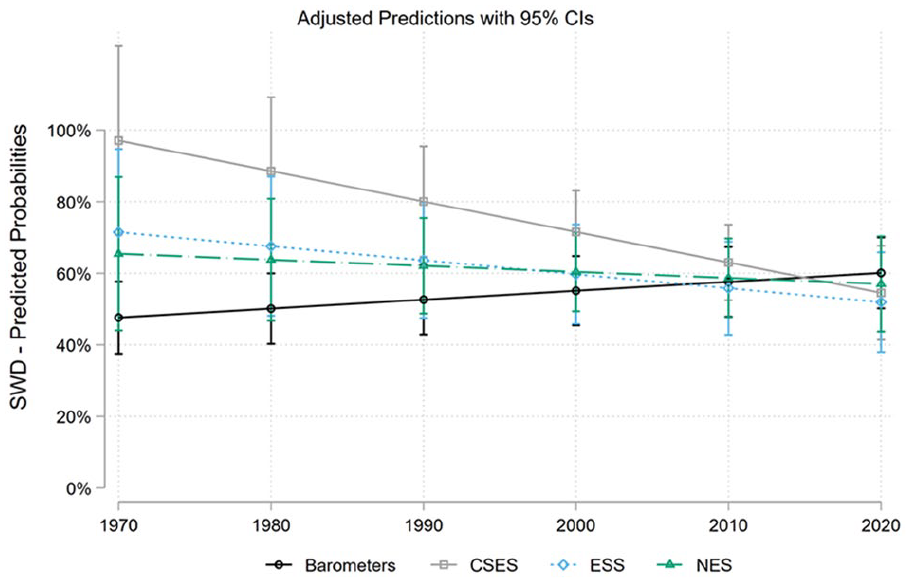
Predicted marginal levels of overall aggregate SWD in six European countries by survey source from multi-level linear regression models, where the effects of survey source, year, and their interaction are allowed to vary at the country level.
Therefore, descriptive data for aggregate SWD from different survey projects suggest that globally, trends and between-country differences are generally quite consistent between projects, although within-country levels are in some cases importantly different (e.g., in Russia, Japan, and Israel, and between barometer projects in Latin America). However, six large European countries appear to be especially problematic in this respect: differences in levels in those countries are substantial and their trends tend to point in different directions (although the only statistically significant case of this is between the EB and the British Election Study [BES] in the United Kingdom), although there are indications that these differences have decreased in recent years. Statistical tests indicate that the pairwise correlations between different survey projects in the same country–years are generally strong, but in two cases in Europe (between the ESS and NES and EVS and EB), they are below .7. Multi-level models suggest that generally, the EB reports a more positive trend in SWD than other projects, and these differences are significant in almost all cases among the six European countries highlighted here.
Does It Affect Inference? Individual-Level Analyses
While we have thus far focused on the important question of aggregate similarities between survey projects, most analyses of political support are conducted at the individual level using data either from single surveys or from cross-sectional or pooled datasets. As such, we now expand our analysis by assessing whether the choice of survey affects individual-level inference. We do so by first identifying country–years in which different surveys have been fielded; this minimizes the possibility that any divergent results are a consequence of real, substantive differences in the population. This leads us to three country–years: The Netherlands in 2006, Spain in 2004, and Sweden in 2006, all of which have four surveys fielded. We then run logistic regressions predicting the probability that a respondent is satisfied (1) or not (0) with democracy. As predictors, we include sex, education, and age. These are primarily chosen for convenience, because they are featured in the vast majority of surveys, but they are also important in their own right given that the literature often focuses on these as determinants of democratic satisfaction or uses them as control variables (e.g., Bernauer and Vatter 2012; Blais and Gélineau 2007; Leiter and Clark 2015; Quaranta and Martini 2016).
While our focus here is on the more prosaic question of whether the analyses are consistent with each other, this can be seen as a form of construct validity: do the programs align with our expectations for relationships with other variables? We do not have specific views on whether, for instance, age is always positively associated with SWD, but we do believe that surveys in the same country–year studying the same relationships should yield equivalent inferences. To focus on the between-survey variation, we present the results separately for each country–year.
Starting with Spain in 2004, the results show quite stark differences for the relationship between education and democratic satisfaction. Indeed, the EB has a large, significant positive coefficient for secondary and higher education, whereas the CSES has an insignificant, negative coefficient (a Wald test confirms the coefficients are significantly different). 11 The coefficients on gender are similar, while the coefficients on age for the CSES and EB are significant and positive but for the ESS and ISSP they are insignificant. A Wald test confirms that the coefficients are significantly different, but their substantive effect is trivial in all cases (Figure 5).
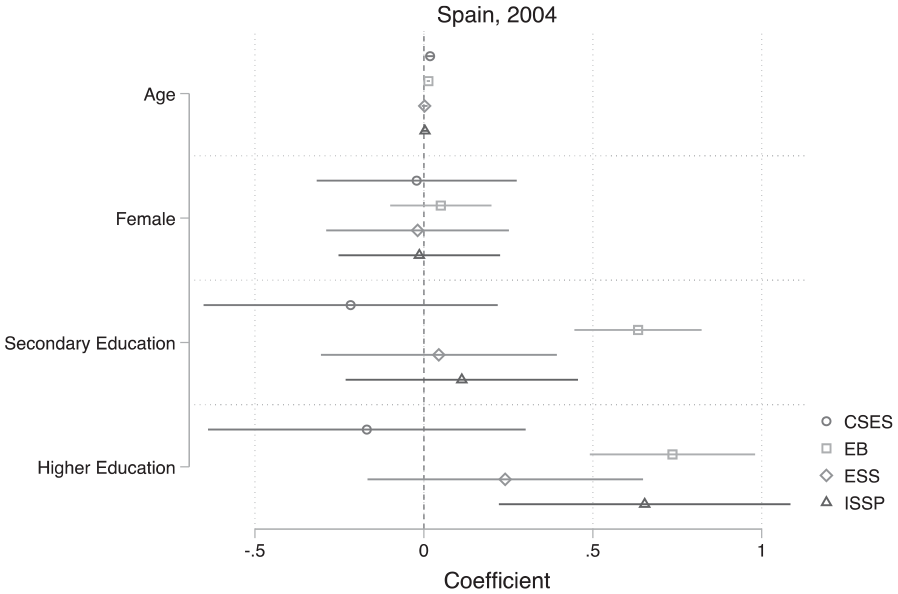
Coefficients for the effect of demographics on satisfaction with democracy (Spain, 2004).
Similar differences are present in Sweden (2006), where the EB is the anomaly with respect to the effect of education. The EB has an insignificant coefficient for higher education, whereas the other projects have a significant, large, and positive coefficient—a Wald test rejects the null of equality between the EB and the NES at the weaker 10 percent level (p = .092) but fails to reject the null of equality between the EB and the ESS/CSES. With respect to gender, the ESS is the anomaly, reporting a significant negative effect, while the other programs report an insignificant effect (a Wald test rejects the null of equality between the ESS and all other programs; Figure 6).
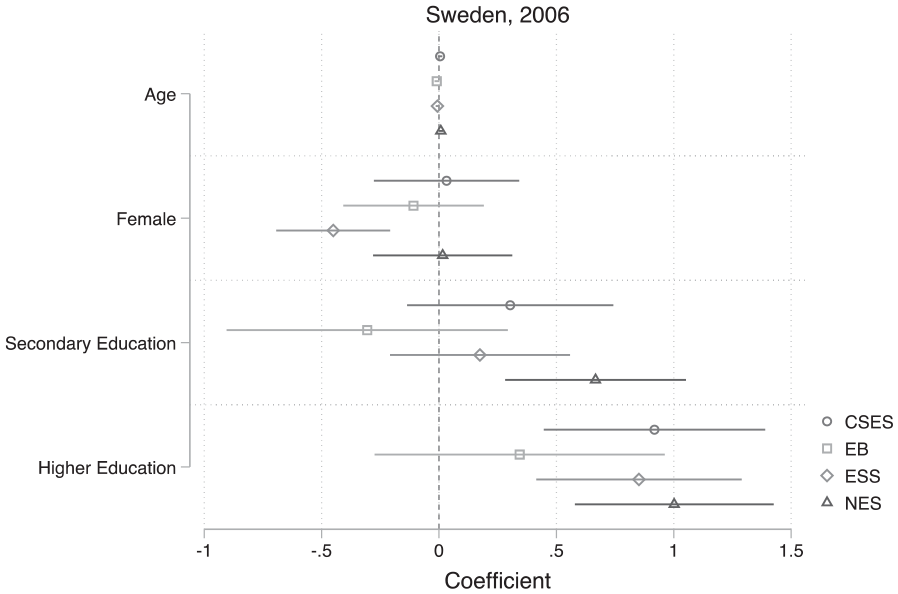
Coefficients for the effect of demographics on satisfaction with democracy (Sweden, 2006).
Finally, turning to the Netherlands in 2006, we again find inconsistencies in the results. While for higher education the coefficients are in the same direction and all significant, there are large differences in effect sizes: the CSES is a third of the magnitude of the ESS and half the magnitude of the EB. Similarly, the CSES reports an insignificant and trivial coefficient for the effect of secondary education, while all others report a significant, positive coefficient (a Wald test rejects the null of equality between the CSES and the ESS, but not the CSES and the other two programs). Finally, with respect to gender, we again find slightly different results: the CSES and NES report significant negative effects while the ESS and EB do not, though the point estimates are similar (Figure 7).
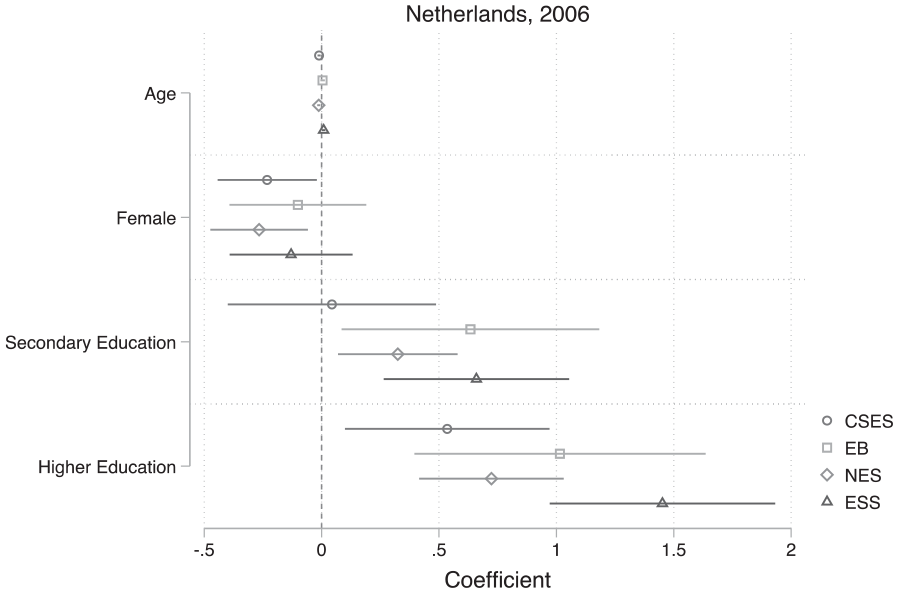
Coefficients for the effect of demographics on satisfaction with democracy (The Netherlands, 2006).
Altogether, this analysis has shown that the choice of survey program is consequential for individual-level inference as well as aggregate-level inference, even with respect to survey questions that are relatively uncontroversial and consistent between projects, such as whether the respondent is male or female. This is in ideal circumstances, comparing surveys fielded within the same country–year. Although we have no benchmark, we do not think this is particularly strong evidence for construct validation, considering that studies using one study over another may reach different substantive results (for instance, about the effect of education on democratic satisfaction).
Conclusion
In this paper, we have used a unique dataset consisting of over 3 million respondents surveyed in 140 countries and 1,615 country–years in the period between 1973 and 2018 about their “SWD” and compared this measure across different survey projects to see whether inference is affected by survey program choice at aggregate and individual levels. This is important due to the prevalence of the measure, concern over its measurement validity, and conflicting and ambiguous results between substantive studies of trends in democratic satisfaction.
Our findings bring a balance of good and bad for those who study SWD. The good news is that trends and between-country differences are mostly consistent between different survey projects, and within a majority of the countries examined, differences in levels between projects are minimal. The bad news is that in some cases, differences in levels of SWD between surveys are more significant, and in several widely studied countries—especially the United Kingdom, France, and Spain—those differences are quite substantial and even the trends in satisfaction are different between survey projects. Furthermore, while individual-level regression models using different survey projects in the country–years sampled here generally do not point in opposite directions, significant effects in one survey are sometimes insignificant in another and effect sizes vary considerably—even when the estimates are not statistically significantly different. This suggests that while researchers should not disregard studies using single survey projects, we should interpret them cautiously and future research should make every effort to consult more than one project, particularly in the outlier countries highlighted here. Furthermore, trend analyses should be careful to separate results by survey project, lest we risk reaching spurious conclusions due to differential survey inclusion in different years and countries. With the growth of a number of projects combining these datasets, this is no longer the hurdle it used to be.
More specifically, in terms of our methodological examination of the consistency between SWD measures at the aggregate level, our analysis showed that in non-European countries, the trends and country differences across different survey projects are generally very similar but with a few exceptions (including Russia, Japan, and Israel, and differences between barometer projects in Latin America). Focusing on sixteen European countries for which we have the most data, these patterns are again very similar for the majority of countries. The United Kingdom, Austria, Ireland, Italy, Spain, and Portugal, however, display significant discrepancies both in terms of levels and trends of SWD. We quantified this by graphing the standard deviation between the different surveys, which show a low standard deviation (<0.10) for the majority of countries and this appears to be declining over time. The pairwise correlations between aggregate measures reported by different survey projects in the same country–years in the global dataset are generally strong, but in two cases in Europe, they are below .7 Pearson’s r, a worryingly weak association when examining measures intended to capture the same underlying concept. Multi-level models suggest that generally, the EB reports a more positive trend in SWD than other projects, and these differences are significant and particularly pronounced among the six European countries highlighted here.
However, whether these differences are because the EB is reflecting actual underlying developments in SWD more or less accurately is unclear: on one hand, it has conducted many more surveys than other projects and covers the entire period from 1973 to 2019, but on the other hand, it has been criticized for low response rates (de Vries and Hoffmann 2020). Data from the Survey Data Harmonization project (Slomczynski et al. 2017) dataset (presented in the SI) also indicate that the EB’s sampling method is more dependent on “random route sampling” than other survey projects, and that unlike the other projects, they do not include information on response rates in their survey documentation. Adjudicating this matter is beyond our scope here and a worthy topic for future research, but our findings highlight the importance of consulting different data sources and interpreting trends from one source cautiously.
These findings inform the important academic debate about a “crisis of democracy” or “legitimacy crisis.” Our data do not settle that empirical debate (nor was this our intention), but they do shed light on potential reasons for why prior studies using SWD measures have tended to reach contradictory conclusions about trends in democratic satisfaction. First, in the relatively few countries where different projects appear to agree on trends, they go in different directions depending on country choice: SWD appears to be rising clearly in about nine countries in our dataset but decreasing clearly in perhaps five. Second, these trends are not always linear: several countries, especially in Africa and Latin America, appear to show both clear increases and clear decreases of SWD within the same country in different parts of the long period covered here. 12 Third, the EB shows clearly increasing SWD in many European countries, whereas other survey projects generally show trendless fluctuations and sometimes slight declines. While we cannot say at this point which result is correct, it does take us further toward understanding contradictory findings in the literature so far: Norris (2011) and van Ham et al (2017) primarily use EB data when arguing against terminal declines of SWD, whereas Foa et al.’s (2020) recently published report averages aggregate measures by country–years from various different survey projects, without examining how this average may be concealing contradictory trends from different projects. The latter approach may produce spurious trends if a particular survey project tends to report lower (or higher) levels of satisfaction and is not included equally across the whole period. Future research should look closely into this issue, perhaps using more sophisticated survey aggregation methods such as dyad-ratio algorithms (Clarke et al. 2018; Stimson 1991) and Bayesian dynamic latent variable approach (Claassen 2019, 2020) to determine any underlying global or regional trends in SWD.
In terms of individual-level analyses of determinants of SWD, we examined whether our inferences regarding age, education, and sex change using data from different surveys conducted within the same country–year. The results of these comparisons indicate that there are in fact significant differences in the point estimates and sometimes directions of these predictors between survey projects. This is important because it may obscure our conclusions about substantively important variables or lead researchers to drop the insignificant variables, leading to differently specified models. This is not a trivial concern: many published papers in leading journals use single survey waves to study individual-level relationships which we have shown appear to differ depending on the data source they choose.
The paper raises some notes of caution. For those who utilize a cross-sectional analysis, particularly in the six countries that have large deviations between surveys, it is advisable to, where possible, rely on more than one dataset. For those who are interested in long-term trends, the analysis suggests that in most countries around the world, conclusions will ultimately be similar, but this is not the case for many European countries. Absolute levels of SWD also tend to differ substantially between survey projects in many countries, especially in Latin America, so researchers should be wary of making conclusions about the overall extent of SWD in a society using a single dataset. We urge researchers, where possible, to test the robustness of their results by using multiple datasets. As noted, with the growth of collaborative projects bringing together all of these data, this will soon not be the arduous task it has been until now.
We conclude by pointing out future areas of research. First, democratic satisfaction is just one measure of many, not only in the political support literature but in all fields of political science. Future research could provide similar analyses on contested topics such as political and social trust, and immigration attitudes. Second, further tests of the validity, reliability, and sensitivity of SWD measures would be valuable, for instance, looking at the role of “don’t know” options in survey measures and by studying the associations between different types of SWD measures and other related measures of political support. Finally, while our findings establish some comforting empirical consistencies between survey projects, they also highlight some concerning differences with regard to both levels and trends in many countries important in our field, and overall conclusions about trends in SWD are likely to depend on whether we look at data from the EB—the most comprehensive dataset available on the topic—or from other sources. While further dissecting the causes of that differences or more general differences between survey projects in several countries is outside the scope of the current paper, it would be a worthwhile endeavor for future studies to examine whether these can be explained by systematic differences in response rates, survey mode, timing of fieldwork, and/or question wording. Nevertheless, our findings shed an important light on a long-standing empirical ambiguity within the field of political science regarding one of its most widely used measures. They highlight the potential pitfalls of single survey analyses in several countries, while also providing comfort for most cross-sectional comparisons as well as for trend analyses that are careful about accounting for differences between survey projects.
Supplemental Material
sj-pdf-1-prq-10.1177_10659129211009605 – Supplemental material for What Satisfaction with Democracy? A Global Analysis of “Satisfaction with Democracy” Measures
Supplemental material, sj-pdf-1-prq-10.1177_10659129211009605 for What Satisfaction with Democracy? A Global Analysis of “Satisfaction with Democracy” Measures by Viktor Orri Valgarðsson and Daniel Devine in Political Research Quarterly
Footnotes
Acknowledgements
We thank participants at the Elections, Public Opinion and Parties 2019 Conference and particularly Anja Neundorf for helpful feedback. We also thank Stuart J. Turnbull-Dugarte for comments on an earlier draft. The editor and three anonymous reviewers provided excellent guidance that improved the paper enormously.
Authors’ Note
The authors cannot share the full final dataset due to confidentiality agreements with some of the data (most of the national election studies). That said, the authors are committed to transparency in research and are happy to share what we can and guide others in replicating our work on request. To do so, please contact
Declaration of Conflicting Interests
The author(s) declared no potential conflicts of interest with respect to the research, authorship, and/or publication of this article.
Funding
The author(s) disclosed receipt of the following financial support for the research, authorship, and/or publication of this article: The funding for this project is through the South Coast Doctoral Training Partnership (DTP) under Grant Number ES/J500161/1, which funded the authors’ PhD projects, and through the ESRC-funded TrustGov project (ES/S009809/1).
Notes
Supplemental Material
Supplemental materials for this article are available with the manuscript on the Political Research Quarterly (PRQ) website.
References
Supplementary Material
Please find the following supplemental material available below.
For Open Access articles published under a Creative Commons License, all supplemental material carries the same license as the article it is associated with.
For non-Open Access articles published, all supplemental material carries a non-exclusive license, and permission requests for re-use of supplemental material or any part of supplemental material shall be sent directly to the copyright owner as specified in the copyright notice associated with the article.