
Abstract
People with diabetes are at risk for diabetic retinopathy (DR), a leading cause of blindness. Early treatment can preserve sight; however, screening rates are low. We utilized psychological theories of motivation in tandem with human factors tools such as heuristic evaluation and task analysis to develop interventions to improve screening rates at a single clinic. Interventions addressed the system of screening, from the patients and their choices to clinic workers, device usability, and the clinic environment. Findings showed potential solutions to the screening issue situated within the theory of planned behavior. Future steps are to refine interventions and measure effectiveness.
High blood sugar from poorly managed diabetes mellitus causes progressive damage to retinal vasculature, resulting in diabetic retinopathy (DR). DR is the leading cause of blindness in those younger than 65 years, and about 28% of individuals with diabetes will develop a form of DR in their lifetime (Zhang et al., 2010). Annual screenings are recommended as symptoms often do not appear until late in the disease. This recommendation is difficult to follow due to various internal and external barriers (Call et al., 2006; Phillips et al., 2000). Internal barriers to screening include misinformation and anxiety about screening (Strutton et al., 2016) and a lack of awareness concerning the disease and its prevention (Van Eijk et al., 2012). External barriers include inability to physically access health care and inability to pay for health care (Chou et al., 2014), with racial minorities disproportionately at risk (Shi et al., 2014). Prevalence of the most severe form of the disease is three times higher in Black Americans and two times higher in Mexican Americans compared with White Americans (Centers for Disease Control and Prevention, 2020). A recent study showed that 73% of adults with DR in the state of North Carolina were not aware that they had the disease (Skaggs et al., 2017).
The Retinal Care–DR (RCDR) program (Retinal Care Inc., Oklahoma City, Oklahoma) was designed to reduce cost and transportation barriers by screening for DR during patients’ primary care visits. Once the RCDR screening test was administered, results were transmitted to an ophthalmologist who returned a diagnosis to the clinic, negating the need for an additional visit to an ophthalmologist. The main differences between the RCDR program and traditional screening were that the RCDR screenings occurred in a primary care setting rather than ophthalmology and that the screening did not require dilation via eye drops. Dilation was avoided through the use of a handheld electroretinography device (RETeval, LKC Technologies, Gaithersburg, MD) in lieu of traditional retinal photography or slit-lamp examination of the retina. Locating screening at primary care and eliminating dilation were thought to be key in increasing uptake of the screening as lack of transportation to specialized clinics, fear of dilation, and the wish to avoid the after-effects of dilation are often reported barriers to DR screening (Graham-Rowe et al., 2018, Kashim et al., 2018). However, Retinal Care informed us that after being introduced more broadly in 2018, screening rates remained low in clinics offering the RCDR program.
The problem brought to us by the chief science officer for Retinal Care was that screening rates at the clinics were much lower than the number of eligible patients at those clinics. Retinal Care thought part of the issue might be the reliance on medical assistants (MAs) to perform the screening. The original RCDR screening process was designed for one to two “super-users” at the clinic whose job would be educating about DR and performing the screening test, but this allocation of staff was not possible in the small clinics that adopted the screening system. However, any number of other issues might contribute to the low uptake, including the well-known barriers to DR screening. Because of the many variables, from system-level issues with the health care system to the reliance on MAs to the design of the screening device, it was not clear what interventions should increase screening rates.
We used Ajzen’s theory of planned behavior (TPB) along with traditional human factors methods as a framework to analyze what deterred screenings and then proposed interventions and design changes at the process, provider, patient, and screening device levels. We provide our experiences as an example of pairing common human factors and usability methods within the framework of a well-established model of decision making (i.e., the TPB). We used human factors methods to prototype and test one of these proposed changes, culminating in guidelines that should increase screening for DR. Our analysis and intervention targeted an endocrinology clinic in Oklahoma City, Oklahoma.
Theory of Planned Behavior as a Framework for Human Factors Analysis
In the TPB, intentions and behavior are based on three attributes: perceived behavioral control (the person’s perceived ability to enact behavior), subjective social norms (how the individual believes community around them perceive the value of the behavior), and attitudes (the individual’s own views about the behavior and it’s desirability; Ajzen, 1991). A later addition to the TPB supplied actual behavioral control, which not only affects perceived behavioral control but also directly affects behavior, bypassing intention to act. This is because actual behavioral control is often situated in the environment – a classic example came from a study of health care workers and hand hygiene (Bischoff et al., 2000; Kaplan & McGuckin, 1986). The number of sinks available had a strong effect on hygiene, as even the strongest intention will not result in handwashing with no sink present. As human factors psychologists, we wanted to leverage the beliefs within the TBP that were internal to those involved in the task (MAs and the patients who need screening), but acknowledge the power of external forces (such as actual behavioral control) and external barriers in the environment when devising solutions to the screening problem. Thus, we included not only the patients in our consideration but also the MAs at the clinic integral to the screening process.
We examined intention and behavior at multiple levels: (1) the MA choosing to inform patients of the screening option and the benefits connected to it, (2) the decision of the patient whether or not to be screened during a visit, and (3) the MA choosing to follow the protocol until the screening data were successfully transmitted to an ophthalmologist. All these functioned within the environment and systems of the clinic. We considered these two groups in the system of screening, as patient safety and health care worker well-being are correlated (Carayon et al., 2014). In our analysis, we considered the three attributes of the TPB for MAs and patients and how they were influenced by human capabilities and limitations. This was a way of using theory to combine human factors methods that tend to focus on the perceptual, cognitive, and movement abilities of humans with the beliefs that relate to motivation and intention. Organizing our analysis via the TPB focused our search for the sources of undesirable behaviors and, once identified, offered directions for solutions to change behavior.
User Groups
The targeted groups for this study included the MAs and patients at an endocrinology clinic. Six MAs were responsible for informing and screening patients for DR. This was in addition to their other responsibilities, such as moving patients about the office for the doctors, weighing patients, and measuring vitals. Through interviews with Retinal Care, we learned the MAs were taught about DR, the screening device, and the RCDR program by other MAs rather than a formal training program. Patients eligible for DR screening at the clinic tended to be older than 60 years, racial minorities, and uninsured. All had diabetes, type 1 or type 2.
Task Analysis
Task analysis is a useful form of formal task decomposition that can be flexibly focused on interactions with technology and the work environment (Gillan, 2012). We performed a hierarchical task analysis to understand the steps and order of steps currently performed for DR screening (Shepherd, 2003). The task analysis focused on the main goal of the RCDR: for a MA to conduct a DR screening with a qualifying patient. The steps needed to do this are listed in the task analysis in the order in which they were meant to occur.
Through a prior Retinal Care survey of MAs, semistructured interviews and observations, the lead author collected the information necessary for the task analysis of the RCDR screening process (Table 1). Interviewees included the RCDR coordinator, Retinal Care’s chief medical officer, and Retinal Care’s chief science officer. The protocol for interviews was to have the interviewee step through the processes while showing any manuals, guides, or other materials provided to the MAs or patients during screening. During the interviews, we asked clarification questions and whether there were known issues with each step. Retinal Care previously surveyed five MAs who worked at the clinic on the screening process, asking them questions such as “What seems to take most of your time during the RC [Retinal Care] service?” and provided us with the results. Once the task analysis was complete, potential errors at each step were recorded and coded by the authors into categories according to Reason’s (1990) taxonomy of unintended actions (including slips, lapses, and mistakes) and intended actions (some mistakes and violations). Using these categories informed our strategies, as slips, lapses, or violations prompt different interventions.
Sample From the Task Analysis of Diabetic Retinopathy Screening
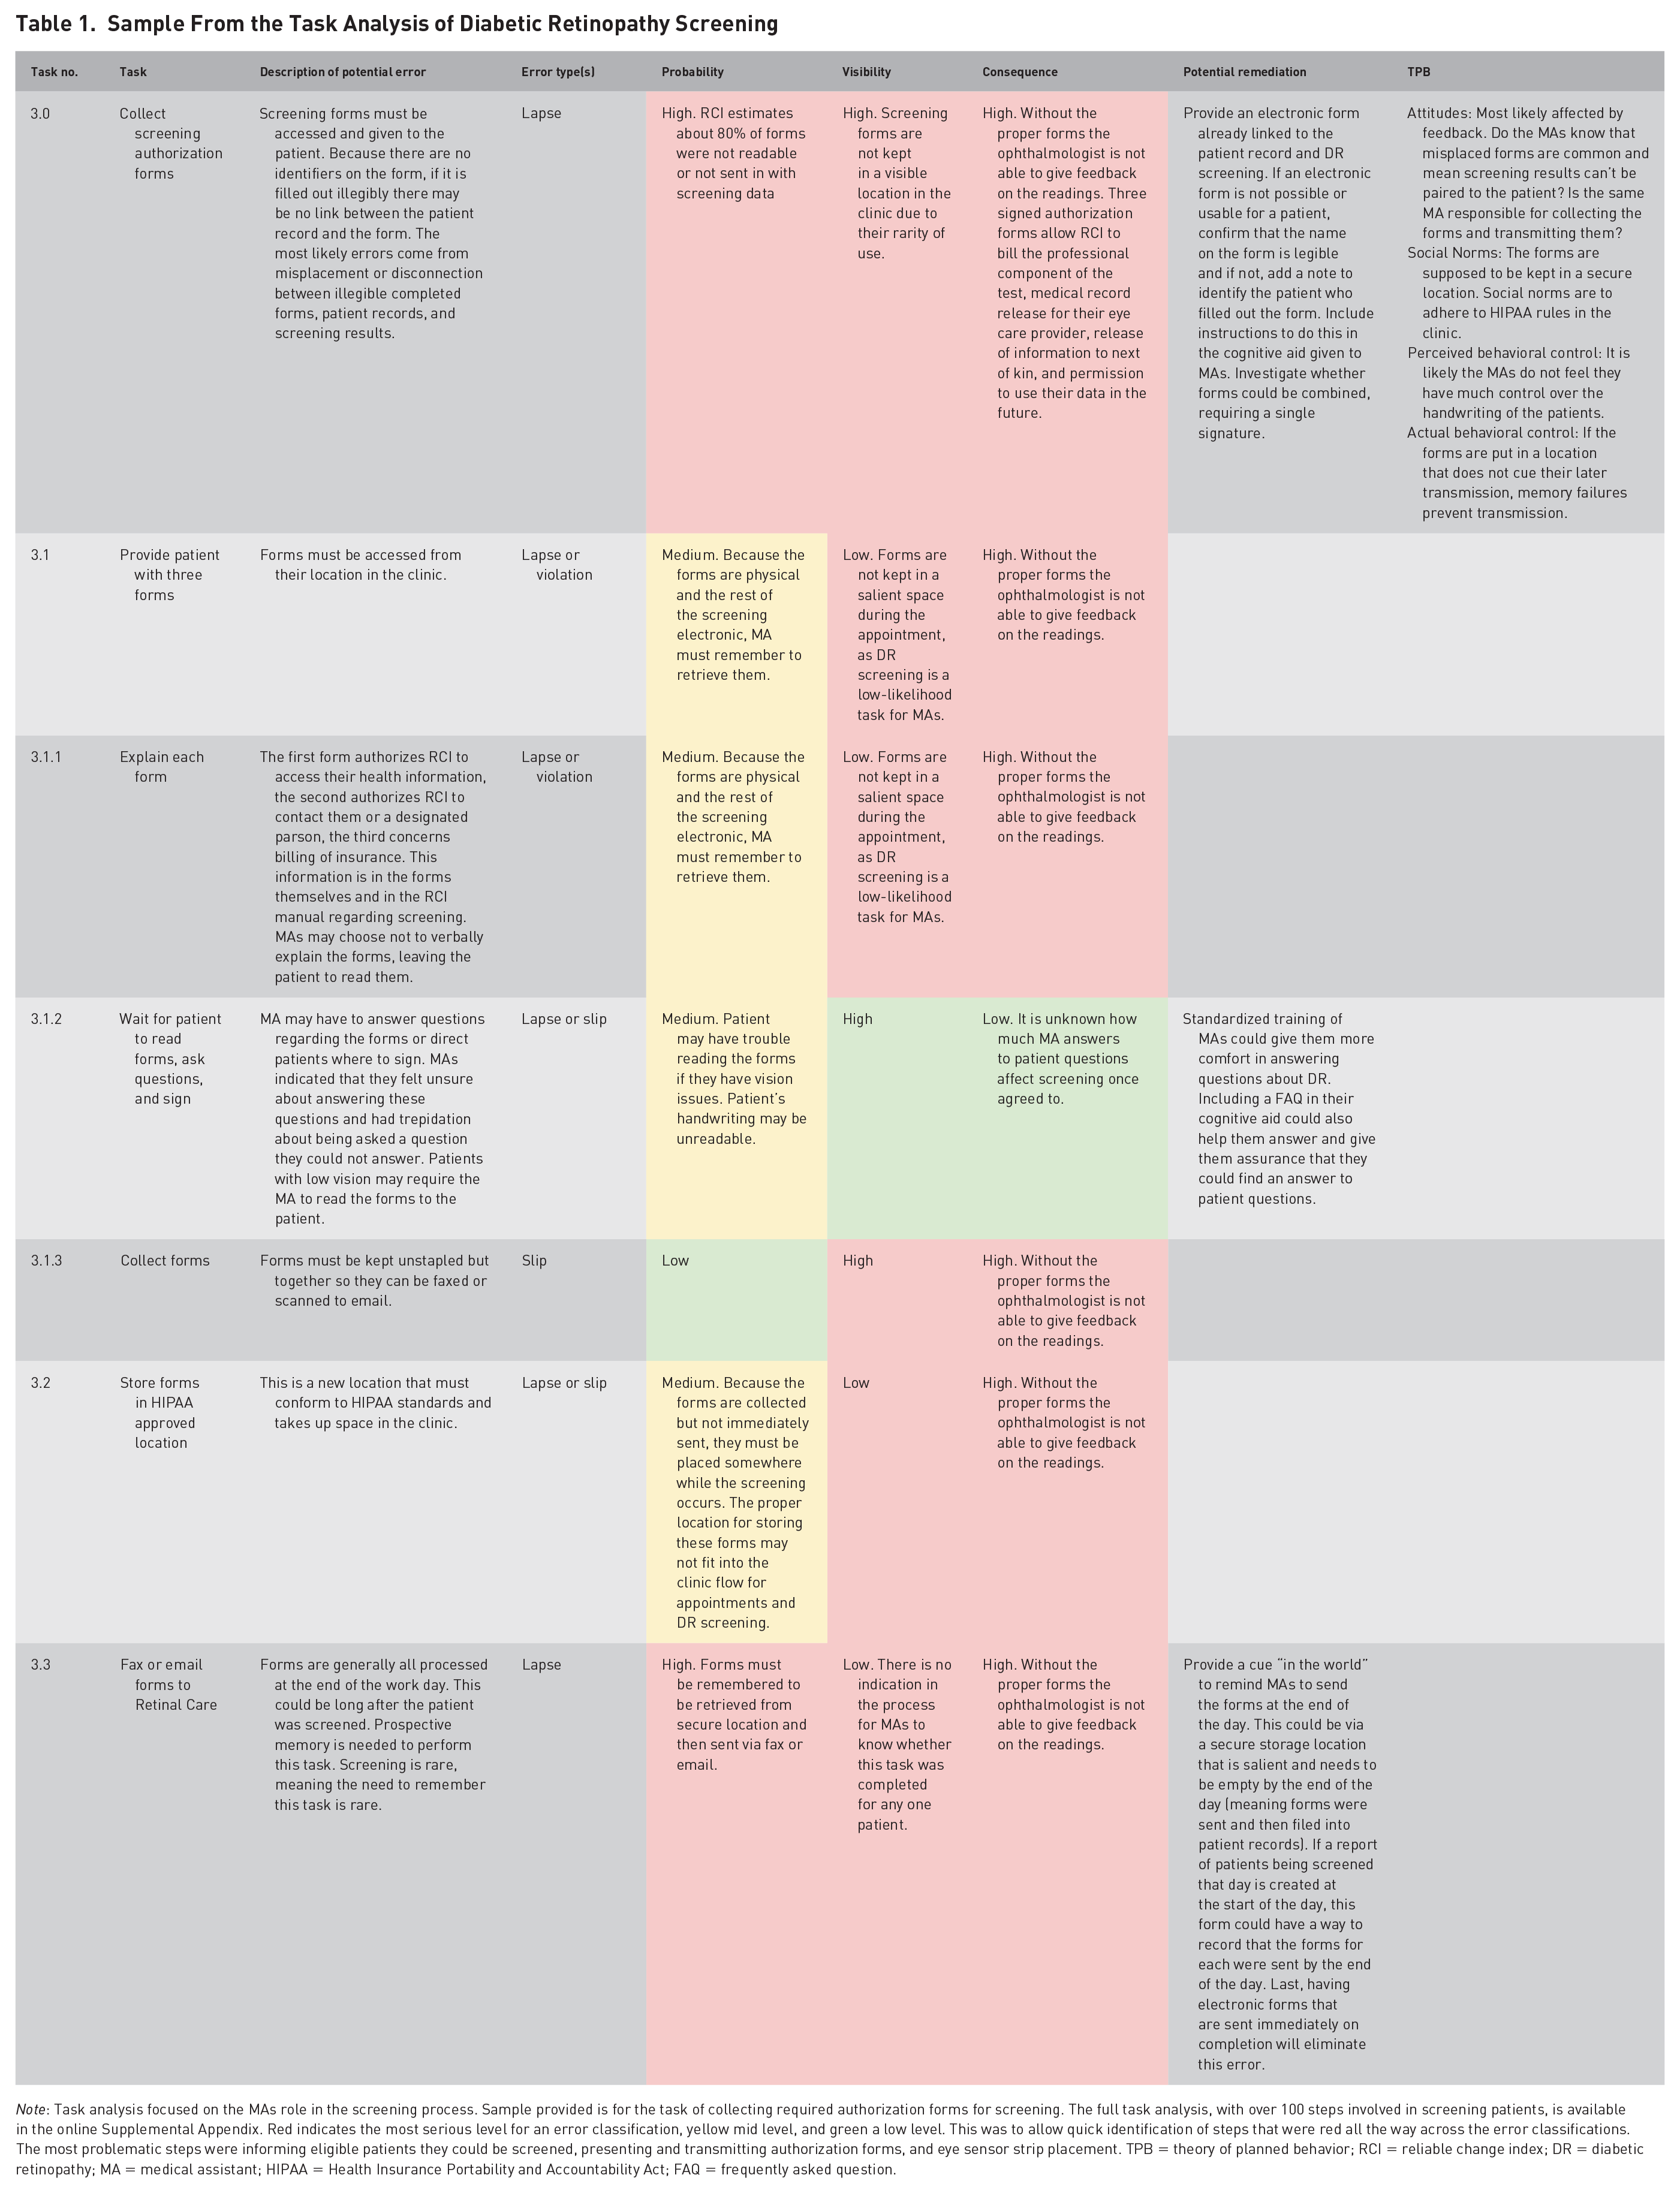
Note: Task analysis focused on the MAs role in the screening process. Sample provided is for the task of collecting required authorization forms for screening. The full task analysis, with over 100 steps involved in screening patients, is available in the online Supplemental Appendix. Red indicates the most serious level for an error classification, yellow mid level, and green a low level. This was to allow quick identification of steps that were red all the way across the error classifications. The most problematic steps were informing eligible patients they could be screened, presenting and transmitting authorization forms, and eye sensor strip placement. TPB = theory of planned behavior; RCI = reliable change index; DR = diabetic retinopathy; MA = medical assistant; HIPAA = Health Insurance Portability and Accountability Act; FAQ = frequently asked question.
Each step was analyzed for error probability (based on the interview information as well as our own knowledge of likely usability errors), error visibility (chance the error will be noticed, this included both visual and cognitive “visibility”), and error consequence. We included potential remediations for the error when possible and connected the larger steps to the TBP. The final task analysis was shown to the interviewees for their approval of its accuracy and completeness and changes made according to their comments (Table 1).
Task Analysis Findings
From the RC survey, we discovered that the MAs were uncomfortable doing the screenings, citing time pressure, difficulty using the device, and feeling unequipped and uncomfortable teaching about DR. Interviews revealed that often patients were not informed that the new screening test does not require pupil dilation, a barrier to DR screening. Finally, we discovered from interviews that the clinic had trouble keeping track of the authorization forms required for the ophthalmologist to remotely interpret the screening tests while remaining compliant with health care privacy and other regulations, adding more time to the screening and sometimes rendering it useless. These findings were integrated into the task analysis in the steps that would be affected.
Three themes appeared in the task analysis: (1) Screenings were not incentivized nor integrated into the daily procedures of the clinic, resulting in likely memory errors to prepare for or offer screening and violations when screenings might be judged as not worth the time required of the MAs. Patients were often not given education on the value of a DR screening before deciding whether to be screened. This reduced the number of screenings, but also the workload of the MAs. This theme most closely matched with the attitudes and social norms that related to behavioral intention in the TBP. (2) The processing of authorization forms was a bottleneck for the screening process and also resulted in lost or wasted screenings. This theme matched with actual behavioral control in the TPB. (3) Correct sensor strip placement was a challenging task in use of the RETeval device, inviting mistakes in diagnosing why the sensor strips were not working and skill slips in applying the strips. In this, all four attributes of the TPB could be assumed to affect behavioral intentions and actual behavior. Overall, screening was time consuming, adding around 30 minutes to a visit.
We hypothesized that reducing the time MAs spent tracking down forms and educating patients about DR and about the screening process would result in more screenings because it would reduce their workload (a usability criterion for patient safety; Carayon et al., 2014), improve their attitudes on screening and their perceived social norms. Better training and examples of eye sensor strip placement should increase both MA perceived behavioral control and actual behavioral control. On the patient side, improving education should change perceived social norms and attitudes about being screened.
Heuristic Evaluation
Our task analysis identified use of the RETeval device as a point of difficulty for the MAs. Although we could potentially influence the training and support offered for use of the device, it was not possible to change the device itself. Four trained usability experts conducted an evaluation of the RETeval device using Nielsen’s 10 Heuristics (Nielsen, 1994; Figure 1 and Table 2). The experts discussed their evaluations and came to consensus.
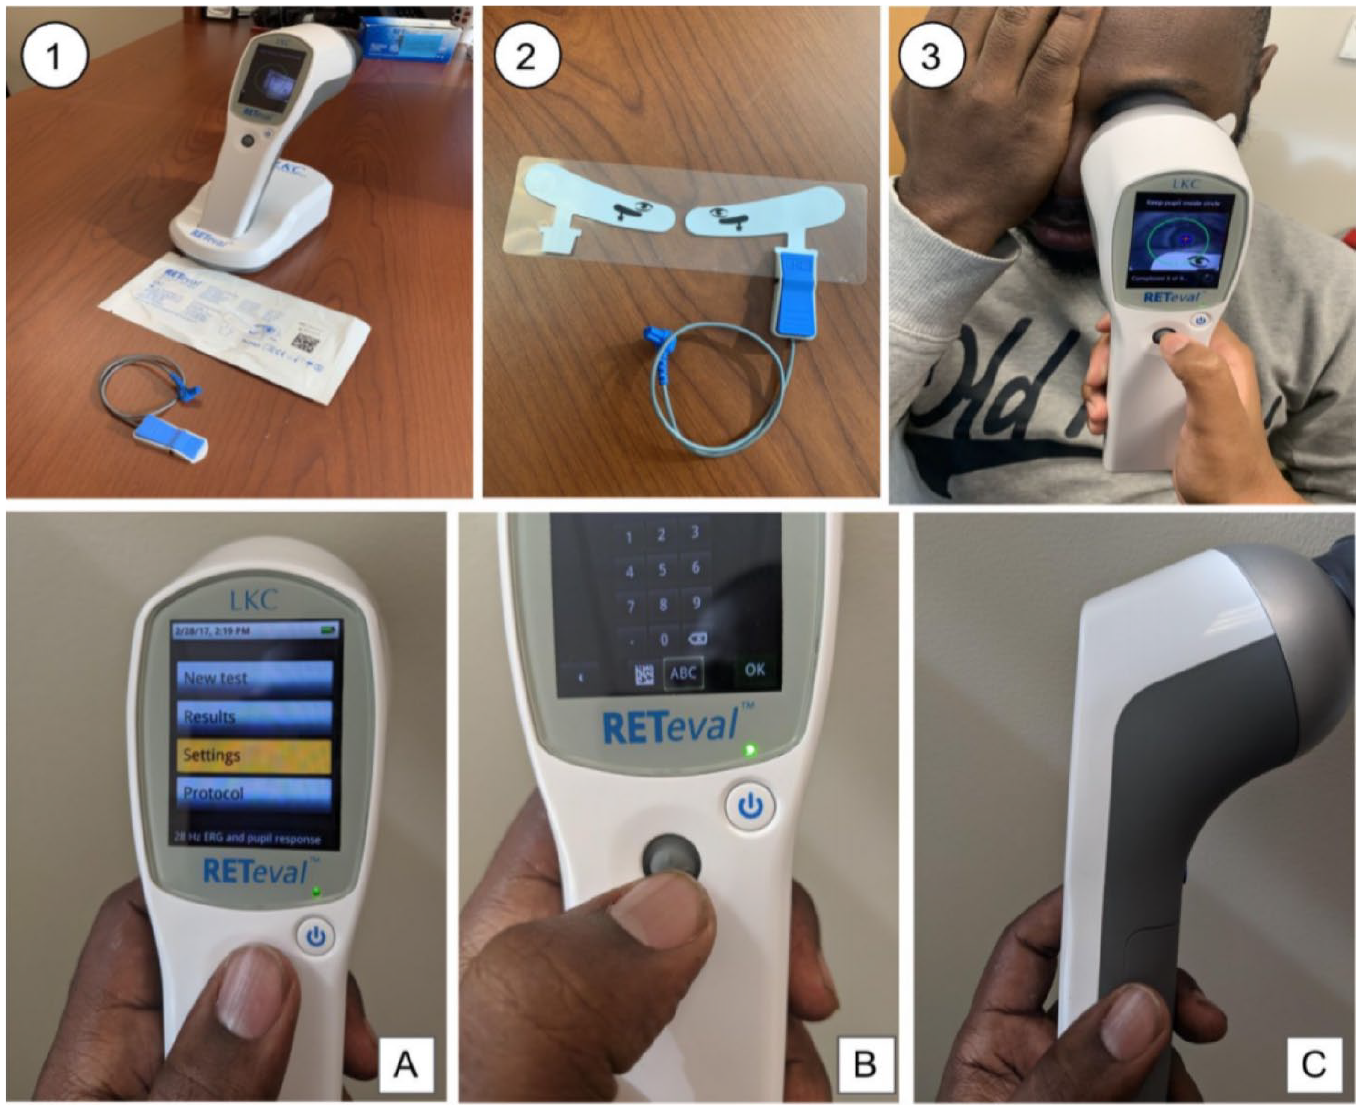
The screening test device. (1) Docked RETeval screening device docked ready for use with packaged sensor strips and connection cord. (2) Opened sensor strips with the connector attached. (3) DR screening device in use. A–C show the device and the user interface: (A) Shows the menu when initiating screening. (B) shows the interface for entering medical IDs. (C) shows the handle for the RETeval device, with the small connector for the sensor strip lead visible on the underside of the device handle.
Heuristic Analysis of Usability Issues Related to the RETeval Device
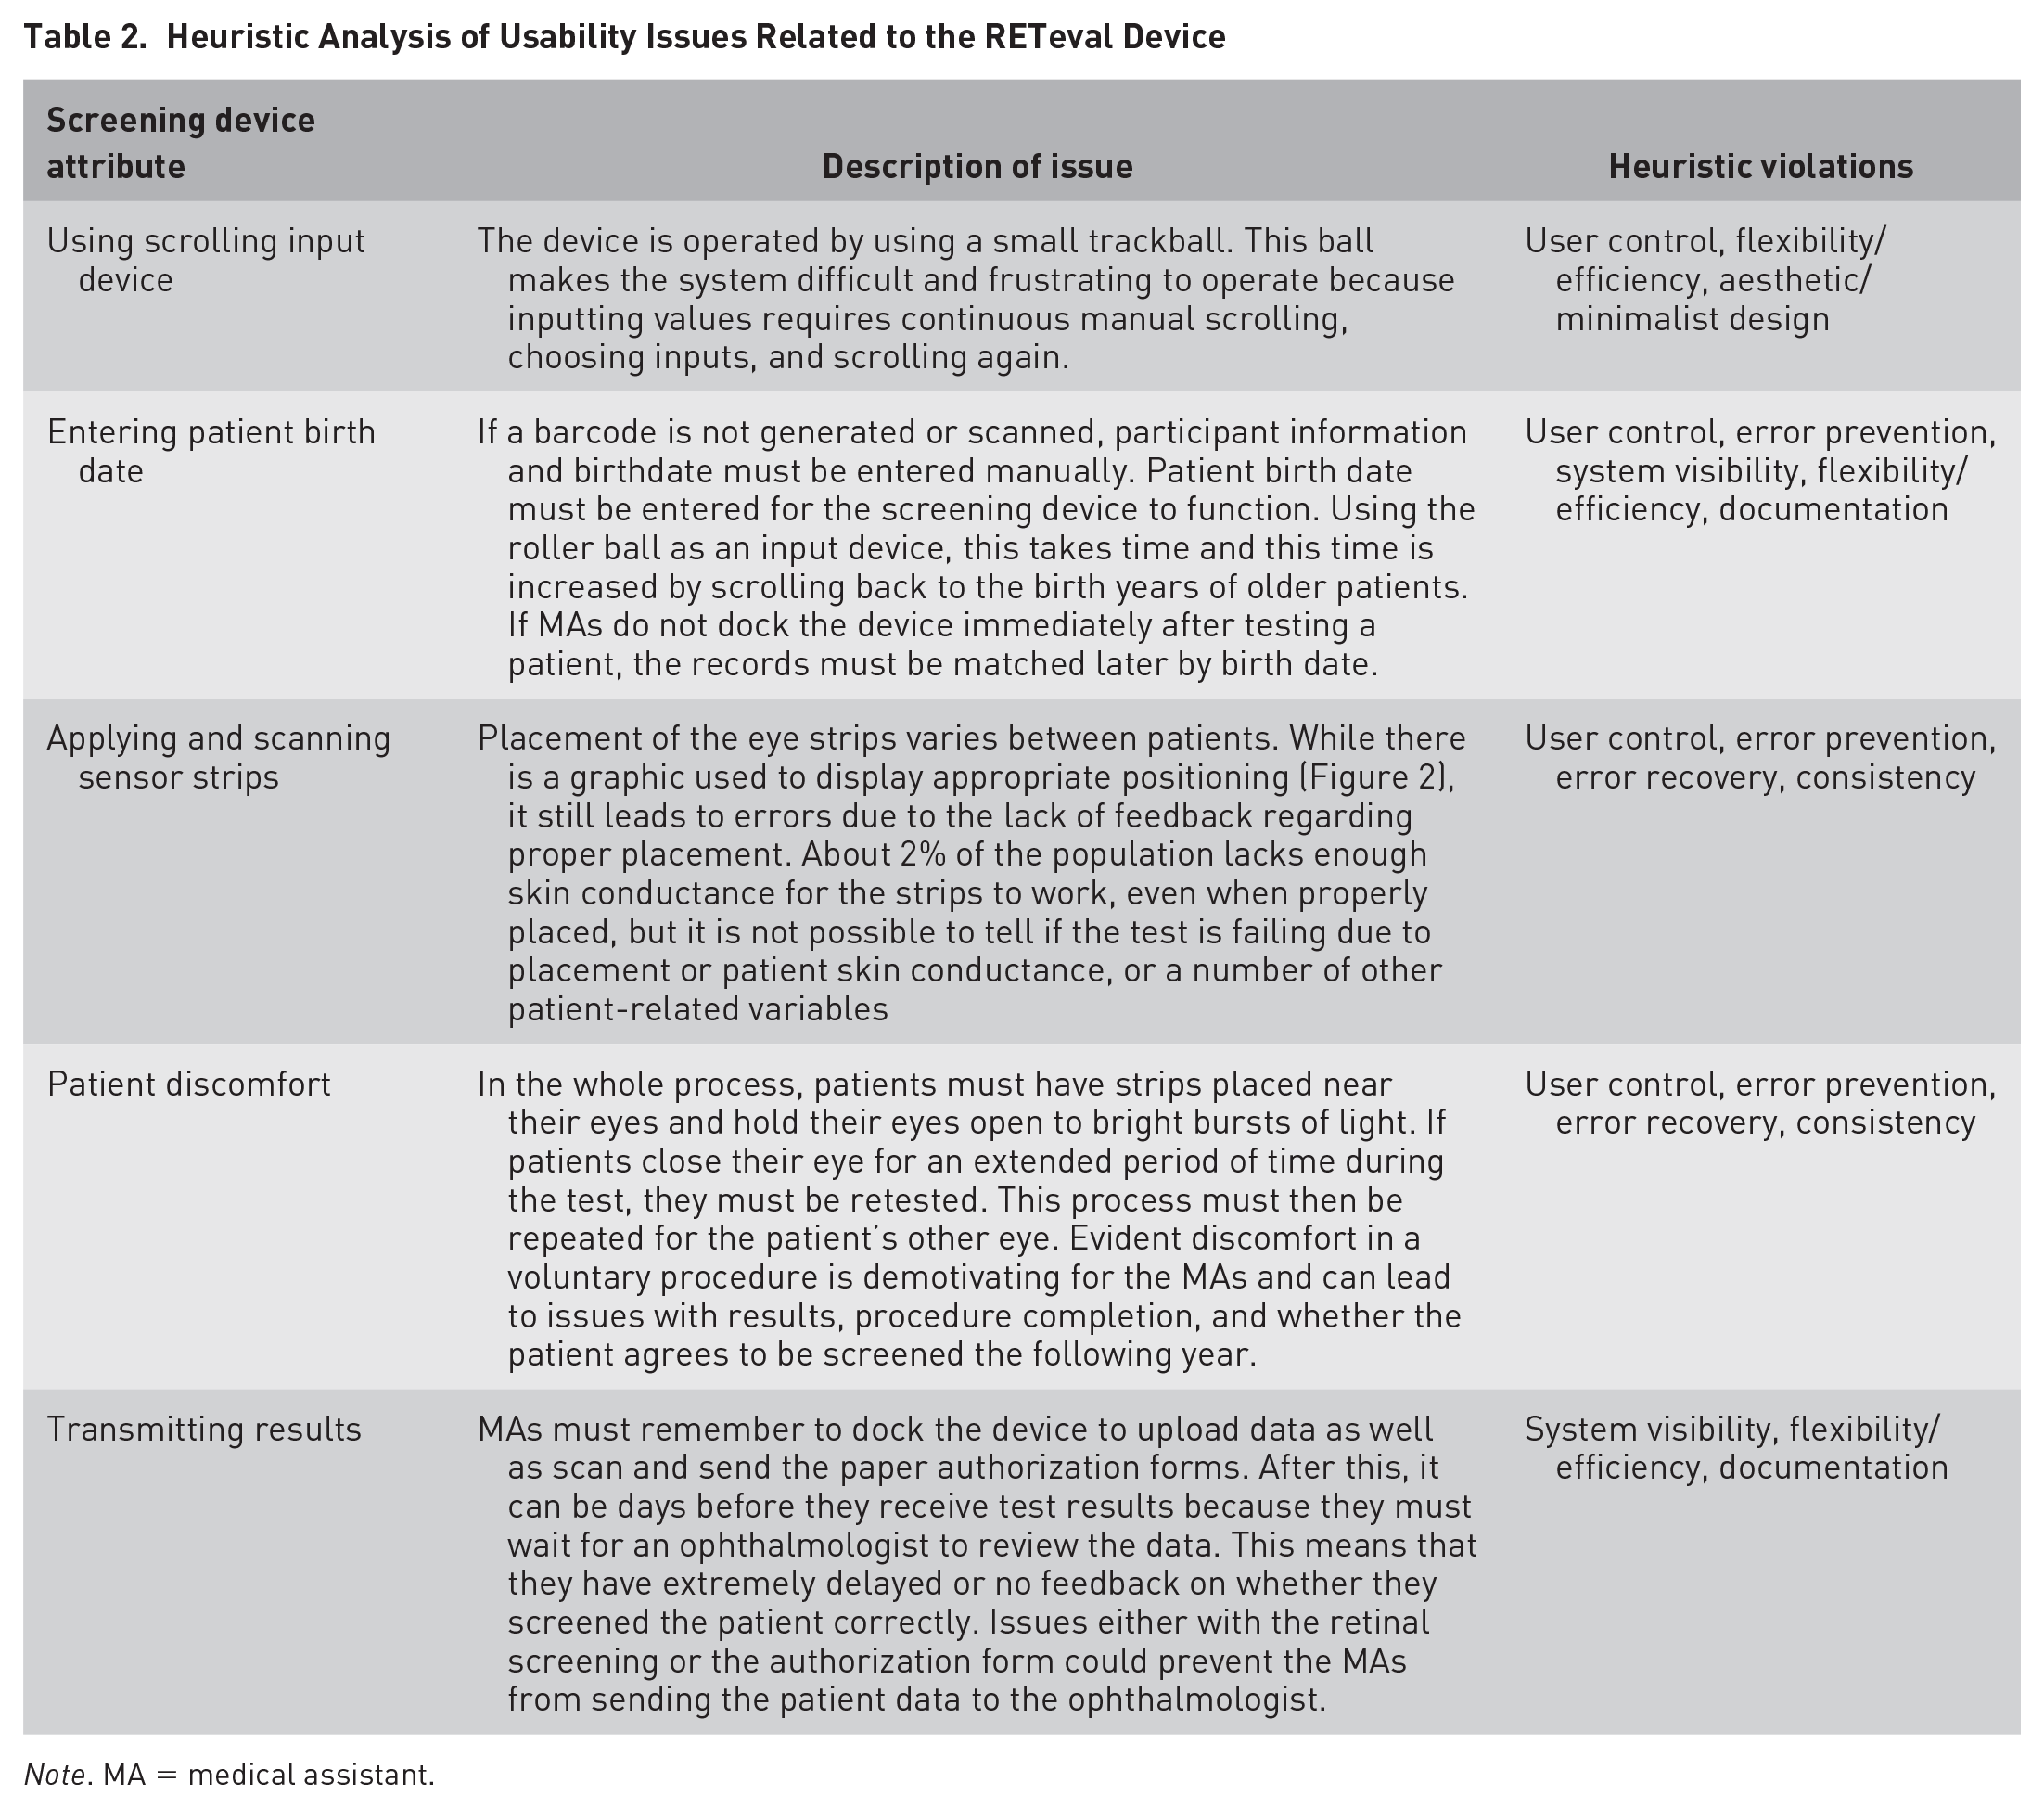
Note. MA = medical assistant.
The most consistent heuristic violation was a lack of user control, which aligned with our hypothesis regarding the MAs’ integration of screening into their daily routine. User control and freedom describes the user’s ease and ability to undo mistakes they make in the system. If MAs believe they cannot fix their mistakes easily and effectively, they are less likely to use the system. An example of this was placing the eye sensor strips (Figure 2), which required precision, differed slightly depending on the person and caused failures if corrective actions were not taken. Struggles with strip placement likely influenced MAs perceived behavioral control as well as their actual behavioral control. Overall, as can be seen in Table 2, there were a number of heuristic violations.
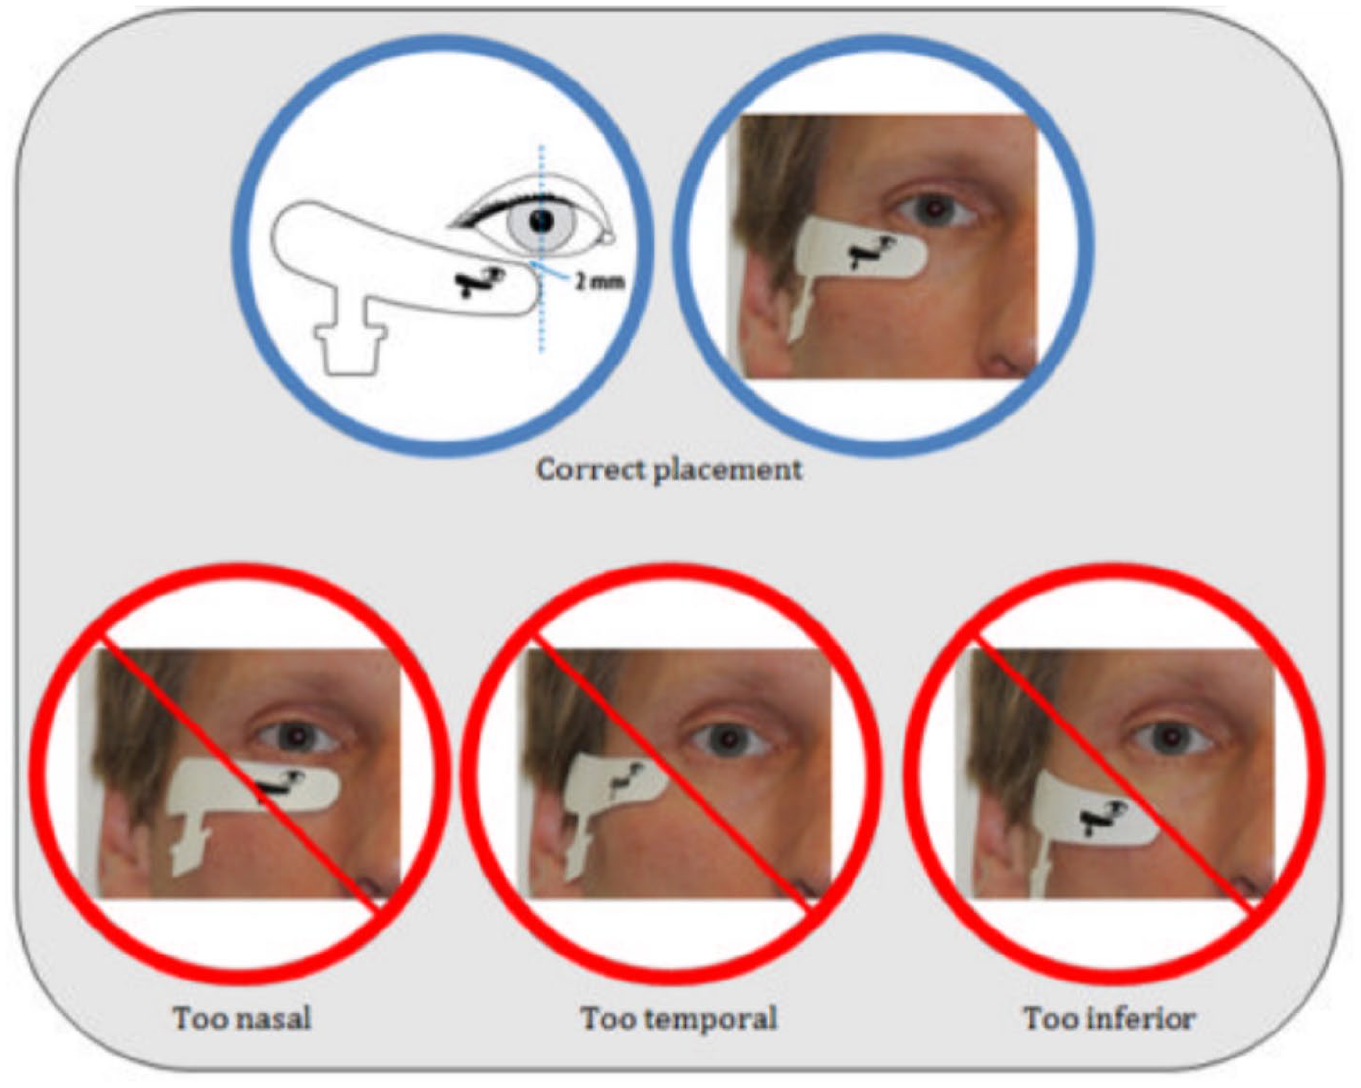
Image from the RETeval manual provided to MAs showing correct and incorrect placement of the sensor strips.
Applying the TPB in a Human Factors Process
The TBP offered us a formalized framework to guide our thinking as we applied the traditional human factors tools of task analysis and heuristic evaluation. In the same way a heuristic analysis guides an human factors expert to formally consider system visibility and error prevention, the TPB guided us to consider the attitudes, social norms, and perceived/actual control the MAs had over the screening process. This was helpful as the human factors tools were biased toward human capability and limitation, while the TBP focused on belief and motivation. The most overlap occurred in the TBP attribute of actual behavioral control, but in this our human factors–centered considerations included a broader range control than in traditional TBP studies. Usually actual behavioral control in the TBP is linked closely to the environment, as in the aforementioned example of the number of sinks. We considered not only similar environmental constraints but also the lack of actual control we know that humans have over their memories, attention, and other limited cognitive resources (not traditionally considered in studies using the TPB).
Any intervention would have to address not only improved usability but also change the system that drives social norms, attitudes, and demonstrate to the MAs that they have control over the DR screening process. In Figure 3, we provided a method for linking potential interventions to the beliefs and actions within the TPB they were designed to affect.
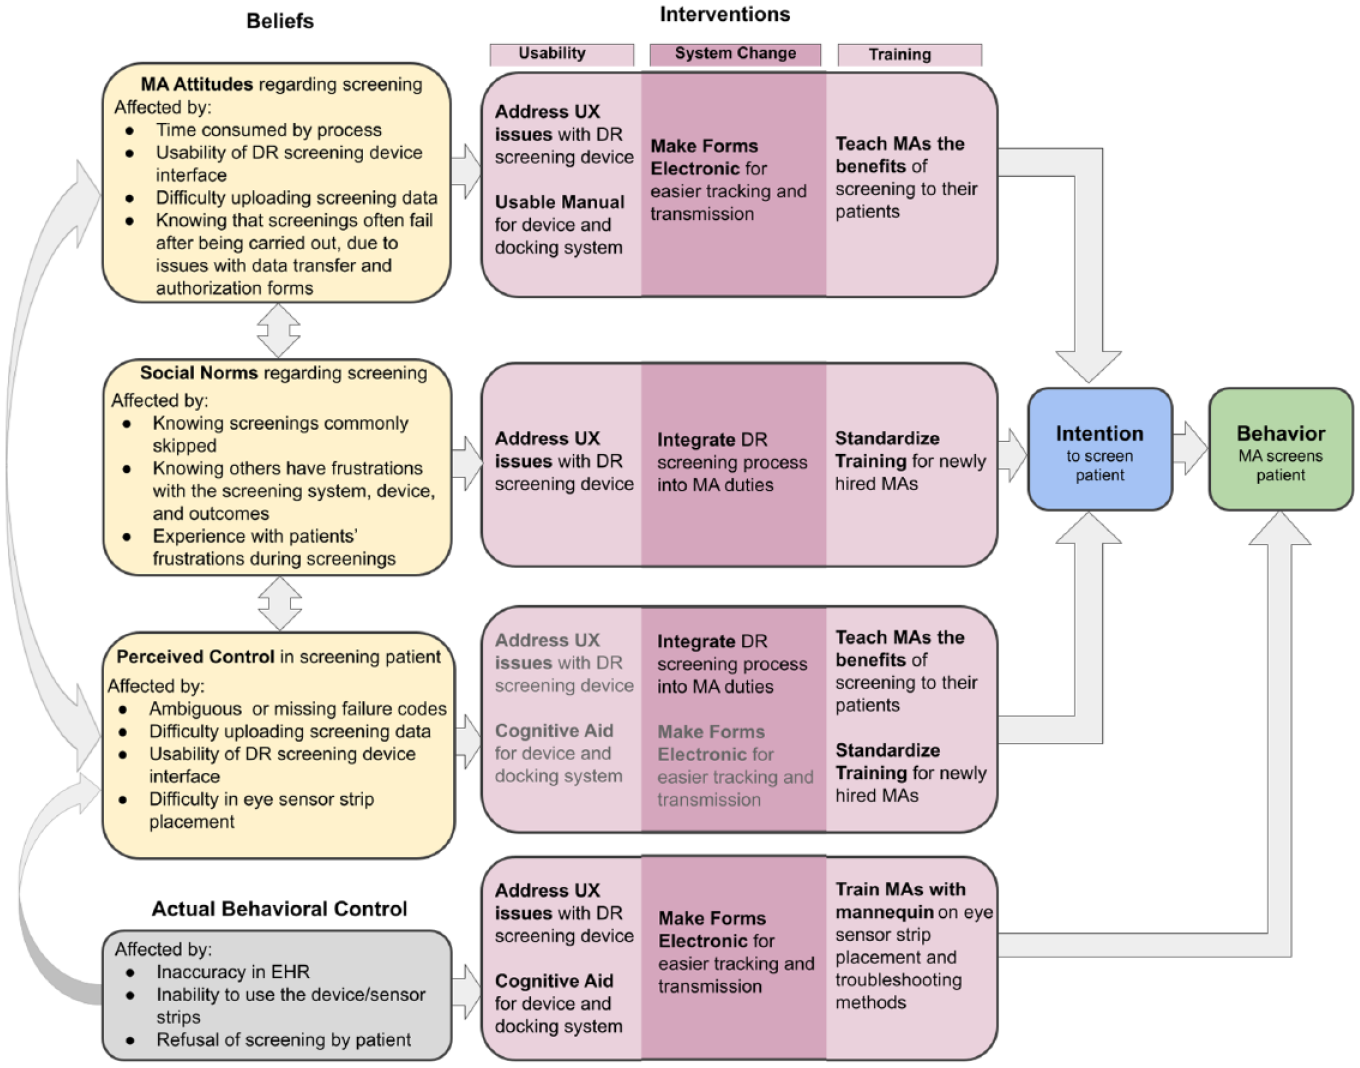
Description of the beliefs of the medical assistants situated within the theory of planned behavior as it applied to providing DR screening to patients. Beliefs present in the theory are linked to issues found in the task analysis and heuristic evaluation (yellow). These are then linked with potential interventions that fall under the general categories of usability, training, and system change (purple). Actual behavioral control, not a belief, has special status as it affects both perceived control and behavior directly. Interventions that would affect actual behavioral control are repeated in a light gray font for perceived behavioral control to show that they affect both.
Addressing the beliefs, intentions, and behaviors of the patients was a more complicated process, made more difficult by our lack of access to actual patients. Thus, to hypothesize interventions aimed at the patients, we relied on human factors expertise in usability and age-related differences. For the patient, screening could be more far reaching than a simple test result – it may give them “bad news” and create new anxieties along with the positive benefits of discovering a condition early enough to prevent blindness. Thus, helping patients form an intention to be screened would likely be influenced by their beliefs about their own disease management along with their beliefs about being screened. Unfortunately, as our task analysis uncovered, patients were not well-educated regarding DR before being asked to make a decision about screening. We combined the effects of screening information on patients, both good and bad, into our TPB/human factors diagram, as they both led to similar intervention solutions (Figure 4). The interventions linked to patient beliefs involved education with two foci. First, patients needed education about why DR screening would be beneficial – this included an explanation of DR, who is susceptible, the likelihood of vision loss, and the success of treatment options and their side effects. Second, patients needed education on the DR screening process – how long it would take, what would be involved, when to expect results, and the accuracy of screening findings. This would, in part, be addressed by empowering the MAs in providing information and answering patient questions. Patients needed this information explained to them in simple terms prior to being asked about screening.
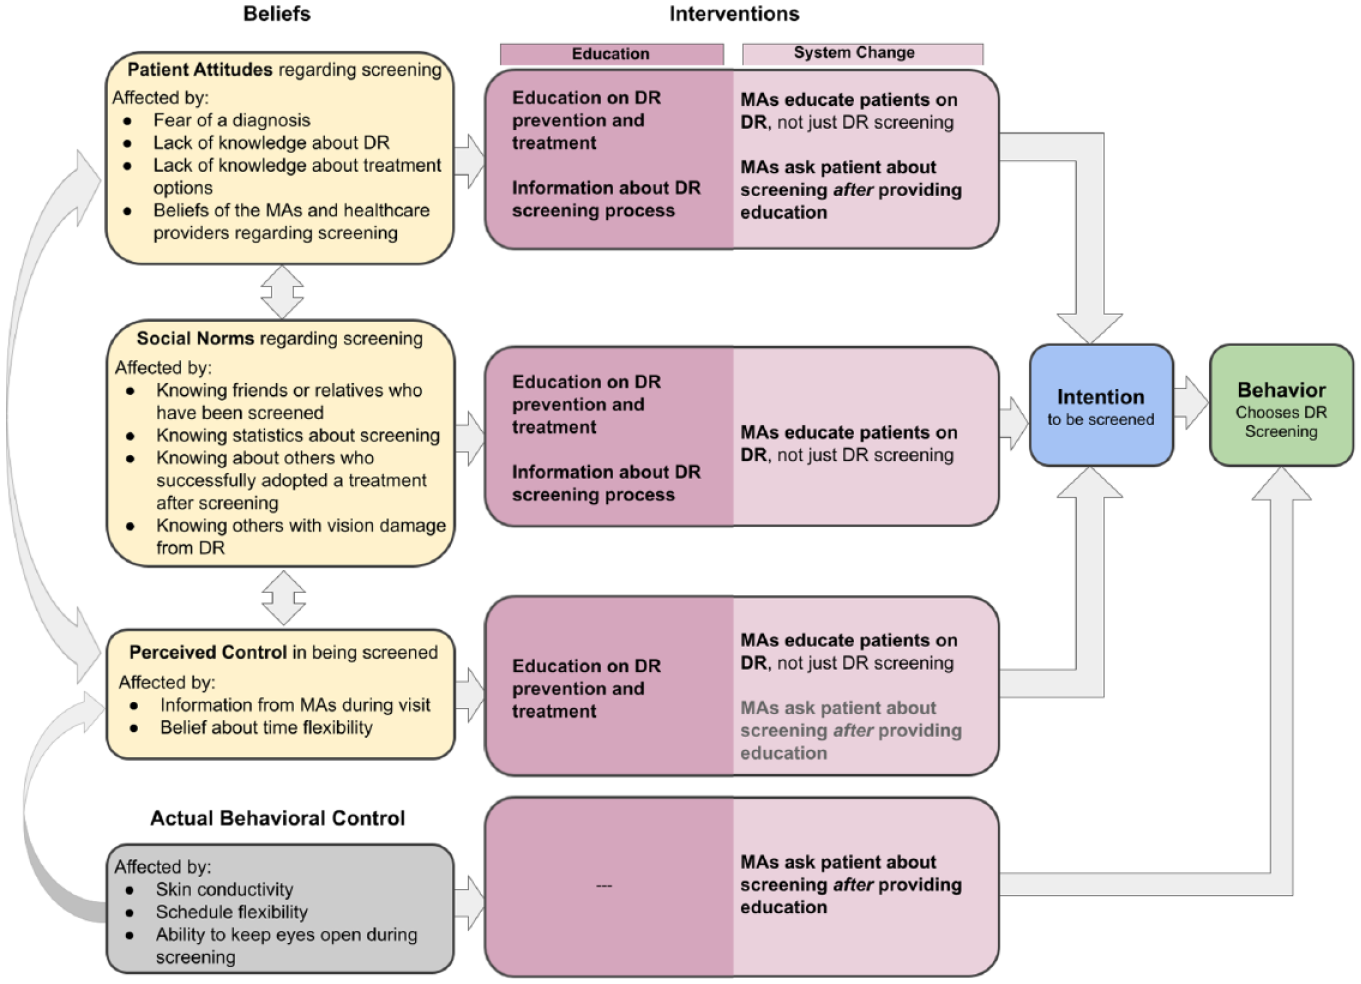
Description of the beliefs of the patients, as situated within the TPB, for influences on the intention patients have to receive DR screening. In comparison with the interventions proposed for the MAs in Figure 3, the interventions for patients focus on education, for informed decision making, and changes to the MA system to promote beneficial beliefs regarding DR screening (and potential subsequent treatment).
Patient Education Interventions
Because the patients make the ultimate decision regarding DR screening, we chose to implement an educational intervention for patients that supported the clinic workflow. Currently, when given the choice for screening, the patient has had no education about DR or the screening process from the clinic. To reduce the work burden of the MAs, we produced automated forms of education. We developed three methods of pre-visit education: a waiting room screen, waiting room commercial, and referral to the RCDR program’s own educational video that could be viewed on a mobile device. A sample of ten usability participants were recruited through research team contacts. Mean age was 33.5 years (SD = 14.3). Nine participants reported having a loved one with diabetes.
Waiting Room Screen
A slide was designed to be shown on a video screen, intended to rotate with other informational graphics. The selection of the text color and background were chosen to ensure ease in reading and comprehension (Figure 5, left). We showed this design to the nine participants who had a close contact with diabetes. We were unable to test this intervention in the clinic waiting room due to human subjects concerns over presenting in vitro diagnostic medical device information.
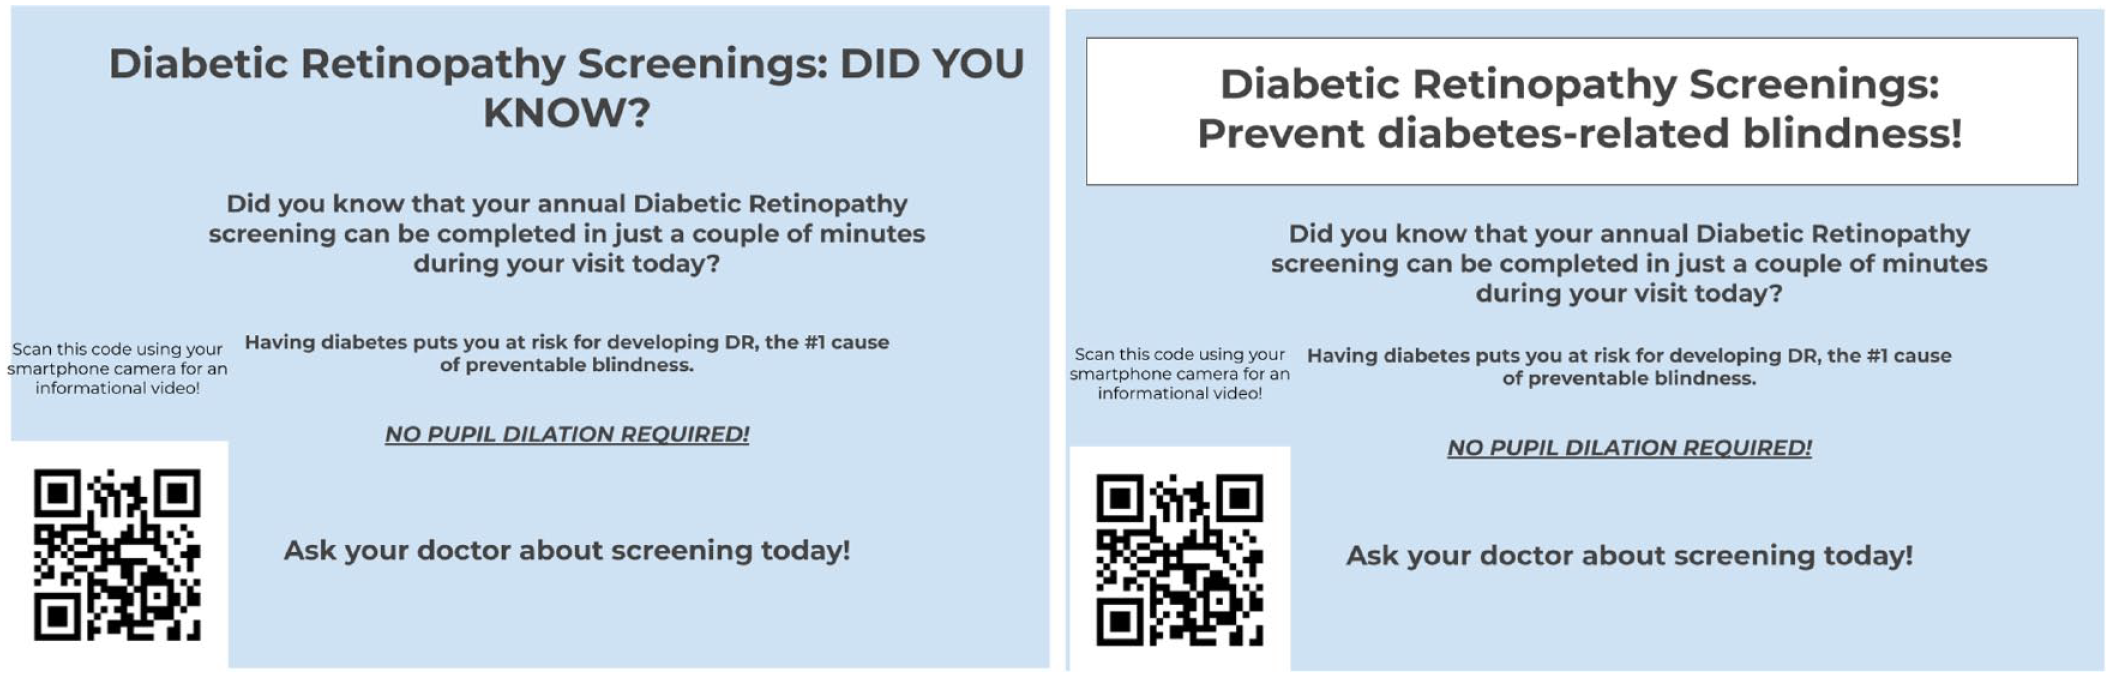
Waiting room slides. Static screen display provides information and a way to access a video without typing or memory for a URL. Left panel shows the original design. Right panel shows iterated design after usability evaluations.
Results
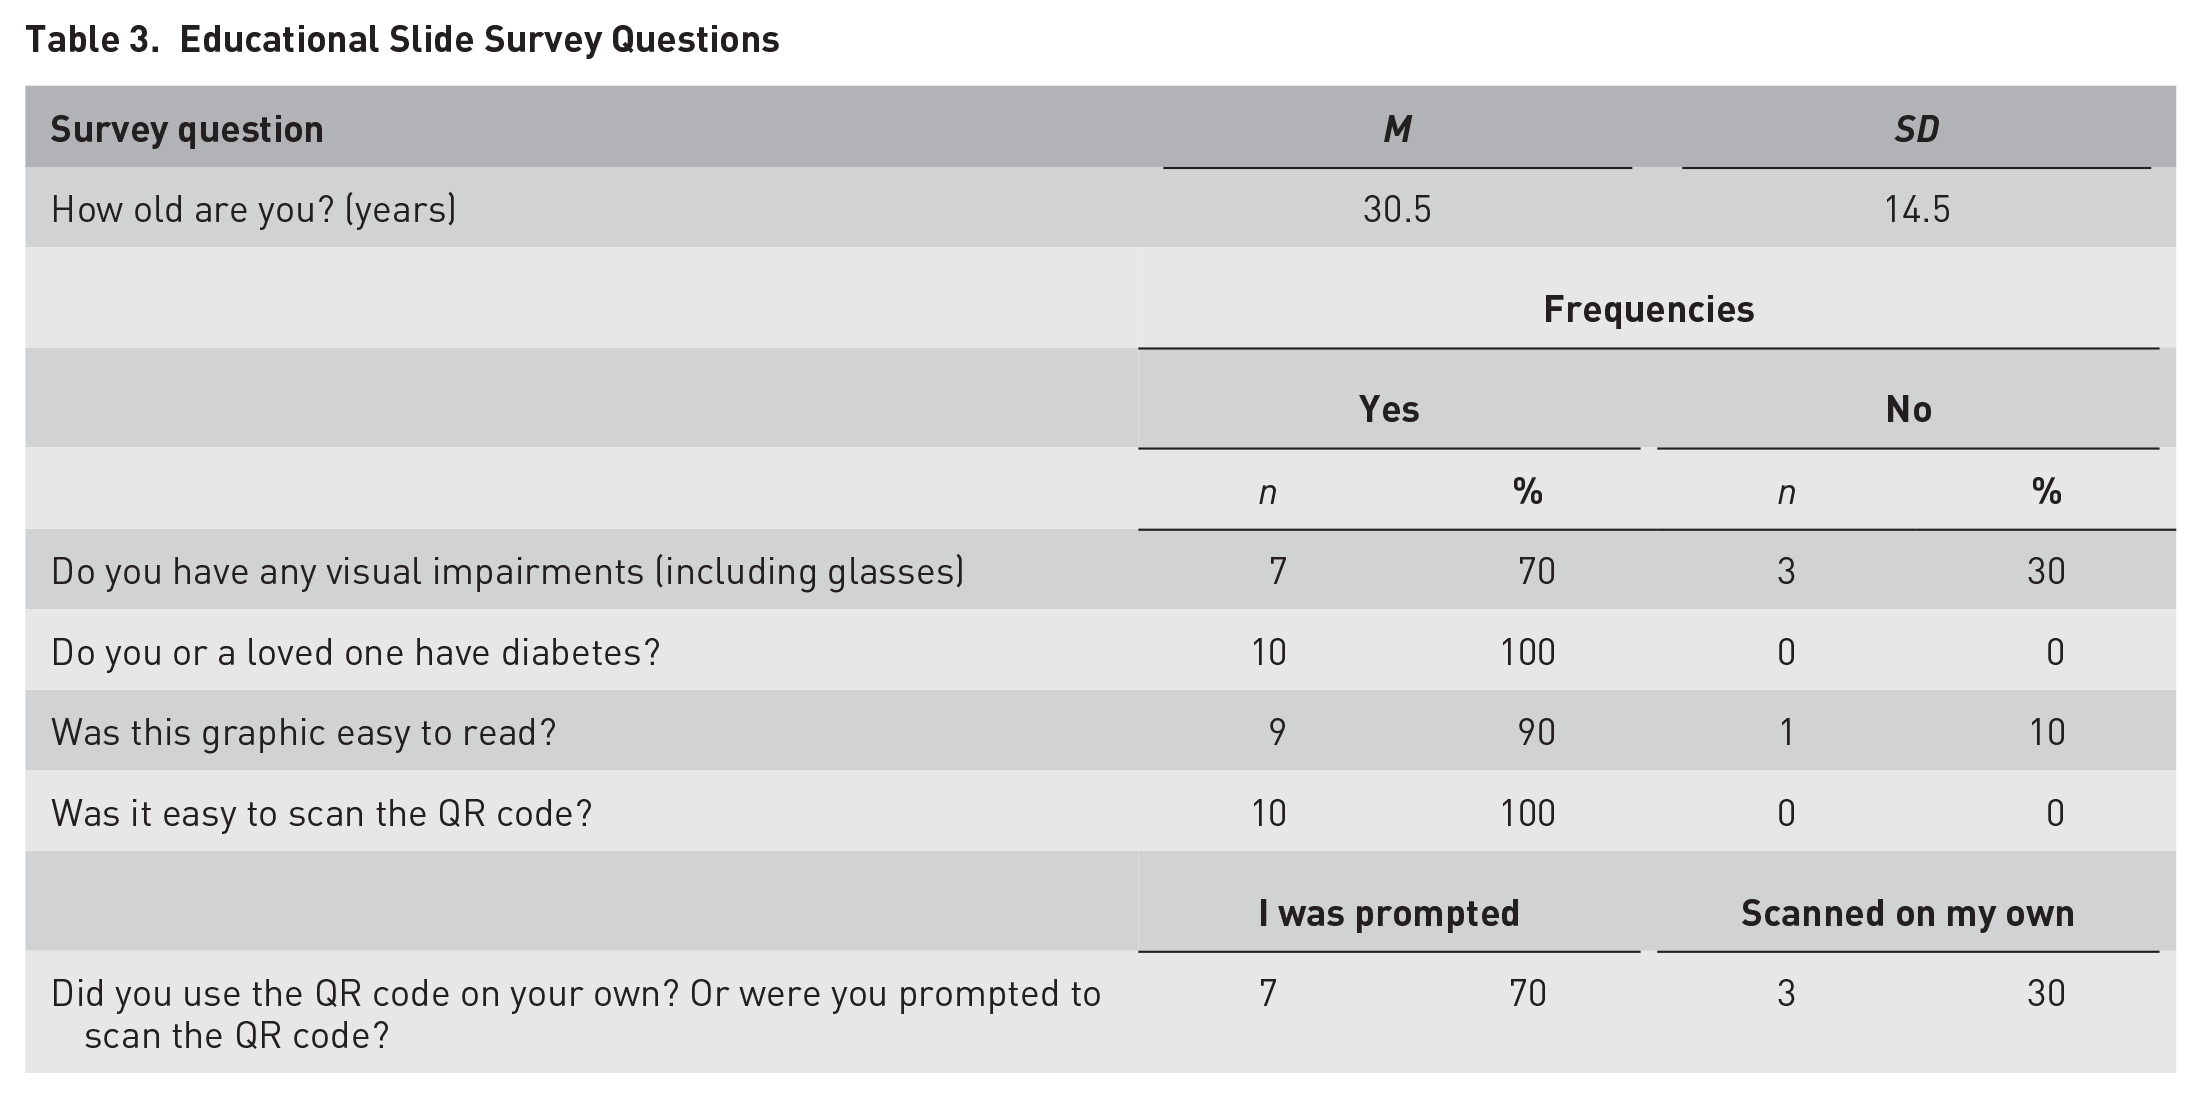
Our questions gauged the accessibility of the text and use of the QR code and how useful it was in encouraging DR screening (Table 3). Our most important measure was the question “What do you know about DR now that you didn’t before?” Participants were able to provide concrete answers after reading the slide (Table 4). We were most interested in their use of the QR code to access more information and found that every participant was able to use the camera app on their smartphone rather than any specialized QR code apps. Most participants also reported that, if they had diabetes, they would be very likely to ask their doctor about DR screening after reading the educational information. Eight out of nine participants found the slide easy to read. All participants recognized the purpose of the QR code and were able to scan it. The majority of participants felt that if they had diabetes they would ask about retinal screening after observing the slide (Figure 6).
Educational Slide Survey Questions
Information Learned Through the Educational Slide
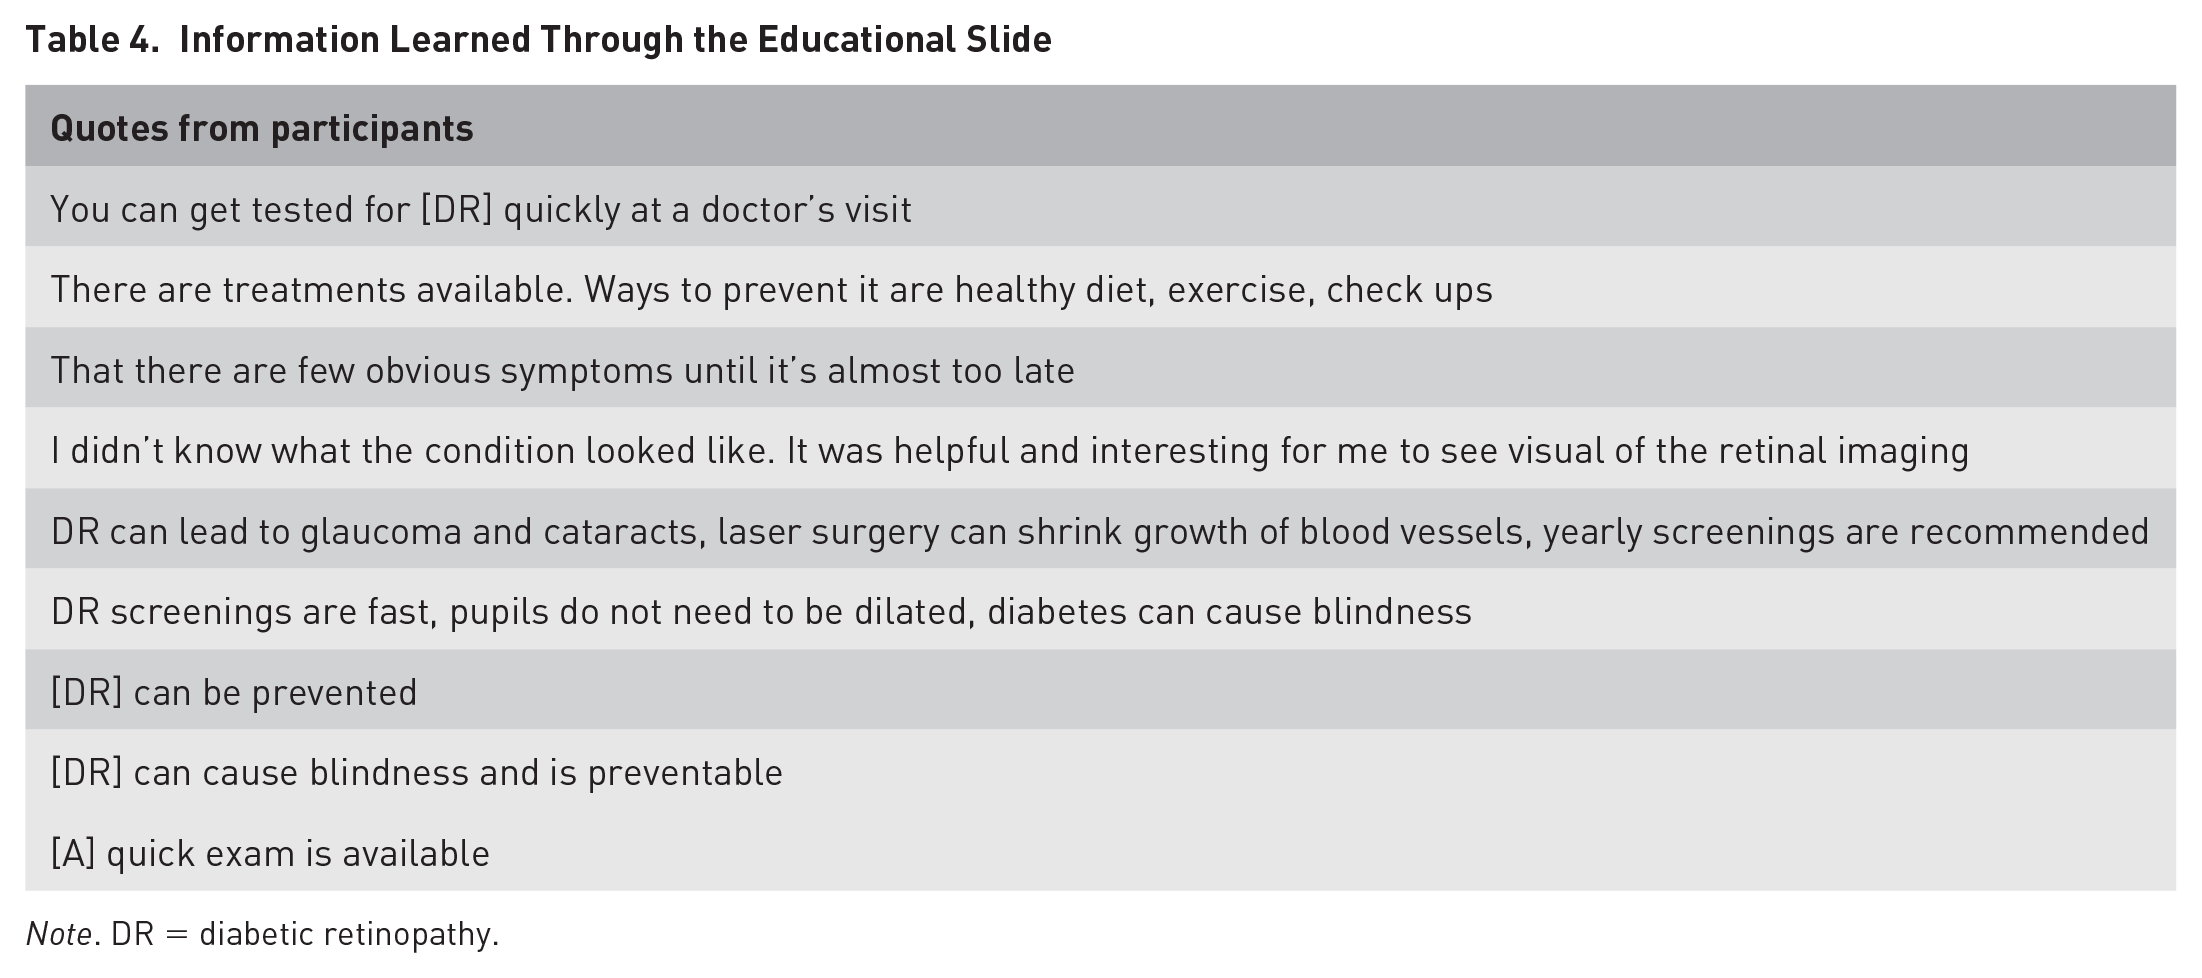
Note. DR = diabetic retinopathy.
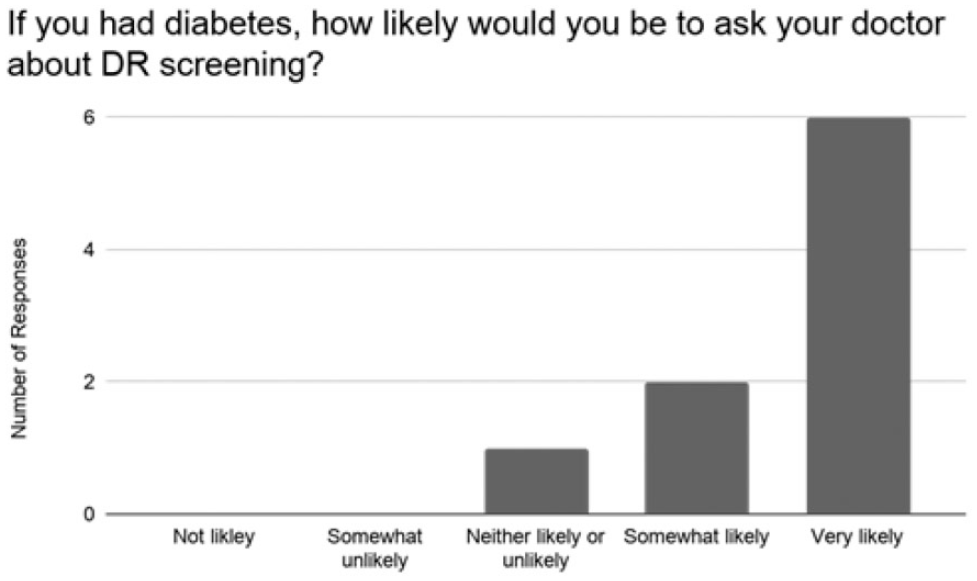
Likelihood of asking about diabetic retinopathy (DR) screening after observing the educational slide.
Participants suggested making the title more salient and creating a call to action. With those changes in mind, we redesigned the slide (Figure 5, right). The background of the title was outlined in a white rectangle instead of its original blue color. It was also suggested that the “Did you know?” text within the title was not a call to action for the users. Changing the text to “Prevent diabetes related blindness!” informed the user that diabetes can lead to blindness and encourages the user to read further to learn methods to prevent blindness. Last, research suggests that narrative videos are more memorable and persuasive than informational ones, thus having the video tell one patient’s story could enhance effectiveness (Braverman, 2008, Kreuter et al., 2010).
Waiting Room Video
We created a video for the waiting room with information about DR and the screening process (available in the online Supplemental Appendix). Providing something that the patients actively watch and listen to, along with the more emotive nature of the video, could be more attention grabbing and persuasive. Significant aspects of the video included a brief description of DR, awareness of testing without dilation, and availability of the test in the clinic. Information was framed as a gain (maintaining sight) as this has been shown to promote higher rates of screening for other diseases (Apanovitch et al., 2003). The video was less than a minute and covered information key to TPB beliefs.
Results
We administered a brief survey before and after participants viewed the video. All but one of the participants reported an improvement in knowledge after the video (Figure 7). Most found the video effective at teaching and stated they would be willing to be screened after viewing it (Figure 8).
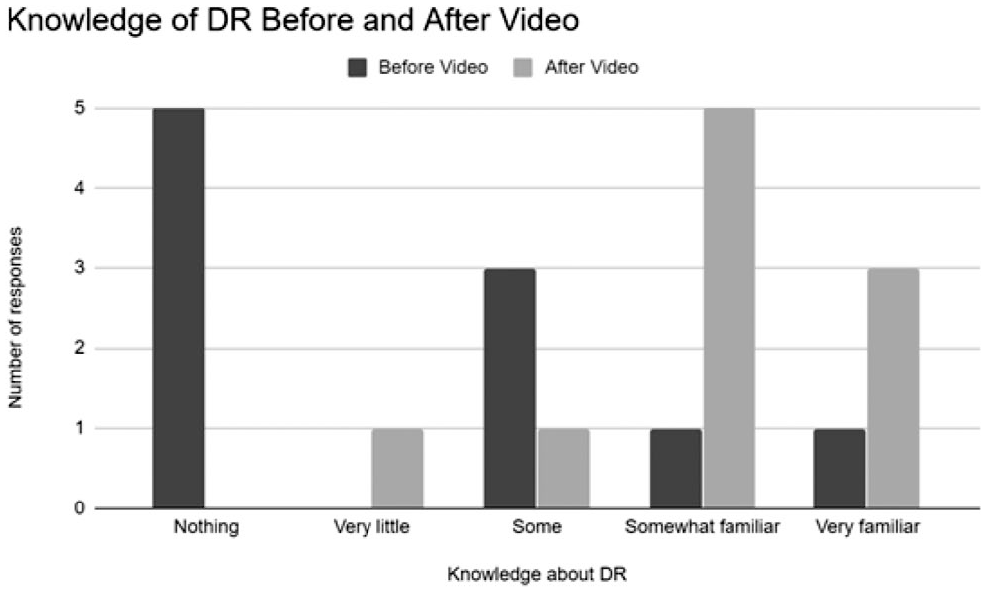
Knowledge about diabetic retinopathy (DR) before and after the informational video.
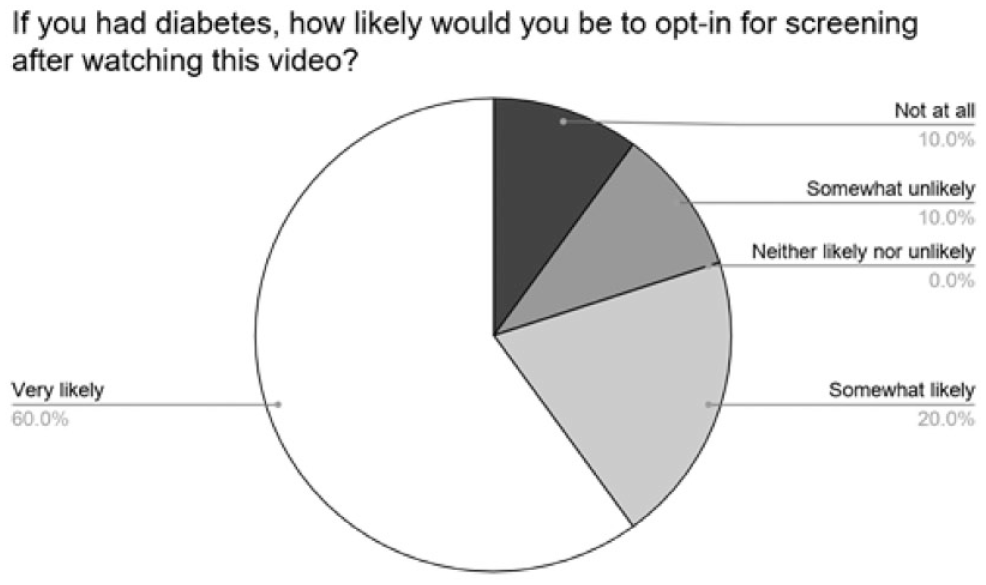
Participants overall reported they would likely ask about screening after watching the video.
Overall, our survey suggested the short video was an effective tool to educate patients on DR and screening. Suggested improvements were to have a louder voice-over volume, end the video with a call to action via a patient talking with their doctor and subsequently getting screened for DR, and the final clip should include a more aesthetically pleasing tone. The final video was provided to Retinal Care as a prototype for one they could create and distribute to clinics.
Discussion
Through evaluation of the system, it became apparent that there were multiple aspects of the patient visit that were contributing to the lack of screenings. We applied traditional human factors methods (interviews, task analysis, heuristic evaluation) to understand the issues, then positioned solutions framed in TPB. This ensured our solutions were not piecemeal – they were linked to the attitudes, social norms, perceived, and actual behavioral control that should be expected to change the screening behaviors of the MAs and the patients. This also ensured our interventions were inspired by psychological theory, generally found to be more successful than atheoretical interventions (Hilliard et al., 2018; Joseph et al., 2016; Steinmetz et al., 2016). We designed one intervention for patient education, chosen because we expected targeting patient intentions would ease the workload of the MAs while also increasing the likelihood of screening.
Future Directions
An important next step in evaluating these two interventions would be to implement them in multiple clinics and measure change in screening rates. Surveys, while helpful in this formative stage, will not be enough of a measure after an intervention stage. While screening rates would be the gold standard of intervention success, we also suggest measuring the time an MA spends with each patient, the number of patients seen each day, and the wait time for a patient after arrival at the clinic. We suggest measuring the subjective workload of the MAs pre- and postintervention, as their perceptions of their work may not be reflected in performance measures (e.g., performance measures do not change, but perceptions in workload are reduced). Last, we need more information on patient knowledge and needs regarding DR, particularly patients with diabetes at different ages, to potentially tailor the education and messaging provided in an intervention study.
Limitations
Since this study was conducted, the screening environment has changed due to the COVID-19 pandemic. This rare event affected our follow up of intervention effectiveness, as clinics first closed, and then reopened in limited capacities. Furthermore, patients scheduled fewer appointments, meaning fewer screening opportunities at the clinics. However, we also believe that the pandemic underlined the need for a smooth screening process at primary care clinics. Patients can be screened for DR in a single visit, rather than scheduling multiple appointments with primary care and ophthalmologists. Because the conditions that bring them to primary care are often more visible symptom-wise than DR (e.g., diabetes), it may be less likely they would delay these appointments.
Another limitation of our work was the lack of interaction we were allowed with MAs and patients. We relied on the extensive experience of Retinal Care employees, particularly the RCDR coordinator who had been embedded in the clinic, training the first MAs, providing some screenings to patients, observing new MA hires trained by other MAs, and who collected the data on patient eligibility from electronic health records versus the actual screening rate of the clinic. In an ideal study we would have been able to interview MAs/patients and perform contextual inquiry at the clinic.
A last limitation was that we investigated DR screening for a single clinic. From the RCDR coordinator, we learned of idiosyncrasies between clinics that would have affected our analysis and the deployment of some interventions. Though these idiosyncrasies limit the generalizability of our particular interventions, we wish to emphasize that it is the process by which we gained the knowledge to create these interventions that is generalizable: traditional human factors methods paired with guidance from the TPB on how belief and motivation affect behavior.
Conclusion
In closing, human factors psychology is an interdisciplinary field. We draw information, tools, and methods from a wide span of disciplines. In the current project this afforded us the unique position of incorporating theories of behavior with task analysis and usability methods to gain insight into the system of MAs, patients, and the environment of the clinic to reduce the barriers of DR screening while increasing the motivation to be screened.
The Theory of Planned Behavior and the Integrated Behavior Model
The theory of planned behavior (TBP) included the traits, states, and other beliefs that predicted intention, and thus indirectly, behavior. However, the TPB did not address other attributes of a person and their environment or their interaction – it assumes that a behavior is possible, and thus the person’s intent is a good predictor of eventual behavior. An improved and updated model for behavior was the integrated belief model (IBM), which shared the attitude and belief characteristics of the TPB, but added four important influences (Montaño & Kasprzyk, 2015). First, the actual level of behavioral control, now called environmental constraints, was added. Second, the knowledge and skills needed for a behavior needed to be present. Third, habit or automatic behaviors affected behavior. Fourth, the obviousness that a behavior is needed or desired (salience) affected behavior. All of these affected behavior directly, bypassing intention.
Although models such as the TBP and IBM were designed with health behaviors in mind, such as seat belt use, sun protection, and smoking cessation, they can help focus user experience studies. For example, the elicitation questions used for the IBM include “What things make it hard for you to insert behavior?” “If you want to do insert behavior, how certain are you that you can?” As with many tools used in human factors studies, the set of questions help formalize measurement and ensure important information is included. This can be combined with human factors expertise in “environmental constraints,” “habit” (i.e., automaticity), “salience,” and assessment of “knowledge and skill.”
Understanding the intersection of humans, technology, and the environment is a specialty of human factors. Often, human factors studies consider the effects of systems and environment on behavior, such as affordances and perceptual biases, rather than the internal beliefs such as social norms included in the TBP and IBM. Thus, combining knowledge from human factors and theories of behavior creates a stronger model for expected choices and behavior. Combining these considerations in the usability process should result in technology and interfaces that are easy to understand, able to be used, and motivate use.
Supplemental Material
sj-pdf-1-erg-10.1177_10648046211039911 – Supplemental material for A Human Factors Evaluation of a Screening System for Diabetic Retinopathy Centered in Psychological Theory
Supplemental material, sj-pdf-1-erg-10.1177_10648046211039911 for A Human Factors Evaluation of a Screening System for Diabetic Retinopathy Centered in Psychological Theory by Alexander T. Casimir, Adrian M. Pavone, Abby Faircloth, Amina Khan, Ommar Khawaja, Landon Grace, Stephen Fransen and Anne Collins McLaughlin in Ergonomics in Design: The Quarterly of Human Factors Applications
Footnotes
![]() .
.
References
Supplementary Material
Please find the following supplemental material available below.
For Open Access articles published under a Creative Commons License, all supplemental material carries the same license as the article it is associated with.
For non-Open Access articles published, all supplemental material carries a non-exclusive license, and permission requests for re-use of supplemental material or any part of supplemental material shall be sent directly to the copyright owner as specified in the copyright notice associated with the article.