
Abstract
This article examines the user’s first experience with a new software application called the user onboarding process. In addition, we conducted a series of usability experiments with 18 participants, which were supported by eye tracking technology, to explore the effectiveness of different user onboarding solutions, exemplified by the newest version of Paint. We also explored users’ feedback on onboarding solutions in a series of interviews. The results showed that user onboarding solutions are generally effective, making it worthwhile for computer software companies to provide them to support new users’ activity as well as to increase the value of their products.
The Significance of Software Ergonomics
As software became popular from the 1980s onward, the field of human–computer interaction was born. Developers and ergonomics professionals started working together to build more and more user-friendly interfaces (Hustak & Krejcar, 2016). Software that has a user-friendly interface and follows ergonomic guidelines enhances the working experience, reduces the number of errors stemming from incorrect use, and guarantees the exploitation of all the services of the software. The aim of software ergonomics, therefore, is to make digital products easy to use while ensuring that they live up to user requirements (Knittle et al., 1986).
Software ergonomics has lately become one of the key aspects of software development, making usability a central issue and a focus on later user experience (UX) essential (Hartson & Pardha, 2019; Knight, 2019). These concepts are defined differently in the literature and in standards. Nielsen (1994), for example, regards usability as a multidimensional concept, which can be interpreted along the lines of subdimensions such as learnability, efficiency, memorability, errors, and satisfaction. However, UX amounts to more than usability, because the expression refers to the sum of impressions and feelings that are aroused in a user while they are using the product (Quiñones et al., 2018).
Since UX has become a trending topic, it is now widely accepted that it should be an integral part of the entire software design process – from the early concept to the released product (Kapusy & Lógó, 2020). The design process should also consider it worthwhile to pay attention to the first UX, which is formed during the onboarding period, when the user is using the product for the first time. The time of the first interactions between the user and the product is the moment where motivations come into play, so effective onboarding is essential for any software whose developers are interested in acquiring more users or subscribers. Consequently, the overall strategy (the flow, messages, interactions, and user interface design elements) should be planned carefully to support new users’ engagement (Cardoso, 2017). Among UX experts, effective user onboarding – which describes the path of sequential steps and interactions that users go through with a product – is considered to be the most important part of the user journey due to its potential to reduce user churn by guiding users to a better understanding of the value of a software application while they are still exploring it (Terres et al., 2020).
Following the expansion of the software market, onboarding became an important element contributing to a digital product’s success; therefore, it is worth dealing with it in all cases. The goal is to provide a positive experience for the software’s user right from the first use (onboarding period) when they merely learn how to use the software, because effective user onboarding positively affects users’ intentions to use a product; it thereby actively shapes the users (Terres et al., 2020).
About User Onboarding
The expression of “onboarding” became known mostly in human resources, where it means the efficient integration of newcomers to the organization. This is quite an important process, for it is in the interests of every employer to make it easy for new colleagues to settle in; to integrate them into the work processes and to have them build good relations with other employees (Bauer & Erdogan, 2011).
The short period when a new user tries out a product for the first time and comes to understand what exactly it is for can be considered the onboarding phase in the field of software ergonomics. In a broader sense, there are three separate parts of the onboarding process according to Agrawal (2019) during which the potential user becomes a power user (Figure 1).
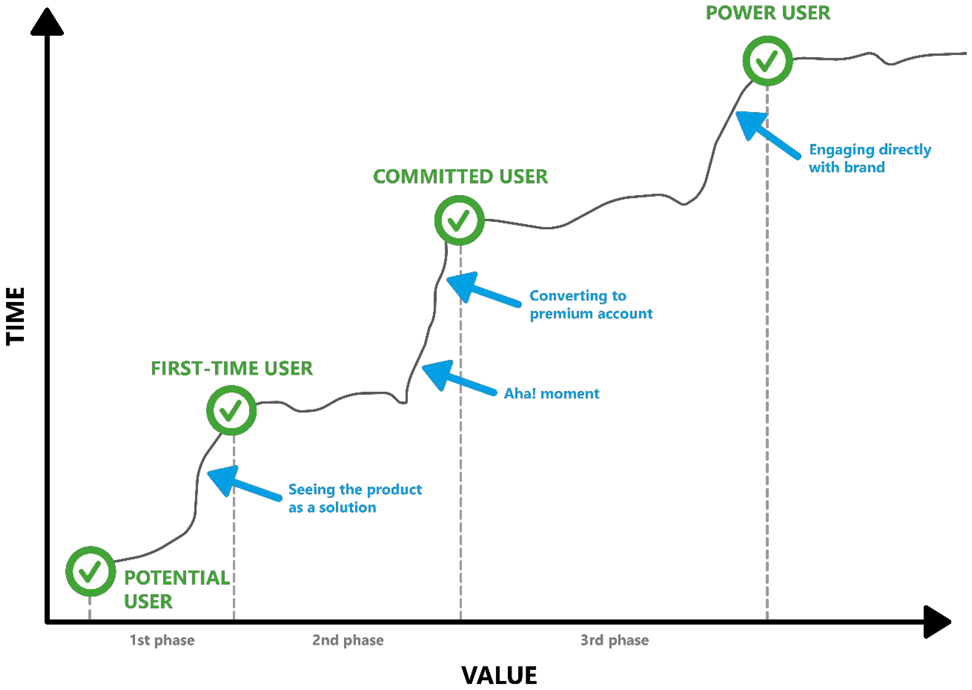
Evolution of user levels during onboarding.
In practical terms, onboarding begins with information seeking (first phase). This is when potential users see the product as a possible solution to their problems. This is followed by the part (second phase) that determines if the user realizes the true value of the product (Aha! moment) and becomes a dedicated user or not. The Aha! moment is the result of an unexpected, intuition-based enlightenment that leads to a sudden understanding of a hitherto unsolved problem or situation (Kounios & Beeman, 2009). Hence, it is important to demonstrate the real value of the product during its first use, because this helps users get to the Aha! moment.
In this phase, all user onboarding solutions enhancing the first use of the product are important to make sure that users feel happy and subscribe (good examples of this are tutorial videos, tooltips, or interactive product tours).
Encouraging frequent use of the product – to boost the value of the product – requires different tasks at different times during the whole onboarding process (Table 1). We have to choose the right channels and the appropriate tools to support the users in becoming experts and developing an emotional attachment to the software product and a commitment to the brand (third phase; Agrawal, 2019).
The Combination of Timing, Task, Channel, and Tools in Each Phase
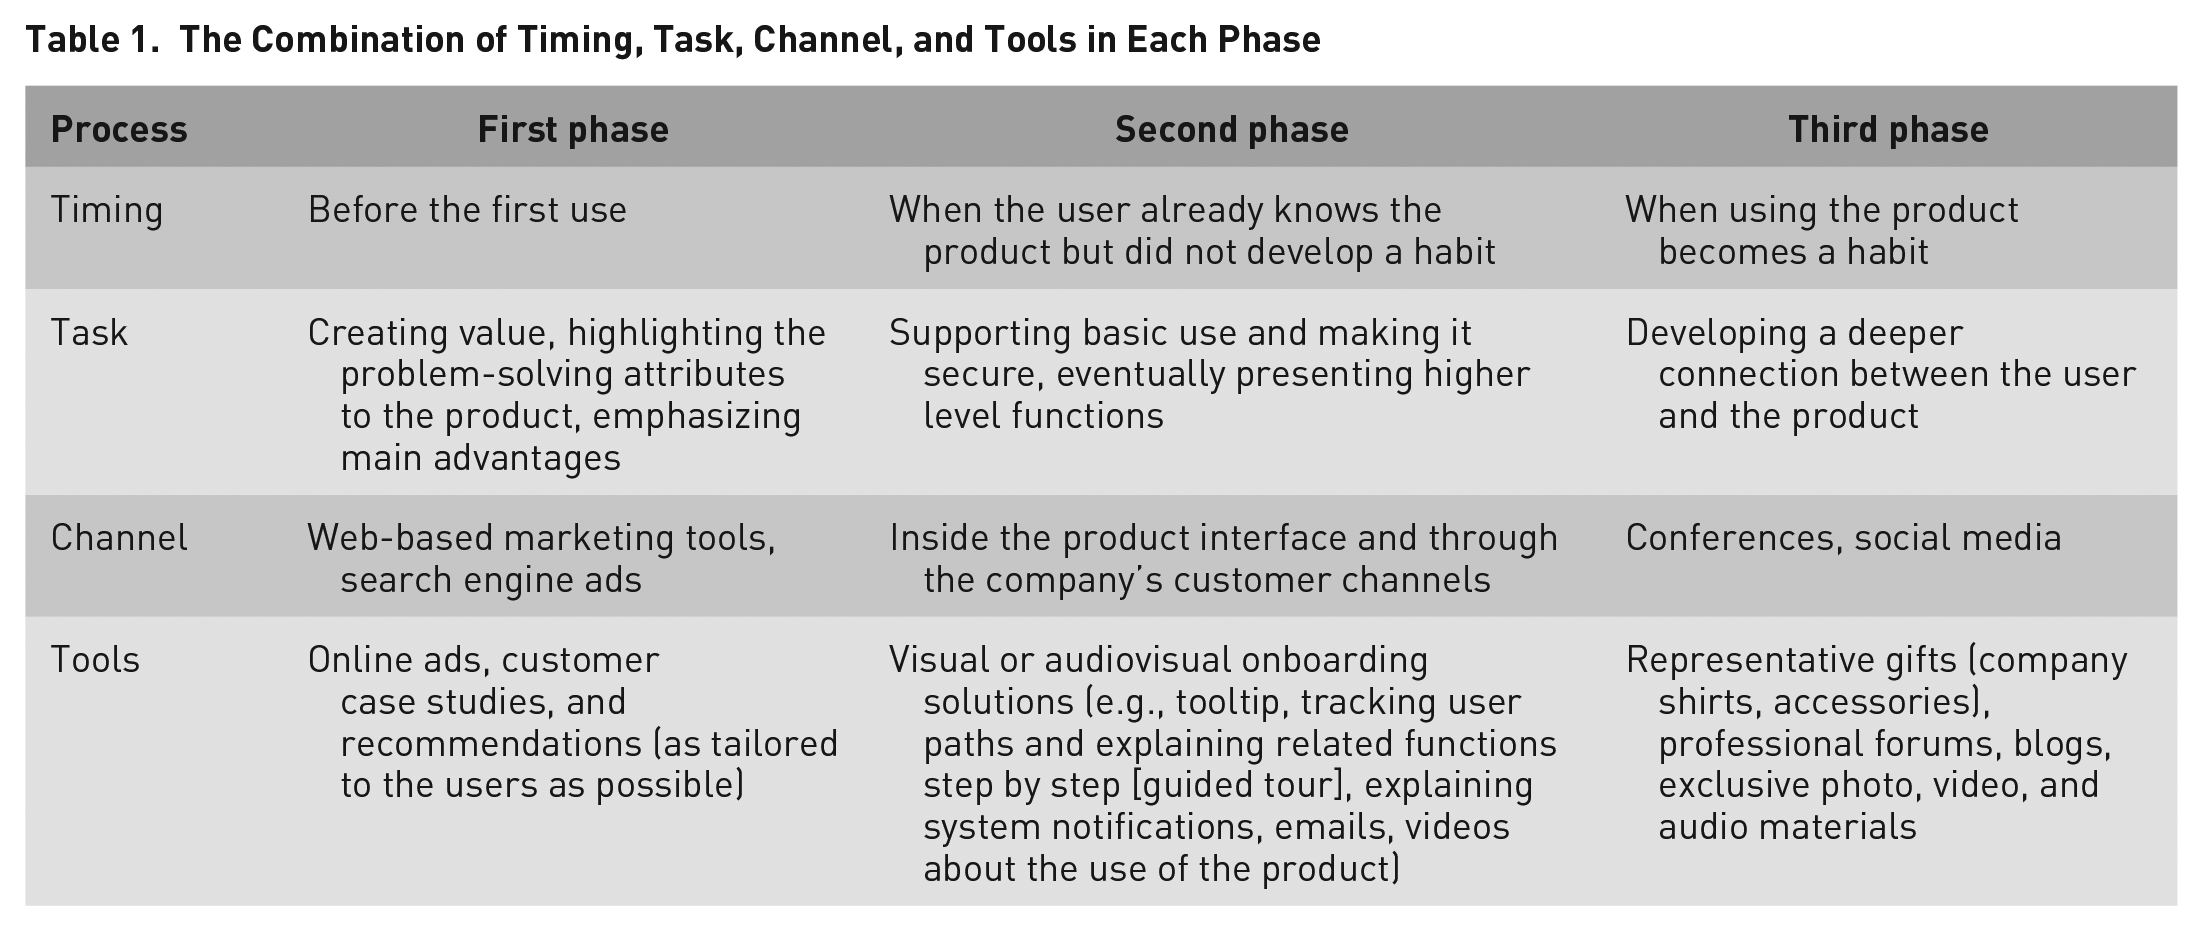
As seen in Table 1, the user onboarding solutions appearing in the second phase play a crucial role in the whole process: They support the users during their first time with the product to discover the values of the product. According to Hulick (2014), user onboarding increases the chance that users become successful when they first use the product. Singer (2011) notes that user onboarding is the process that convinces the customer to return. The relation between the user and the software starts here, so we must elaborately plan all elements (strategy, messages, interactions, design elements etc.) to boost UX and support the commitment of new users.
Scientific Overview of User Onboarding
There are some scientific publications in this field, but they examine the efficiency of onboarding solutions related to web-based products mostly not in an empirical but in a heuristic way. Cardoso (2017) investigates the effect of the first UX on commitment in the case of crowdsourcing websites. In contrast, a German research group outlined the onboarding tools of massive open online courses and suggested an ideal solution that can be applied in similar learning management systems (Renz et al., 2014). One of the newest, empirical studies in the field examines the effect of financial incentives offered during the onboarding process on customer behavior, exemplified by a car rental interface (Lu & Ou, 2018). A study from last year shows the user problems surfacing after the installation of the Snapchat application, with the help of usability testing and affinity diagram. They measured how easily the users can navigate the application during their first time with the product (Kapusy & Lógó, 2020). Thus, the examination of the efficiency of different onboarding solutions in software products is a terra incognita, and it is also scientifically novel.
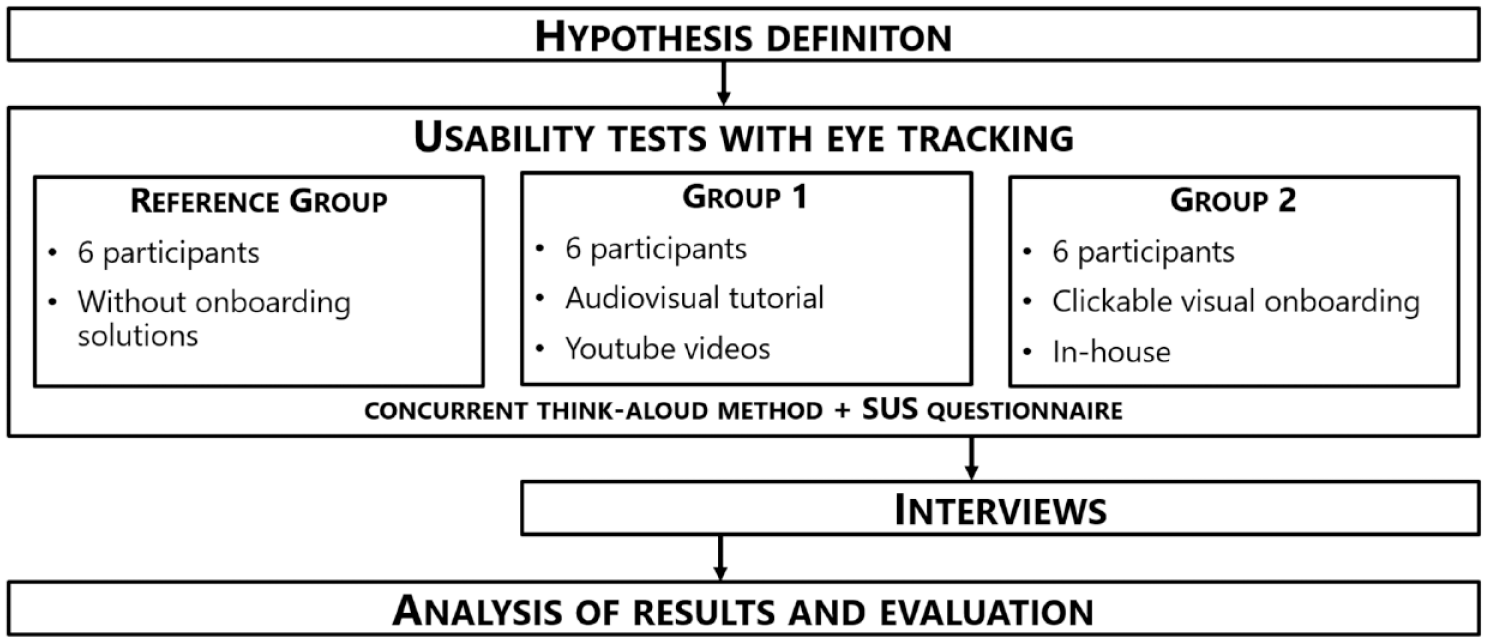
The Aim of the Study and Applied Methodology
The aim of this study is the examination of the efficiency of two well-known onboarding practices. The research involved 18 people (nine women, nine men) from the 20 to 35 years age-group (24.7 on average with a 3.66 standard deviation). The participants had to perform different tasks in Paint 3D as part of the usability test. Only a couple of participants knew about the program before, but nobody used it to solve a specific task. They, however, were already users of other graphics and/or designing programs (e.g., Photoshop, InDesign, Illustrator) due to studies or work.
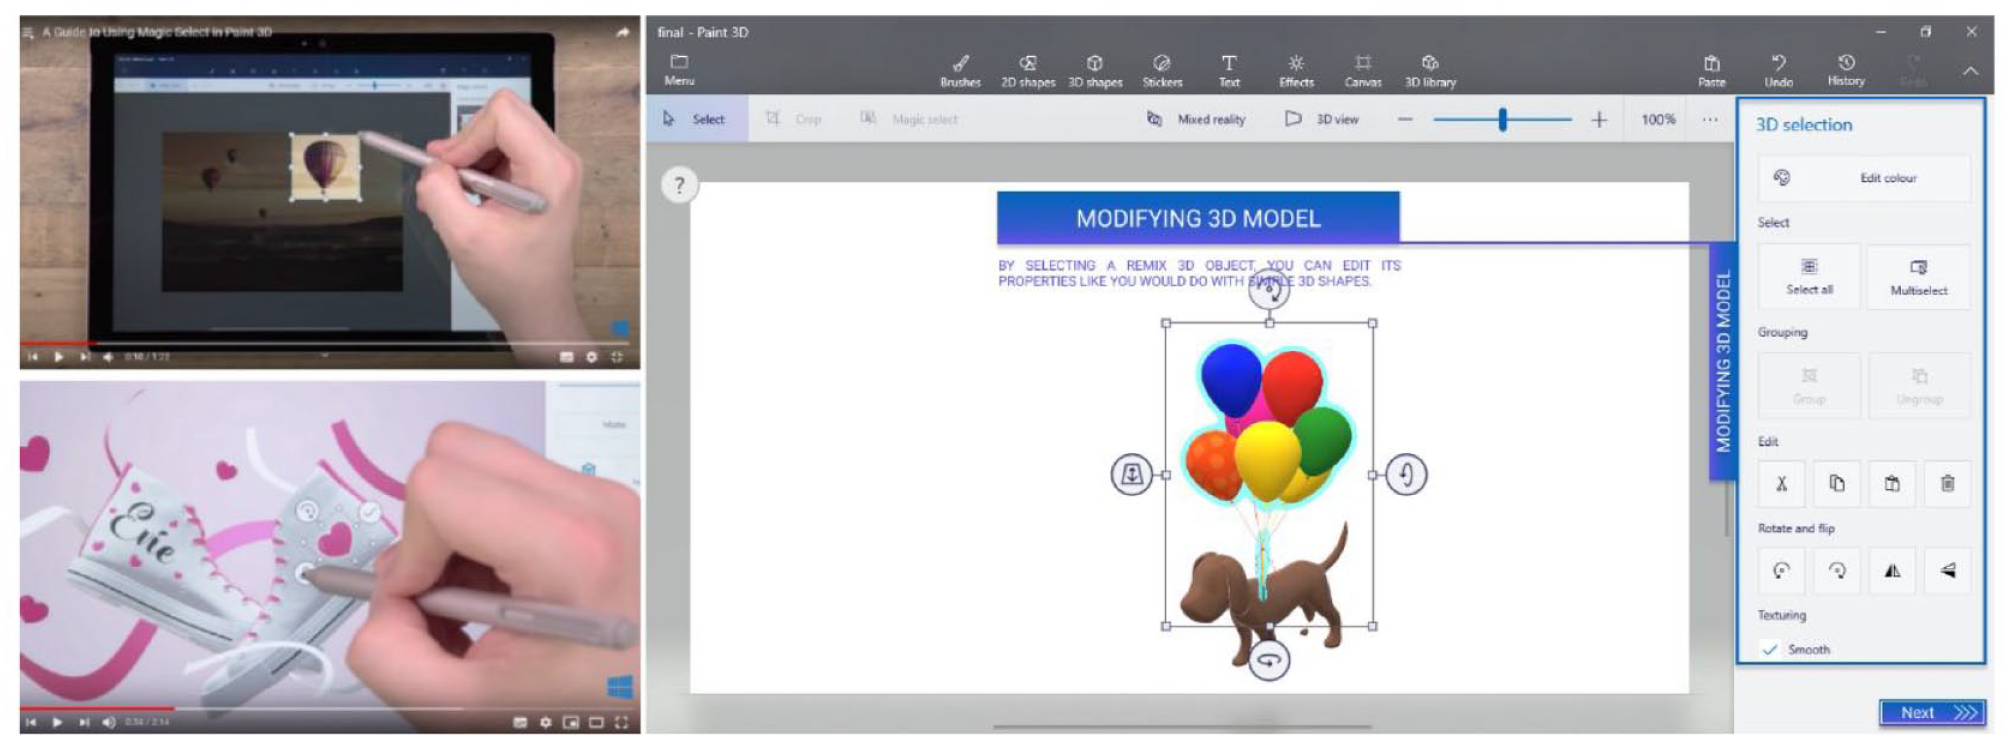
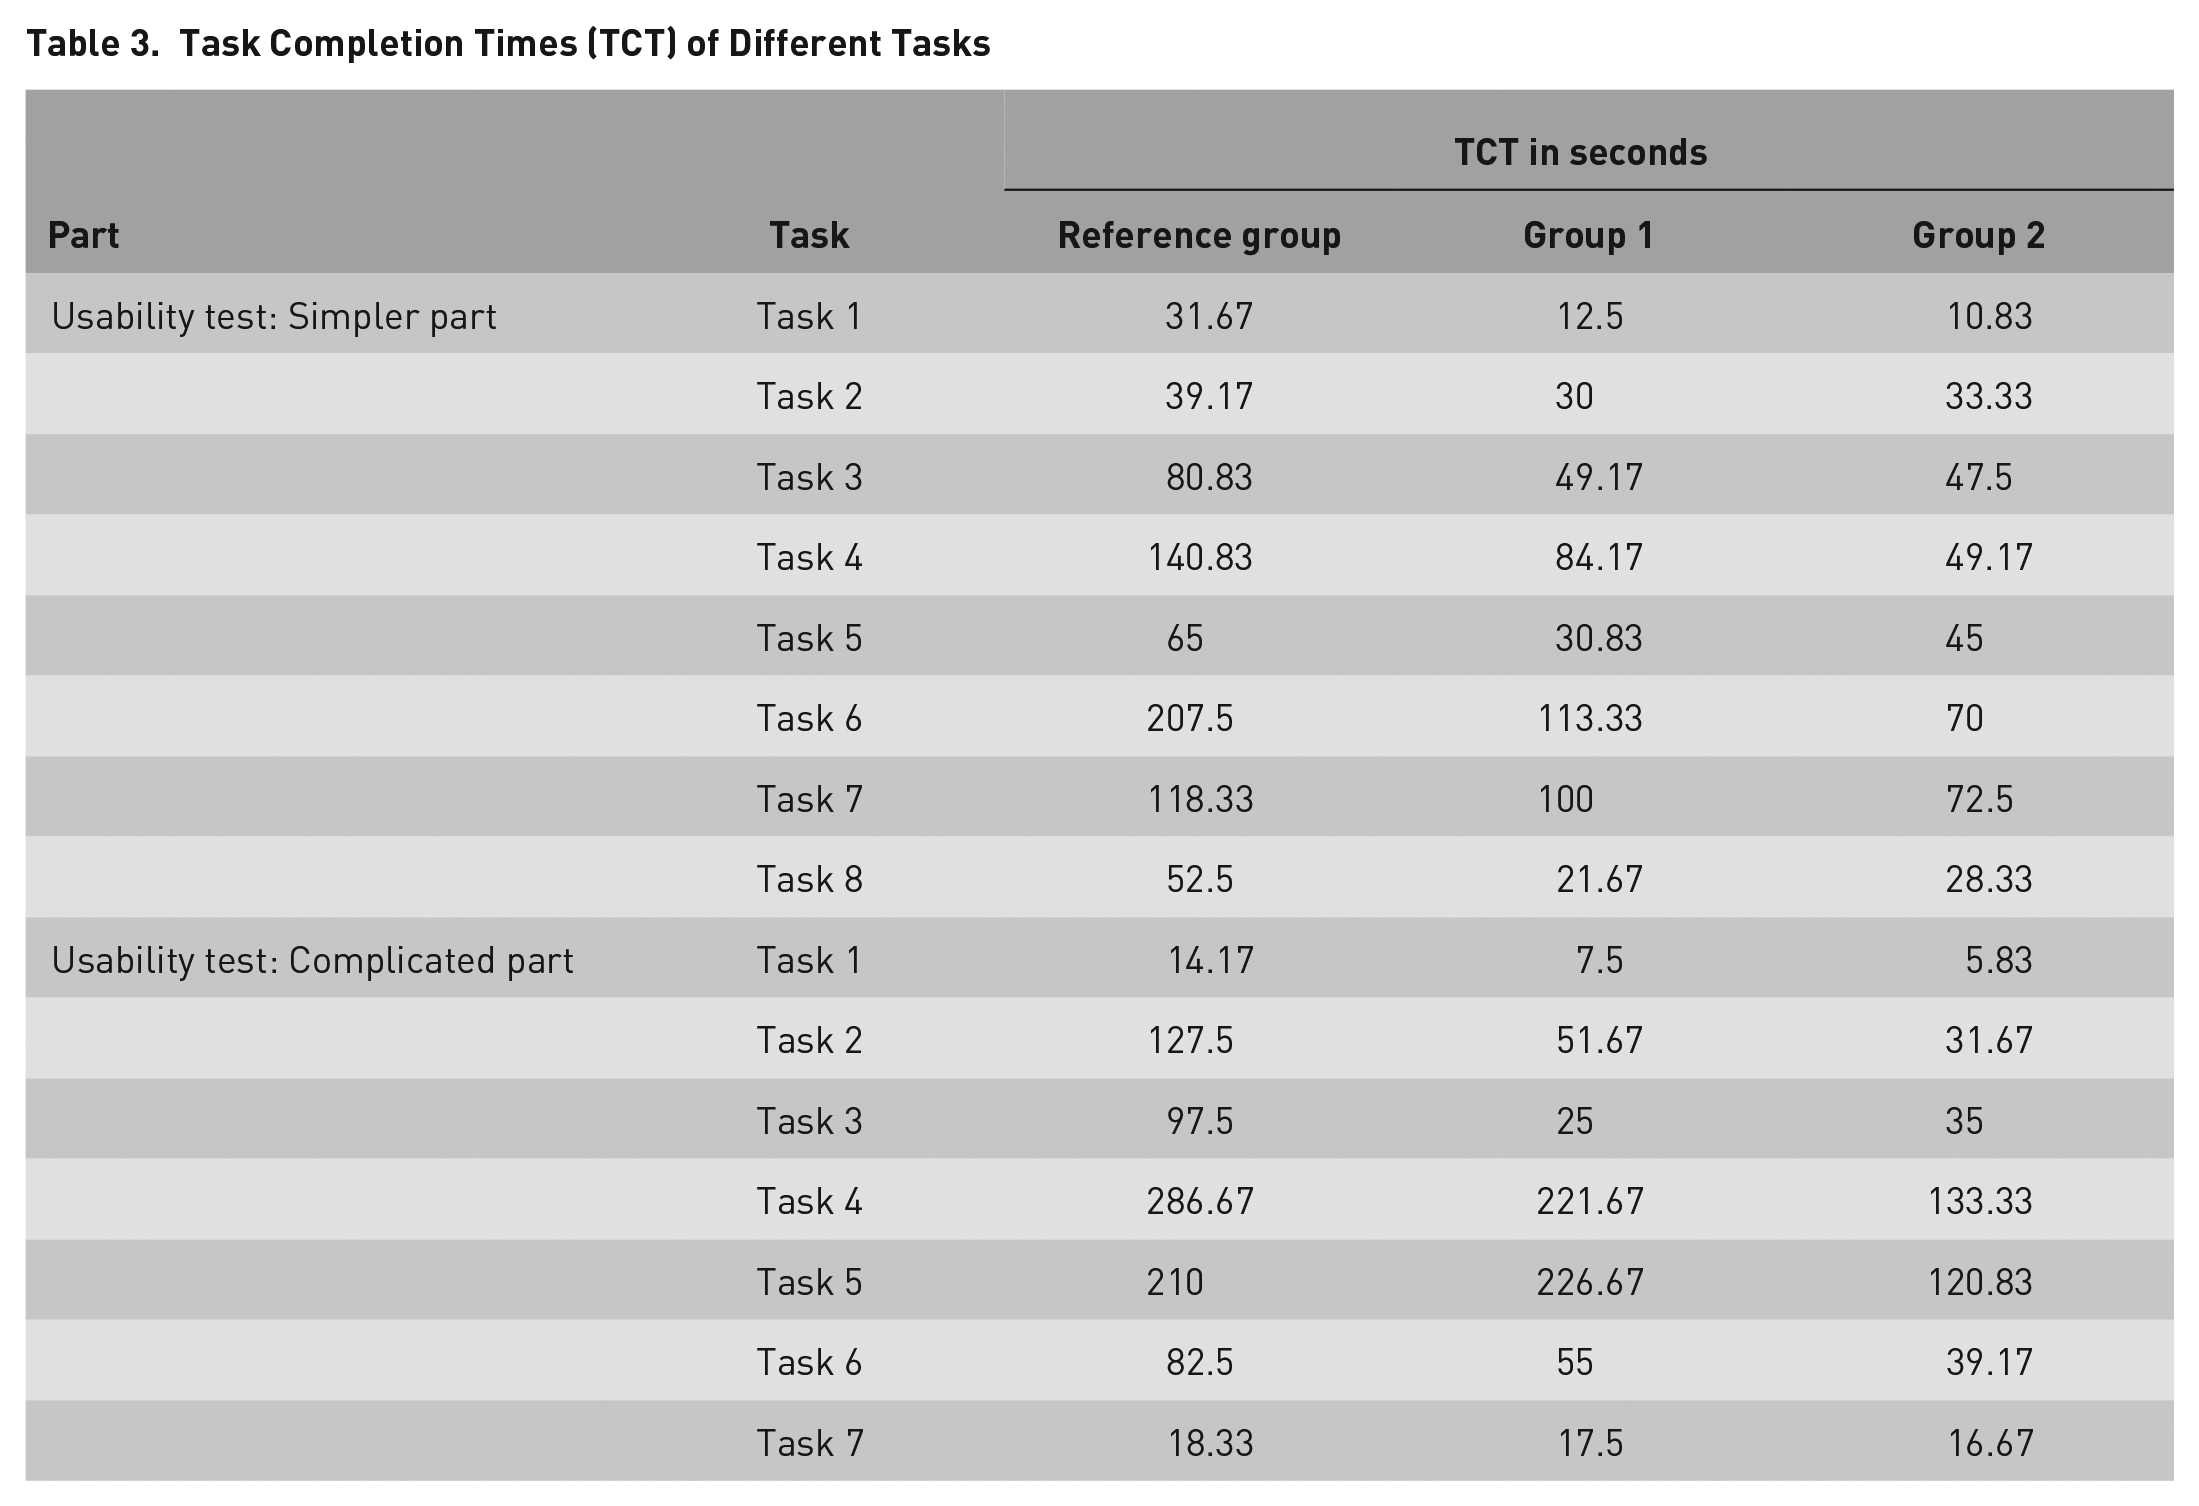
The 18 participants were separated in three groups: The members of the reference group performed the tasks of the efficiency study without onboarding solutions, while the remaining 12 participants watched different onboarding solutions before carrying out the tasks in two separate groups. One of these groups of six was shown tutorial videos beforehand (Group 1), while the other group (Group 2) was shown an in-house, clickable visual onboarding solution that explained the important functions (Figure 2).
Onboarding solutions applied in the study.
We divided the usability tasks into two parts with varying levels of difficulty to test different functions of the program. The simpler part involved smaller tasks that could be carried out using the basic functions (e.g., creating lines and simple shapes, coloring, using brushes). The complicated part was about creating a three-dimensional (3D) version of a picture by using the new functions of Paint 3D.
During the study, the participants provided feedbacks with the concurrent think-aloud method and formed their opinion about the software product. The point of thinking aloud is to make the participants verbalize their thoughts and say out loud what they do and why. In this way, we can see the difficulties that may occur while using the product (Jääskeläinen, 2010).
We evaluated the usability test with reference to three indicators: task completion time, plus the number and severity of errors. We also supported the usability tests with a Tobii eye tracker, which fixes the exact direction of the gaze during task execution, thereby producing useful feedback.
The task ended with the completion of the System Usability Scale (SUS) questionnaire, which helps extensively measure the product’s usability with 10 questions (Lewis, 2018). The usability tests were complemented by follow-up interviews in Groups 1 and 2 to explore the participants’ opinion about onboarding solutions (Figure 3).
Research plan.
Before the usability test, we defined five hypotheses about the efficiency of onboarding methods. These were as follows:
Results
Throughout the usability tests, users belonging to the reference group experienced 26 different errors in the Paint 3D program. Members of Group 1, on the other hand, experienced only 18 flaws after watching the YouTube video, whereas members of Group 2, having used the clickable, visual onboarding solutions only experienced 13 usability problems.
We examined the problems during the evaluation based on the Nielsen severity scale, which rates the errors on a 4-point Likert-type scale (Tullis & Albert, 2013).
The fourth category contains the most severe errors. These are problems that practically make successful execution impossible. Such were the difficulties concerning the location and selection of the texture tools; the basic actions with 3D figures; and the usage of the “Magic Select” tool. These were problems arising with all members of the reference group. In the third category, we can find serious usability problems, the correction of which should get high priority (for users, it was not clear, for example, that they can rotate and move the objects by using the icons around them). Of course, several other minor errors were mentioned, like the fact that you cannot cut 3D figures out of each other (second category) or that the brush types are not easily distinguishable (first category).
These errors appeared 58 times in total in the case of the reference group, while the number was lesser in both groups that received onboarding support (46 in Group 1, 22 in Group 2; Table 2).
Frequency of Errors by Severity Category
The basis of Hypothesis 1 was that the different errors experienced by the reference group occur less due to onboarding solutions, because they already have extensive knowledge about the program before they start the task, because their mental model of the product was closer to the real (physical) model (Weinschenk, 2011).
We can compare the frequency of the 26 experienced errors in the reference group one by one to the results of the other two groups using the Wilcoxon signed-rank test. We applied this method as a nonparametric alternative to a paired-sample t test, because of the small sample size (n = 26) to compare the frequency of occurrence of the same errors pairwise.
Based on this, the frequency of errors only differs significantly from the reference group in the case of Group 2 (who received a clickable, visual onboarding support; Z = −3.423, p = .001 < .05). The difference is not significant with Group 1 (Z = −1.688, p = .091 > .05).
Based on the facts mentioned above, we partly accepted Hypothesis 1 in this sample. In other words, due to the support of the visual, clickable onboarding solution, users experienced fewer errors (which was not true when tutorial videos were shown).
The starting point of Hypothesis 2 was the usability issues that had been assigned with severity ratings. Looking at the frequency of usability issues by severity ratings as a usability issue analysis can be very informative since in this case, it is an indicator of whether the onboarding solutions are addressing the most important usability issues (Tullis & Albert, 2013). Errors experienced in different severity groups can also be examined by using the same Wilcoxon test as in the case of Hypothesis 1.
In case of the most important usability issues (errors belong to severity Categories 3 and 4) the number of experienced errors were also only smaller in Group 2 (Z = −2.783, p = .005 < .05), while in Group 1 it was not true (Z = −1.283, p = .2 > .05). Based on these results, we partly accepted Hypothesis 2. In other words, due to the support of the visual, clickable onboarding solution, the number of experienced errors was smaller in case of the most important usability issues.
Based on the experiment, we can conclude that task completion times were also shorter with the help of onboarding solutions (Table 3).
Task Completion Times (TCT) of Different Tasks
This can also be examined with the same paired-samples (Wilcoxon) statistics due to the line-by-line comparison of task completion times regarding the same tasks. Results conform to Hypothesis 3 for both groups (Z = −3.181, p = .001 < .05 and Z = −3.408, p = .001 < .05). We can, therefore, accept Hypothesis 3 and say that participants who received onboarding support executed the tasks faster.
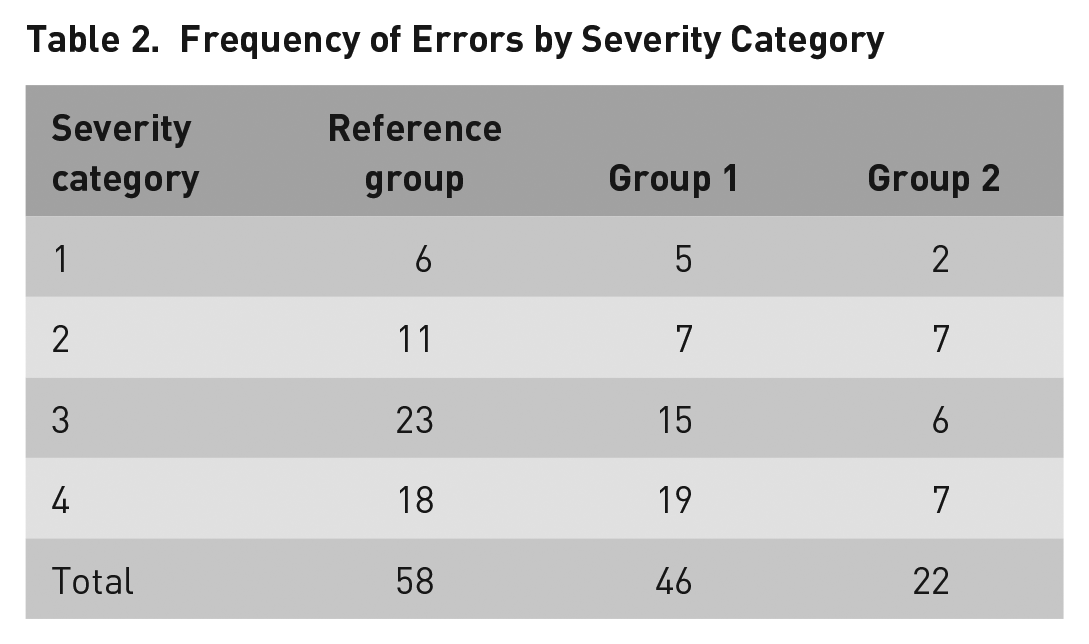
The application of eye tracking technology allowed us to fix the exact direction of the gaze to determine the place and duration of fixations (Holmqvist et al., 2011). This information can also be portrayed visually, which further helps our work (Duchowski, 2007). The most common form of depiction is the heatmap visualization, in which all user data are shown as an aggregate. The points most often watched are marked with red, while the less watched areas are marked with a colder, greener color (Figure 4) (Szabó, 2020).
The heatmaps of the three-dimensional rotating tasks without (left) and with onboarding (center and right).
We queried heatmaps for critical tasks, like the rotation and moving of an inserted (fish) figure in 3D. Based on the results of the reference group, we can say that the icons around the selected 3D object – with which the task could have been performed – were hardly looked at by the participants. They were instead looking for solutions in the menu on the top and on the right. This was because they were used to that setup in the previous version of the tested software.
In the other two groups, it seems – based on the visualizations – that users looked at the menus on the top and on the right for solutions fewer times, because during the onboarding solutions they learned that they could use the icons around the object to solve this task. Because eye tracking software makes it possible to select different areas of interest, we tested the hypothesis by defining the menus on the top and on the right (Figure 5) and queried quantitative data related to them (Table 4).
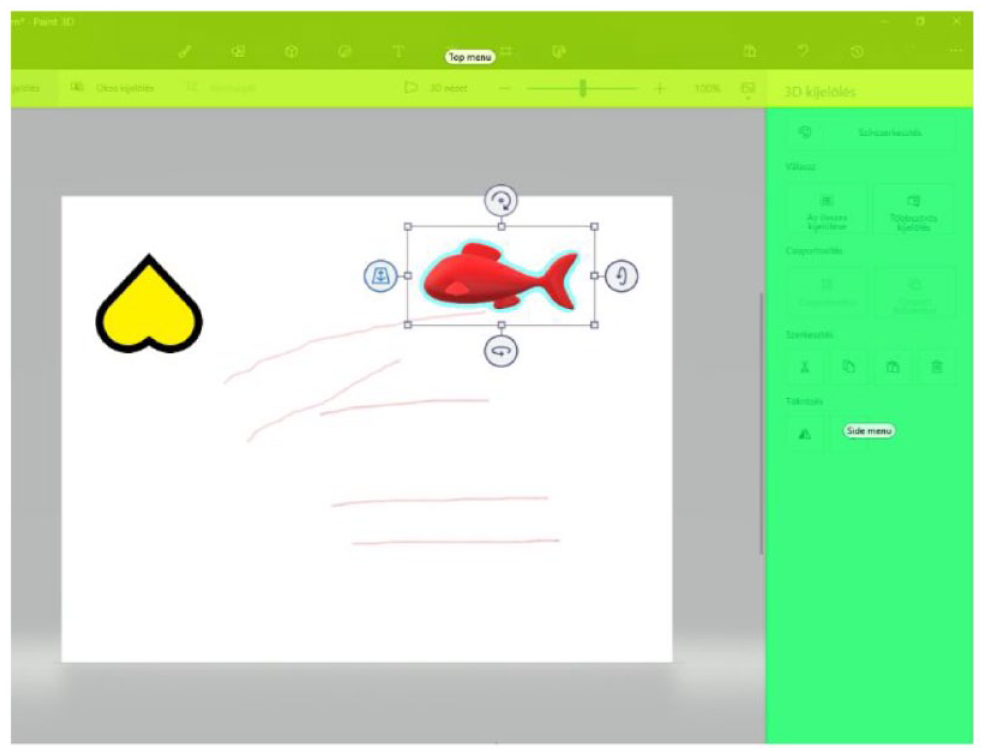
Defining AOIs for 3D rotation task.
Quantitative Information for the Selected Areas of Interest
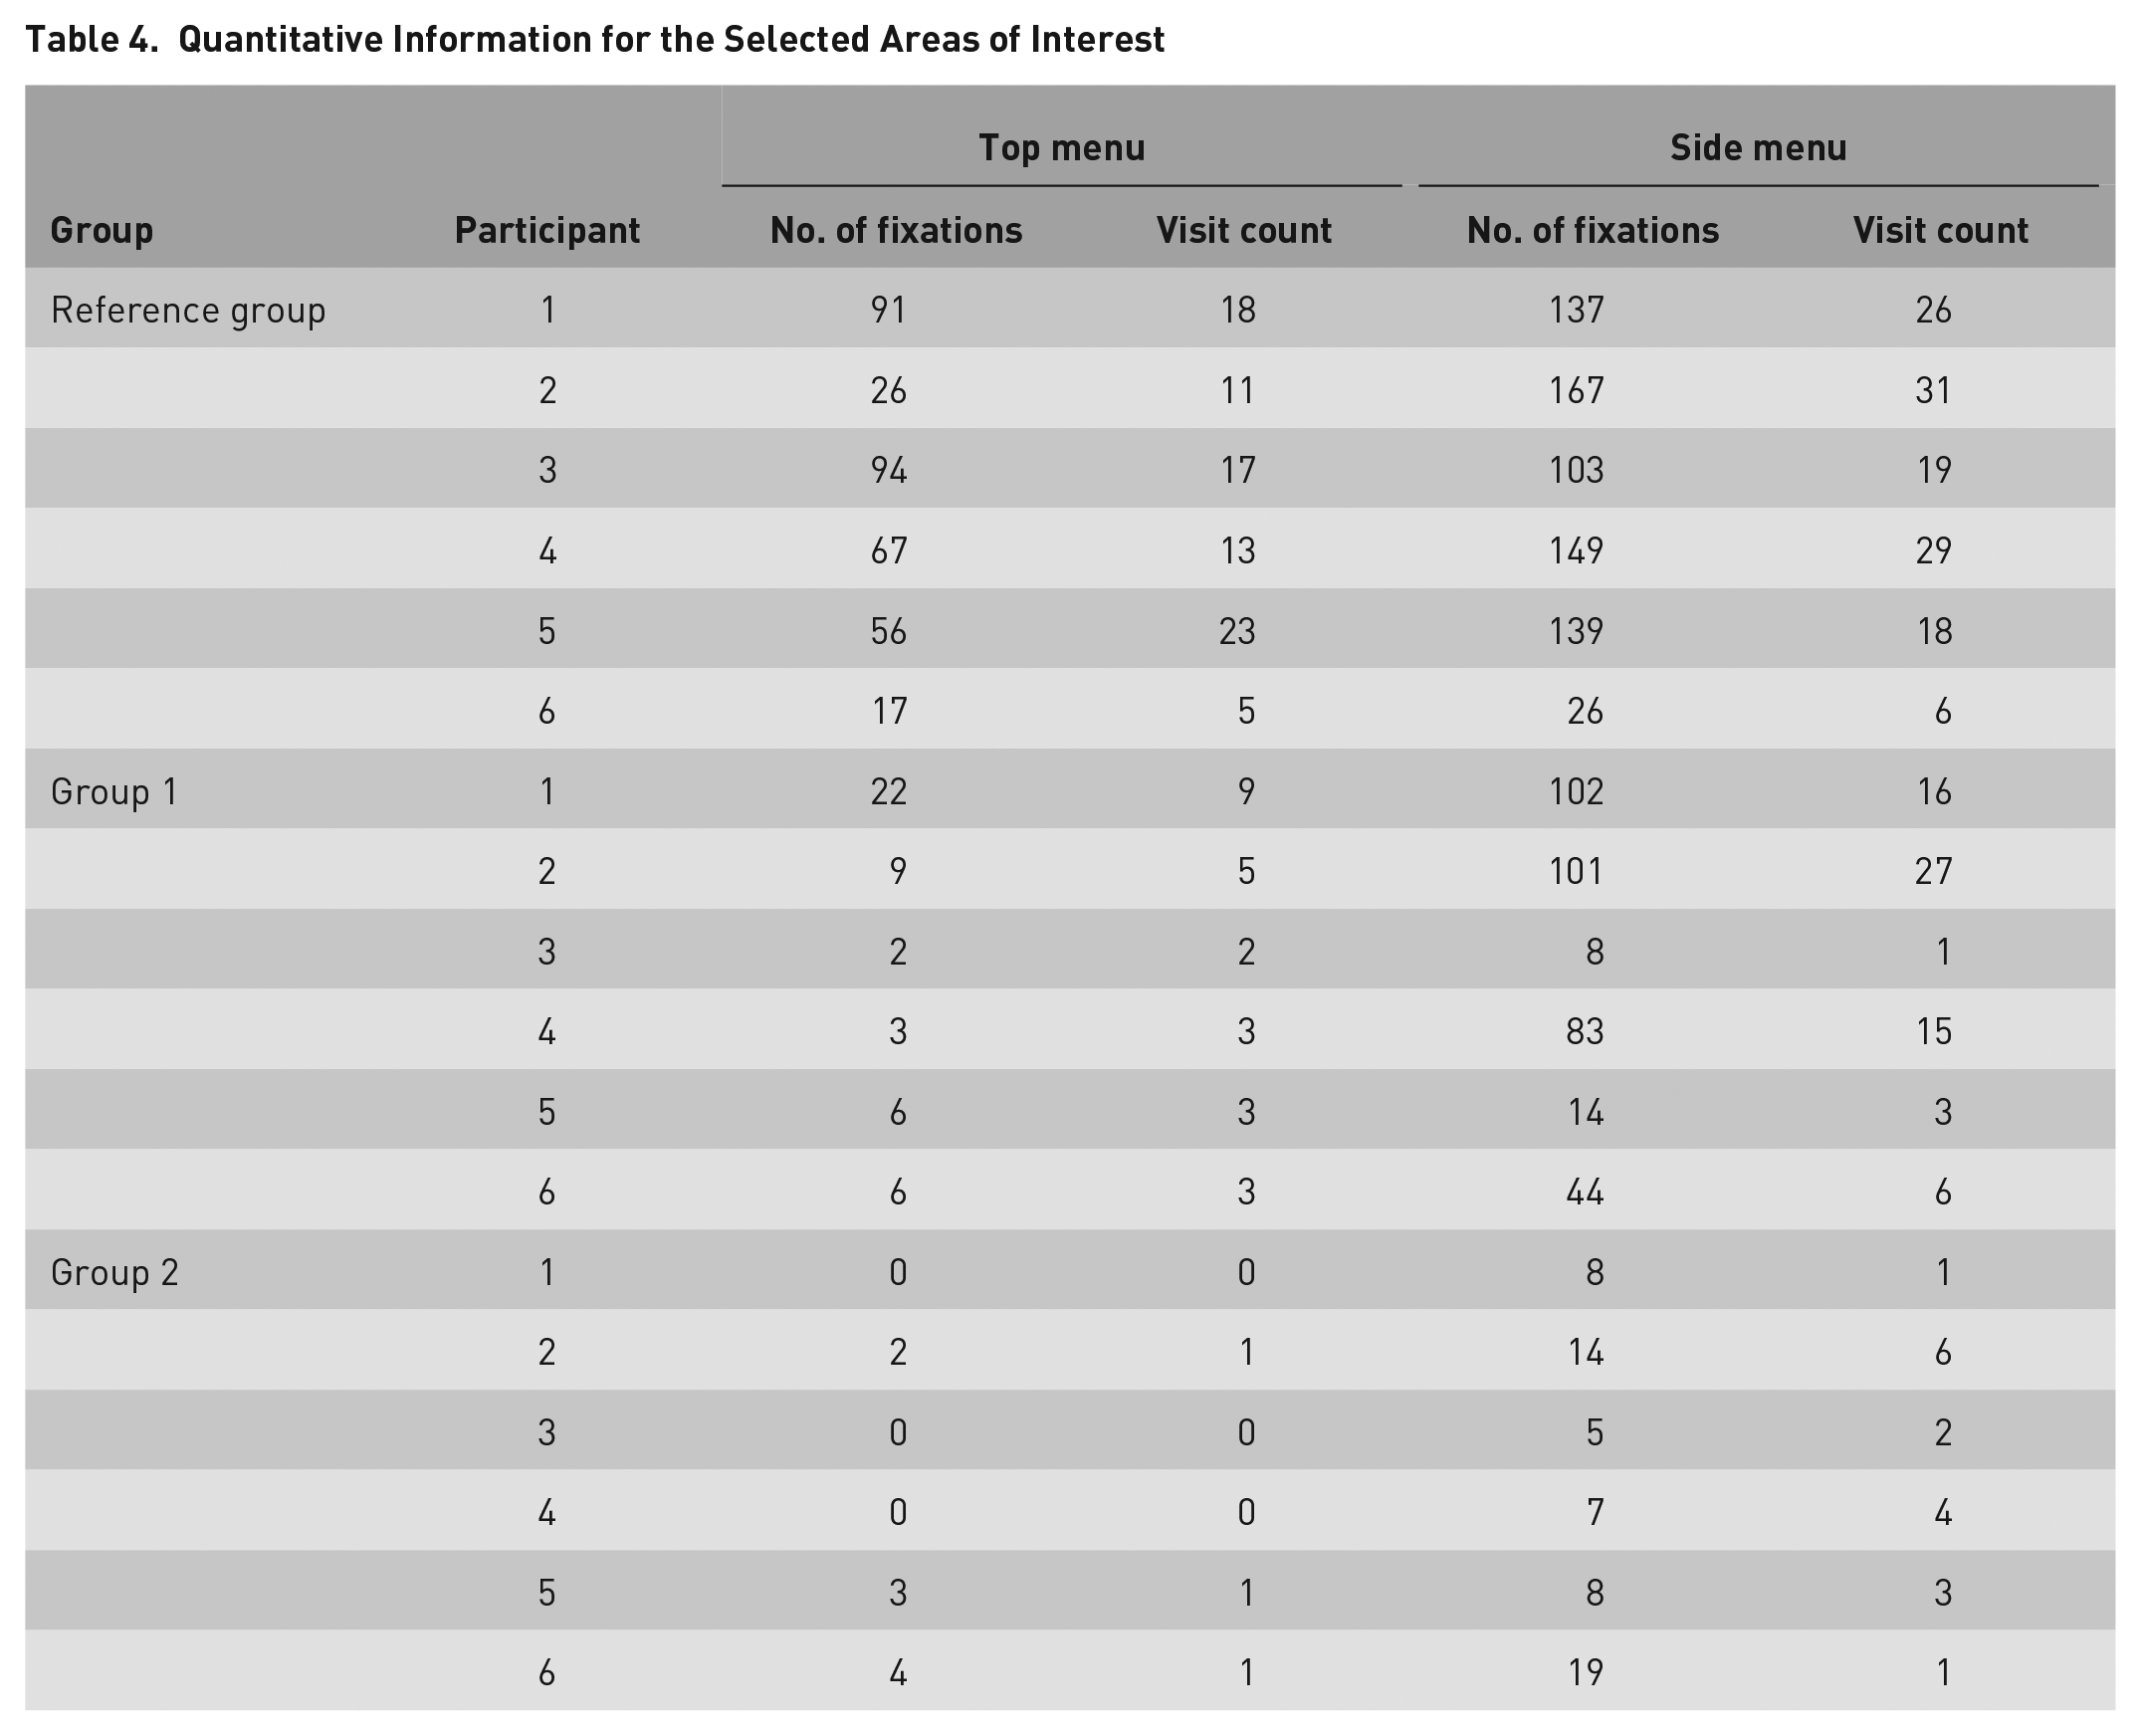
The number of the fixations and the visit count indicates the subjective importance of the given area (Jacob & Karn, 2003), so the test of Hypothesis 4 was conducted with these indices using the Mann–Whitney U test. We used this test as a nonparametric alternative to an independent sample t test to compare the differences between two independent groups based on the number of fixations and the visit count variables.
Compared with the reference group, there was a significant difference in the number of fixations, so we can conclude that due to the onboarding methods, users in both groups were looking much less at the elements of the upper (U = 1, Z = −2.727, p = .006 < .05; and U = 0, Z = −2.903, p = .004 < .05) and the side menu (U = 4, Z = −2.242, p = .025 < .05; and U = 0, Z = −2.887, p = .004 < .05), because they knew that 3D rotation cannot be executed there. Since in one case there was a tendential difference in the number of visits in these areas, Hypothesis 4 was only partially accepted. Hence, heatmaps confirm that onboarding methods only help a more conscious task execution when it comes to the number of fixations.
Percentage results calculated based on the SUS tests filled out by the participants show how each participant viewed the usability of the program. Test takers who were supported by onboarding clearly achieved a higher score, making group averages higher too (Table 5).
System Usability Scale Results
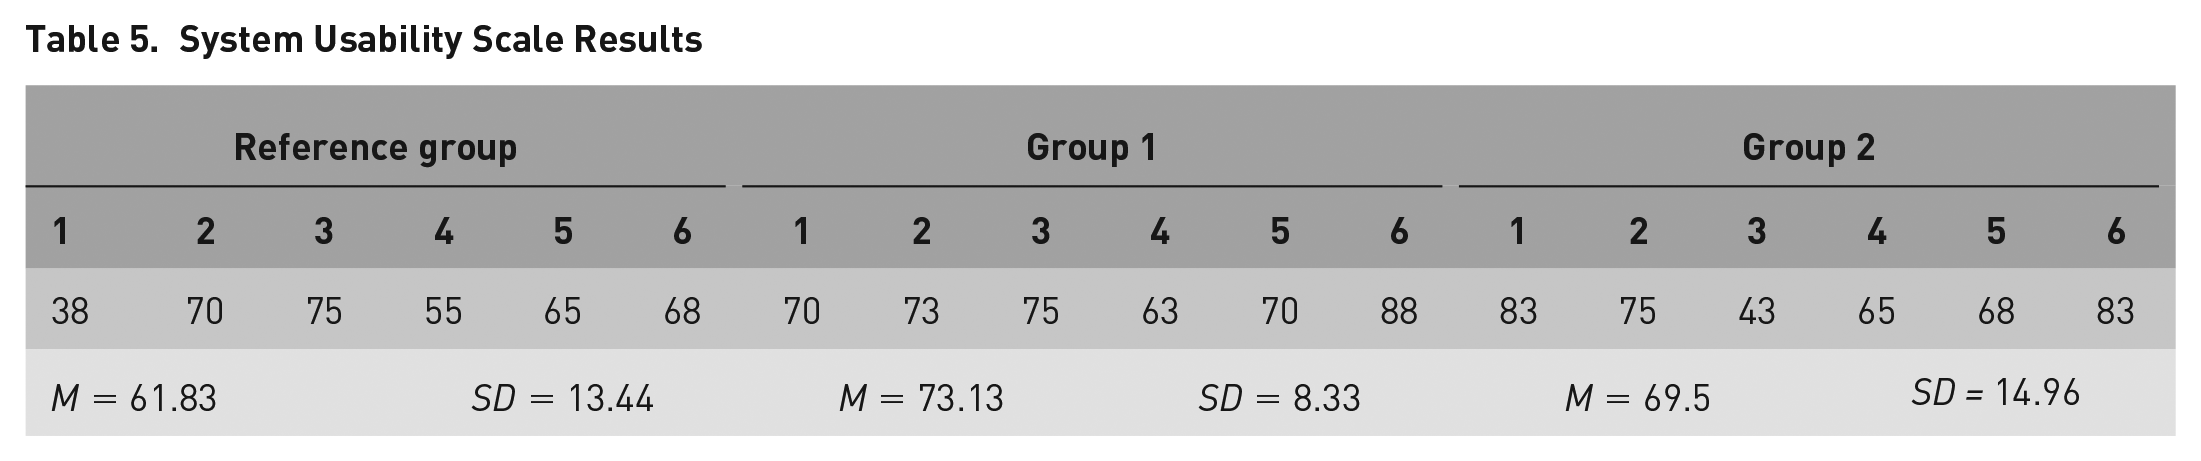
When using the Mann–Whitney U test on the independent samples of Table 5, we may compare the reference group to the video and clickable onboarding solutions, and we can see that there is no significant difference between them in the SUS values (U = 8.5, Z = −1.535, p = .125 > .05; and U = 11.5, Z = −1.048, p = .295 > .05). Consequently, we had to reject Hypothesis 5, meaning that participants do not consider the program more usable because of onboarding methods.
We explored the opinion of participants in Groups 1 and 2 about the onboarding methods in an interview, which we conducted immediately after the usability test. Based on this, we can conclude that in general, all participants liked receiving onboarding solutions before carrying out the task. They all regarded these as excellent software tutorials that greatly supported new users in getting to know the basic layout and the functions of the program. The usefulness of visual tooltips and animated, interactive tutorials were emphasized by almost all interviewees, and participants also highlighted the importance of gamification when learning to use a product.
The general opinion was that thanks to the onboarding support, they already knew where to look for certain functions when launching the program and the interviewees highlighted that without onboarding support, it is difficult to start using software that have a lot of functions and depth.
Conclusion
User onboarding has become important in human–computer interaction research (Cardoso, 2017; Kapusy & Lógó, 2020; Renz et al., 2014; Terres et al., 2020), because effective onboarding solutions can help new users discover a product’s value and thereby making the learning process more successful during the first use.
This study shows that onboarding solutions can be demonstrably efficient according to several indices, making their use in combination with newly introduced software worthwhile in terms of improved UX, application learnability and user commitment.
We can conclude that in this study, onboarding solutions applied in usability tests resulted in more conscious task executions. This was confirmed with eye tracking technology that is a powerful tool within usability testing; it also makes it possible for us to see what the user is looking at on the screen while completing tasks. It was used in this study to comprehensively and objectively evaluate the effectiveness of different onboarding solutions based on the number of fixations indicators.
It was also clear that participants who received onboarding support were much faster at solving tasks than the members of the reference group, a finding which also proves the effectiveness of onboarding.
In two cases – concerning the frequency of errors, and the most important usability issues – the audiovisual solution did not turn out to be efficient. However, in these cases, the clickable, visual onboarding did lead to better results, which leads us to the conclusion that the latter is more suitable for integration into software products.
Participants’ opinions were also revealed after the usability test, which pointed out that the onboarding solutions that were applied in the study greatly helped with task execution.
In conclusion, developing onboarding solutions is well worth considering in highly competitive markets, such as the information technology industry. Software providers should attach great importance to their user onboarding strategy to positively affect users’ software usage intentions and thereby actively shape user activation outcomes during further product use.
Footnotes
The research and the study were supported by the ÚNKP-20-2 New National Excellence Program of the Ministry for Innovation and Technology from the source of the National Research, Development and Innovation Fund. We would also like to express our very great appreciation to Kornél Kocsány for help with language editing.
![]() .
.