
Abstract
This study employs a deep learning (DL) based stochastic approach to comprehensively interpret the effects of current intensity and velocity variations on temperature evolutions and cooling rates in the wire arc additive manufacturing (WAAM) process of a thin wall. Uncertainty raised from process parameters, material properties, and environmental conditions significantly impacts the final product quality. Furthermore, understanding the relationship between the process and temperature evolution within the WAAM process is complex. This study contributes to quantifying the uncertainty to the final product quality, such as temperature evolutions and cooling rates via a fast and accurate DL-based surrogate model. This contribution helps to precise adjustments and optimizations to enhance the overall WAAM process. Initially, a DL-based surrogate model is constructed using data obtained from a high-fidelity validated finite element (FE) model, ensuring an impressive 99% accuracy compared to the FE model while reducing computational costs. Subsequently, probabilistic methods are used to characterize uncertainties in current intensity and velocity, and the Monte-Carlo method is applied for uncertainty propagation. The findings illustrate that small variations in the input parameters can lead to significant fluctuations in temperature evolutions. Additionally, a sensitivity analysis is conducted to precisely quantify the influence of each input parameter. Finally, an uncertainty reduction is performed to enhance the variation of cooling rate. In general, this study is expected to make precise adjustments and optimizations to enhance the overall WAAM process for better quality of printed piece.
Introduction
Among metallic Additive Manufacturing (AM) techniques, Wire and Arc Additive Manufacturing (WAAM) stands out as a promising method for producing large-size components with moderate shape complexity and reasonable dimensional accuracy (Jafari et al., 2021). This technique offers notable advantages, including a high deposition rate and relatively low equipment investment costs. Moreover, employing metal wire as the feedstock material proves to be more cost-effective and safer for operators compared to metal powder used in powder-based AM processes like laser powder bed fusion (Le et al., 2023), (Nguyen et al., 2022). However, it is crucial to acknowledge that the WAAM method does come with inherent challenges stemming from intricate thermal dynamics and substantial heat accumulation. These give rise to issues such as thermal-induced stresses, distortion, diminished dimensional accuracy, and suboptimal surface finish (Cunningham et al., 2018). Additionally, it is widely recognized that the intricate thermal cycles within the component during the WAAM process exert a profound influence on its microstructural evolution, thereby significantly affecting the mechanical properties of the final parts produced through this method (Jafari et al., 2021). Consequently, a comprehensive exploration of the thermal evolution during the WAAM process becomes paramount.
While the WAAM process presents compelling features, its widespread adoption in industries is hindered by challenges related to the sensitivity and variability of printed product quality under different manufacturing conditions (Le et al., 2023). This complexity arises from the rapid occurrence of numerous physical phenomena during WAAM, often at temperatures surpassing melting points. This includes intricate heat transfer dynamics and the transformation from liquid to solid states in materials. These processes lead to the development of diverse microstructures (Cunningham et al., 2018; Jafari et al., 2021). Achieving high-quality results in WAAM is of paramount importance for its widespread industrial application. The complexity of the WAAM process, stemming from intricate interplays of various parameters, makes the pursuit of optimal quality a challenging endeavor. Even subtle variations in operating conditions can yield significant discrepancies in the final product. As such, a systematic approach is imperative to ascertain the precise influence of each parameter and to establish a framework for enhancing print quality. This is where sensitivity analysis emerges as a critical tool, enabling a comprehensive understanding of how different process parameters impact the final product’s attributes (Pham et al., 2022a, 2022b; 2021; 2023).
However, in the realm of WAAM, parameters inherently bear a degree of uncertainty. Factors such as material properties, environmental conditions, and even minute deviations in machine performance introduce variability into the process. Recognizing and quantifying this uncertainty is pivotal for robust decision-making and ensuring the reliability of the manufacturing process. The issue can be effectively addressed through the application of uncertainty quantification methods (Arnst and Ponthot, 2014; Nath et al., 2019). Here, input parameters are characterized using probability distributions, enabling the propagation of uncertainties through probabilistic techniques to derive the distribution of quantities of interest (QoIs). However, this process necessitates a substantial number of simulations, and relying solely on the finite element (FE) method can be excessively time-consuming, or even unfeasible for prolonged simulations (Pham et al., 2022a; Nath et al., 2019). Presently, leveraging deep learning (DL) techniques (Tapia et al., 2018; Çalışkan, 2023a, 2023b; Mozaffar et al., 2018) offers a promising solution to mitigate this challenge (Pham et al., 2022b). By employing the DL model as a surrogate for the FE model, the propagation process can be executed with significantly reduced time and computational resources.
In the domain of uncertainty quantification in additive manufacturing (AM), current efforts primarily focus on laser powder bed fusion (L-PBF) (Lopez et al., 2016) and directed energy deposition (DED) (Pham et al., 2022a, 2022b; 2021; 2023) processes. Consequently, the application of uncertainty quantification in the Wire Arc Additive Manufacturing (WAAM) process is still in its nascent stages. Considering this, our work aims to conduct an uncertainty quantification analysis for a thin wall produced via the WAAM process. The contribution of this work is threefolds. Firstly, we establish a DL-based surrogate model to conduct the UQ study, complementing the conventional FE model. Subsequently, we perform the interpretation of WAAM process parameters through uncertainty propagation and sensitivity analysis. The results are expected to make precise adjustments and optimizations to enhance the overall WAAM process. Finally, acknowledging the inevitability of uncertainties in practical printing systems, we quantitatively define their ranges of influence on the cooling rate.
This study is organized as follows: the literature review is summarized in Section 2. The FE simulation of WAAM process is introduced in Section 3. Then, the UQ process accelerated by DL-based surrogate model are described in Section 4. Finally, the numerical results are shown in Sections 5,6,7, and eight prior to the conclusion in Section 9.
Literature review
Currently, leveraging deep learning (DL) techniques offers a promising solution for the fast and accurate prediction of temperature evolutions in the WAAM process. By employing a DL model as a surrogate for the finite element (FE) model, the propagation process can be executed with significantly reduced time and computational resources. Mozaffar et al. (Mozaffar et al., 2018) and Pham et al. (Pham et al., 2023) developed surrogate models (SMs) for predicting the thermal history in directed energy deposition (DED) based on recurrent neural networks (RNN) and artificial neural networks (ANN), respectively. Additionally, Le et al. (Le et al., 2023) proposed an approach based on a feedforward neural network (FFNN-SM) and computational simulations to rapidly predict thermal cycles in multi-layer single-bead walls fabricated during WAAM.
While these studies emphasize the efficacy of DL-based surrogate models for accurately predicting temperature evolutions in a short time, they often focus on more complex DL architectures, such as RNNs, and are tailored to DED processes rather than WAAM processes. Moreover, they typically address only single-layer manufacturing in WAAM, which may not fully capture the complex behavior of multi-layer printing. Hence, there is a need for further exploration and development of DL models specifically designed for multi-layer WAAM processes to better understand and predict their thermal behavior.
Uncertainty quantification in WAAM is still in its early stages. Pham et al. (Pham et al., 2022a) characterized the influence of uncertainties on the temperature evolutions and melt pool of a bulk sample manufactured by the DED process. Similarly, Tapia et al. (Tapia et al., 2018) performed uncertainty quantification in the L-PBF process, accelerated by a polynomial chaos expansion model. As similar with DL-based surrogate models, most studies on uncertainty quantification focus on other processes, such as DED and L-PBF, rather than WAAM.
Experimental set up and finite element model
Experimental set up
Figure 1(a) and (b) show the baseplate’s geometry and the thermocouples position in this study with thickness and its corresponding 3D model geometry. The wall fabricated by welding-lines (layer by layer) in the WAAM process is built in the middle of the baseplate and the direction of its length. The geometry of these weld-lines was modeled by a rectangular section defined by the width and height of the deposit named clad. In this study, only the thermal problem was studied. The stainless steel 316L (SS 316L) was used for both the wall and baseplate materials with thermophysical properties chosen for the numerical simulation as those in (Le et al., 2023), (Nguyen et al., 2022). (a) The WAAM experiment set-up with four thermocouples, and (b) the detail position of four thermocouples of the thin wall.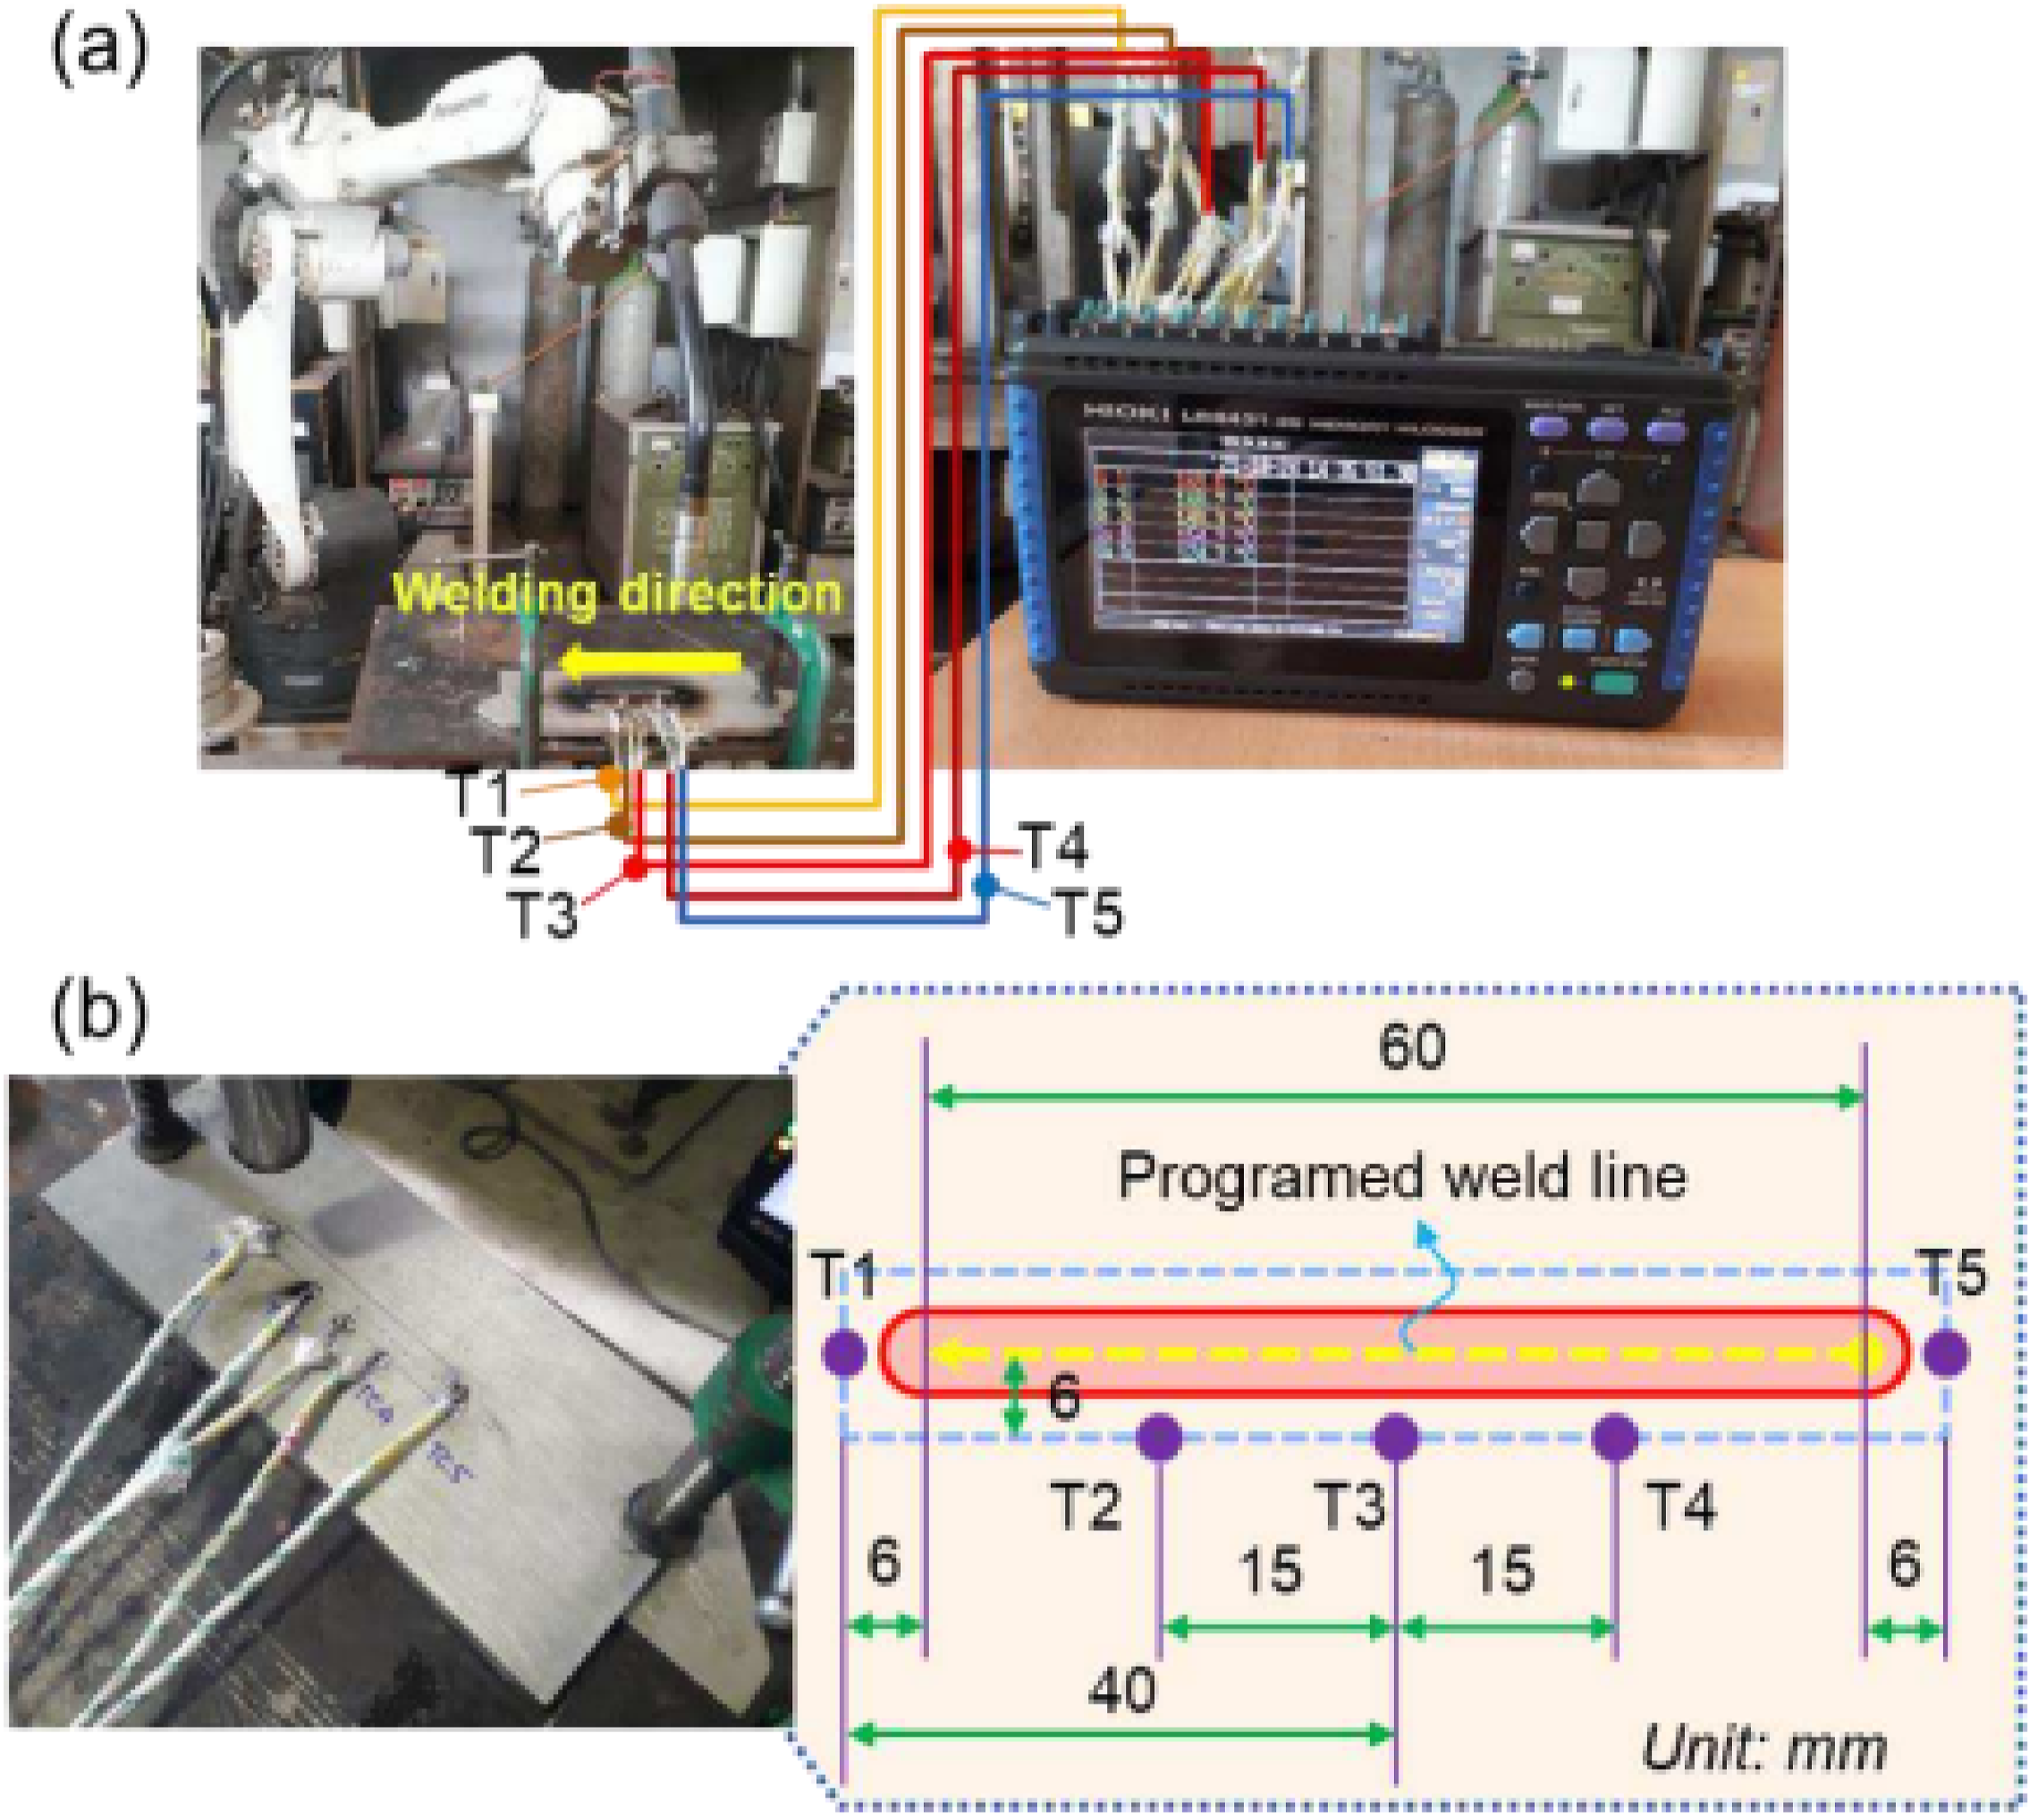
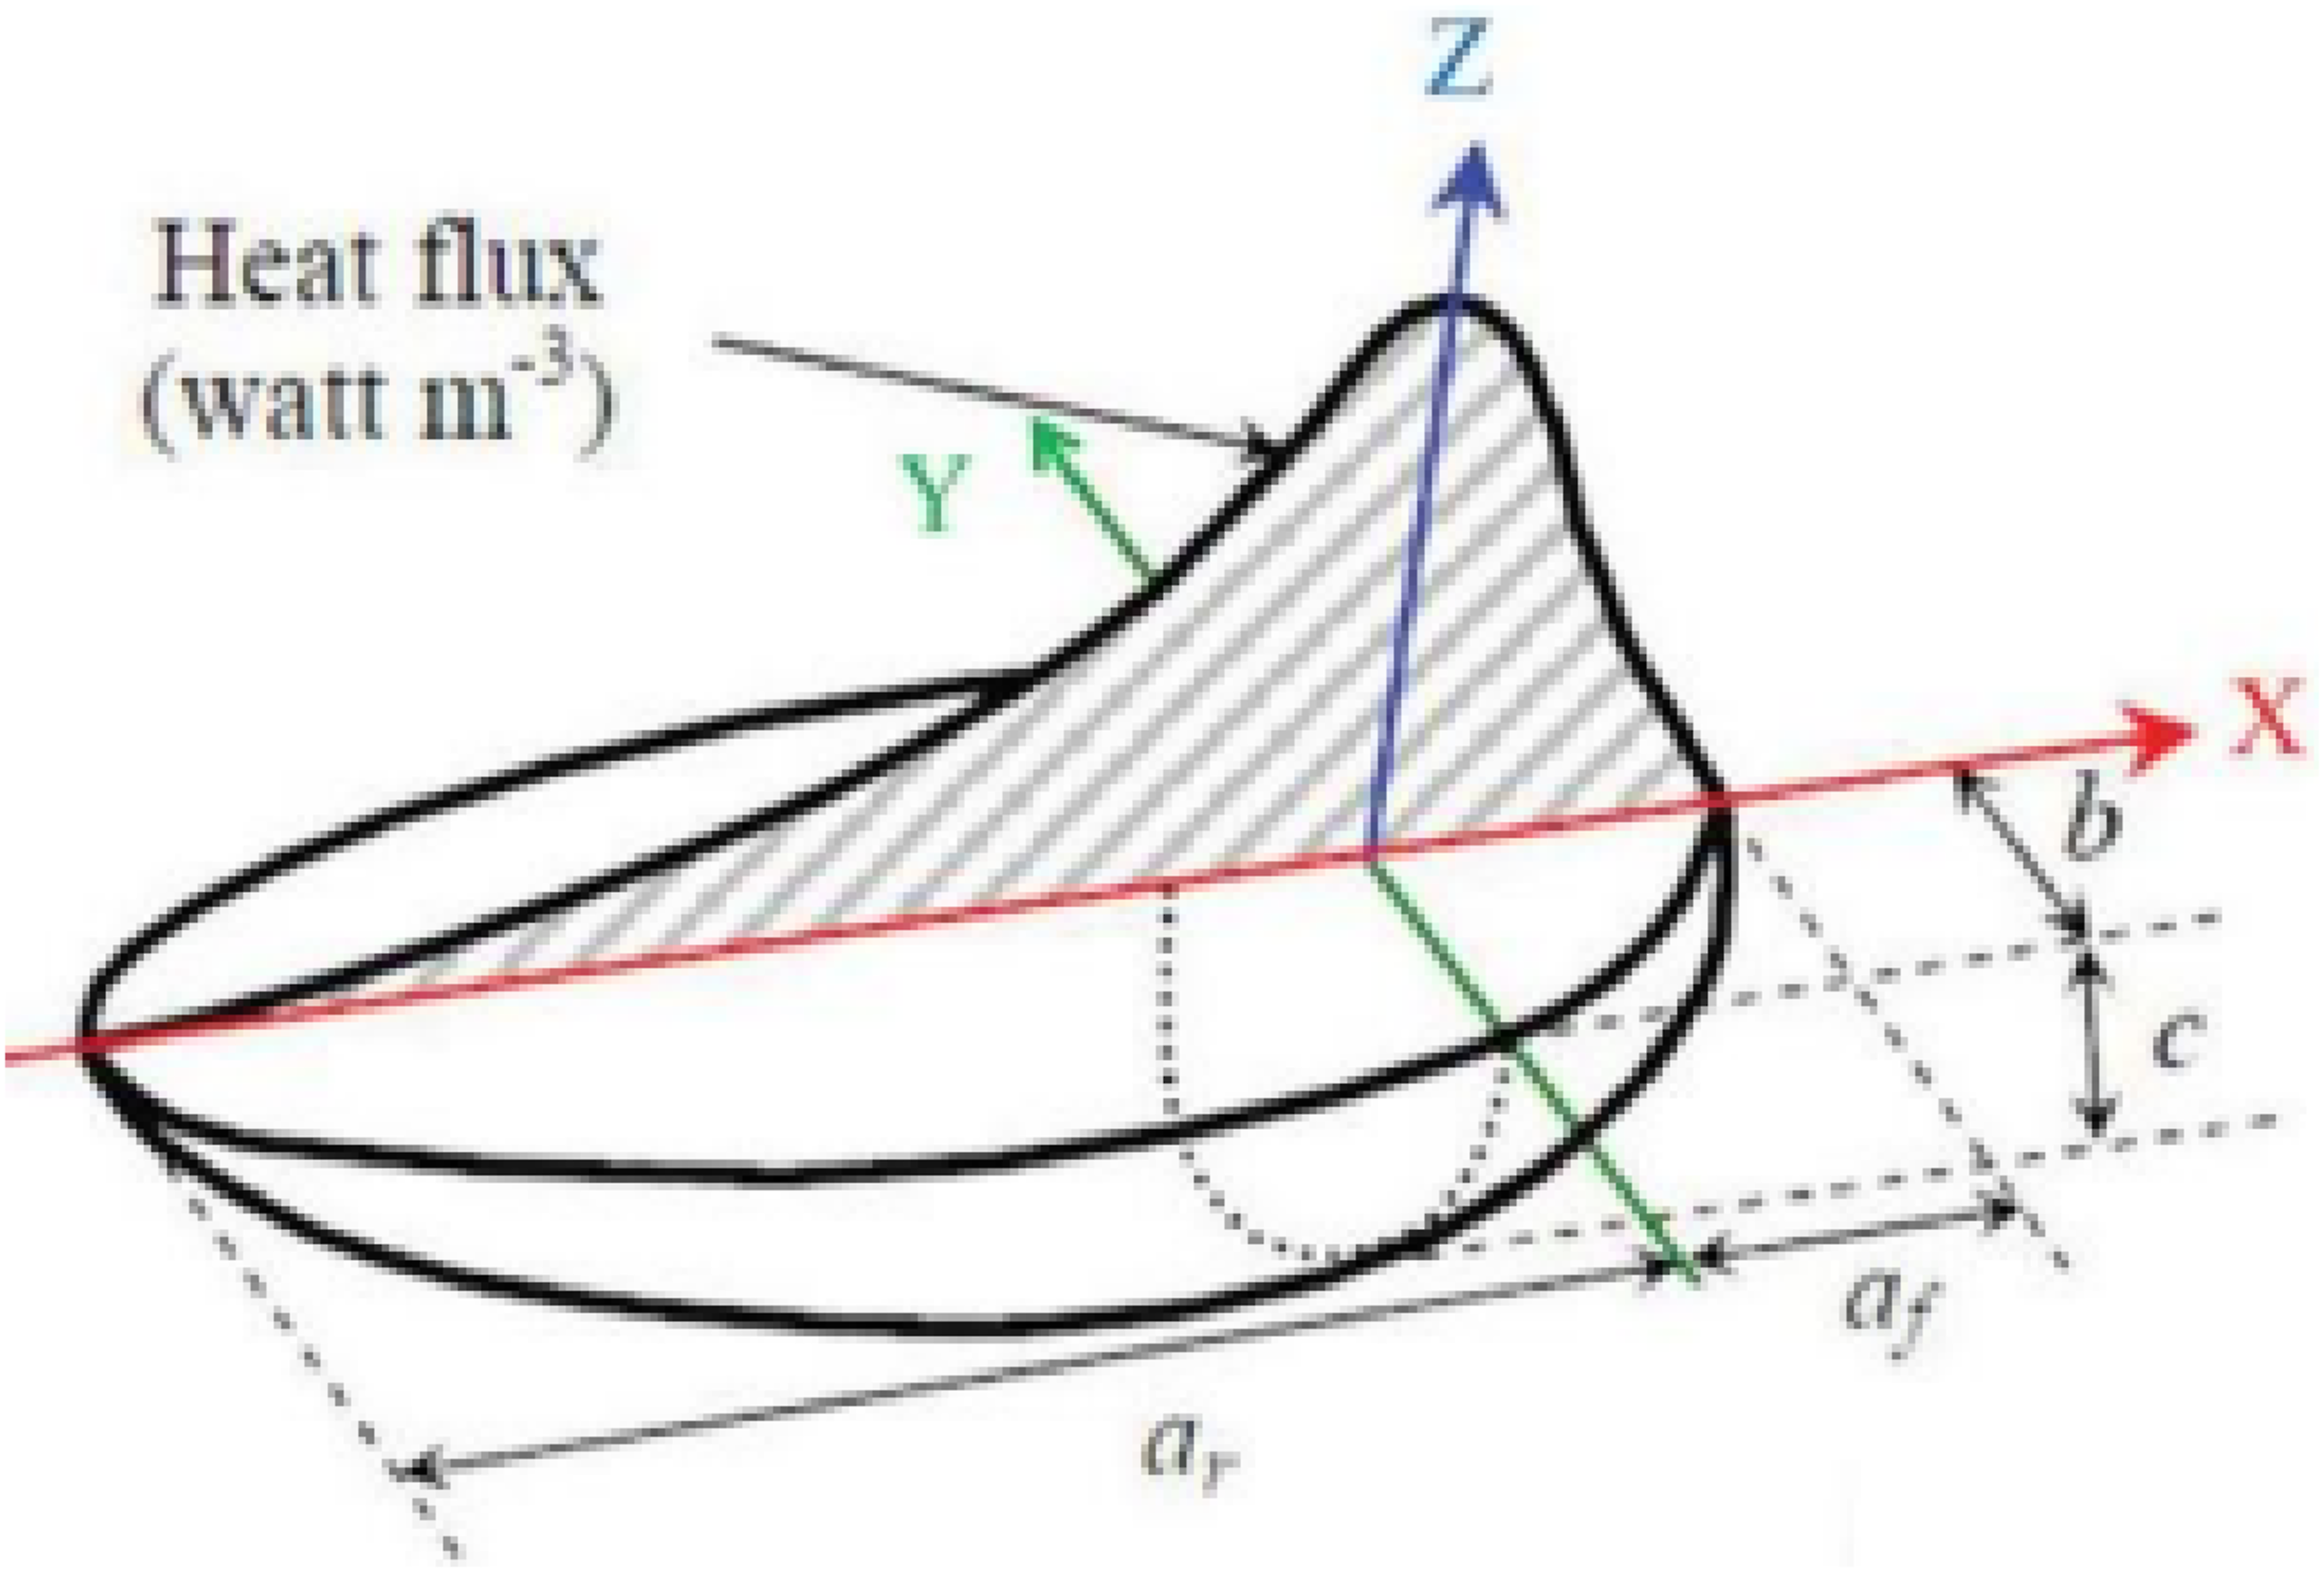
The 3D model, featuring a six-layered structure, is illustrated in Figure 2 for reference in this study. Specifically, in regions where elevated thermal gradients are anticipated—namely, the clad and its immediate surroundings on the substrate—a refined mesh with dimensions of 0.8 × 0.1 × 0.1 mm³ was employed. As the distance from the deposition path increased, the element size was deliberately increased towards the specimen’s periphery. Following a thorough convergence study, this mesh size demonstrates sufficiency, aligning with the findings reported in (Lee, 2020). A Goldak volume heat source (Lee, 2020) based on double ellipsoidal power density distributions was used in this study and its heat distribution is illustrated in Figure 3. 3D model of the thin wall. Double-ellipsoidal heat source model (Mozaffar et al., 2018).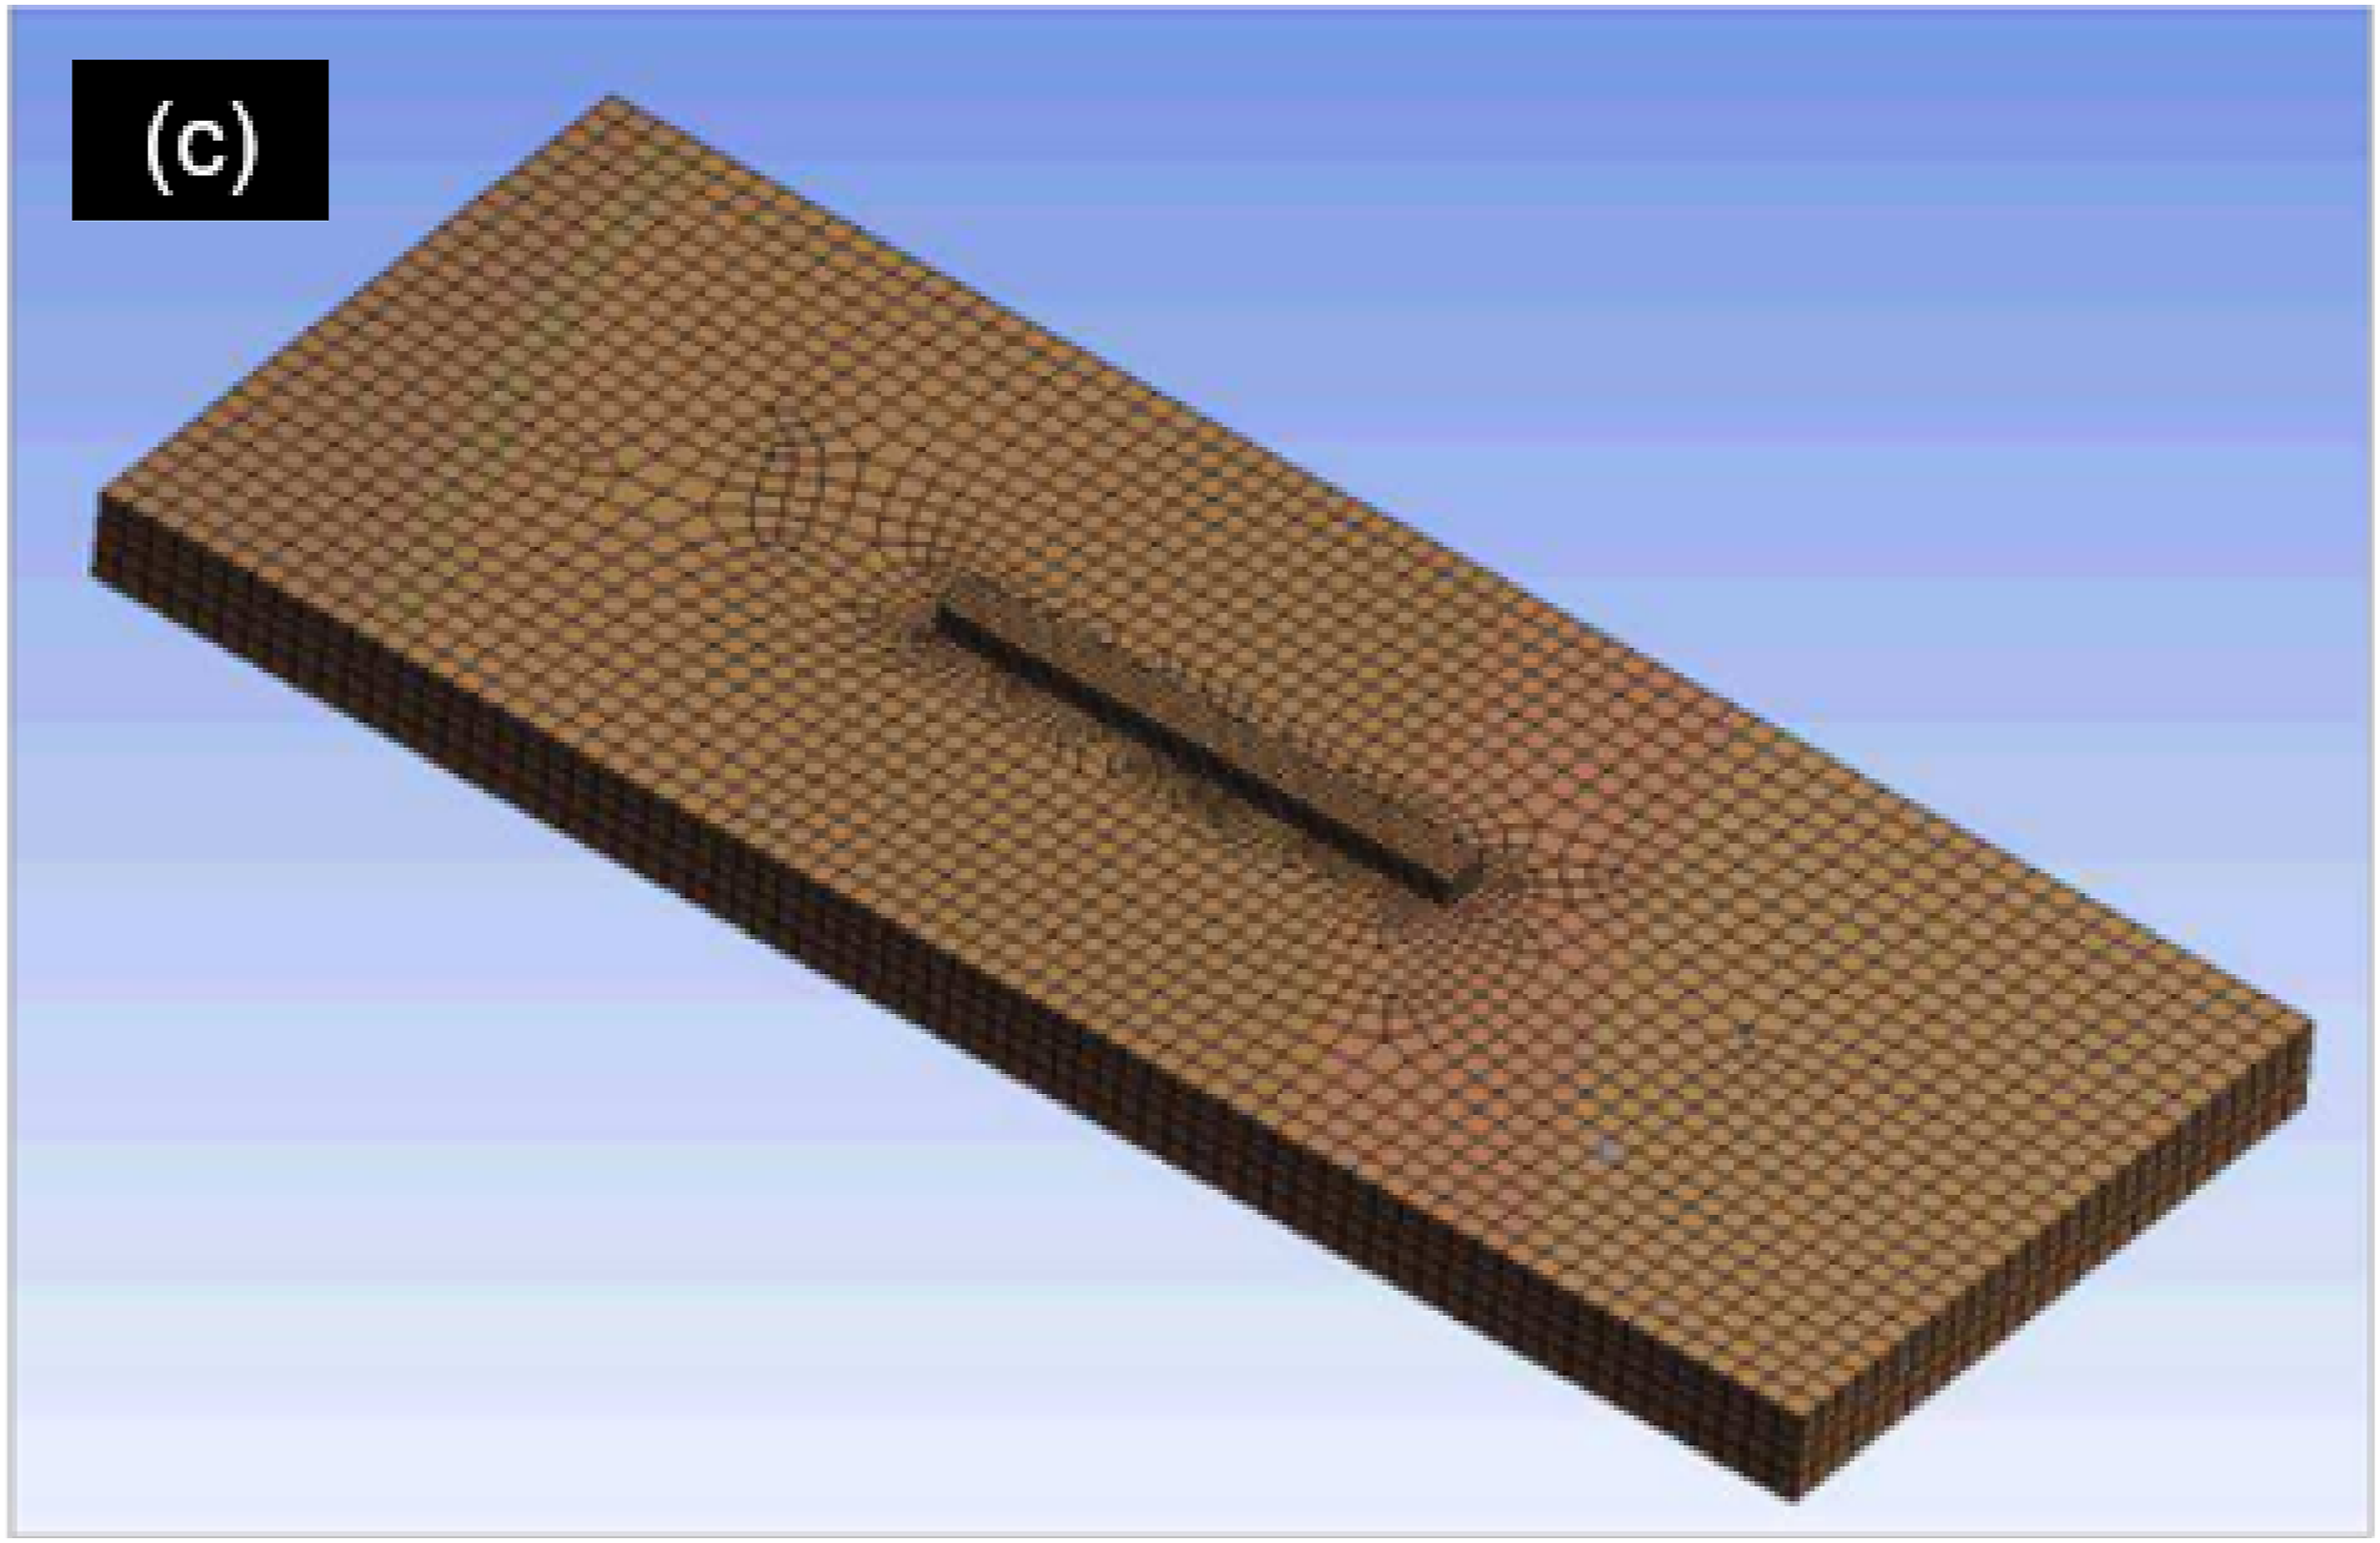
The WAAM process simulation was carried out using ANSYS software and the Element Birth– Death technique to simulate the addition of new materials over time. Before the simulation, all clad layers are considered as ‘inactive’ (dead) elements since they do not exist before the WAAM process (phase pre-step). During the process, the dead elements are reactivated successively under the effect of the welding torch, using an activation time, that was modeled through the welding speed.
In general, the temperature history can be modeled as

Methodology for sensitivity analysis using uncertainty quantification and deep learning
The UQ process using stochastic method to modeled the input parameters, that is,
Uncertainty characterization
To perform the UQ process, one needs to treat each uncertainty parameter as a random variable. Then, assign each random variable an appropriate probability distribution with pre-defined parameters such as mean and standard deviation.
In WAAM process, these random variables can be the material properties (i.e., thermal conductivity, heat capacity, etc.), the boundary conditions (i.e., convection, radiation, etc.), and the process parameters (i.e., current intensity, velocity, etc.). In this work, for the sake of simplicity, we only consider the current intensity (
Regarding the technical limitations of our experimental setup and the minimum and maximum values achievable within those limits, we choose the uniform distribution The histogram of (a) 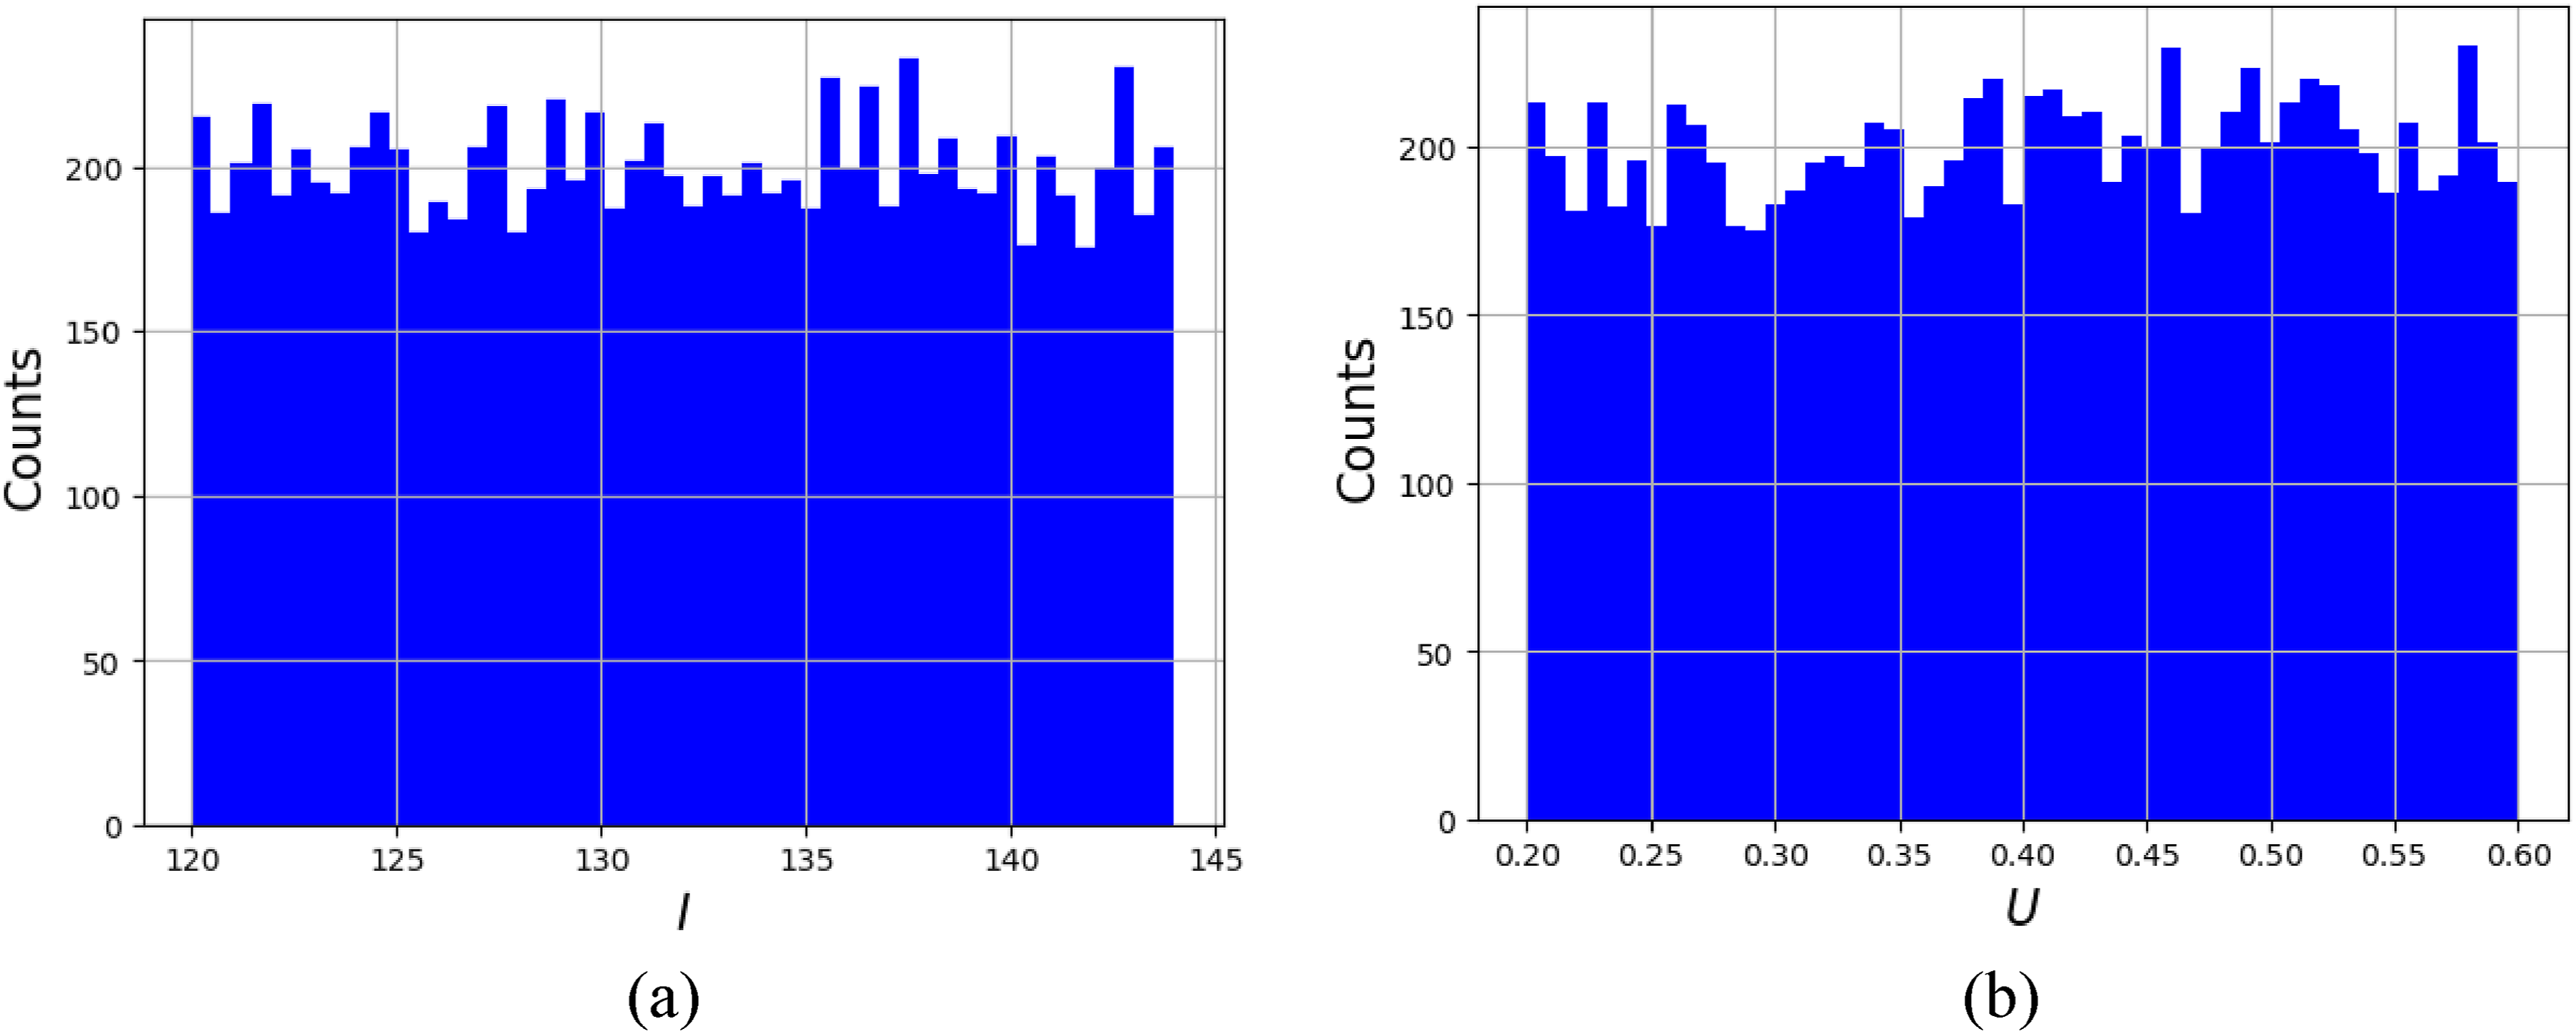
Uncertainty propagation
Several methods can be used to propagate the uncertainty, such as polynomial chaos, radical basic method, and Monte-Carlo (MC) method (Pham et al., 2022b; 2021). This work chooses MC method because of its simplicity and easy interpretation to perform this task. MC method is a powerful computational technique employed to model and analyze systems with significant levels of uncertainty. The method is particularly advantageous for complex systems characterized by non-linearities and multiple sources of uncertainty.
Using the MC method, we generate
The model


After obtaining a set of i.i.d. Sample, the mean and standard deviation of the target can be obtained as:
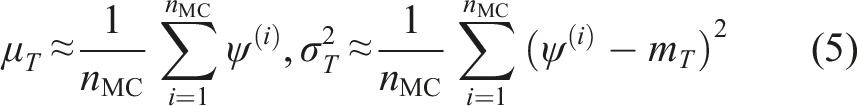
The approximation accuracy is based on the square root of the sample size, denoted as
DL-based surrogate model
In this study, DL-based model was constructed by following these two steps: (i) Data collection and preprocessing (ii) Appropriate DL algorithm selection and model hyperparameter optimization
Dataset Obtained From FE Simulations Used in Training and Testing for DL Model.
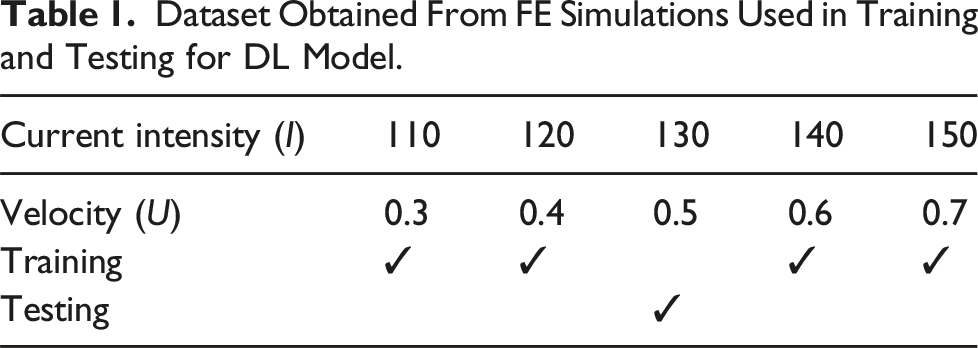
For step (ii), the choice of a FFNN was deliberate, attributed to its proficiency in accurately modeling highly nonlinear and complex relationships in high-dimensional datasets. To evaluate the accuracy of the FFNN model, five datasets, generated through the FE model, were partitioned into two distinct groups: four datasets designated for training, and one dataset allocated for model testing, as detailed in Table 1. Prior to the training process, the data is normalized, ensuring values within the range of 0 and 1. Furthermore, the four datasets within the initial group were randomly separated into training and cross-validation sets, adhering to an 80%–20% ratio.
Sensitivity analysis using variance-based method
This section introduces the third step in our UQ process, namely Sensitivity Analysis (SA). SA holds paramount importance within the process of UQ, providing valuable insights into the underlying physics of the process under uncertainty. Through SA, we can obtain input parameters with significant influence on the uncertainty observed in the final product’s quality. In this study, we adopt the variance-based method (Arnst and Ponthot, 2014) due to its intuitive interpretability. Our SA is exclusively focused on the temperature evolution as an output, serving as a demonstrative framework.
Validation of FE and DL models
Finite element results verification
Figure 5(a) illustrates the dynamic movement of the heat source throughout the process. Figure 5(b) demonstrates the comparison of temperature evolutions predicted by experiment and simulation at P1 (see Figure 5(a)). As observed in Figure 5(b), the temperature evolutions properties, such as peak, are well captured by the simulation, with an RMSE value of 25.52. Since the peak and temperature evolution are among the most critical factors in determining the final material microstructure (Le et al., 2023), a robust predictive FE simulation developed in this study is essential. Overall, the FE simulation has been validated against experimental data and provides high-quality data for training the DL-based surrogate model. (a) The dynamic movement of the heat source throughout the WAAM process and (b) the comparison of temperature evolutions predicted by experiment and simulation at P1.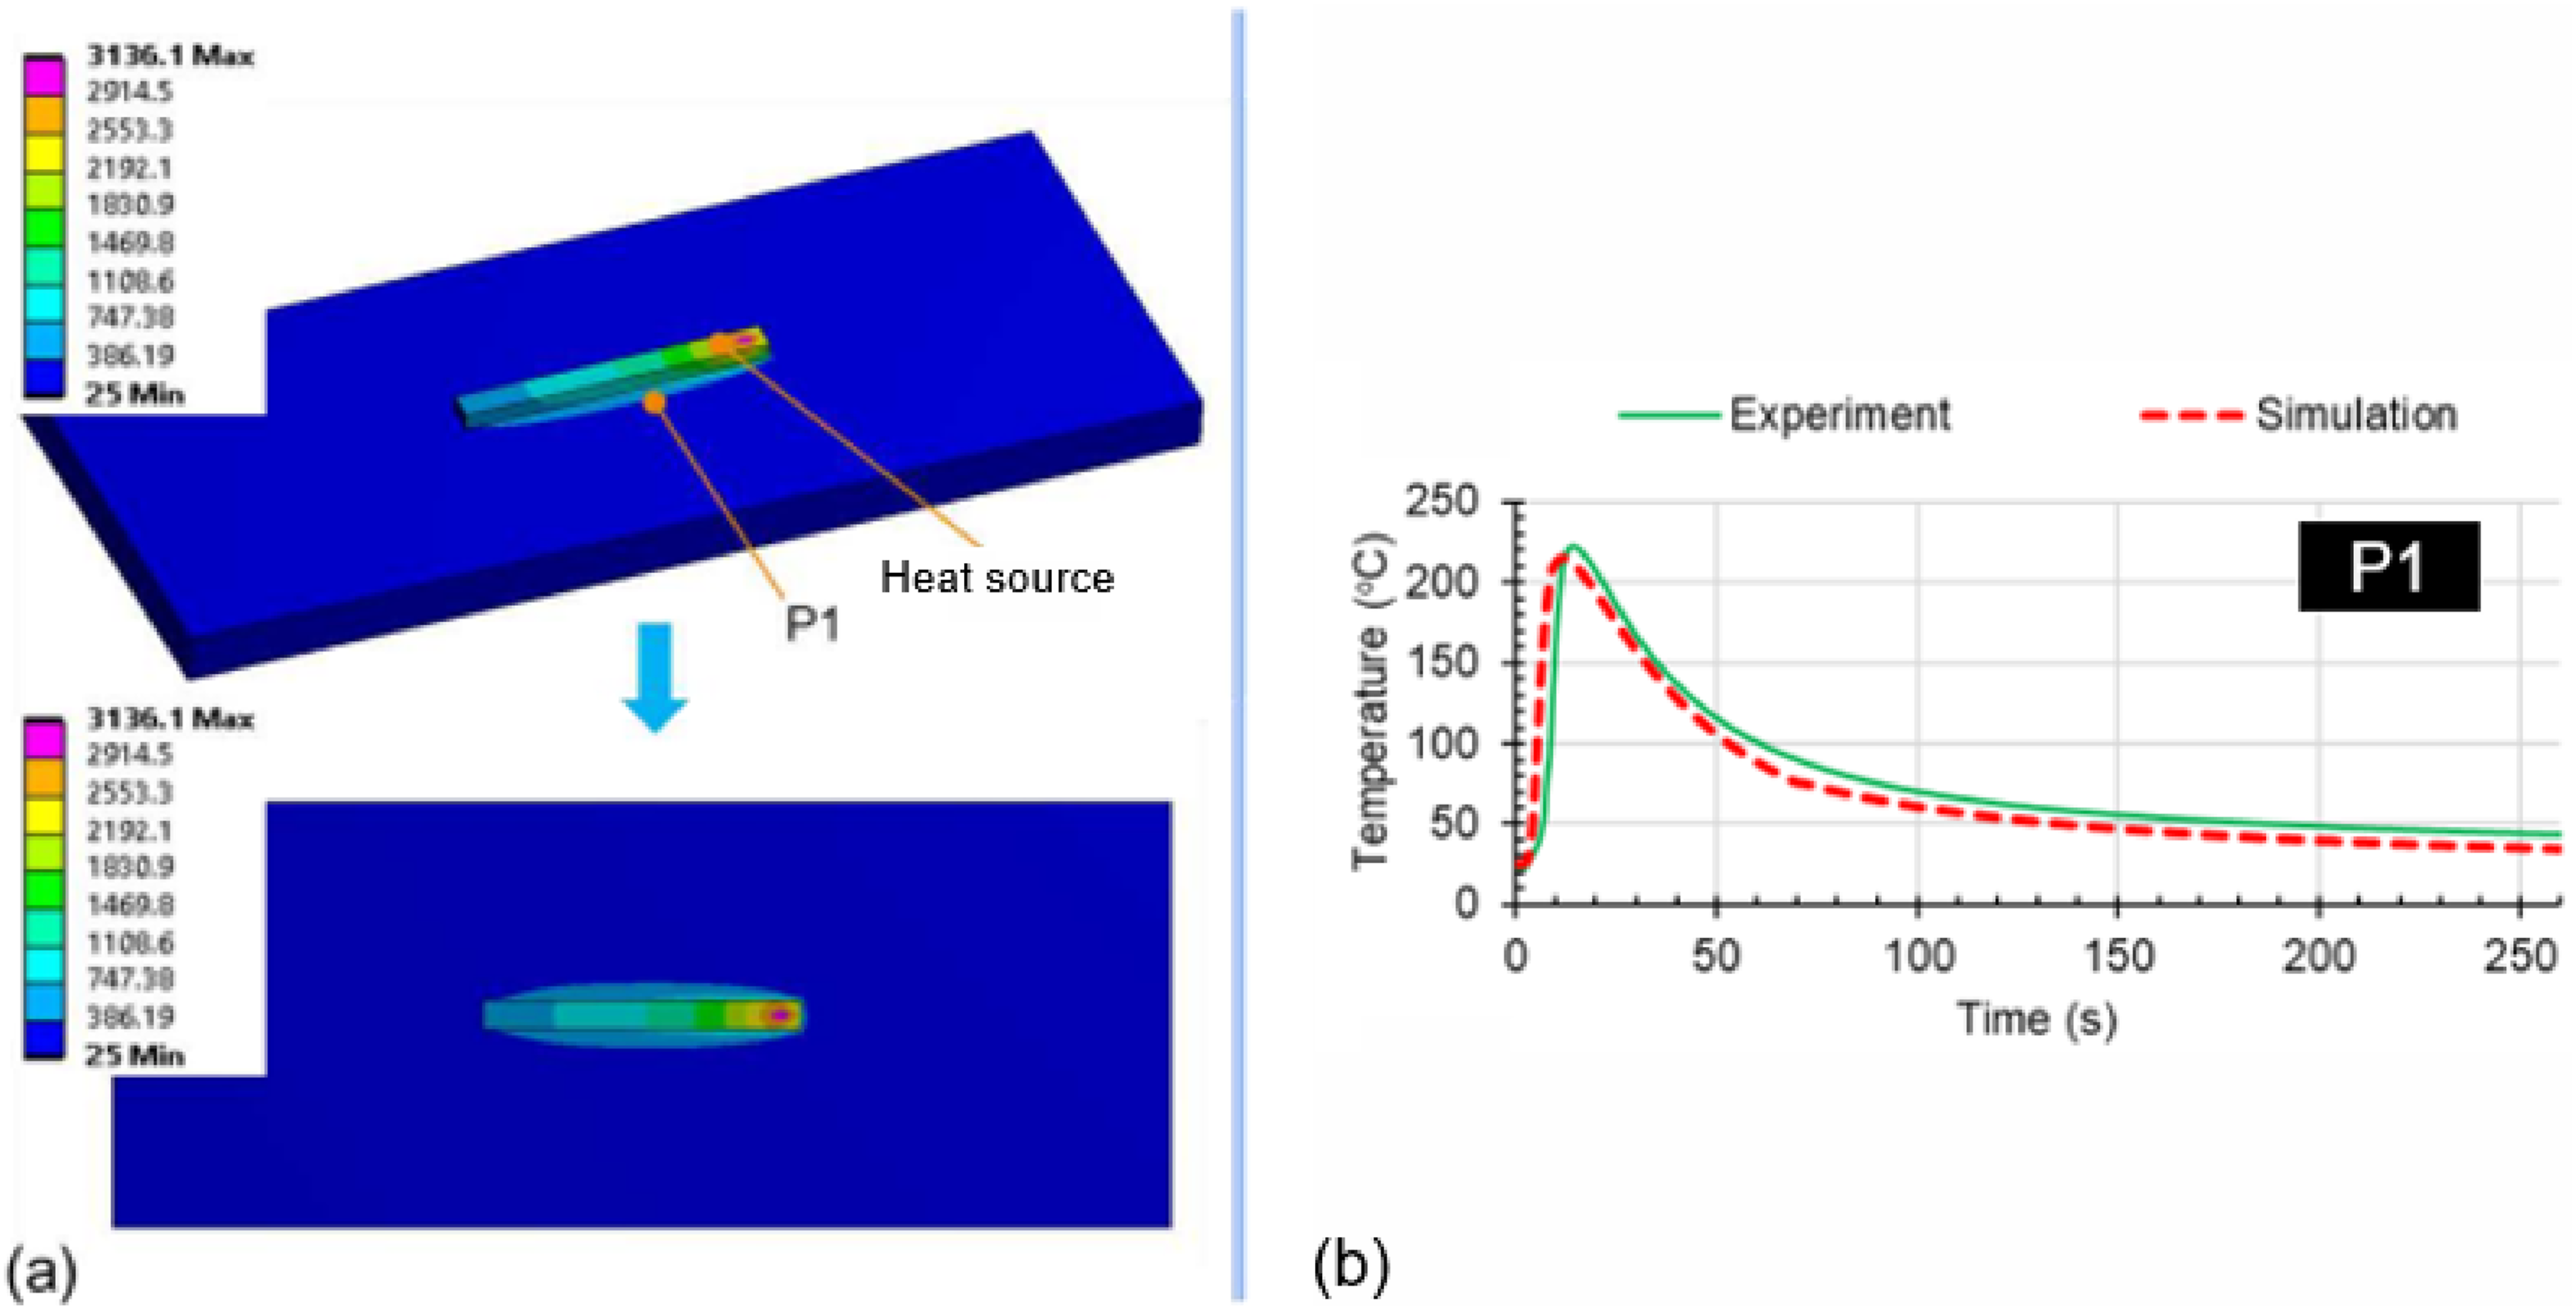
DL-based surrogate model results
To simplify the visualization of the surrogate model’s results, seven specific points were chosen to present the temperature evolutions. To not add substantial length to the paper, we choose only four points as #1322, #1850, #19280, and #19290 (see Figure 6). It should be noted that these points are expected to exhibit the most complex thermal cycles during the WAAM process with high-temperature peaks coupled with gradual cooling cycles. Additionally, these points were extracted from the test dataset that is never seen before by the model during the training and validation processes. Seven selected points to visualize the results.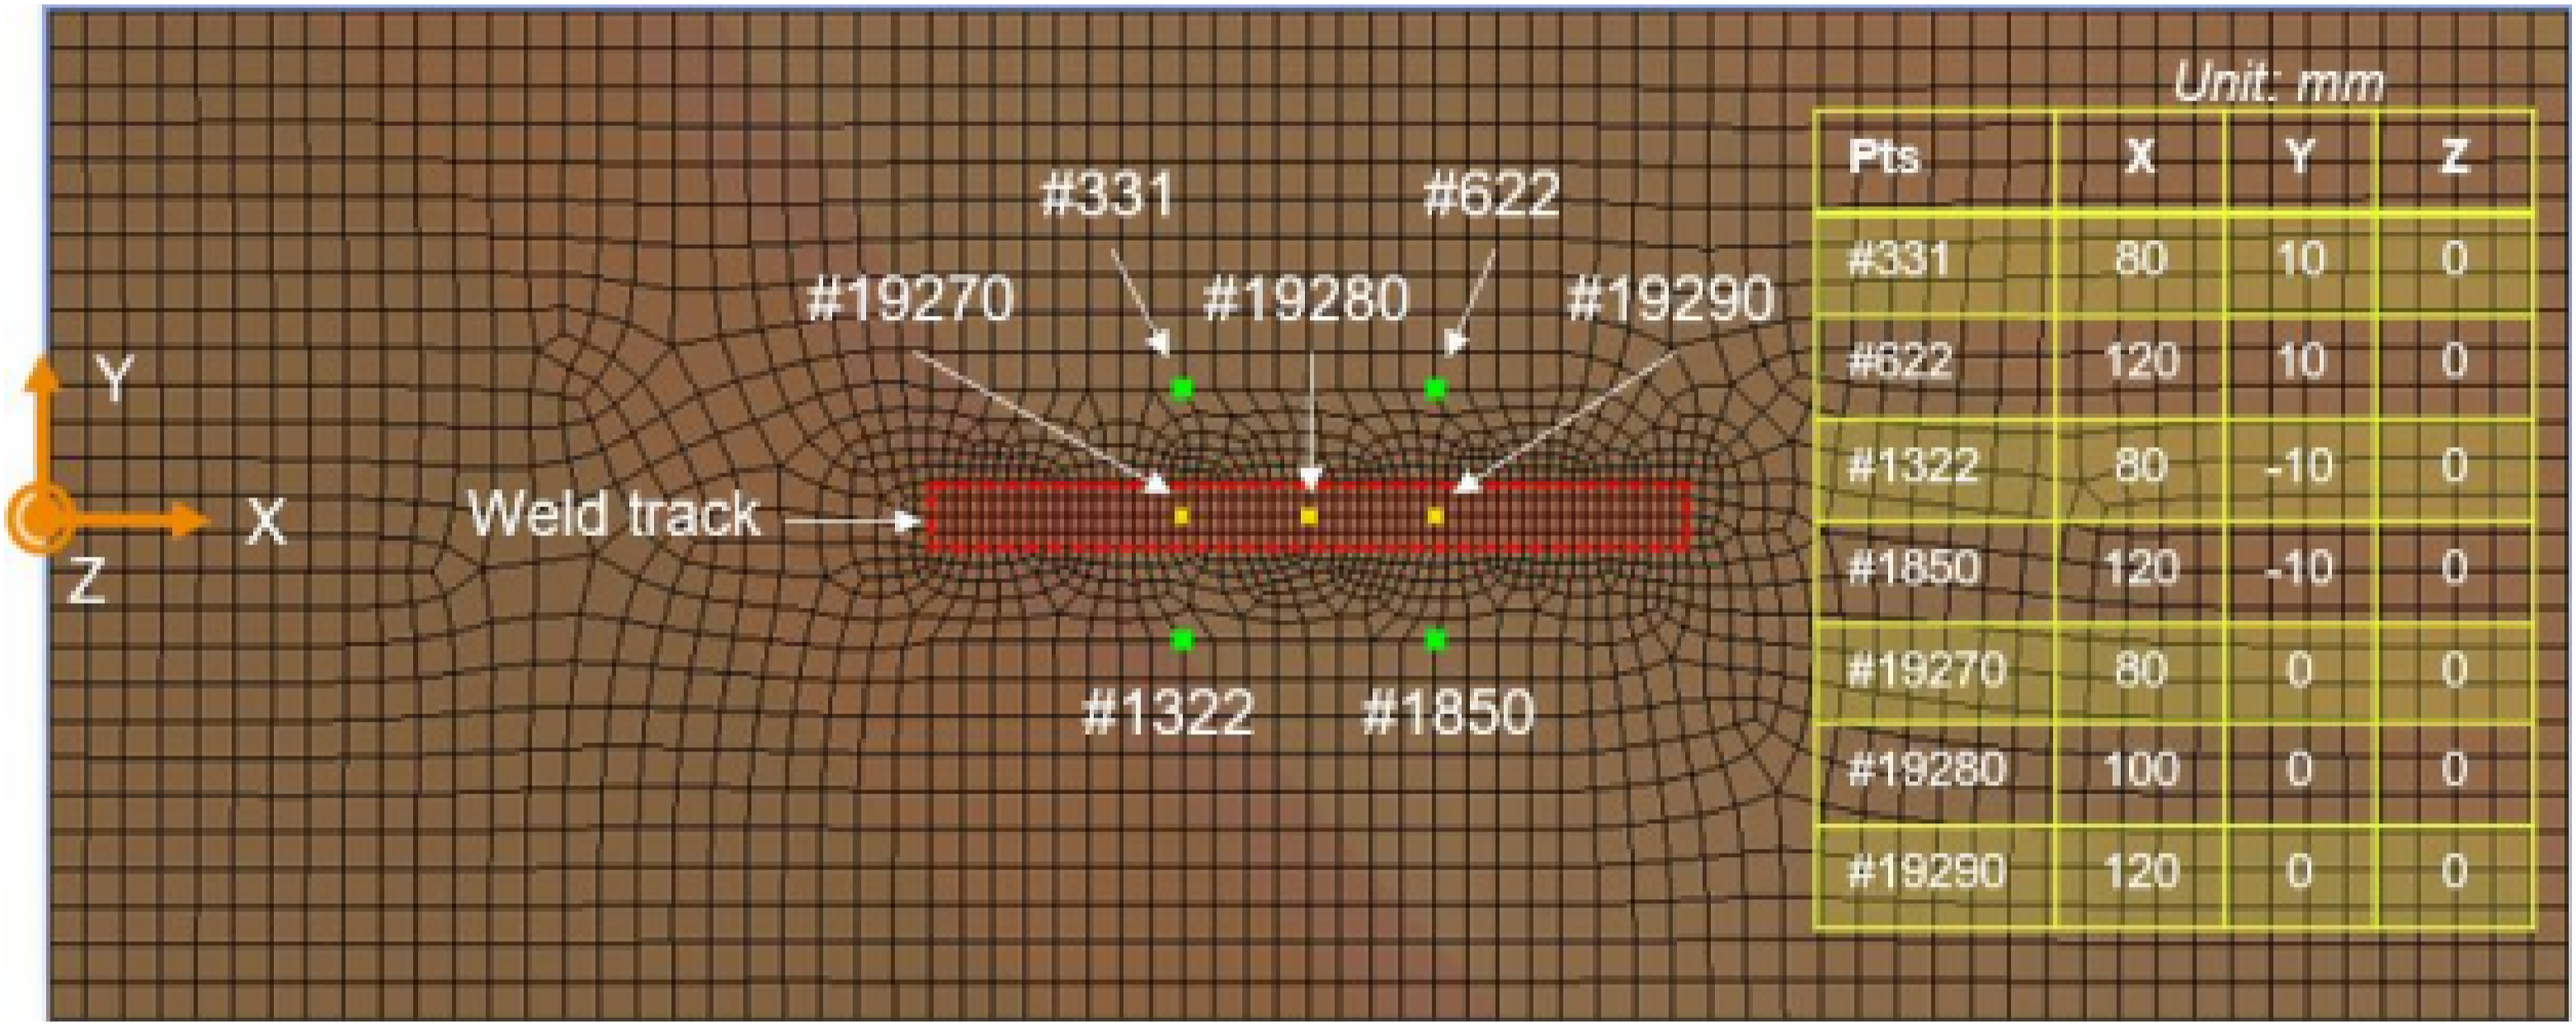
Figure 7 illustrates the temperature profiles predicted from both the FE and FFNN-based models for the four specified points as previously mentioned. The FFNN-based surrogate model effectively captures the temperature at these points, accurately reproducing both the temperature peaks and cooling cycles. Comparison of the temperature evolutions predicted by the FE model and the FFNN-based surrogate model for four selected points.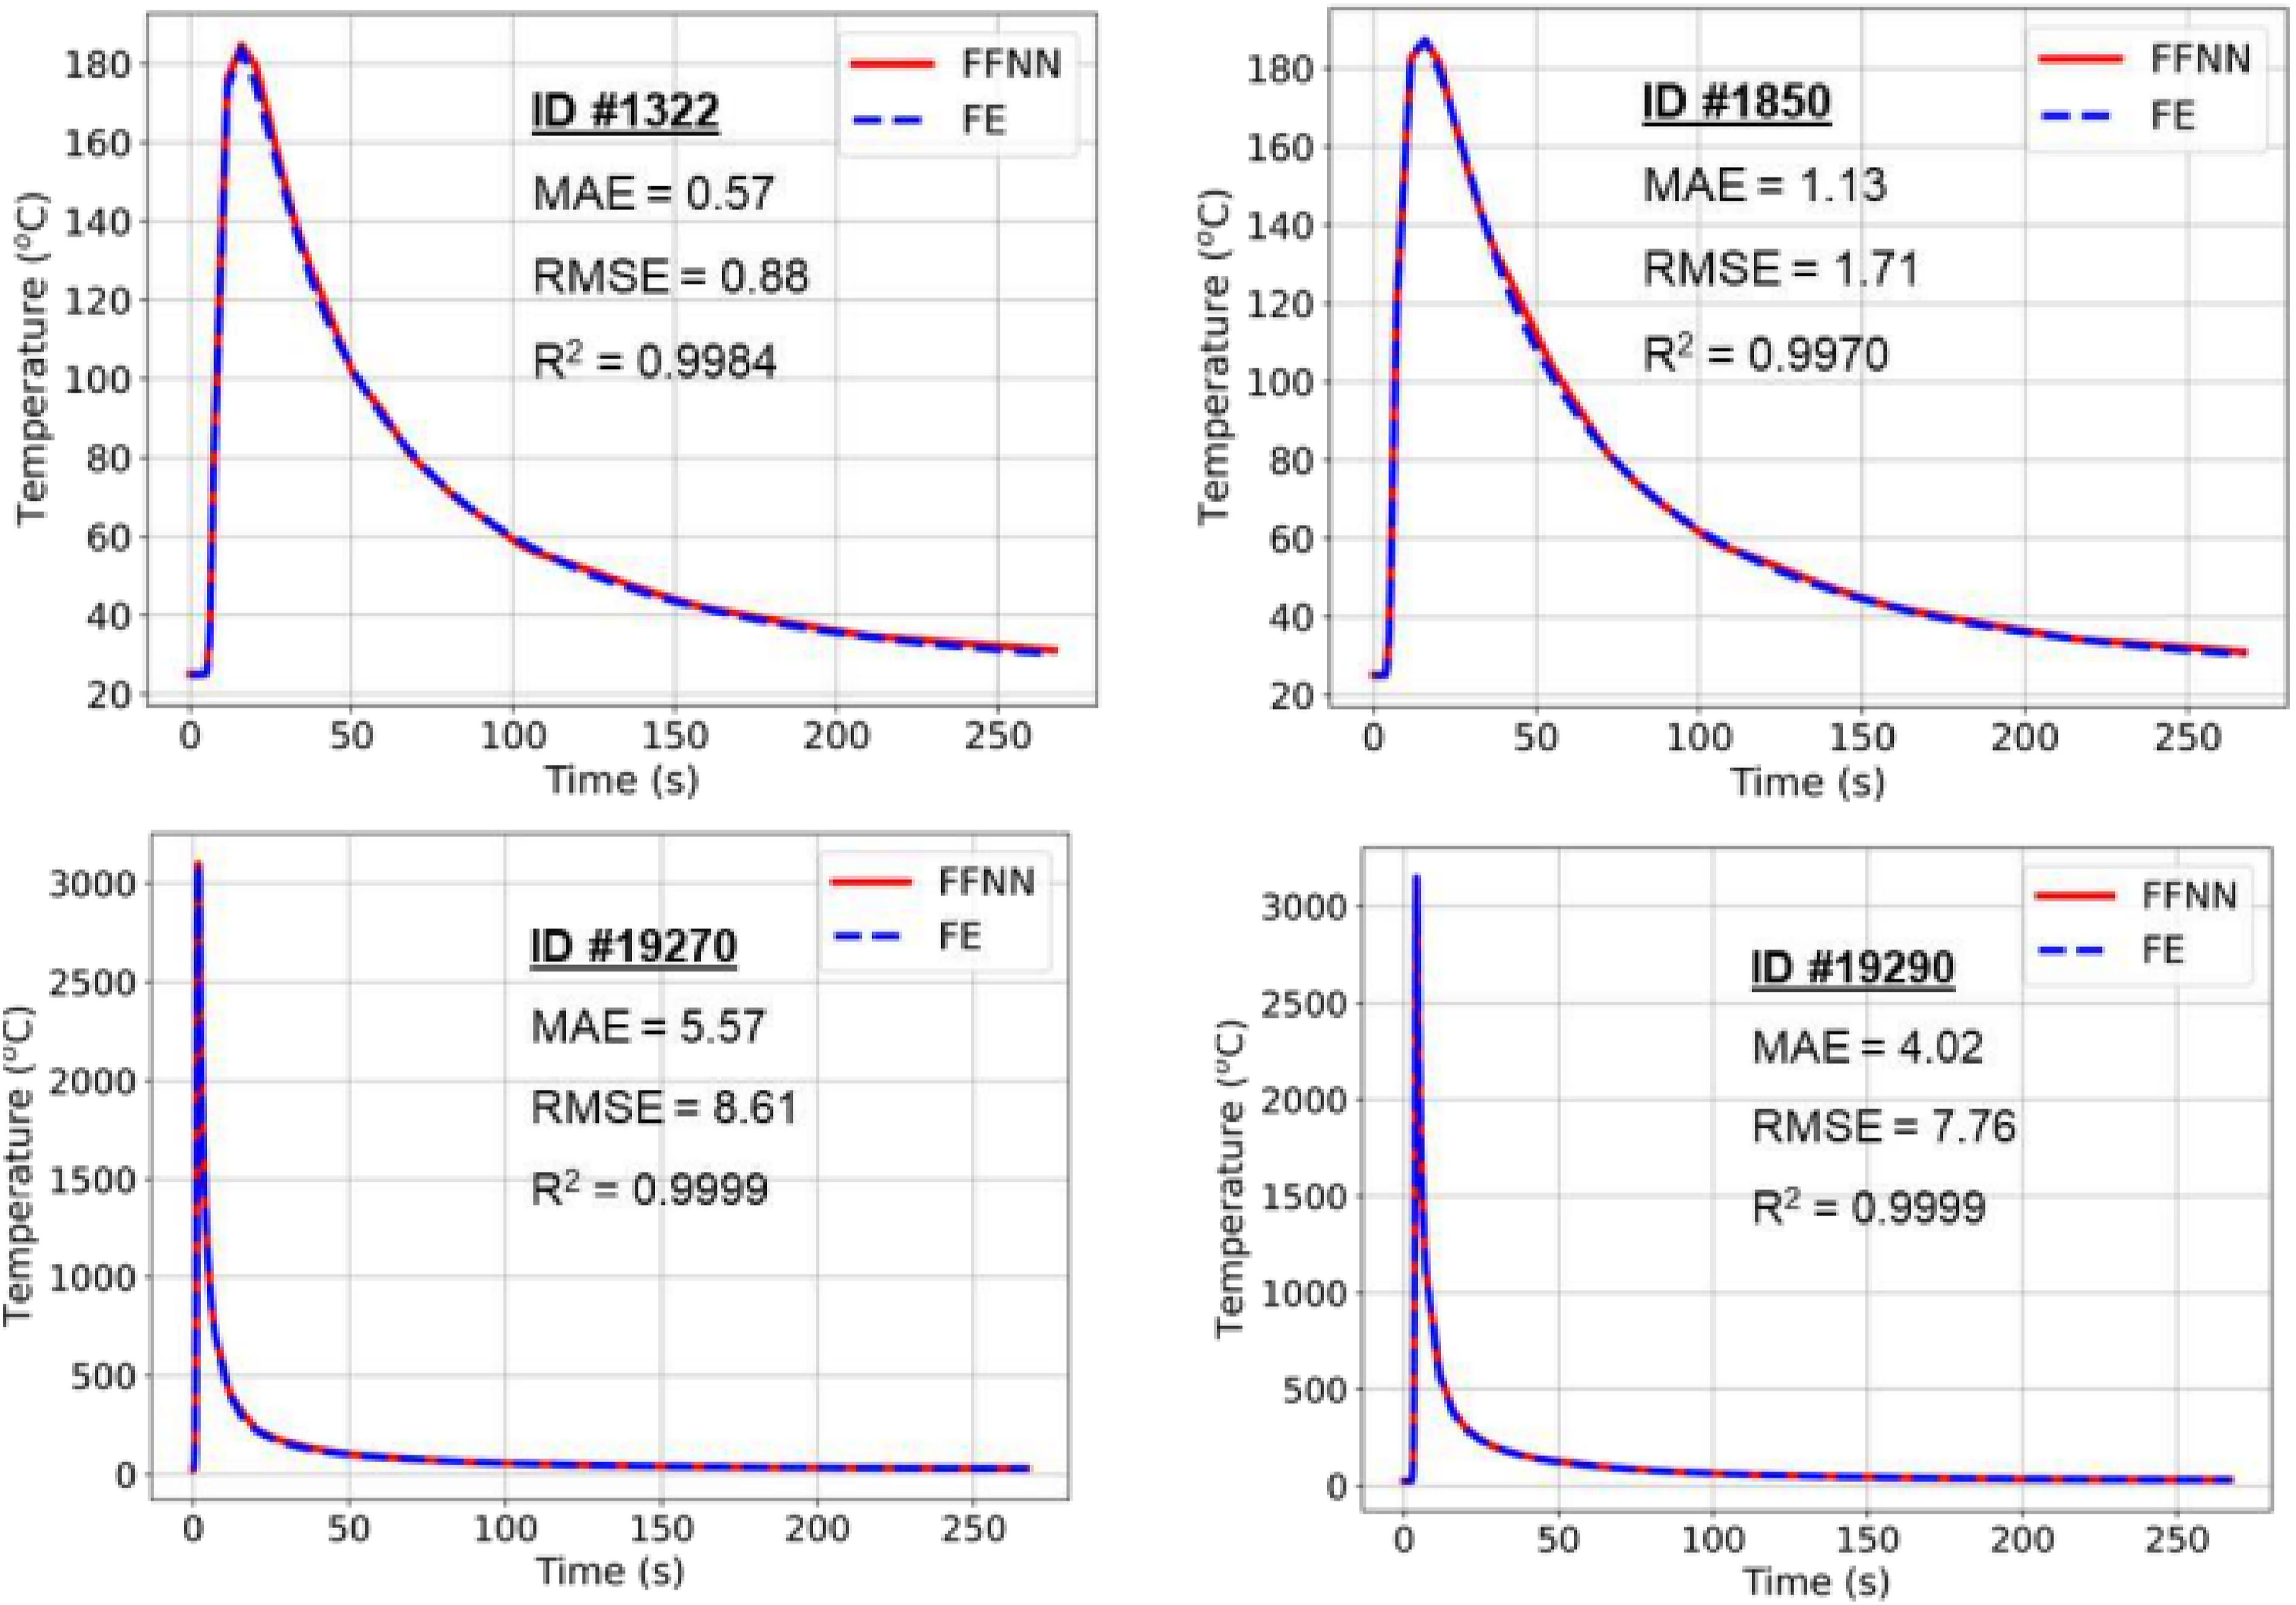
To elaborate, the R2 values computed for these three points exceed 0.99, demonstrating an excellent fit between the predicted and actual values. Additionally, the model exhibits notably low Mean Absolute Error (MAE) and Root Mean Square Error (RMSE) metrics, further attesting to its high precision and fidelity in emulating the temperature dynamics. This high level of accuracy indicates that the FFNN-based model is a reliable surrogate for the FE model, capable of predicting temperature variations with significant precision.
Assessment of predictive capability of the DL-based surrogate model
We evaluate the predictive capability of the DL-based surrogate model by randomly selecting current intensity and velocity values within their probability distribution ranges (see Section 4.1). Specifically, we generate 15 random sets of (I, U) pairs and compare the predictions of the DL model with those of the FE model for each pair.
Figure 8 shows the The 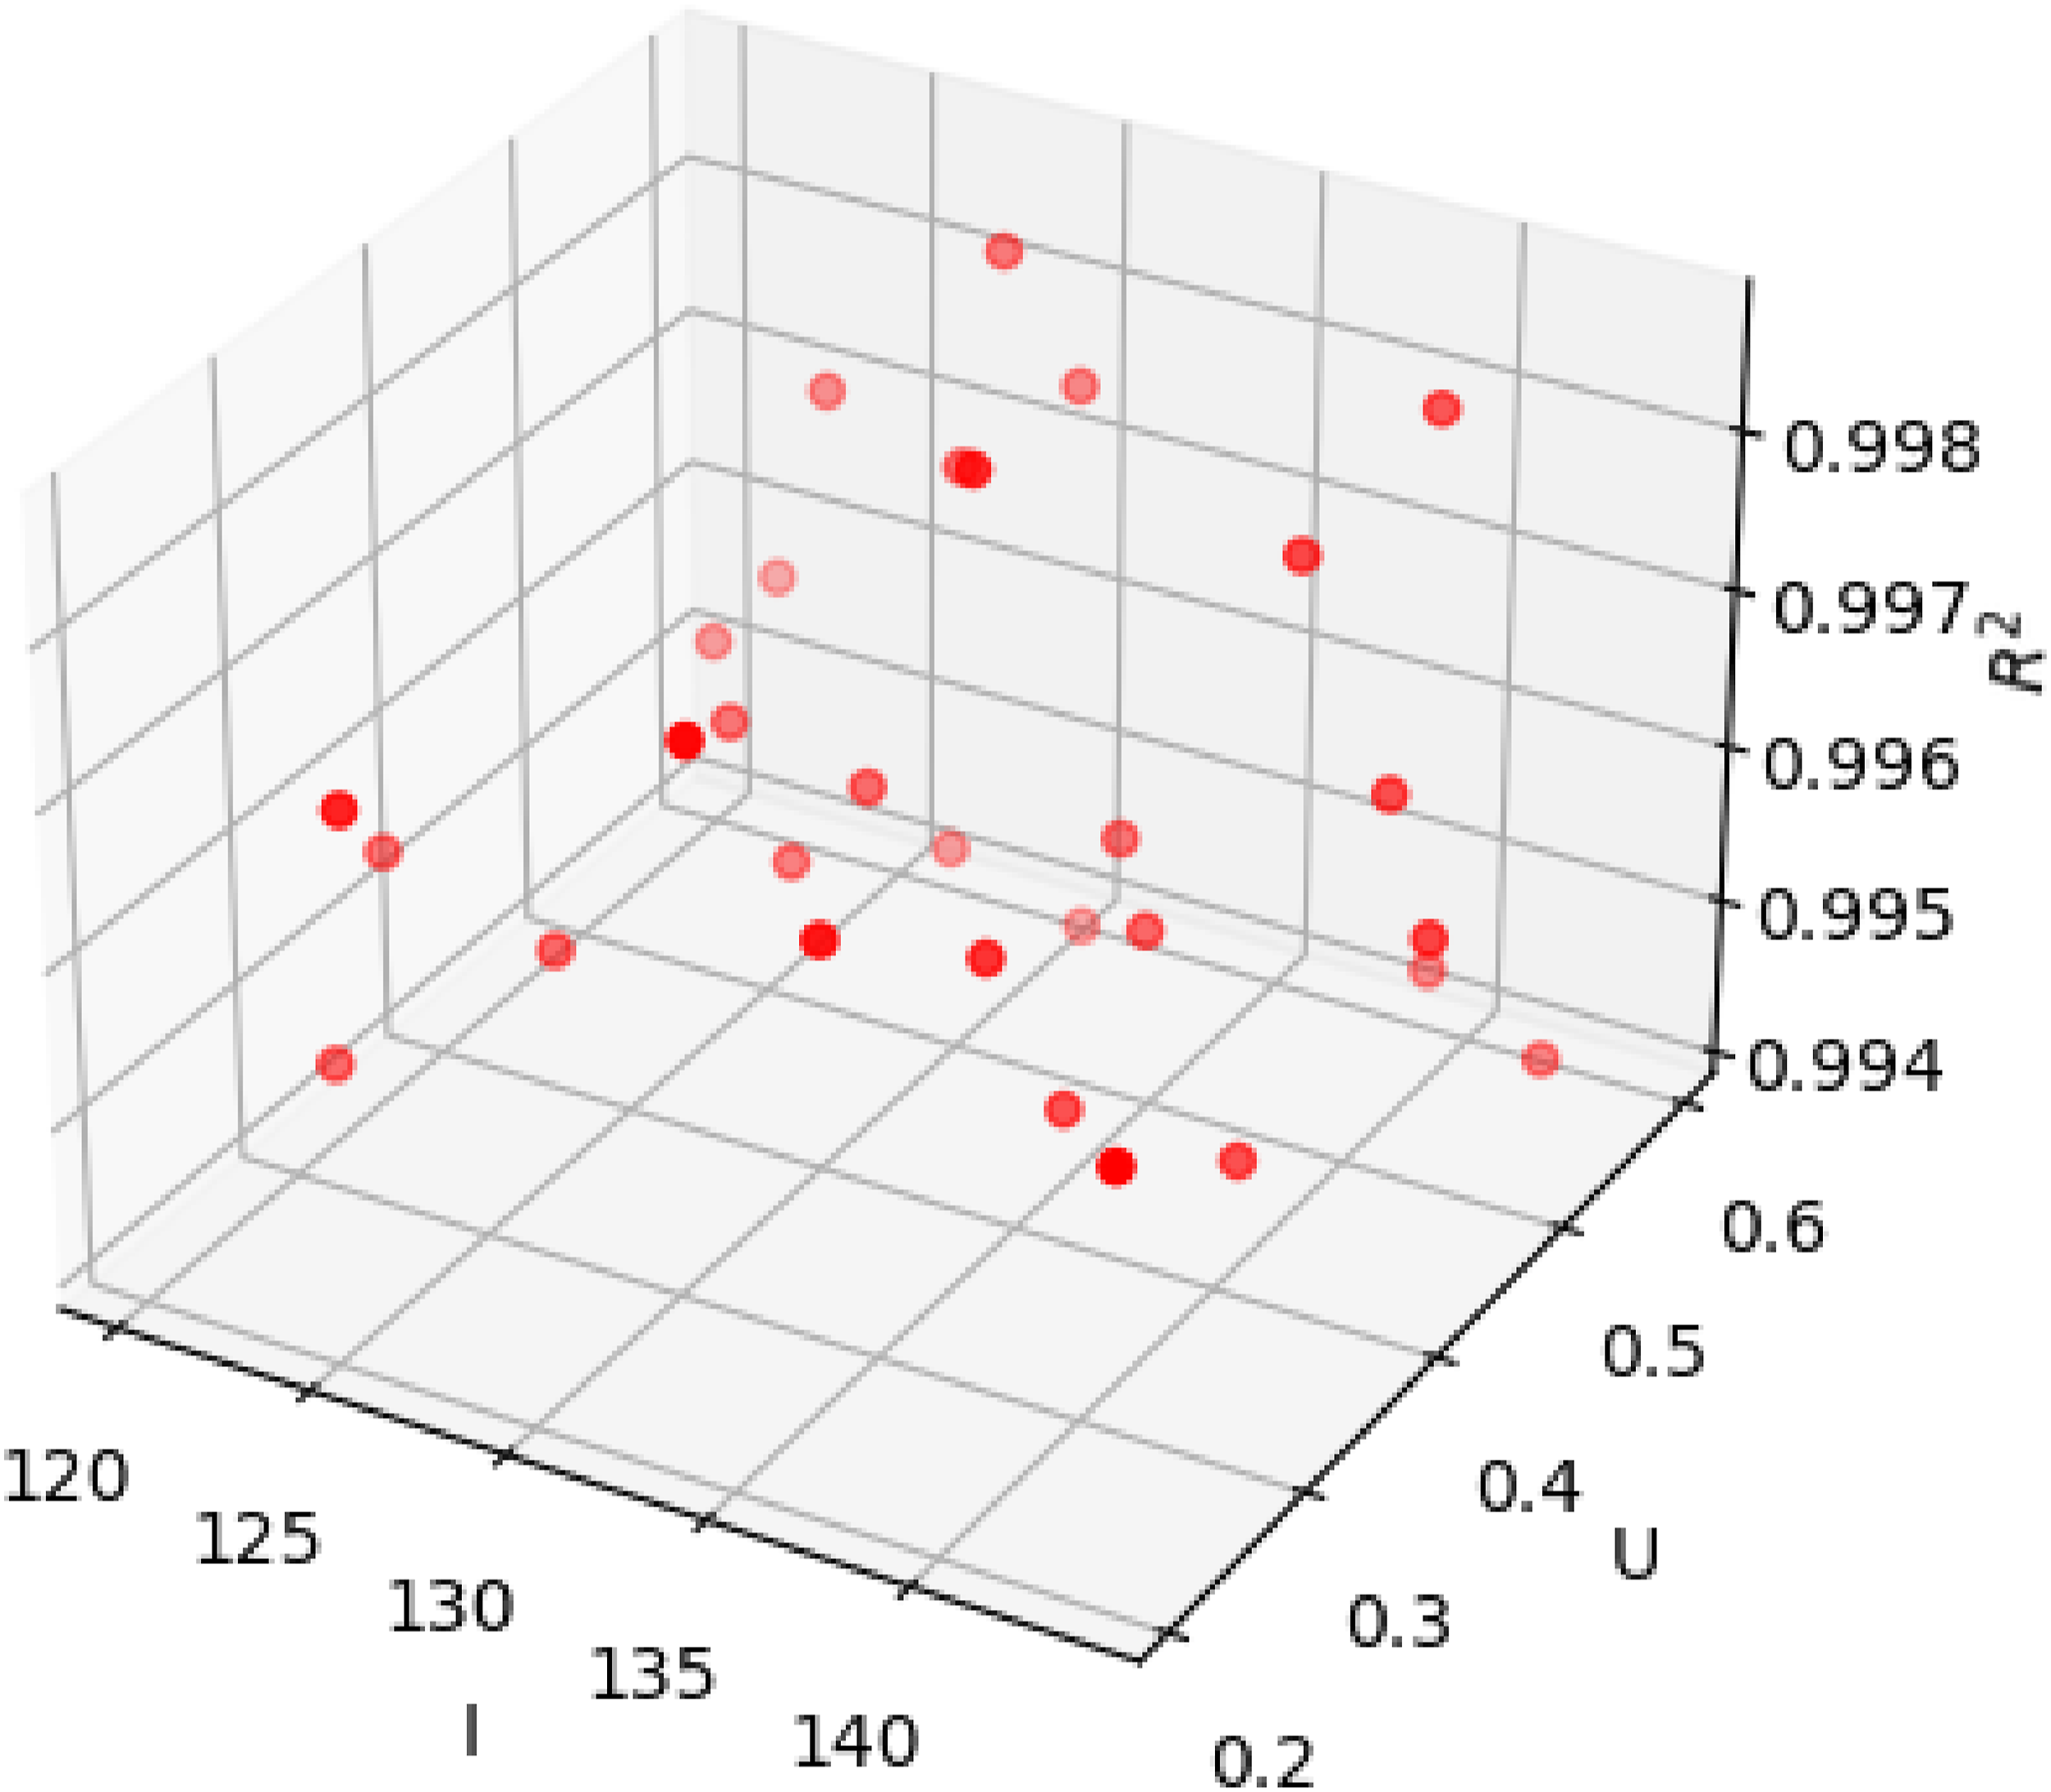
In general, the DL-based surrogate model can predict temperature evolution with reasonable accuracy. In the next section, we perform the UQ process to determine the effect of uncertainty on the final printed product.
Sensitivity studies using uncertainty quantification
To delve deeper into the behavior of the WAAM process parameters and their impact on the final printed product, we embark on an extensive exploration through sensitivity studies. This involves a rigorous quantification of the impact of each parameter on both the temperature field and the cooling rate. By doing so, we can make precise adjustments and optimizations to enhance the overall process.
Furthermore, we address the crucial aspect of uncertainty reduction in WAAM. This step is pivotal in ensuring the reliability and consistency of the printing process. By systematically identifying and mitigating sources of uncertainty, we aim to achieve a high level of repeatability and accuracy in the manufacturing process.
Convergence of Monte-Carlo simulation
Figure 9 shows the mean and standard deviation of the maximum temperature at point #1850 with respect to the number of MC simulations ( The mean and standard deviation of the maximum temperature at point #1850 with respect to the number of MC simulations (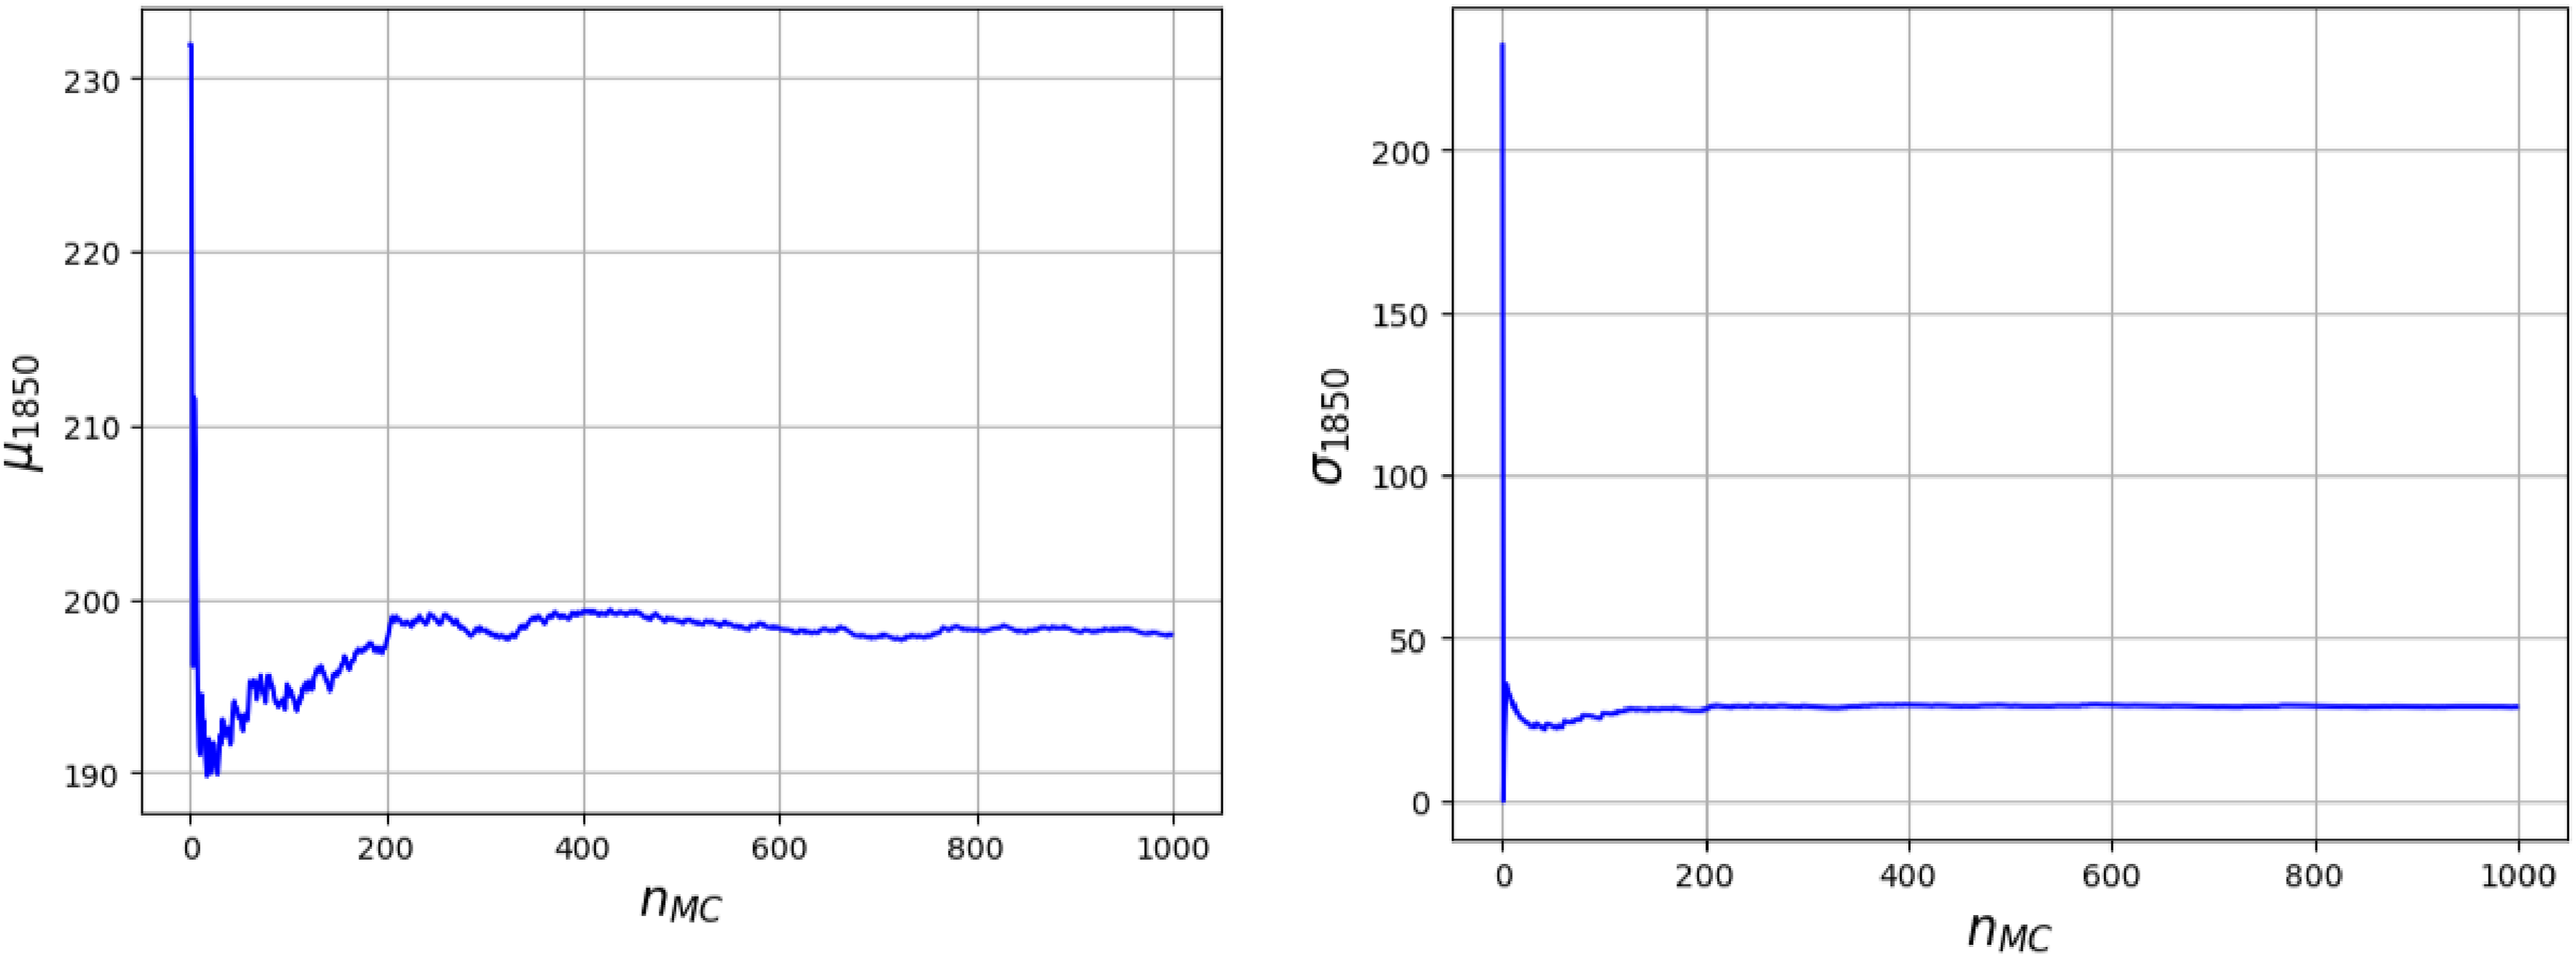
Propagation of uncertainties
Figure 10 presents a set of 800 temperature evolution samples gathered from four distinct points (#1322, #1850, #19270, and #19290) via Monte Carlo (MC) simulation. This figure highlights the significant impact of inherent uncertainties arising from current intensity and velocity on temperature evolution at these specified points. 800 samples of temperature evolutions at four points, #1322, #1850, #19270, and #19290 obtained by the MC simulation.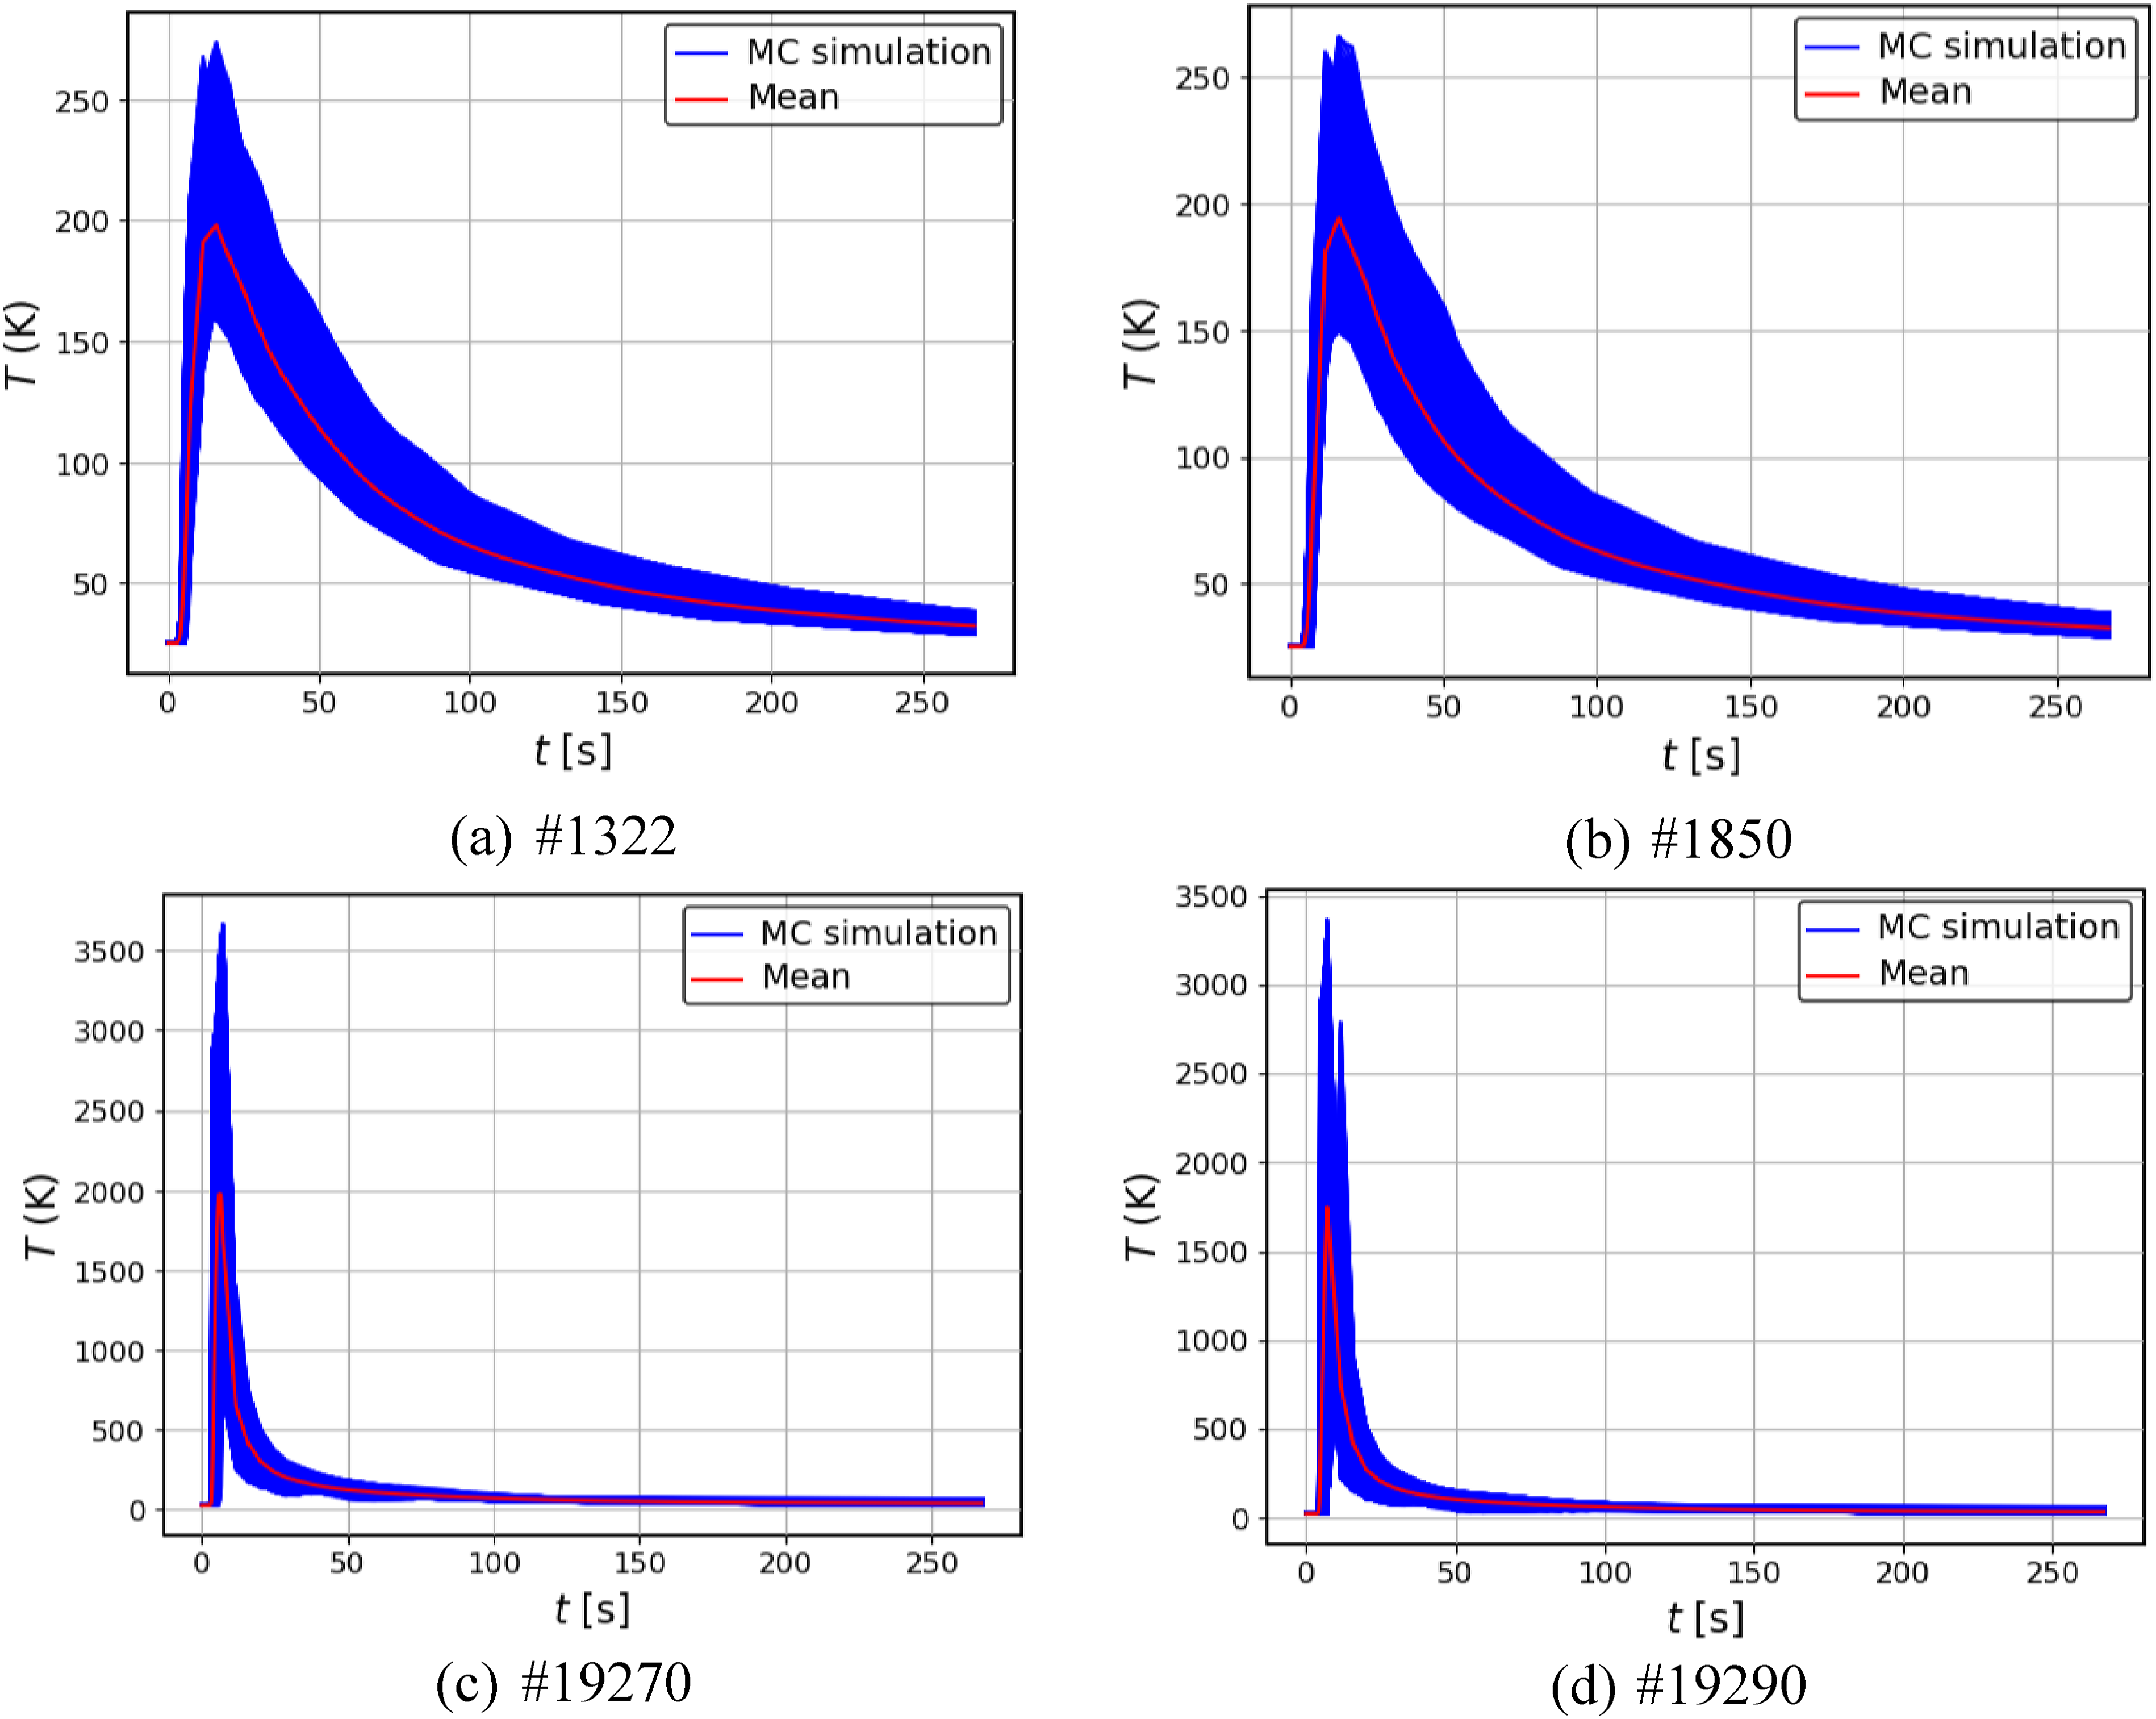
Notably, the temperature profiles exhibit variations of up to 25% relative to their respective mean values across all four points. Additionally, the initial temperature peaks at these points demonstrate variances of up to 1500 K compared to their mean values. This substantial variation underscores the critical influence of these parameters on the thermal behavior within the process.
Such pronounced variability indicates that even slight fluctuations in current intensity and velocity can lead to significant differences in temperature evolution, which in turn can affect the final material properties and microstructure. Therefore, understanding and mitigating these uncertainties is crucial for improving the consistency and quality of the final product.
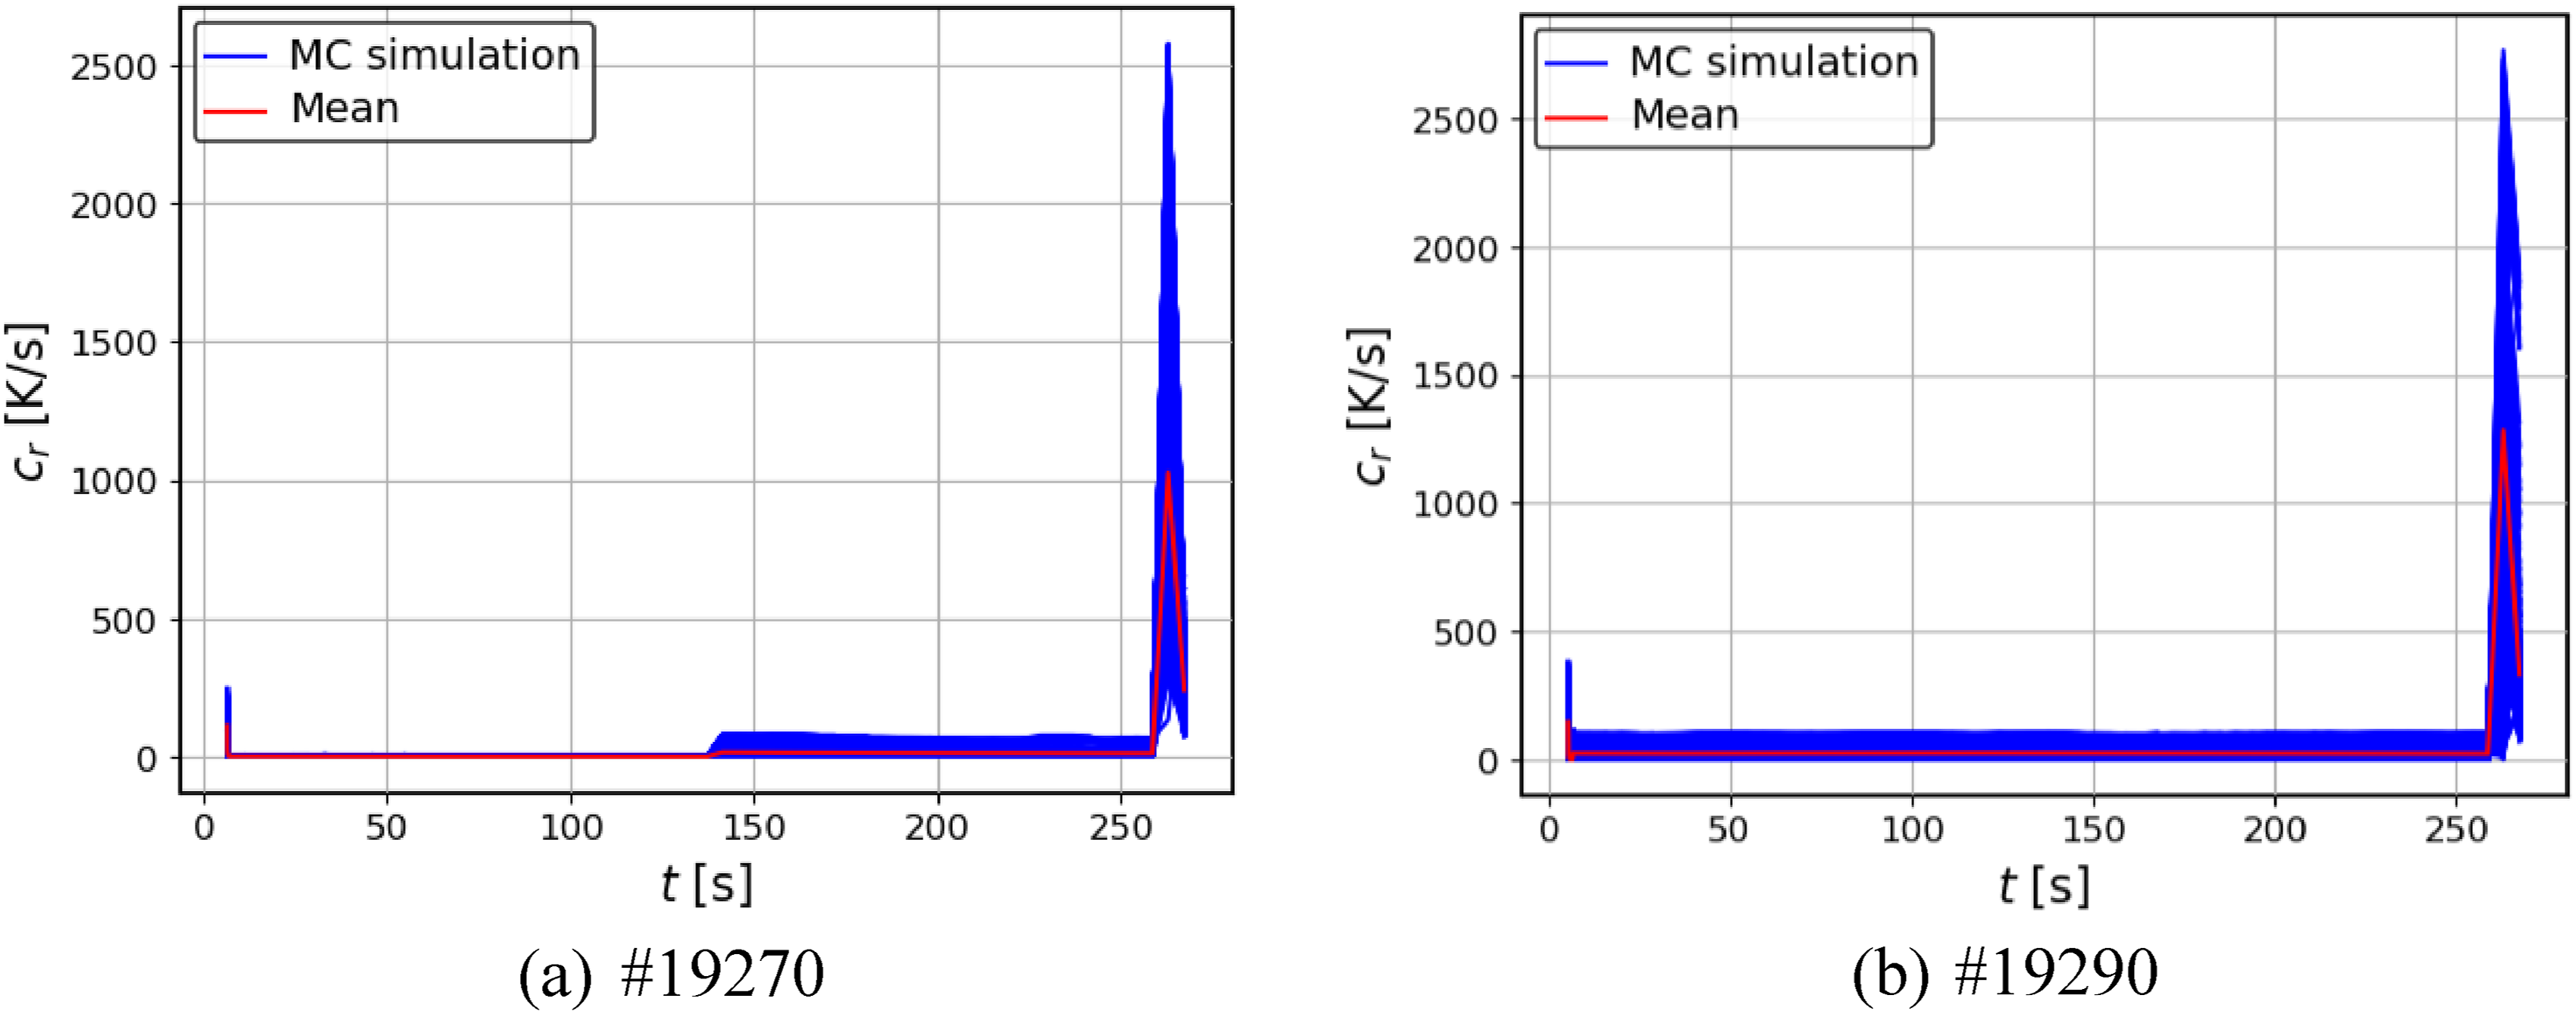
The cooling rate holds a pivotal role in dictating microstructure formation during the WAAM process (Ou et al., 2018; Singh and Khanna, 2021; Scotti et al., 2020). By comprehending how uncertainties affect the cooling rate, we gain valuable insights into the microstructural characteristics of each clad point and potential defect generation. Hence, we extend our analysis to include UQ on the cooling rate. This parameter is calculated as follows: 800 samples of cooling rates at two points #19270, and #19290 obtained by the MC simulation. Note that, we do not perform the MC simulation on two points #1322 and #1850 because their maximum temperature is smaller than the liquidus temperature.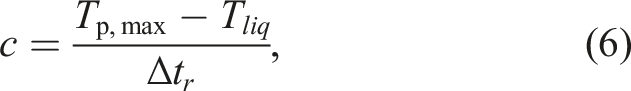
Sensitivity studies using variance-based method
This section conducts a sensitivity analysis of key WAAM process parameters (i.e., current intensity and velocity), evaluating their impact on both the temperature field and cooling rate. It’s important to note that for a comprehensive perspective, additional WAAM process parameters such as arc length, wire feed rate, and others should also be considered as inputs in the sensitivity analysis. Additionally, an uncertainty reduction technique is implemented to refine the variability of the cooling rate under uncertain conditions.
Effects of WAAM process parameter on temperature field
This section discusses the sensitivity analysis results after performing the UQ process. Figure 12 shows the Sobol indices of two uncertain inputs ( Sobol indices current intensity and velocity.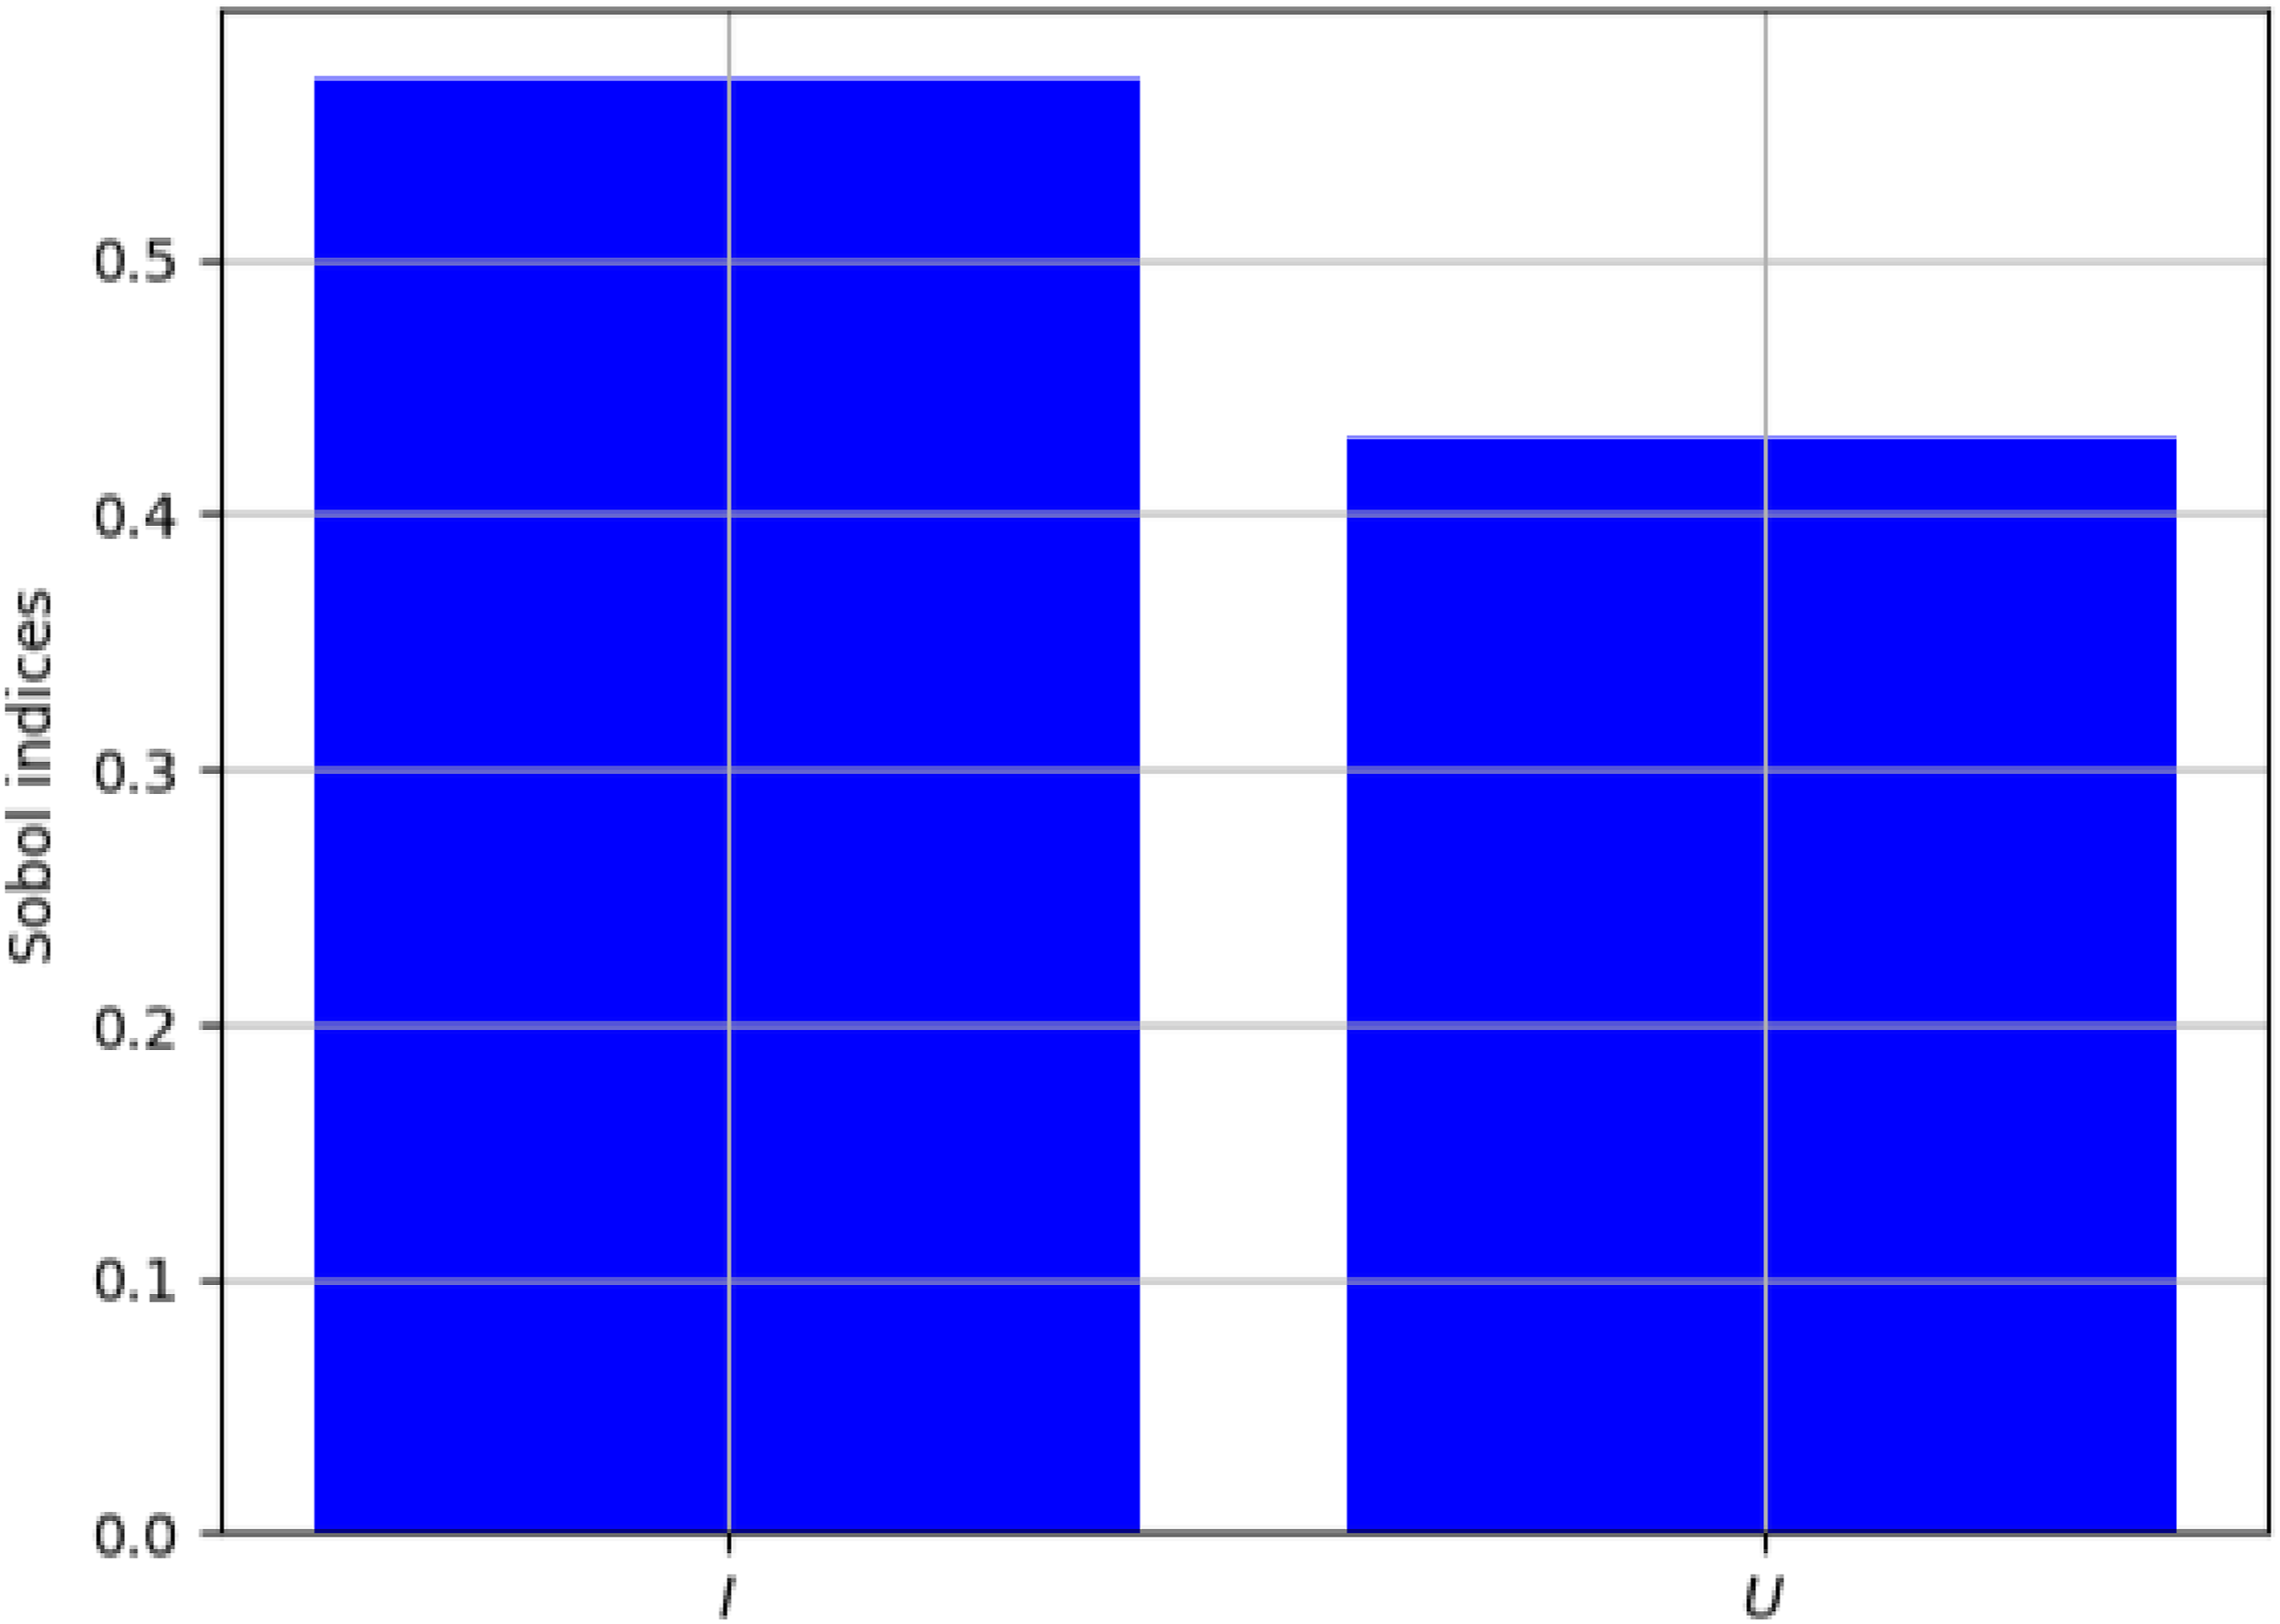
Effect of WAAM process parameter on cooling rate
The cooling rate holds a critical role in governing microstructure formation within the WAAM process. Delving into the influence of process parameters on this rate provides valuable insights into the microstructures of individual clad points and the potential for defect generation. Consequently, this section delves into the impact of WAAM process parameters on the cooling rate, as predicted by the ML-based surrogate model.
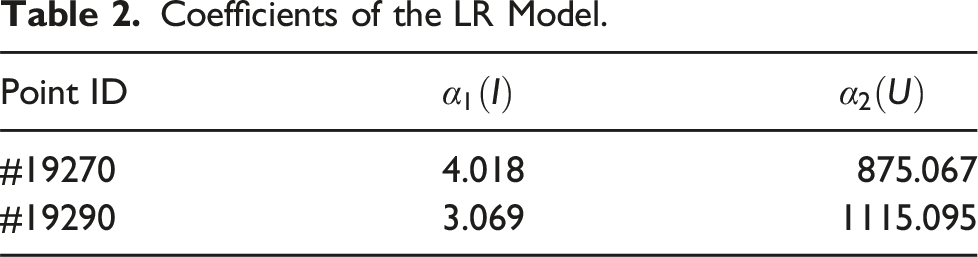
With datasets comprising approximately 100 data points for each input, our initial step involves constructing a Linear Regression (LR) model for the cooling rate. Subsequently, we proceed to conduct a parameter study based on the regression coefficients. The LR model is mathematically represented as follows:
These coefficients (
Coefficients of the LR Model.
Discussion
Uncertainty reduction of WAAM process
Given that the material microstructure is markedly influenced by the cooling rate, a process that is less susceptible to uncertainties stemming from various parameters affecting this rate contributes to enhanced control over the WAAM process. Nevertheless, it’s important to acknowledge that these uncertainties are inherent in real-world printing systems. Hence, quantifying the precise ranges of these uncertainties that impact the cooling rate is of paramount importance, and this assessment will be addressed in this section.
Figure 13 depicts the reduction in uncertainty regarding the cooling rate at two specific points through the control of two critical WAAM process parameters: current intensity and velocity. The figure clearly shows that as uncertainties in these parameters are minimized, there is a corresponding decrease in the standard deviation of the cooling rate. The uncertainty reduction of the cooling rate at two points #19270 (a) and #19290 (b).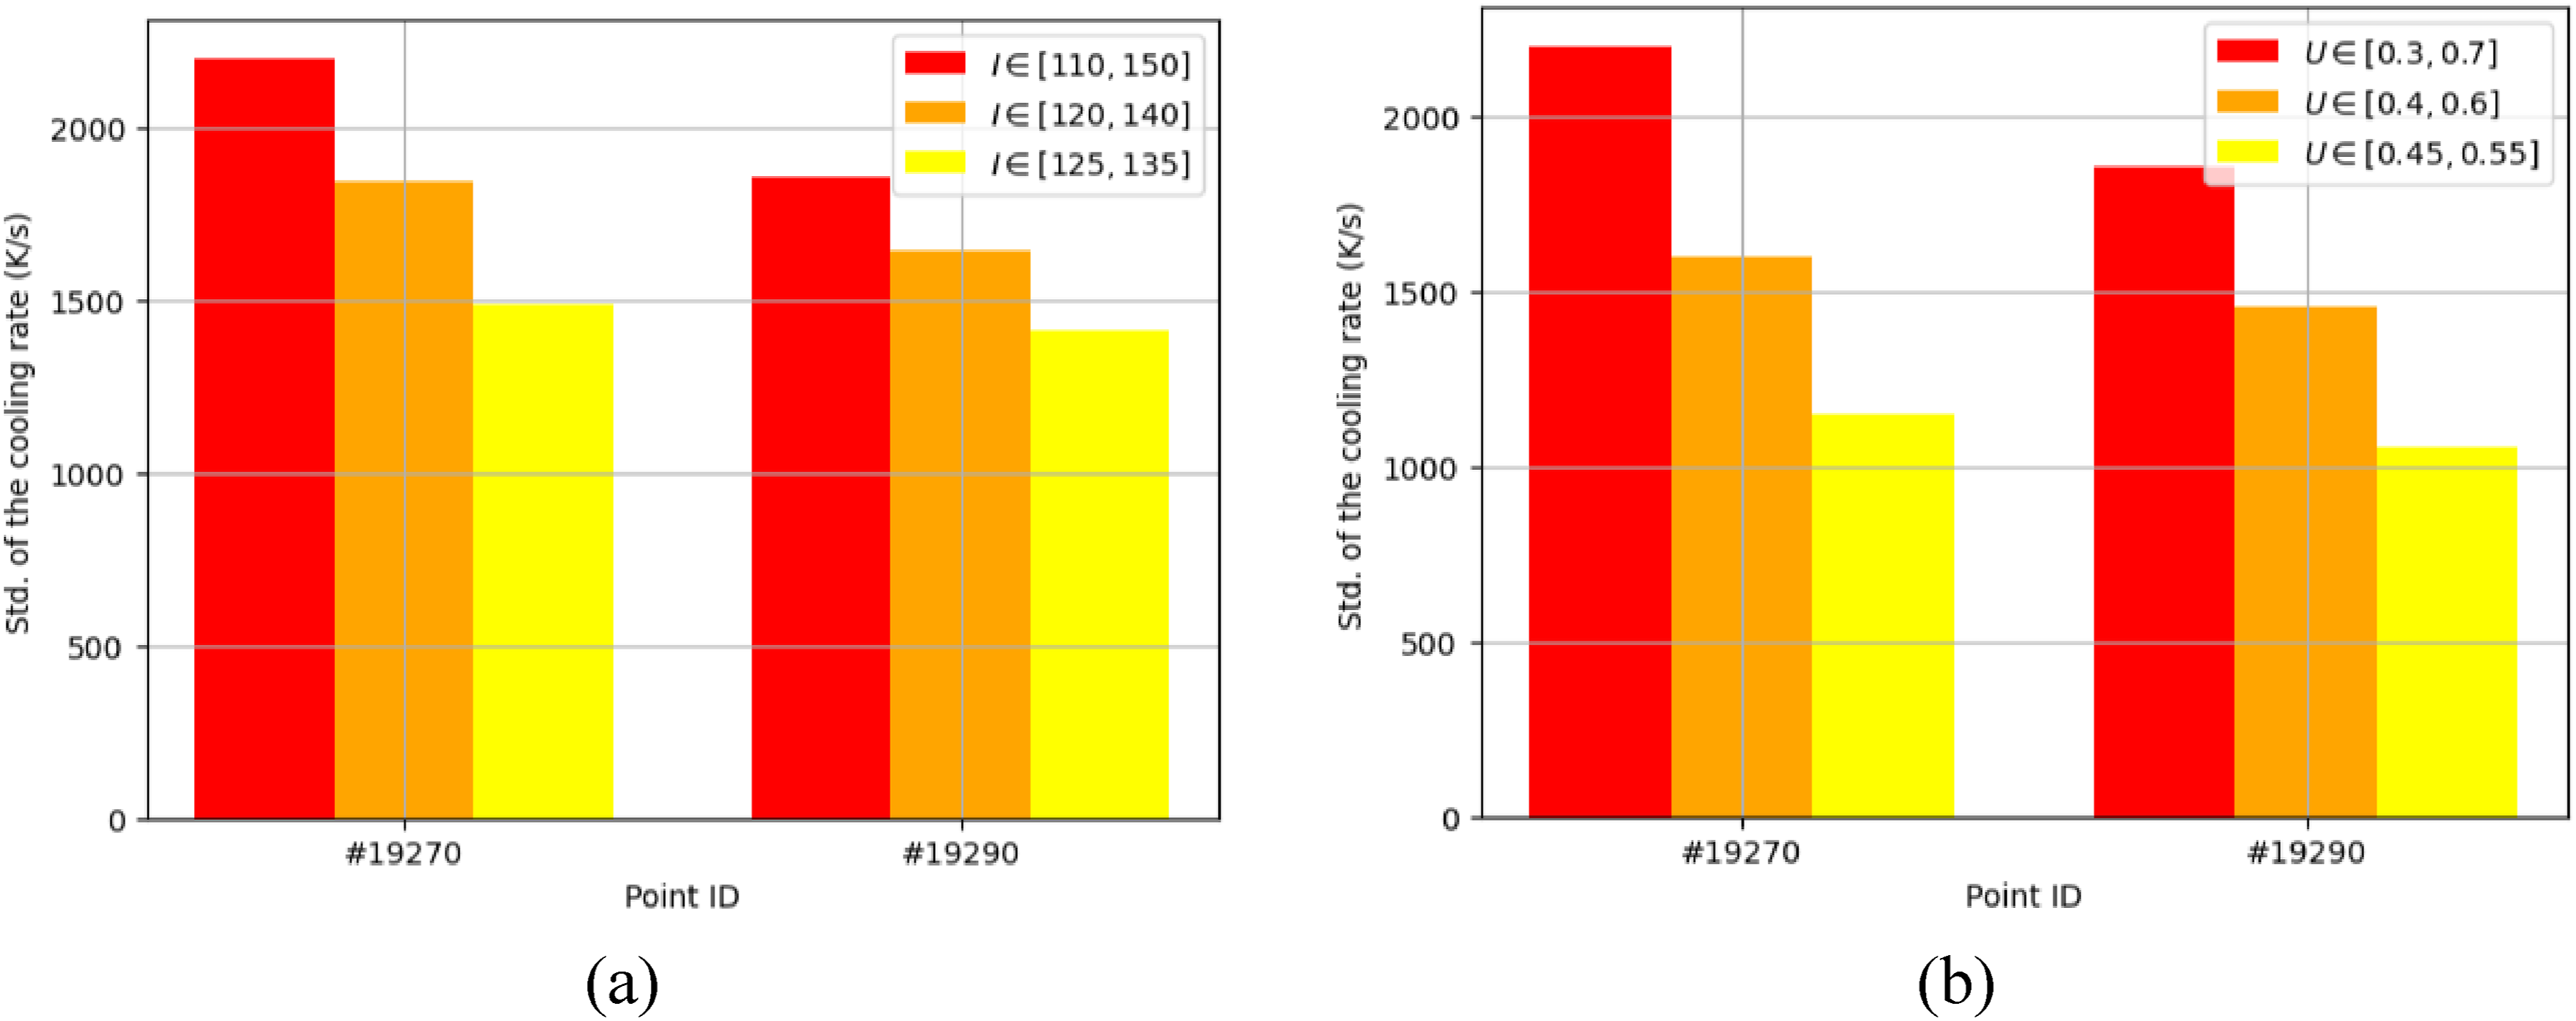
Notably, reducing uncertainty in scanning speed appears to be the most effective means of decreasing uncertainty in the cooling rate. This indicates that precise control of scanning speed can significantly enhance the predictability of the cooling rate, thereby improving the consistency and quality of the final product.
This insight underscores the importance of focusing on scanning speed optimization in WAAM processes to achieve more reliable and uniform thermal behavior. For instance, to optimize temperature evolution under uncertainty, increasing the weight assigned to scanning speed can be particularly effective, as it significantly reduces uncertainty (see Figure 13). In addition, by focusing on the scanning speed, the need for extensive trial and error in setting up the WAAM process is minimized. This leads to significant time and cost savings during the initial setup and during production runs.
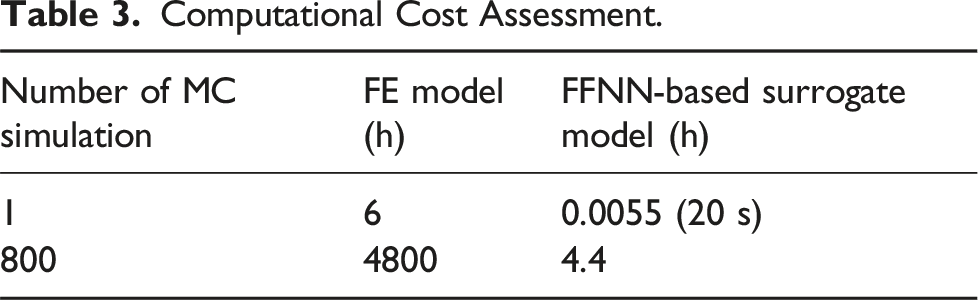
Computational assessment
Computational Cost Assessment.
Conclusion
This study employs a deep learning (DL) based stochastic approach to comprehensively interpret the effects of current intensity and velocity variations on temperature evolutions in the wire arc additive manufacturing (WAAM) process of a thin wall. Initially, a DL-based surrogate model is constructed using data obtained from a high-fidelity validated finite element (FE) model, ensuring an impressive 99% accuracy compared to the FE model while reducing computational costs. Subsequently, probabilistic methods are used to characterize uncertainties in current intensity and velocity, and the Monte-Carlo method is applied for uncertainty propagation. The findings illustrate that variations in the input parameters can lead to significant fluctuations in temperature evolutions. Additionally, a sensitivity analysis is conducted to precisely quantify the influence of each input parameter. Finally, an uncertainty reduction is performed to enhance the variation of cooling rate. In general, this study is expected to make precise adjustments and optimizations to enhance the overall WAAM process.
Footnotes
Author contributions
T.Q.D. Pham: Methodology, Software, Validation, Formal analysis, Investigation, Data curation, Writing – original draft. X.V. Tran: Conceptualization, Resources, Writing – review & editing, Supervision, Funding acquisition.
Declaration of conflicting interests
The author(s) declared no potential conflicts of interest with respect to the research, authorship, and/or publication of this article.
Funding
The author(s) received no financial support for the research, authorship, and/or publication of this article.
Author biographies