
Abstract
Keywords
Introduction
Prevention and management of chronic disease is fundamental to improve population-level health outcomes and blunt the upward trend in health care spending in the United States. Close to three-quarters of physician office and hospital outpatient clinic visits involve drug therapy. 1 The cost of drug therapy in the United States has been escalating because of increased utilization and drug prices. 2 However, the cost associated with drug use reaches beyond the purchase of prescribed medications to encompass additional medical costs of morbidity and mortality resulting from medication regimens that are not optimized to effectively treat the indication resulting in a treatment failure (TF), where the resolvable medical problem is not adequately treated, a new medical problem (NMP), where a newly prescribed medication causes or contributes to an incident clinical symptom or syndrome, or both a TF and NMP. This cost has most recently been estimated as $290 billion equating to 13% of total annual US medical costs in 2008. 3 Although widely misdescribed in the published literature and policy documents as the cost associated with “patient nonadherence to medications,” this estimate and the preceding estimates ($76.6 billion in 1995 and $177.4 billion in 2000) actually reflect medical resource utilization caused by TFs and NMPs that arising from nonoptimized medication use. Nonadherence to the indicated medication regimen is just one of multiple potential causal factors leading to a TF, resulting in downstream health services use.4,5
The need for a more current estimate of the cost of nonoptimized medication use is clear given the significant movements in our health care system since the 2008 estimate. 3 Since then, health care reform has expanded medication use in the United States. For example, patients who gained coverage via Medicaid expansion under the Affordable Care Act (ACA) filled 79% more prescriptions. 6
Escalating prices of medications in the United States have garnered public outcry. However, the limited use of systematic and coordinated approaches that reduce costs attributable to nonoptimized medication regimens demands similar attention. A more current estimate of the cost related to nonoptimized medication utilization can serve as a linchpin in policy, payment, and health care delivery system reform. These are important elements as we contend not only with the cost of medications, but also with the impact of prescription drugs on overall medical costs, patient outcomes, and the valuation of interventions to optimize medication use.
The objective of this article is to update the estimated cost of drug-related morbidity and mortality resulting from nonoptimized medication therapy from a third-party payer perspective.
Methods
Data and Sources
This cost-of-illness (COI) analysis used the original decision analytic model and probabilities used by all prior published estimates (Figure 1), cost data sources most closely matching those used in the most recent update, and the same source for estimated number of physician office visits in the United States.3-5,7 All costs were adjusted for medical inflation to 2016. 8 Our total cost estimate reflects the most current monetary value of medical resources and the frequency of use based on the most current US physician office visit estimates. Costs captured in this analysis were for resource use spending on treatment of a medical problem (ie, direct medical costs). For this COI study, we followed the Consolidated Health Economic Evaluation Reporting Standards (CHEERS) guidelines for reporting health economic evaluations in construction of this manuscript. CHEERS recommends description of the incremental cost per outcome benefit. A priori, our objective was completion of a COI study that quantified the cost of the medical problem. Hence, incremental cost per benefit was not evalulated. 9
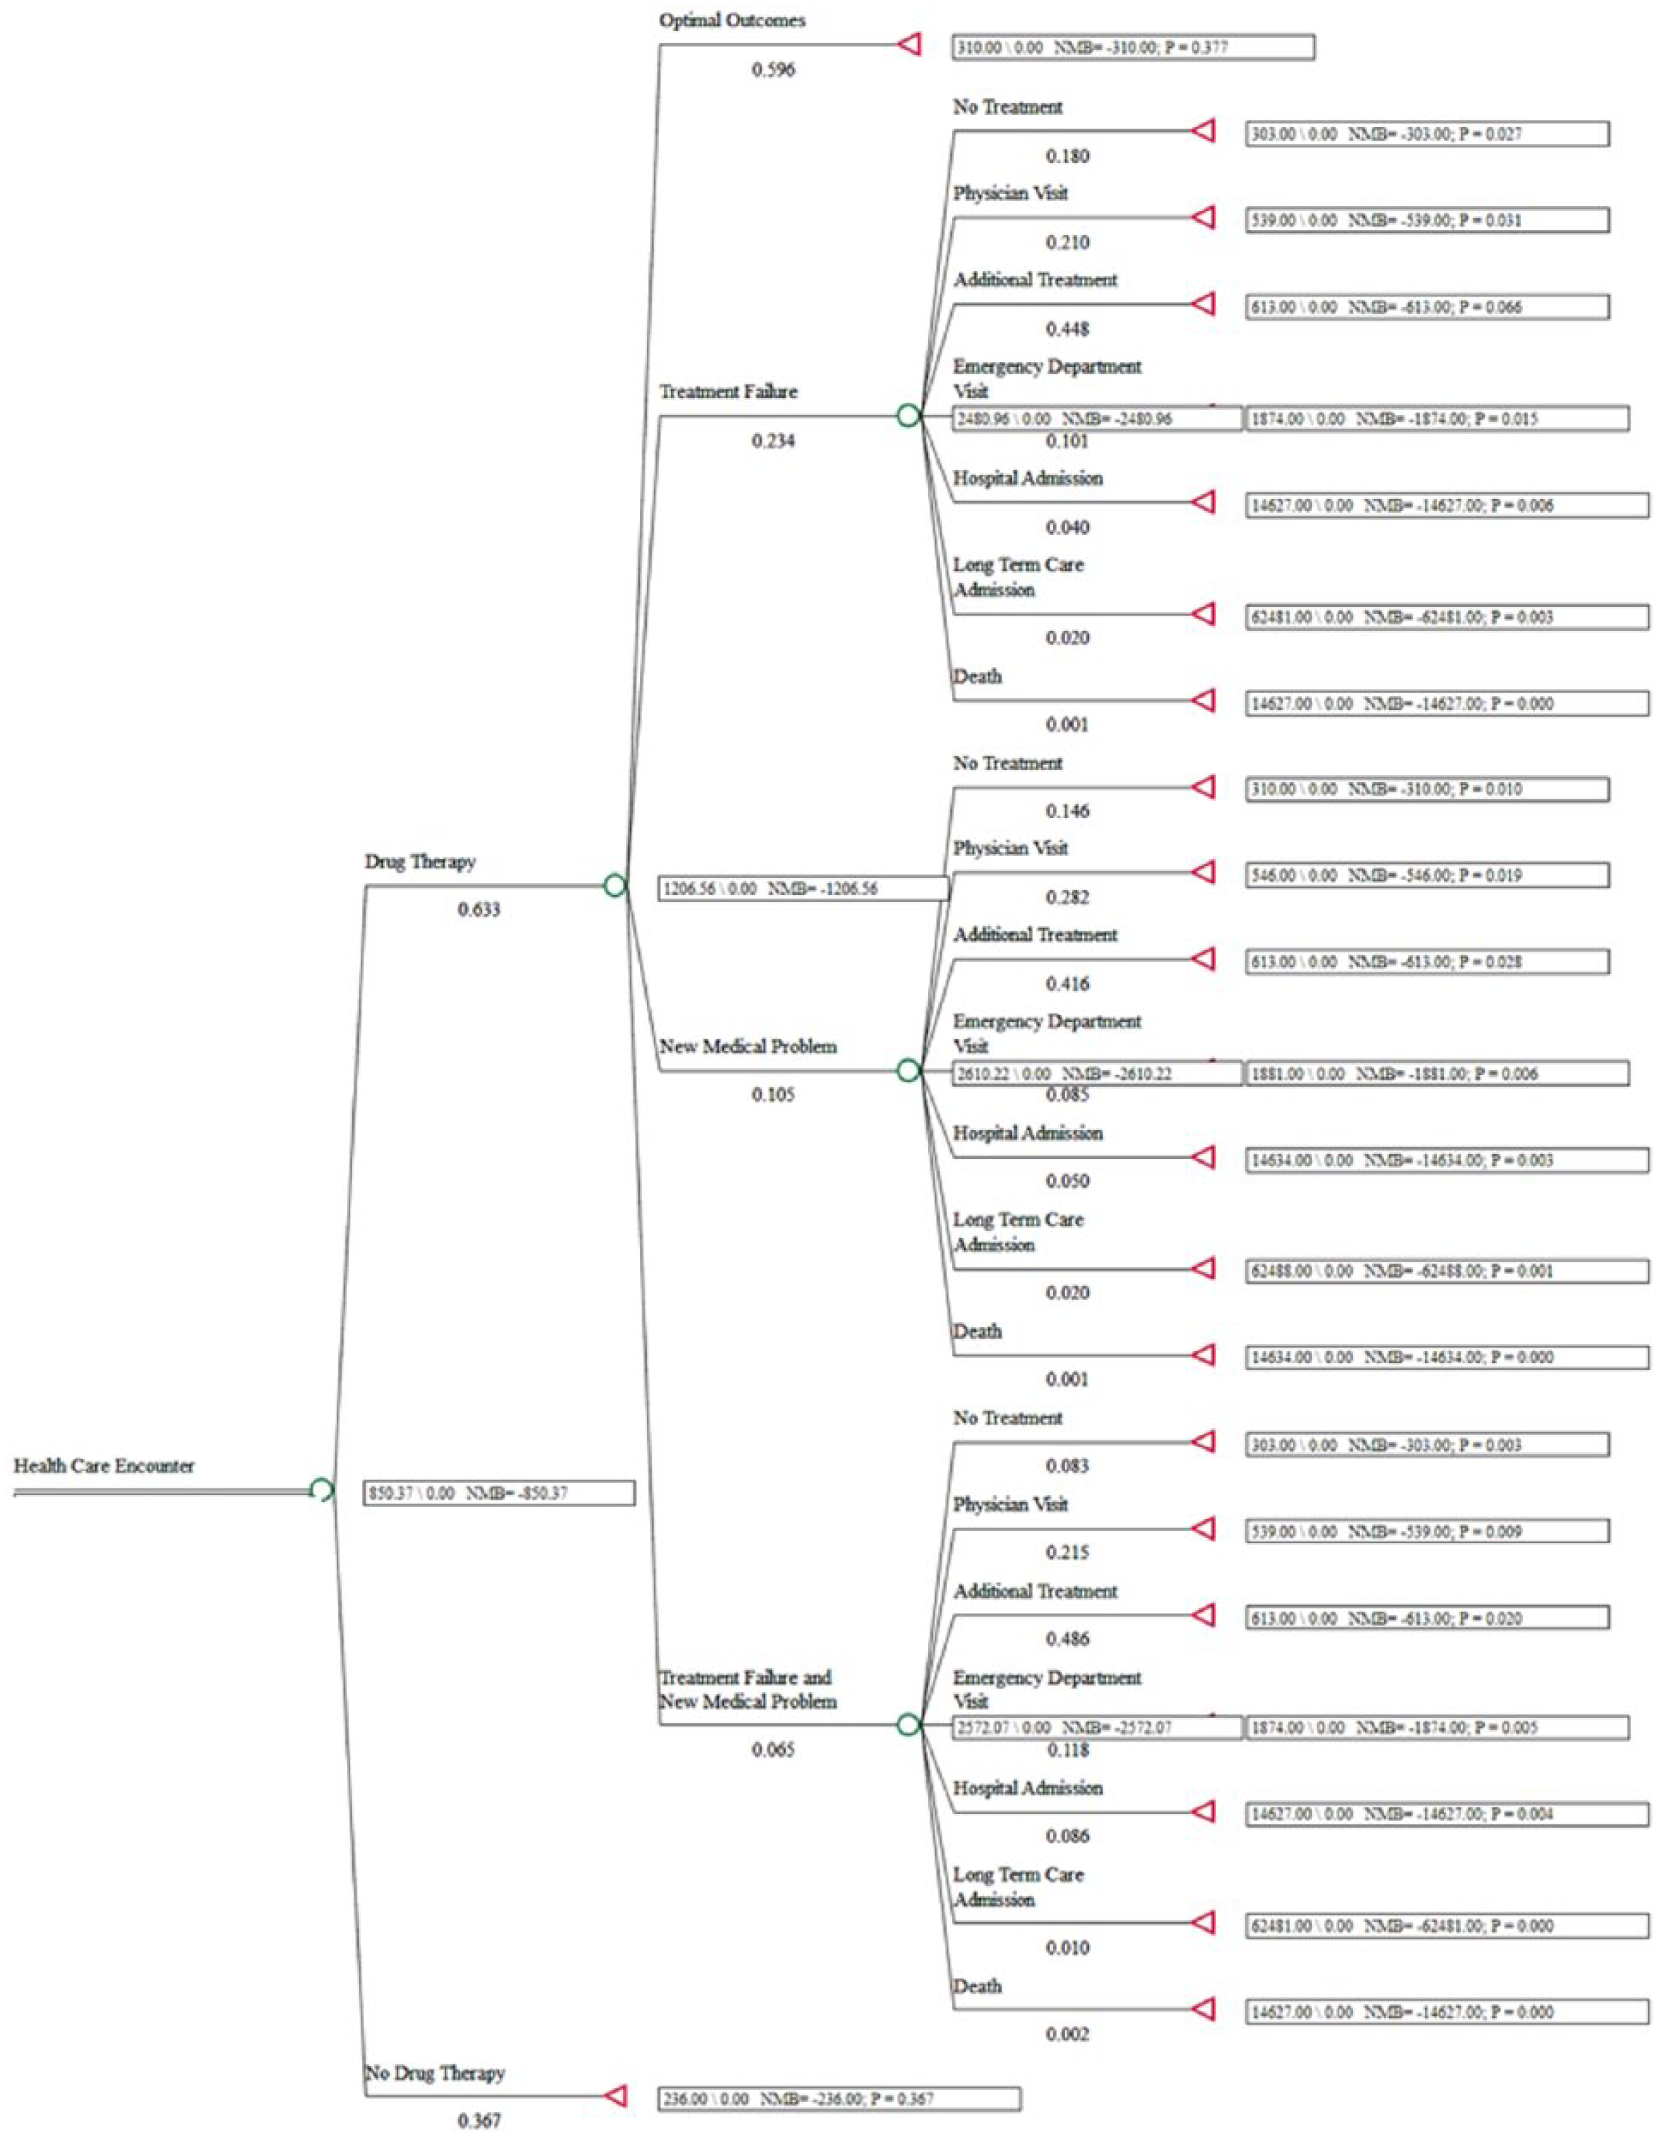
Drug-related morbidity and mortality decision analytic model.
The original modeling included path probabilities based on expert opinion. 4 The two published updates of the cost analysis retained these probabilities, although Ernst and Grizzle 5 did search the literature for evidence to revise the original proportions and found none.3,5 Similarly, our literature search did not uncover published data to support modifying the original probabilities in the prior models. Applying PubMed database search terms drug therapy problem, medication related problem, drug-related problem, new medical problem, and treatment failure with date range January 1, 2000, to November 17, 2017, produced 90 articles which, on review, did not contain updated probabilities for progression to NMPs and TFs or downstream probabilities for health services utilization on review by one of the study authors (JDH). Removing date range criteria yielded the prior published study by Ernst and Grizzle.
Costs
Base case analyses used the weighted average of the mean physician fees for new and established patients of $222 per visit (2014; $236, 2016 value). 10 Average prescription cost of $71 ($74, 2016 value), calculated as total prescription sales divided by total number of prescriptions sold in 2015 ($286 797 651 607/4 065 175 064).11,12 Average cost of an ED visit was $1233 ($1571, 2016 value) based on the 10 most common types of ED visits. 13 Average cost of a hospital admission was $13 450 ($14 324, 2016 value). 14 The average cost of a long-term care (LTC) admission—$62 178 in 2016—was calculated using data from the 1999 and 2004 National Nursing Home Survey (NNHS) from the Centers for Disease Control and Prevention (CDC) and longtermcare.gov.15-17 The NNHS is a validated, nationally representative survey that provides estimates of nursing homes, current residents, and discharges in the United States that include explicit capture of duration of stay. Using the NNHS from the CDC resulted in a larger length of stay (LOS) than the reference used in prior estimates.4,5 The most recent 2004 NNHS included the average time since admission (ATSA) not average LOS (ALOS) as in previous versions. 16 Therefore, 2004 ALOS was estimated to be 254 days via multiplication of the 2004 ATSA (835 days) by the ratio of ALOS (271.5 days) to ATSA in the 1999 NNHS data (892.4, 271.5/892.4 = 30.4%). Multiplying the ALOS by the 2010 average semiprivate daily cost ($205/day) resulted in a value of $52 078 ($62 178 in 2016 dollars). 17 Consistent with prior published estimates, death attributable to a TF or NMP was assumed to be preceded by a hospitalization. Hence, although base case cost of a death event was zero dollars, the pathway cost resulting in death resulting from TF or NMP included the cost of a hospitalization, and death events contributed to the total hospitalization count.4,5 The number of physician office visits used as the basis for the population scale-up was 928 630 000. 18
Data Analyses
Consistent with prior published studies, total costs of nonoptimized prescription drug use incorporating resource costs and probabilities were modeled in Microsoft Excel (Microsoft Corporation, Redmond, WA).4,5 The average pathway costs from initial provider visit for a patient who experienced a TF, NMP, and TF and NMP were calculated within a decision analytic model (Figure 1) using TreeAge Pro Healthcare, v2014 (TreeAge Software, Inc, Williamstown, MA). Probabilistic sensitivity analyses using Monte Carlo simulation were completed to generate a plausible range around the mean estimates. If available, published standard errors were used in the sensitivity analyses. Otherwise, an error margin of 10% of the mean input estimate was applied for these analyses consistent with the 10% range used in the Ernst and Grizzle analysis. 5
Population Scale-up to Estimated Cost of Nonoptimized Drug Utilization
The total cost of morbidity and mortality resulting from nonoptimized drug utilization was calculated by multiplying the number of health service events (estimated via proportions in the decision analytic model) by estimated event costs. Sensitivity analyses were completed to investigate the impact of using other nationally representative sources of data for the resource costs. Specifically, cost of ED visits, hospitalizations, LTC, and the number of physician office visits were modified in these analyses. ED visit cost was decreased to the reported average cost across all types of ED visits of $1116 in 2016 dollars. 19 Hospitalization cost was increased to $24 600 (net patient revenue [$813 437 515 663] divided by total number of admissions [33 066 720]) adjusted to $26 199 in 2016 dollars and decreased to $10 889 adjusted to $11 597 in 2016 dollars.20,21 The average cost of a LTC admission was decreased to $57 158 using average daily cost of $225. 22 The number of physician office visits was increased to 1.067 billion to reflect a recent estimate, which may better reflect ACA impact. 23 Total pathway costs beginning with initial visit for each of the specific scenarios delineated in the decision analytic model were tabulated (Table 1).
Drug-Related Morbidity and Mortality Decision Analytic Model Pathway Costs in 2016 US Dollars. a
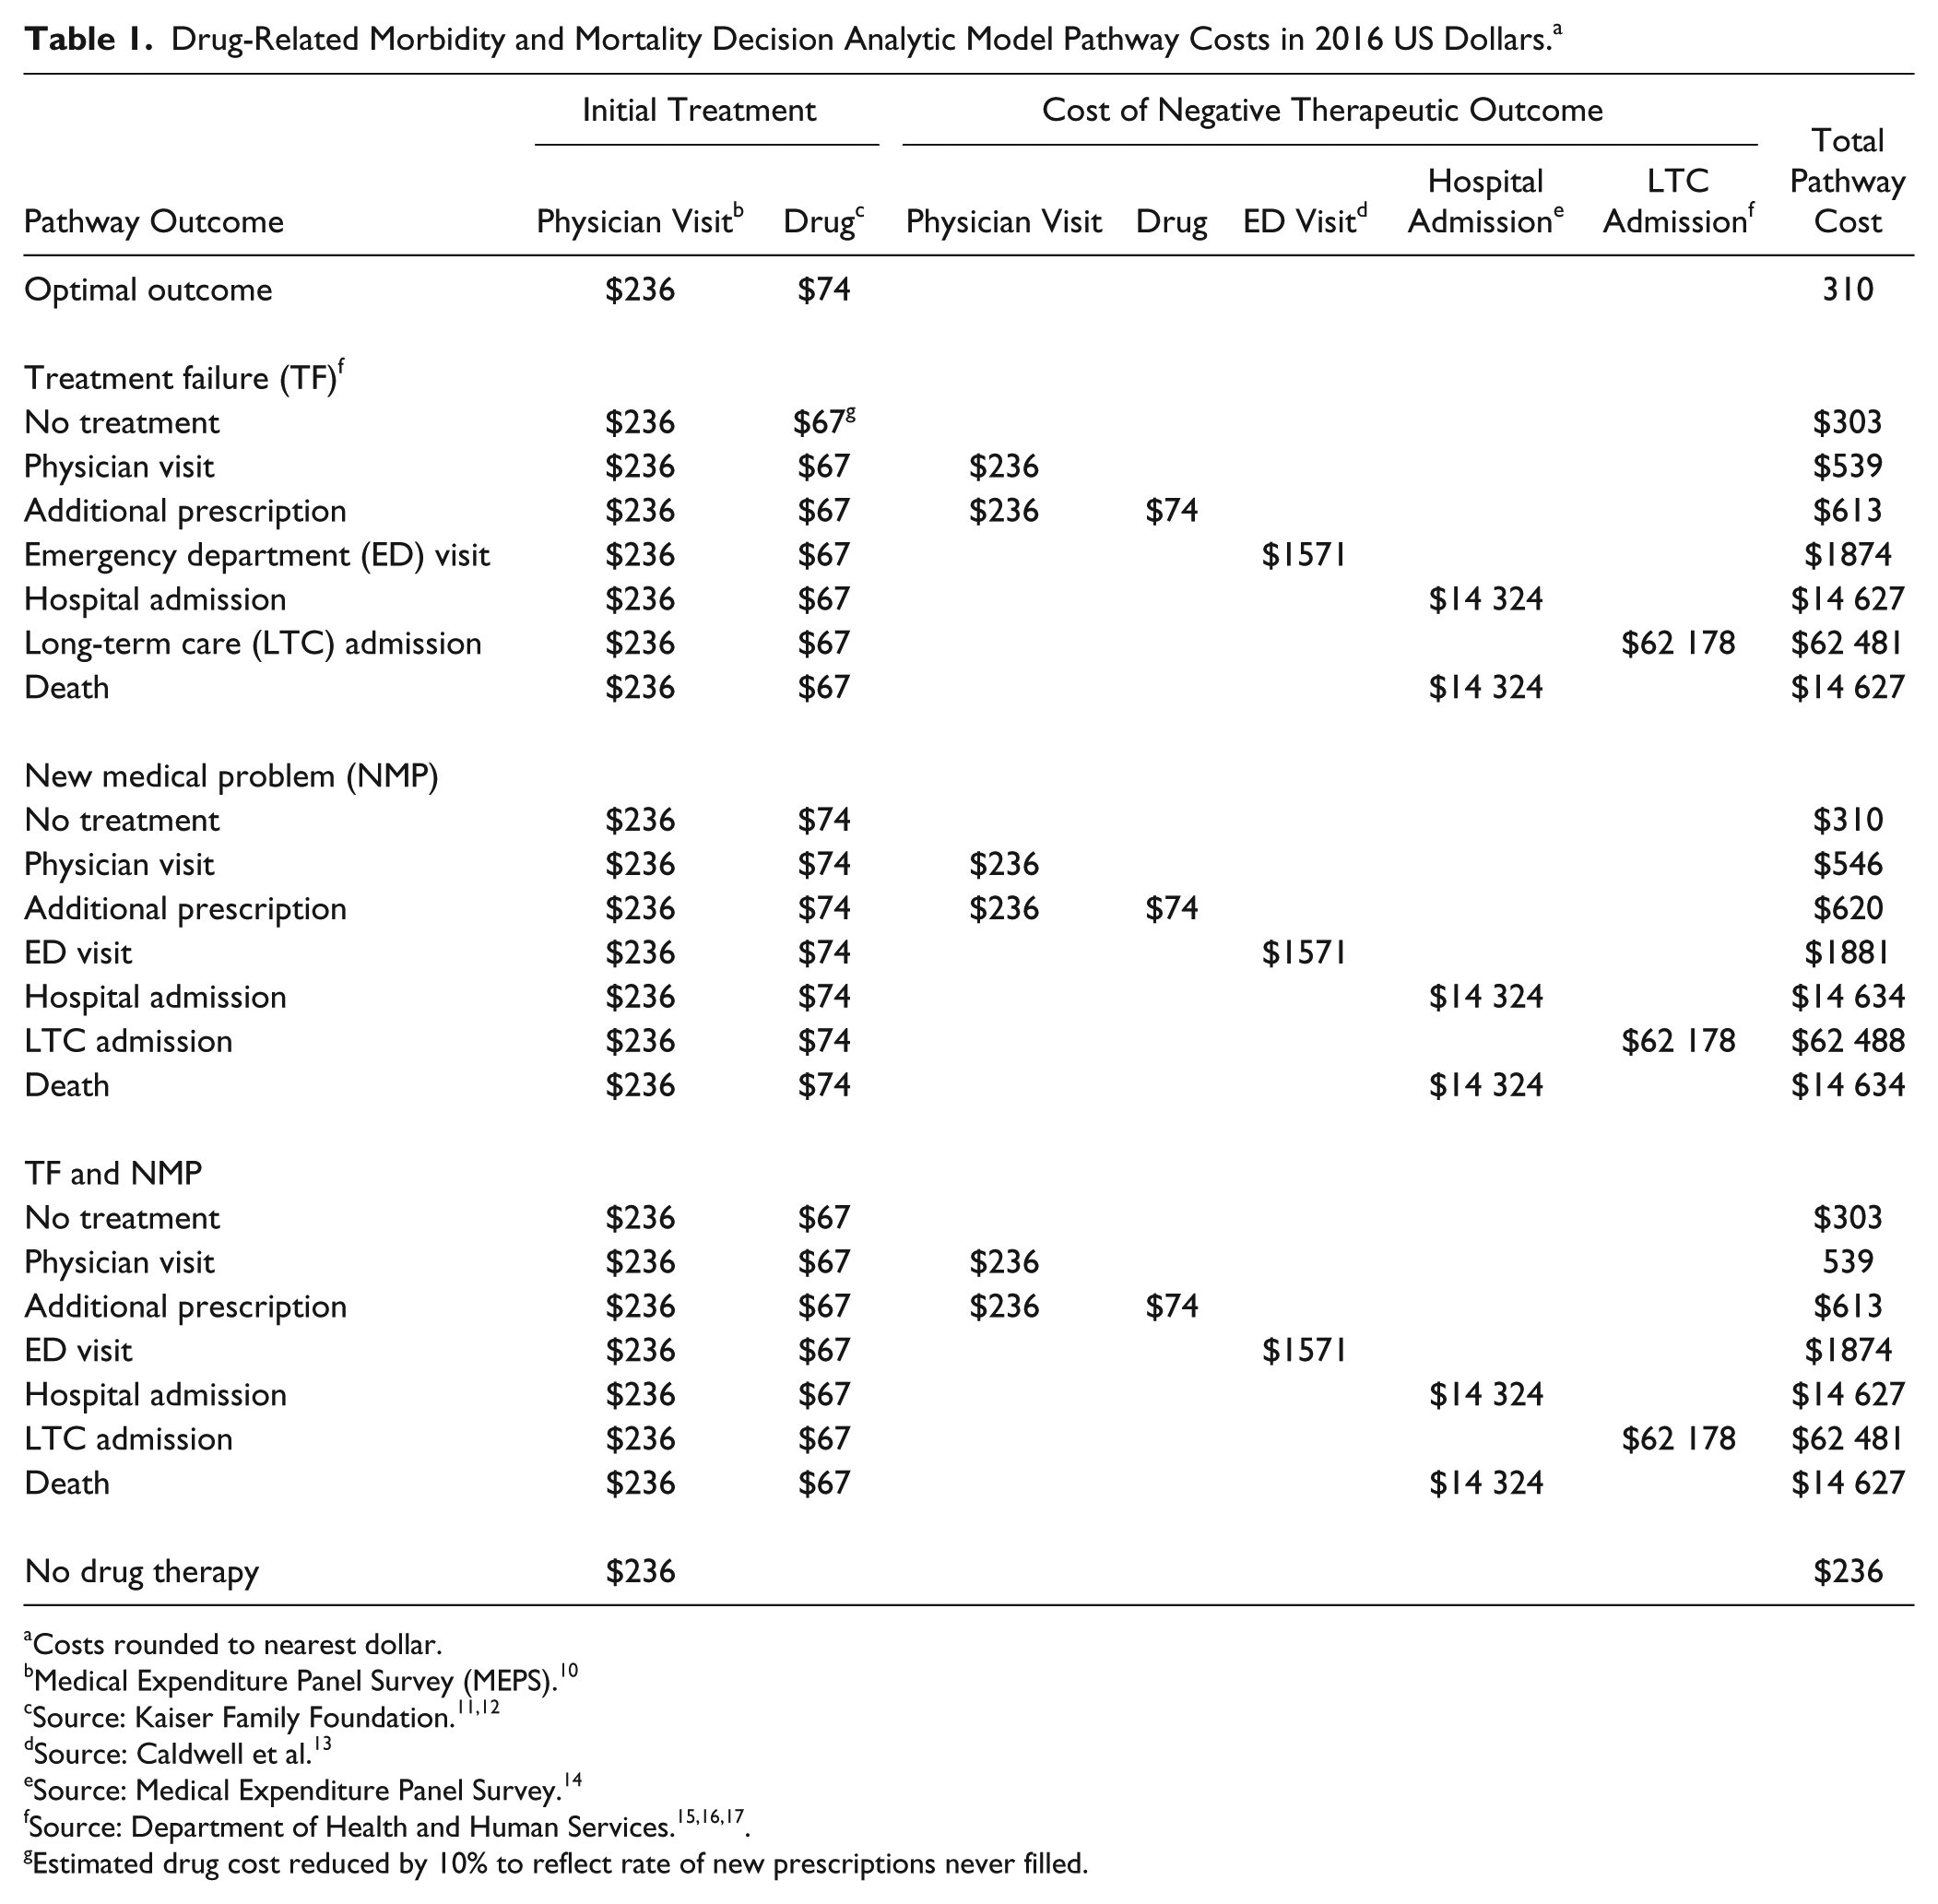
Costs rounded to nearest dollar.
Medical Expenditure Panel Survey (MEPS). 10
Source: Caldwell et al. 13
Source: Medical Expenditure Panel Survey. 14
Estimated drug cost reduced by 10% to reflect rate of new prescriptions never filled.
Results
The estimated annual cost of prescription drug–related morbidity and mortality resulting from nonoptimized medication therapy was $528.4 billion in 2016 US dollars (Table 2). Sensitivity analyses using alternate cost inputs revealed total costs ranging from a minimum of $495.3 billion in the scenario that used a lower estimate of hospitalization cost (CDC Healthcare Cost and Utilization Project cost data) to a maximum of $672.7 billion using the highest estimate of hospitalization cost (American Hospital Association cost data).20,21 Using the Department of Health and Human Services Agency for Healthcare Research and Quality estimate for ED visit cost produced a total cost estimate of $517.7 billion. 19 Applying a larger estimate of physician office visits produced a total cost of $607.2 billion. 23 Using a lower LTC cost estimate derived from the Genworth Cost of Care Survey, the total cost estimate was $505.5 billion. 22 Hence, the estimated annual cost of prescription drug–related morbidity and mortality yielded a plausible range of $495.3 to $672.7 billion.
Summary Cost of Drug-Related Morbidity and Mortality in 2016 Dollars.
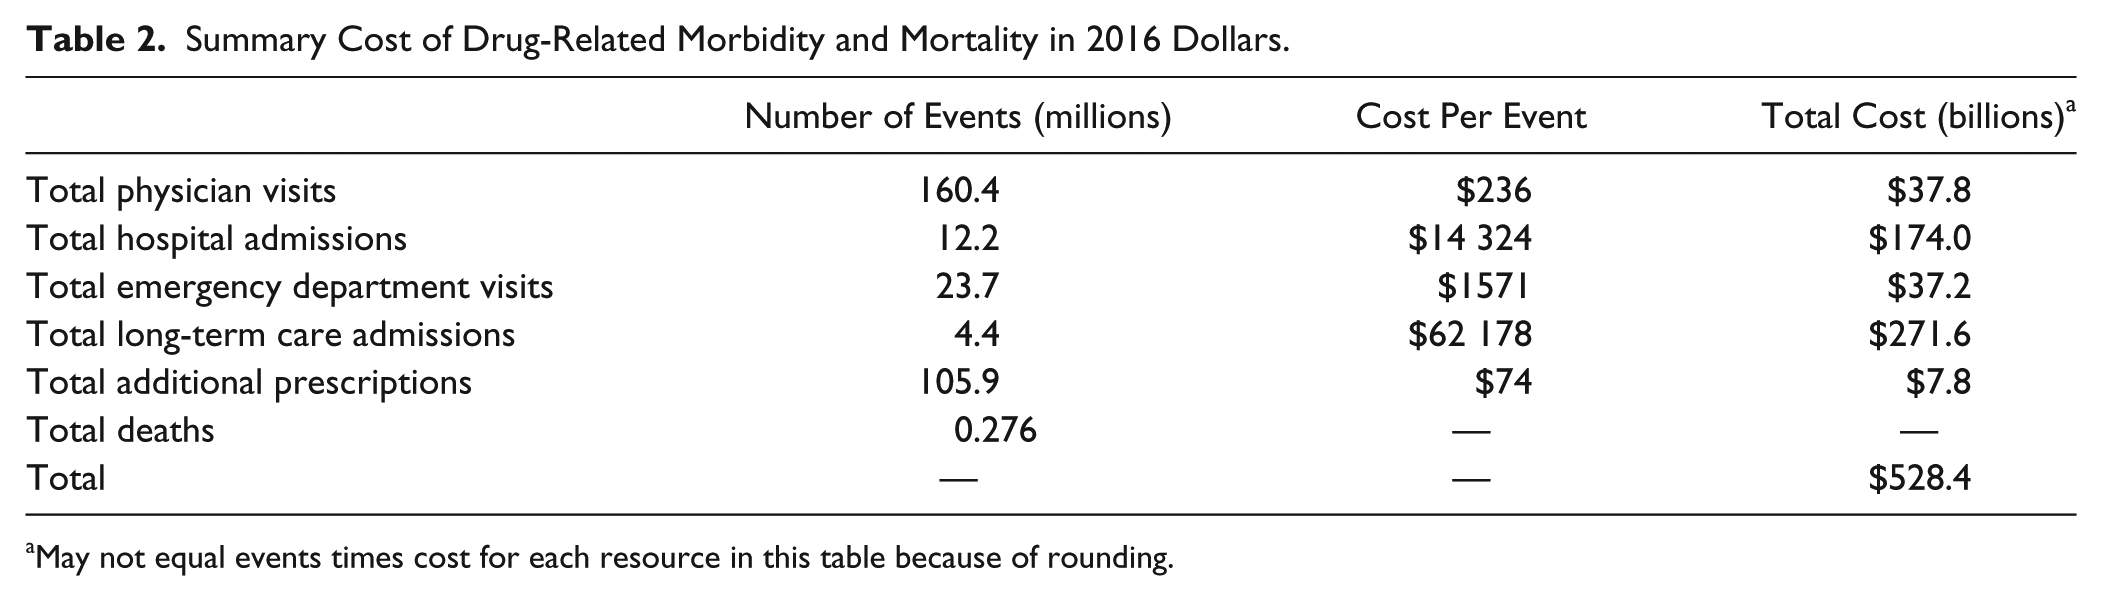
May not equal events times cost for each resource in this table because of rounding.
Based on the output from the decision-analytic model (Figure 1), the average cost of a physician encounter that incorporates costs of patients receiving no drug therapy, those receiving successful drug therapy, and downstream medical costs of nonoptimized drug utilization was estimated to be $850 per encounter (plausible range based on sensitivity analyses: $792, $908). The average cost of an individual experiencing TF, NMP, or TF and NMP after initial prescription use were $2481 (plausible range: $2233, $2742), $2610 (plausible range: $2374, $2848), and $2572 (plausible range: $2408, $2751).
Discussion
This analysis has updated the annual cost of drug-related morbidity and mortality resulting from nonoptimized medication therapy from a third-party payer perspective and estimated it to be $528.4 billion. Nonoptimized medication therapy was also estimated to result in 275 689 deaths per year. The cost estimate represents the additional medical resources utilized (eg, additional medications, ED visits, hospitalizations, LTC stays, provider visits) to resolve problems attributable to initial indication and utilization of prescription drugs, including nonadherence to indicated therapy. The potentially avoidable $528.4 billion estimate is roughly 16% of the total US health care expenditure ($3.2 trillion in 2015). 24 This proportion has doubled over the past 20 years since the original 1995 estimate that represented 8% of total US health care expenditures (2000 and 2008 estimates represented 13% of total health care spending).3-5
Medical price inflation alone would account for an increase from the 2008 estimate of $290 billion to $370 billion in 2016, leaving an excess of $158 billion attributable to increased numbers of patients with TF, NMP, or a combination of TF and NMP caused by nonoptimized prescription drug utilization. We estimated that a patient experiencing TF, a NMP caused by drug therapy, or a combination of both costs approximately $2500 considering additional drug therapy and other medical costs needed for resolution.
Our estimate of $528 billion represents only direct medical costs, which are relevant for a third-party payer perspective. The estimate does not include direct nonmedical costs (eg, transportation or caregiving costs) nor indirect costs related to lost productivity or disability. The estimate is greater than the direct medical costs reported for many prevalent chronic diseases such as heart disease and stroke ($230 billion), diagnosed diabetes ($197 billion), cancer ($187 billion), obesity ($147 billion), and arthritis and related conditions ($126 billion)—all reported here in 2016 dollars.25-29
Many factors will continue to drive costs associated with nonoptimized medication therapy, not least of which is the aging US population and the concurrent surge in the number of Medicare enrollees to 81.8 million by 2030. 30 In addition, the pipeline of new medications has been skewed to expensive specialty medications with more than 700 in development. 31 In 2016, specialty drugs accounted for more than one-third of total drug expenditures. 2 The United States will also be challenged by increases in drug utilization rates and drug prices for most major disease categories (eg, inflammatory conditions, diabetes, oncology). 2 Retail prescription drugs along with home health are the 2 sectors of personal health care spending with the highest projected average spending growth through 2025. 32 Payers will also likely grapple with increasing prices of medical resources (eg, ED visits, hospitalizations) because the rate of medical price growth is expected to accelerate in the 2018 to 2025 period. 33 Considering the projected increase in up-front costs resulting from additional medications needed for a graying US population and escalation in prescription costs, optimizing medication use is unquestionable.
Comprehensive Medication Management
Reducing these utilization and cost trends will require a systematic approach to medication management to mitigate the proportion of patients experiencing TF, NMP, or TF and NMP resulting from nonoptimized medication therapy. Clinical pharmacists, in collaborative practice with physicians and other prescribers such as nurse practitioners and physician assistants, will increasingly be relied on to assume responsibility for real-time drug therapy decisions in an expanding diversity of care settings by delivering comprehensive medication management (CMM) services. This transition has already begun in health systems such as Kaiser-Permanente and the Veterans Health Administration where pharmacists provide face-to-face patient care in collaborative-practice clinics.33-35 The approach will directly resolve costly drug therapy problems while addressing a shortage of primary care physicians. 36 The importance of reducing NMPs has been illuminated by clinician investigators who have focused on the clinical phenomenon referred to as the “prescribing cascade,” in which an adverse drug reaction (ADR) is misconstrued as a new syndrome, resulting in prescribing of a new medication. The proposed approach to arresting the prescribed cascade is a critical evaluation of the need for the new potential pharmacological agent in context of a comprehensive review of the complete medication profile. This evaluation should include explicit consideration of the current medication regimen as possibly causal on the symptom being addressed. Nonmedication treatment should be considered as well as alternative agents with lower risk of ADRs. If medication treatment is merited, the lowest effective medication dose should be prescribed. 37 CMM incorporates consideration of the prescribing cascade as well as the principles to prevent it from occurring.
CMM would also enrich other specialty areas such as behavioral health where medication management is playing a growing role. 38 Seminal work published in 2003 from the Asheville Project demonstrated a reduction in days lost to sick time, decreased medical costs, and improved achievement of treatment goals for patients with chronic disease receiving CMM. 39 Published evidence of the effectiveness of CMM has continued to build along with increasing calls for pharmacists in the health care team.40,41 A 2011 report to the US Surgeon General summarized evidence available for return on investment of medication management programs, reaching a maximum of 12:1 and averaging between 3:1 to 5:1. 42 One example of a specific CMM program is the team-based medication use system in Minnesota that has lowered per member per month health care costs and increased the percentage of patients achieving treatment goals. 43 The benefits of CMM extend to improvements in quality of life, access to other health care providers, and continuity of care as reported in a recent review of CMM in California. 44
CMM focused on achieving optimal clinical and patient-centered goals of therapy is becoming recognized as a cornerstone of delivery and payment reform efforts. 45 Hepler and Strand 46 proposed eight categories of drug therapy problems (untreated indication, improper drug selection, subtherapeutic dosage, failure to receive drugs, overdosage, ADRs, drug interactions, and drug use without indication). The CMM process is directly related to recognition and resolution of these drug therapy problems (DTPs) that can prevent use of unnecessary medical services (Figure 2). A general framework has been developed in prior studies in which DTPs give rise to TF and NMPs. Johnson and Bootman, 4 building from the Hepler and Strand work, proposed a causal path where DTPs give rise to TF and NMPs, but did not specify the pathway or the probabilities in this process. Rather, the prior published COI estimates for nonoptimized medication use focused on the downstream probability of TFs and NMPs when medication use was indicated. 4
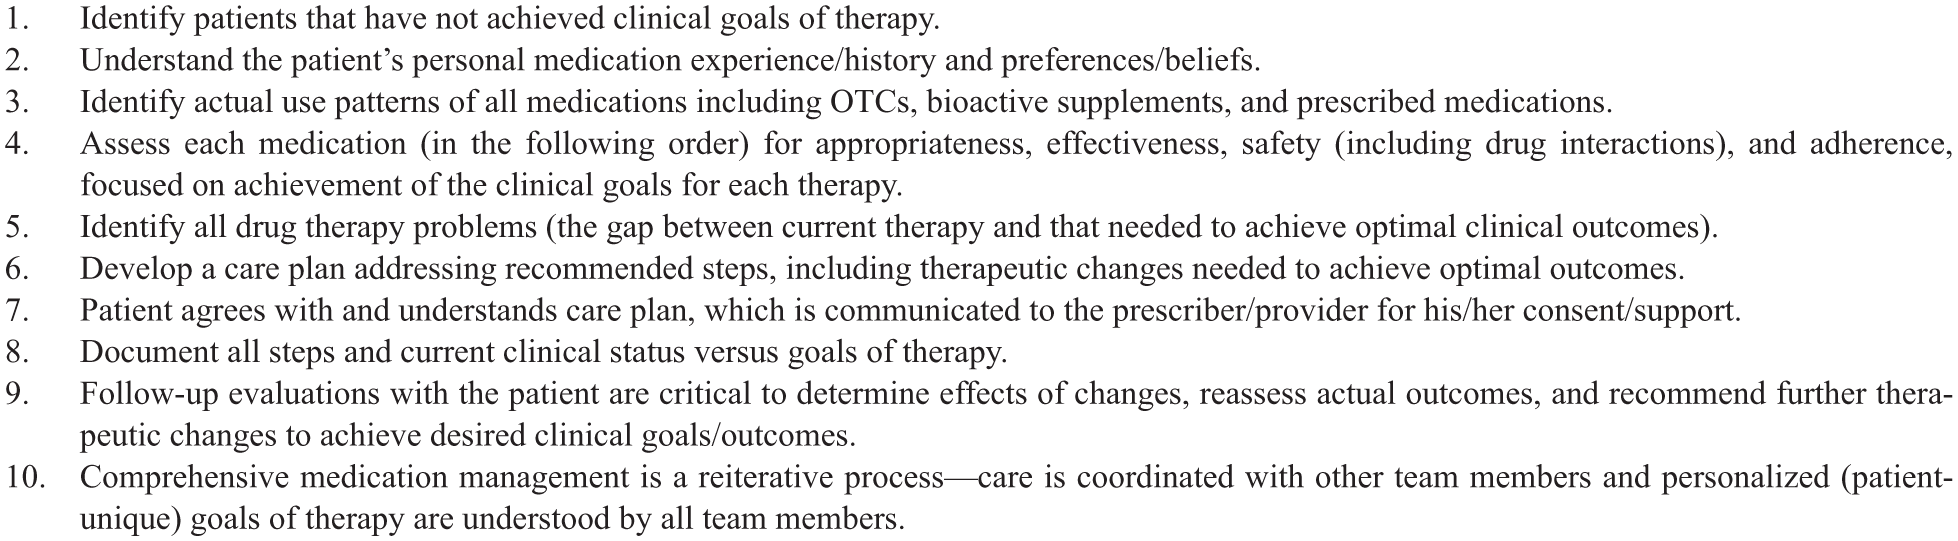
Comprehensive medication management clinical approach.a
Drug therapy problems are drivers of medical resource use and are frequently cited as the largest cause of adverse events post–hospital discharge, and it has been estimated that 13% of adverse drug events after discharge from the hospital result in an ED visit or rehospitalization.47,48 Johnson and Bootman 4 categorized this specific scenario as the ADR DTP producing an NMP.
Whereas inappropriate consumption of medications is one important element of DTPs, the existence of untreated indications, subtherapeutic dosing, or drug interactions of medications are common scenarios leading to NMPs and TFs. A large study of commercial insurance patients revealed that the most common issues were related to the need for additional medications (34%) and doses that were too low (20%). 49 Considering underuse of appropriate, effective, and safe medications as the omission side of DTPs in ambulatory care represents a large opportunity to improve outcomes and reduce the COI. 50 The majority of accountable care organization and value-based quality metrics hinge on optimized medication use to achieve population level goals of therapy. 51
Although CMM represents the most rigorous and structured clinical process to optimize medication therapy, the clinical service referred to as medication therapeutic management (MTM) also entails review of the medication regimen with the goal of optimizing medication regimens. However, MTM can be conducted in the absence of the physical patient and the patient’s complete medical record by simple review of the medication list. Whereas in-person, real-time MTM can be pursued, in general, MTM differs from CMM based on the absence of a few general features: CMM requires an evaluation of the patient’s clinical status to ensure evidence-based concordance between the patient’s syndromes and medication therapy. CMM involves specification of a treatment plan that incorporates follow-up evaluation to assess timely progression to prespecified treatment goals. CMM is designed to operate under a collaborative practice agreement with a physician. 52
As described, a systematic categorization scheme for the major types of DTPs related to indication, effectiveness, safety, and adherence is available and accepted. 53 Enhanced medication therapy management models are now being tested by the Centers for Medicare and Medicaid Services that utilize new Systematized Nomenclature of Medicine–Clinical Terms (SNOMED CT) codes to report on medication management activities and outcomes. 54 Lessons learned from these pilot programs will expand documentation efforts across the range of CMM models to facilitate outcomes tracking of pharmacist interventions. The coding system will also supply policy makers with objective data to supplant the current expert opinion–based estimates of TF, NMP, or TF and NMP occurrence. Code use will also furnish valuable data to determine resource utilization estimates after clinical interventions. These measurable outcomes will support production of real-world data models for future estimates of the cost of nonoptimized drug therapy and provide pathway probabilities to model the chain from DTPs to TFs and NMPs.
There were limitations to this analysis. Medical resource costs used in the models were the most current available. However, not all were from the same year because of varying report dates. All were adjusted to 2016 US dollars. Because the most recent available data for number of physician office visits was from 2014, changes in visit volume caused by ACA deployment after 2014 were not fully accounted for in the base case model. Hence, this estimate is likely conservative. However, our sensitivity analysis did include an estimation that factored in an increase in visits. Model probabilities were based on expert opinion. These were maintained for consistency with prior published methods and the absence of replacement probability values in the published literature. Because of variations in available resource cost estimates, we performed sensitivity analyses that varied these inputs and reported total costs from each of these scenarios providing a range around the base case estimate.
Conclusions
The estimated annual cost of drug-related morbidity and mortality resulting from nonoptimized medication therapy from a third-party payer perspective was $528.4 billion, equivalent to 16% of total US health care expenditures in 2016. This estimate includes neither direct nonmedical costs (eg, transportation or caregiving costs) nor indirect costs related to lost productivity. On average, a patient experiencing TF, a NMP resulting from nonoptimized drug therapy, or a combination of both costs roughly $2500 considering additional drug therapy and other medical costs needed for resolution. To reduce these avoidable medical costs, improve patient care, and address the primary care provider shortage, we propose expansion of CMM programs as a cost-effective, scalable policy.
Footnotes
Declaration of Conflicting Interests
The authors declared no potential conflicts of interest with respect to the research, authorship, and/or publication of this article.
Funding
The authors disclosed receipt of the following financial support for the research, authorship, and/or publication of this article: Dr. Watanabe is supported by the National Institutes of Health Loan Repayment Program through the National Institute on Aging. Study author employers and Supporting organizations did not have any role in the design, methods, analysis, or preparation of this manuscript.