
Abstract
Keywords
Management scholars acknowledge the existence of an “access” problem with regards to partnering and working with organizations. Why are organizations hesitant to work with management scholars? One major reason is that management research methods and scientific findings are not always of interest (Kelemen & Bansal, 2002; Kieser et al., 2015). To assert their relevance to organizations, applied researchers must not only clearly explain analyses and results but must also do so in a way that convinces organizational partners of the value to be gained from spending time and resources conducting said analyses. Analytic methods that can be easily explained, allow for clear and coherent data narratives, and provide insights that cannot be achieved with less complex methods are particularly helpful for conveying the value of management research to organizations.
One such method is latent profile analysis (LPA). LPA categorizes individuals based on patterns of their responses, providing insights beyond what can be achieved by categorizing individual responses across commonly collected demographics (e.g., men <40 years old have an average job satisfaction score of 3.70 whereas women >40 years old have an average job satisfaction score of 4.20). The organizational commitment literature offers a great example of the insights gained by applying LPA. The commonly used three-component model of organizational commitment consists of affective, continuance, and normative commitment (Meyer & Morin, 2016). Traditionally, researchers might calculate the mean of each commitment type for their full sample of respondents.
What if, however, there were smaller groups of individuals within the sample whose responses fit similar patterns in terms of the amount of affective, continuance, and normative commitment they felt toward their organization? In a sample of employees, perhaps 30% score above average on affective and normative commitment, but below average on continuance commitment. Maybe another 20% score below average on affective and normative commitment but quite high on continuance commitment. This first group might be described as those who are “morally committed” whereas the latter group would be those feeling “trapped” in their current organization (Meyer & Morin, 2016, p. 587). Using the traditional approach described above, a single statistic (i.e., mean score) would be used to represent the full sample; the nuances distinguishing employees feeling morally committed from those feeling trapped would be lost. Organizational stakeholders would have no way of knowing about these qualitatively distinct groups and their unique experiences of organizational commitment.
Alternatively, LPA identifies and accounts for the existence of these unseen groups or latent profiles based on patterns in how individuals respond (e.g., the pattern of 30% of respondents scoring above average on affective and normative commitment but below average on continuance commitment). You could then calculate the mean of each pattern of affective, normative, and continuance commitment for each latent group. Rather than presenting only the sample mean of each commitment type, you could present means of affective, normative, and continuance commitment within each of these latent subgroups. As a result, LPA allows for a closer approximation of individual experiences by allowing for multiple means to coexist in a given sample. For a graphic representation, see Figure 1. The use of LPA helped advance the organizational commitment literature through the exploration of commitment mindsets (profiles) showing differences in not only their makeup but also their relationships with antecedents and outcomes (Meyer & Morin, 2016). In other words, it was important to identify these profiles of commitment because people whose experience is best captured by one type of commitment profile tend to behave differently than those in other profiles. Example Survey Results Depicting the Difference Between Variable-Centered and Person-Centered Approaches. Note: The Same Sample is Depicted in A and B; What Differs is the Analytic Approach, the Interpretation of Results, and the Implications for Practice. The Variable-Centered Approach May Lead an Organization to Implement a One-Size-Fits-All Intervention that is Not Effective for all Organizational Members and May Even Produce Negative, Unintended Consequences for Some. The Person-Centered Approach Reveals Subgroups in the Sample that are Characterized by Unique Response Patterns. This Approach Can Help Organizations Better Allocate Resources and Deploy Intervention Strategies Best Suited to Support Each Subgroup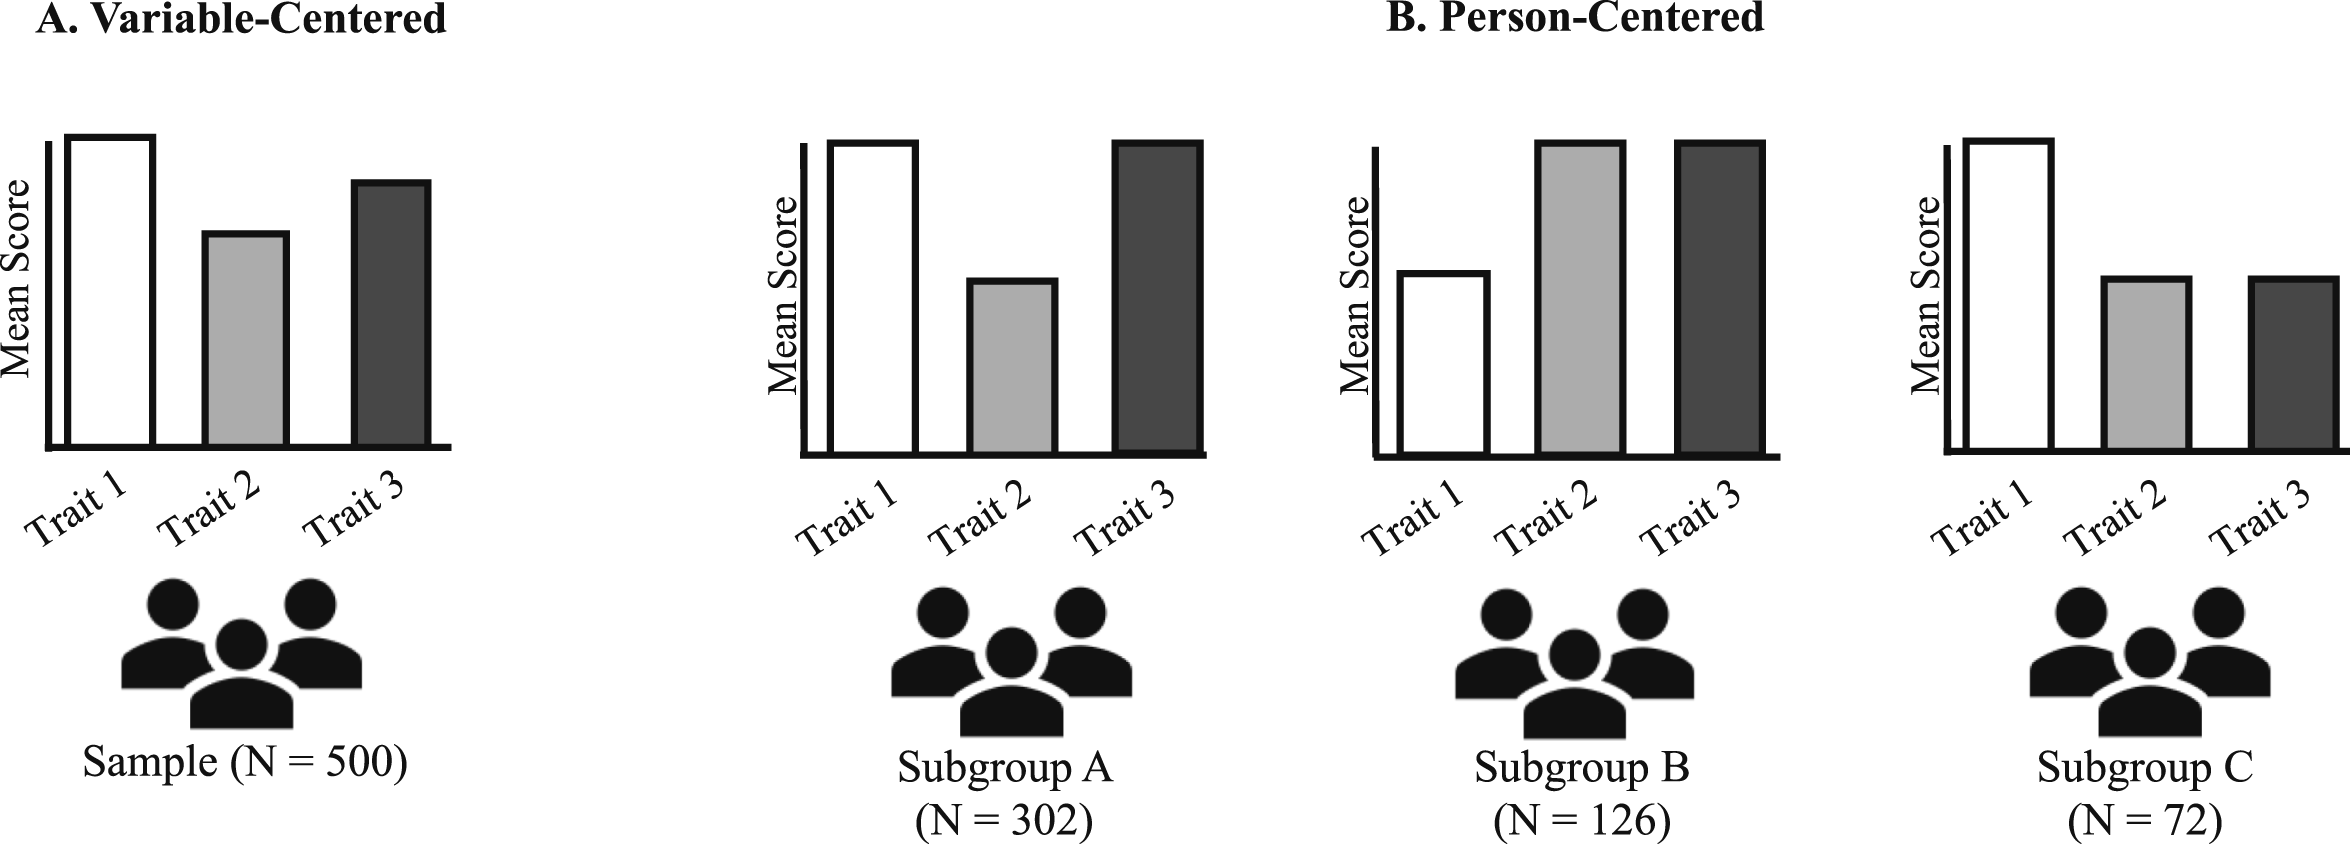
Applied researchers wanting to fill their toolbox with analytic techniques that offer clear, practical value to organizational partners should consider LPA. The practical value of LPA has often been heralded for its actionable insights. In the case of organizational commitment profiles, Meyer and Morin (2016) observed that: …rather than focusing on individual differences on specific variables and/or the relations among variables at a sample level, the person-centered approach focuses on the persons and on how they can be characterized on a system of variables (e.g., commitment mindsets or targets and bond types). It is perhaps this more holistic focus that makes the findings of person-centered research particularly appealing to managers. (p. 606)
LPA helps applied researchers communicate value to managers by demonstrating where different strategies can be deployed to customize interventions or initiatives based on the characteristics of different profiles. For example, Gabriel et al. (2015) conducted a latent profile analysis on employee well-being, noting: In general, it may be useful for managers to think about which emotional labor combinations are beneficial for employee well-being and create conditions that foster those specific constellations…if employees are in a class that exhibits low well-being (i.e., surface actors or regulators), managers may consider whether conditions can be introduced that can buffer the effects of profile membership on well-being. (p. 876)
Such organizationally relevant findings that can be easily explained to managers and stakeholders make LPA one of the best tools for strengthening research partnerships.
Despite consensus in the academic literature that LPA has practical value, guidance (i.e. accessible and non-technical) for LPA use in applied research with organizational partners is lacking. While the LPA methods literature has provided guidance on conducting LPA for an academic audience, the emphasis on academic research goals (e.g., Spurk et al., 2020) and requirement of expensive academic analysis software (e.g., Ferguson et al., 2020) in the literature poses a barrier for applied researchers. Few graduate programs offer dedicated LPA instruction. Even if applied researchers had some academic training on LPA, complex organizational contexts often pull methods choices away from a firm anchoring in theory and research questions (Buchanan & Bryman, 2007). All in all, existing LPA guidance may not meet the needs of applied researchers, making LPA feel out of reach. This poses a problem: a tool for impactful applied research exists, but few may ever use it.
The purpose of this paper is to provide a solution to this problem and increase the accessibility of LPA for applied researchers. We want applied researchers to know LPA really is a tool that they can use to communicate the value of management research methods to organizational partners. To achieve this aim, we present an LPA tutorial in jamovi. Using the freely available and user-friendly statistical software, jamovi, we describe our experience analyzing real-world membership data from a state-wide non-profit organization (NPO) and provide a practice-oriented LPA walkthrough in our Online Supplemental Materials. Our hope is that management scholars who read this paper will feel more comfortable using the LPA technique, thereby expanding the implementation of rigorous, value-add management research methods in organizational settings.
Partner Organization Context
Our organizational partner is a statewide environmental NPO with over 6,000 members in 33 local chapters. For context, conservation efforts critically depend on volunteerism (Alamenciak & Murphy, 2024; Gulliver et al., 2023), yet environmental organizations and their members often face barriers to volunteer activity engagement (Alamenciak & Murphy, 2024; Bruce et al., 2014). One of our co-authors, the former president of this organization, explained that they rely heavily on volunteerism to execute their mission. Volunteers participate in activities including land restoration and conservation, environmental education, and advocacy.
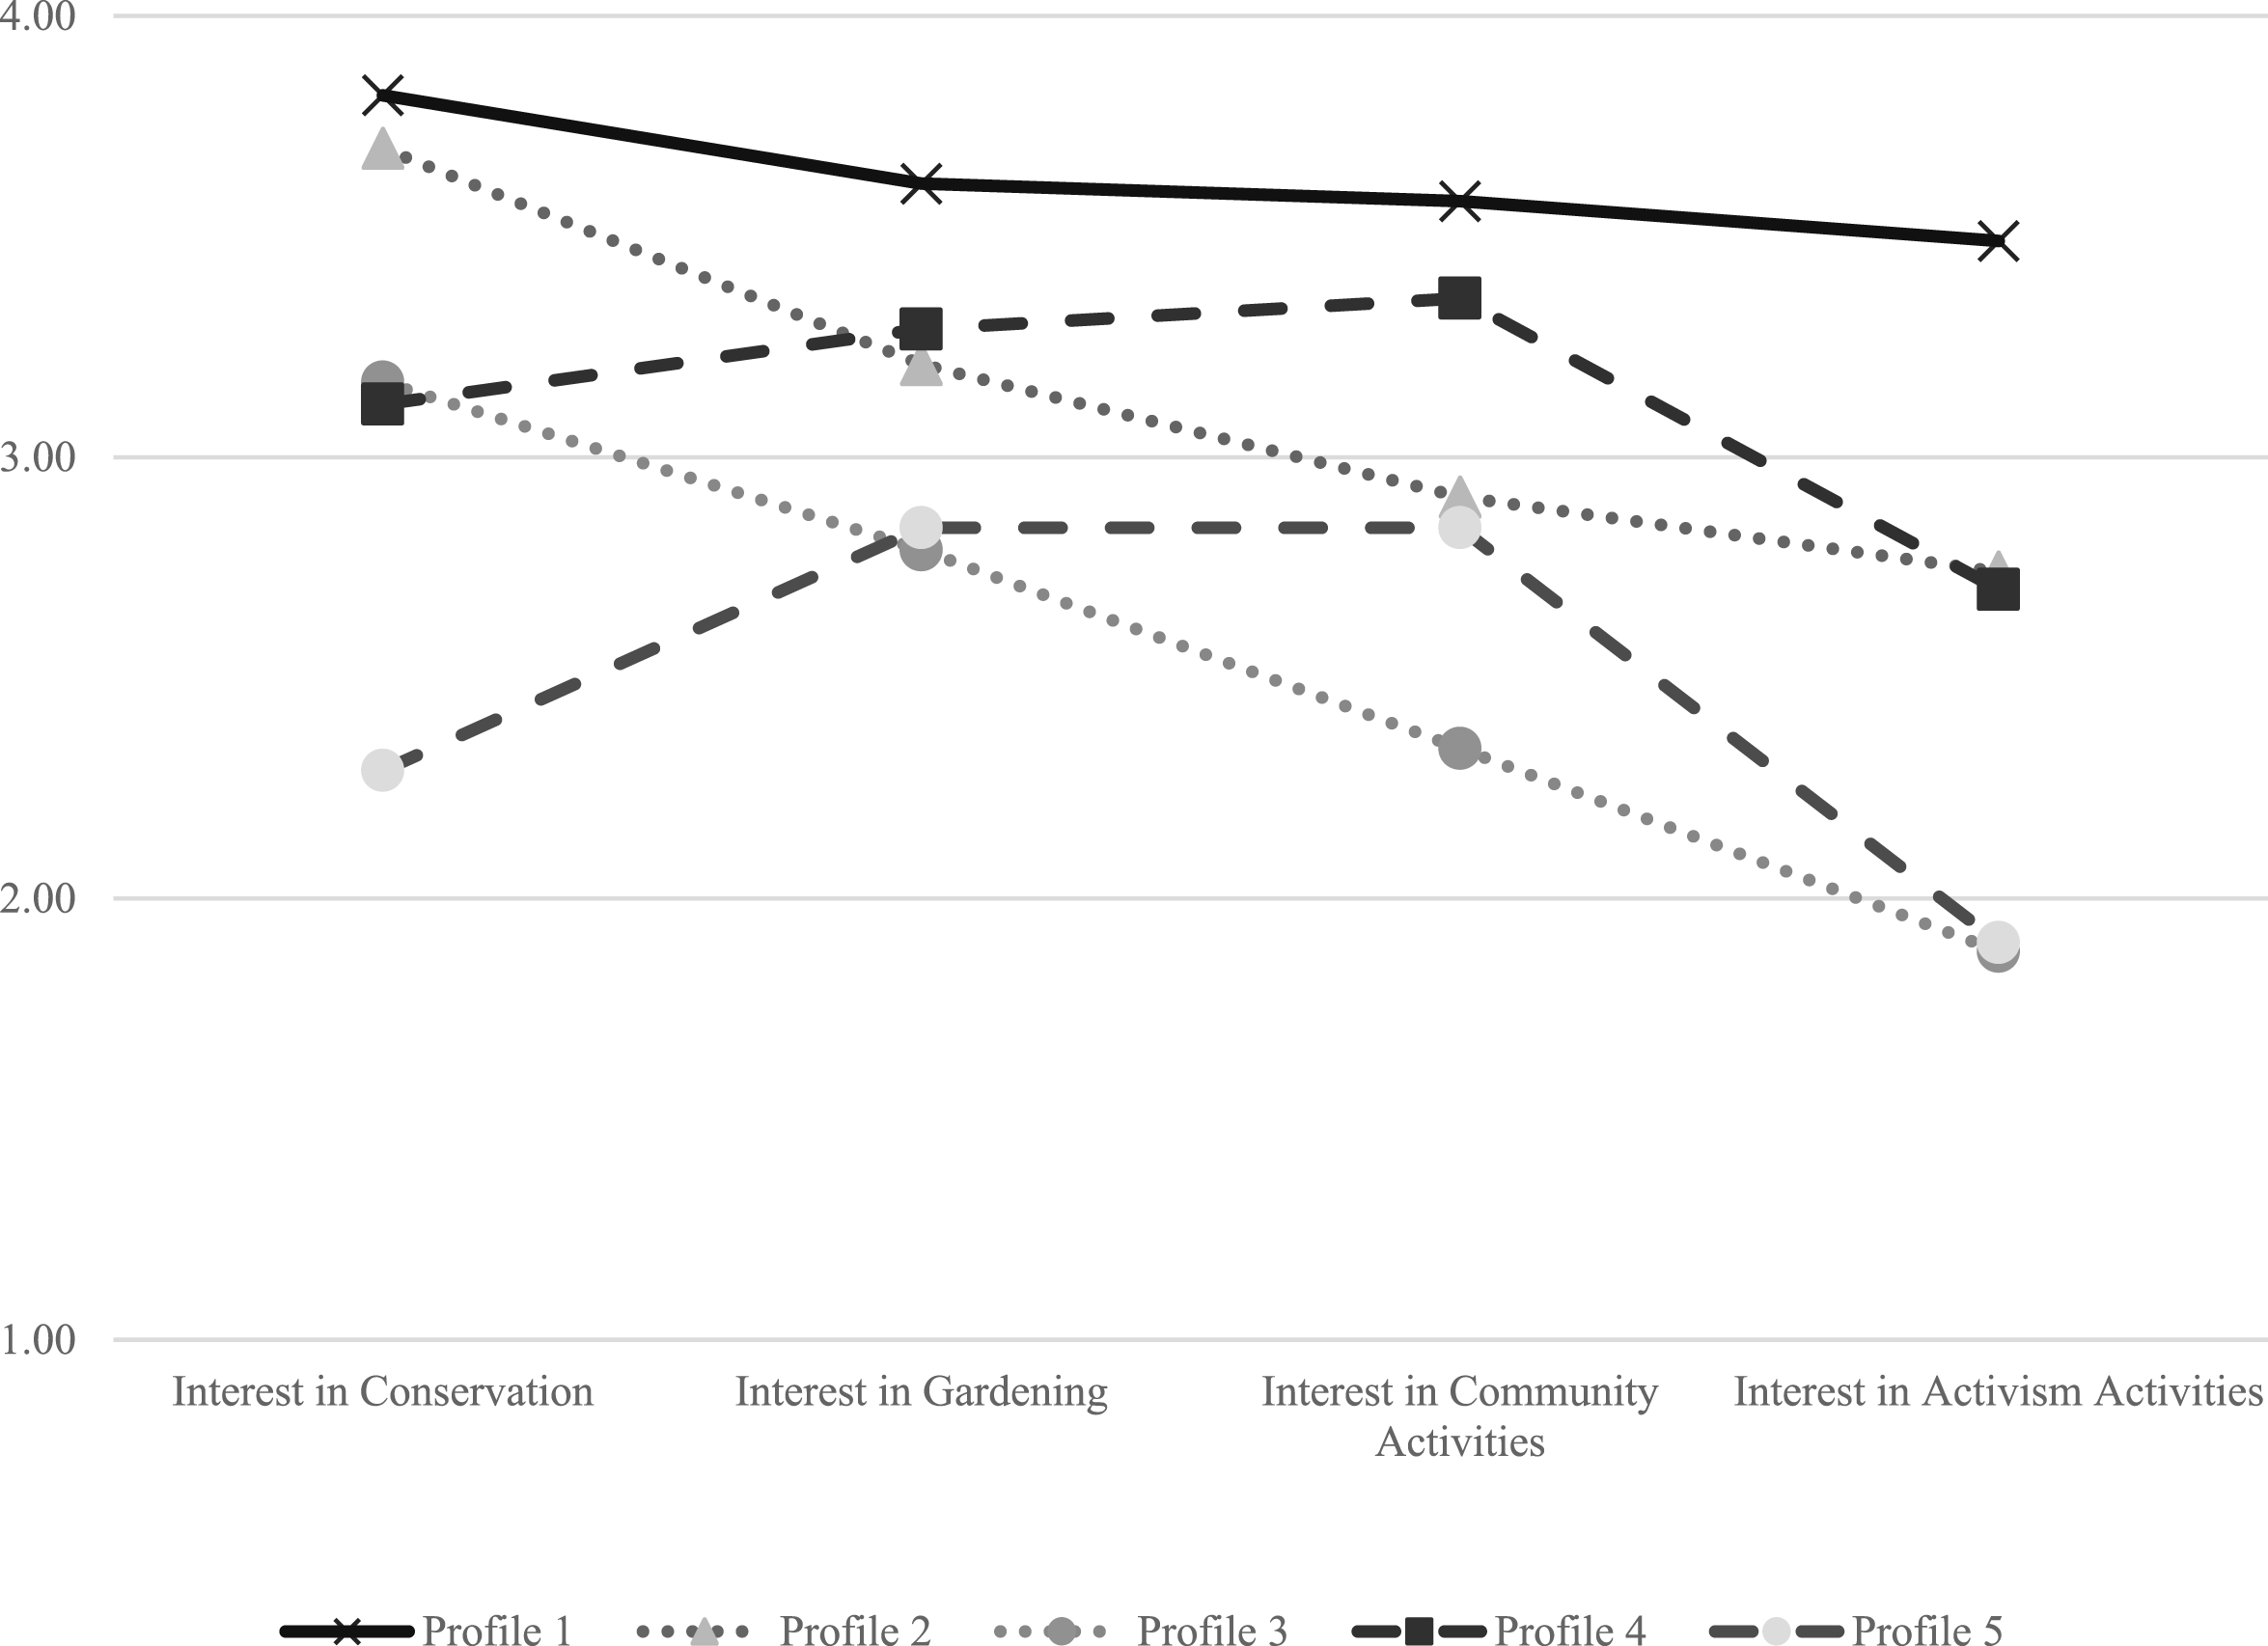
In our meetings, we explained that organizations that understand which volunteers might benefit from various forms of support are more likely to efficiently manage their resources and sustain desirable volunteer participation (Alamenciak & Murphy, 2024). Because of their interest in ways to recruit new members, retain their current members, and recruit current members to take on more volunteer or leadership roles, our partner organization developed a survey to learn more about their members’ interests. Leveraging LPA, we categorized responses into five distinct profiles (Figures 2 and 3) and created targeted member engagement strategies for each profile. Our analysis offers a practical framework for organizations facing member retention and/or engagement challenges by taking a resource optimization approach. We encourage readers to consider organizational goals or ongoing challenges their partner organization may be facing when considering whether an LPA can help address these issues. Bar Graph Representation of the Latent Profiles that Emerged Based on LPA. Note. All Profiles are Described in the Main Text. Profile 1 Refers to the Broadly Interested Group. Profile 2 Refers to the Conservation-Focused Broadly Interested Group. Profile 3 Refers to the Land-Focused Interest Group. Profile 4 Refers to the Balanced Social Gardening Interest Group. Profile 5 Refers to the Social Gardening Non-activist Interest Group Line Graph Representation of the Latent Profiles that Emerged Based on LPA. Note. All Profiles are Described in the Main Text. Profile 1 Refers to the Broadly Interested Group. Profile 2 Refers to the Conservation-Focused Broadly Interested Group. Profile 3 Refers to the Land-Focused Interest Group. Profile 4 Refers to the Balanced Social Gardening Interest Group. Profile 5 Refers to the Social Gardening Non-activist Interest Group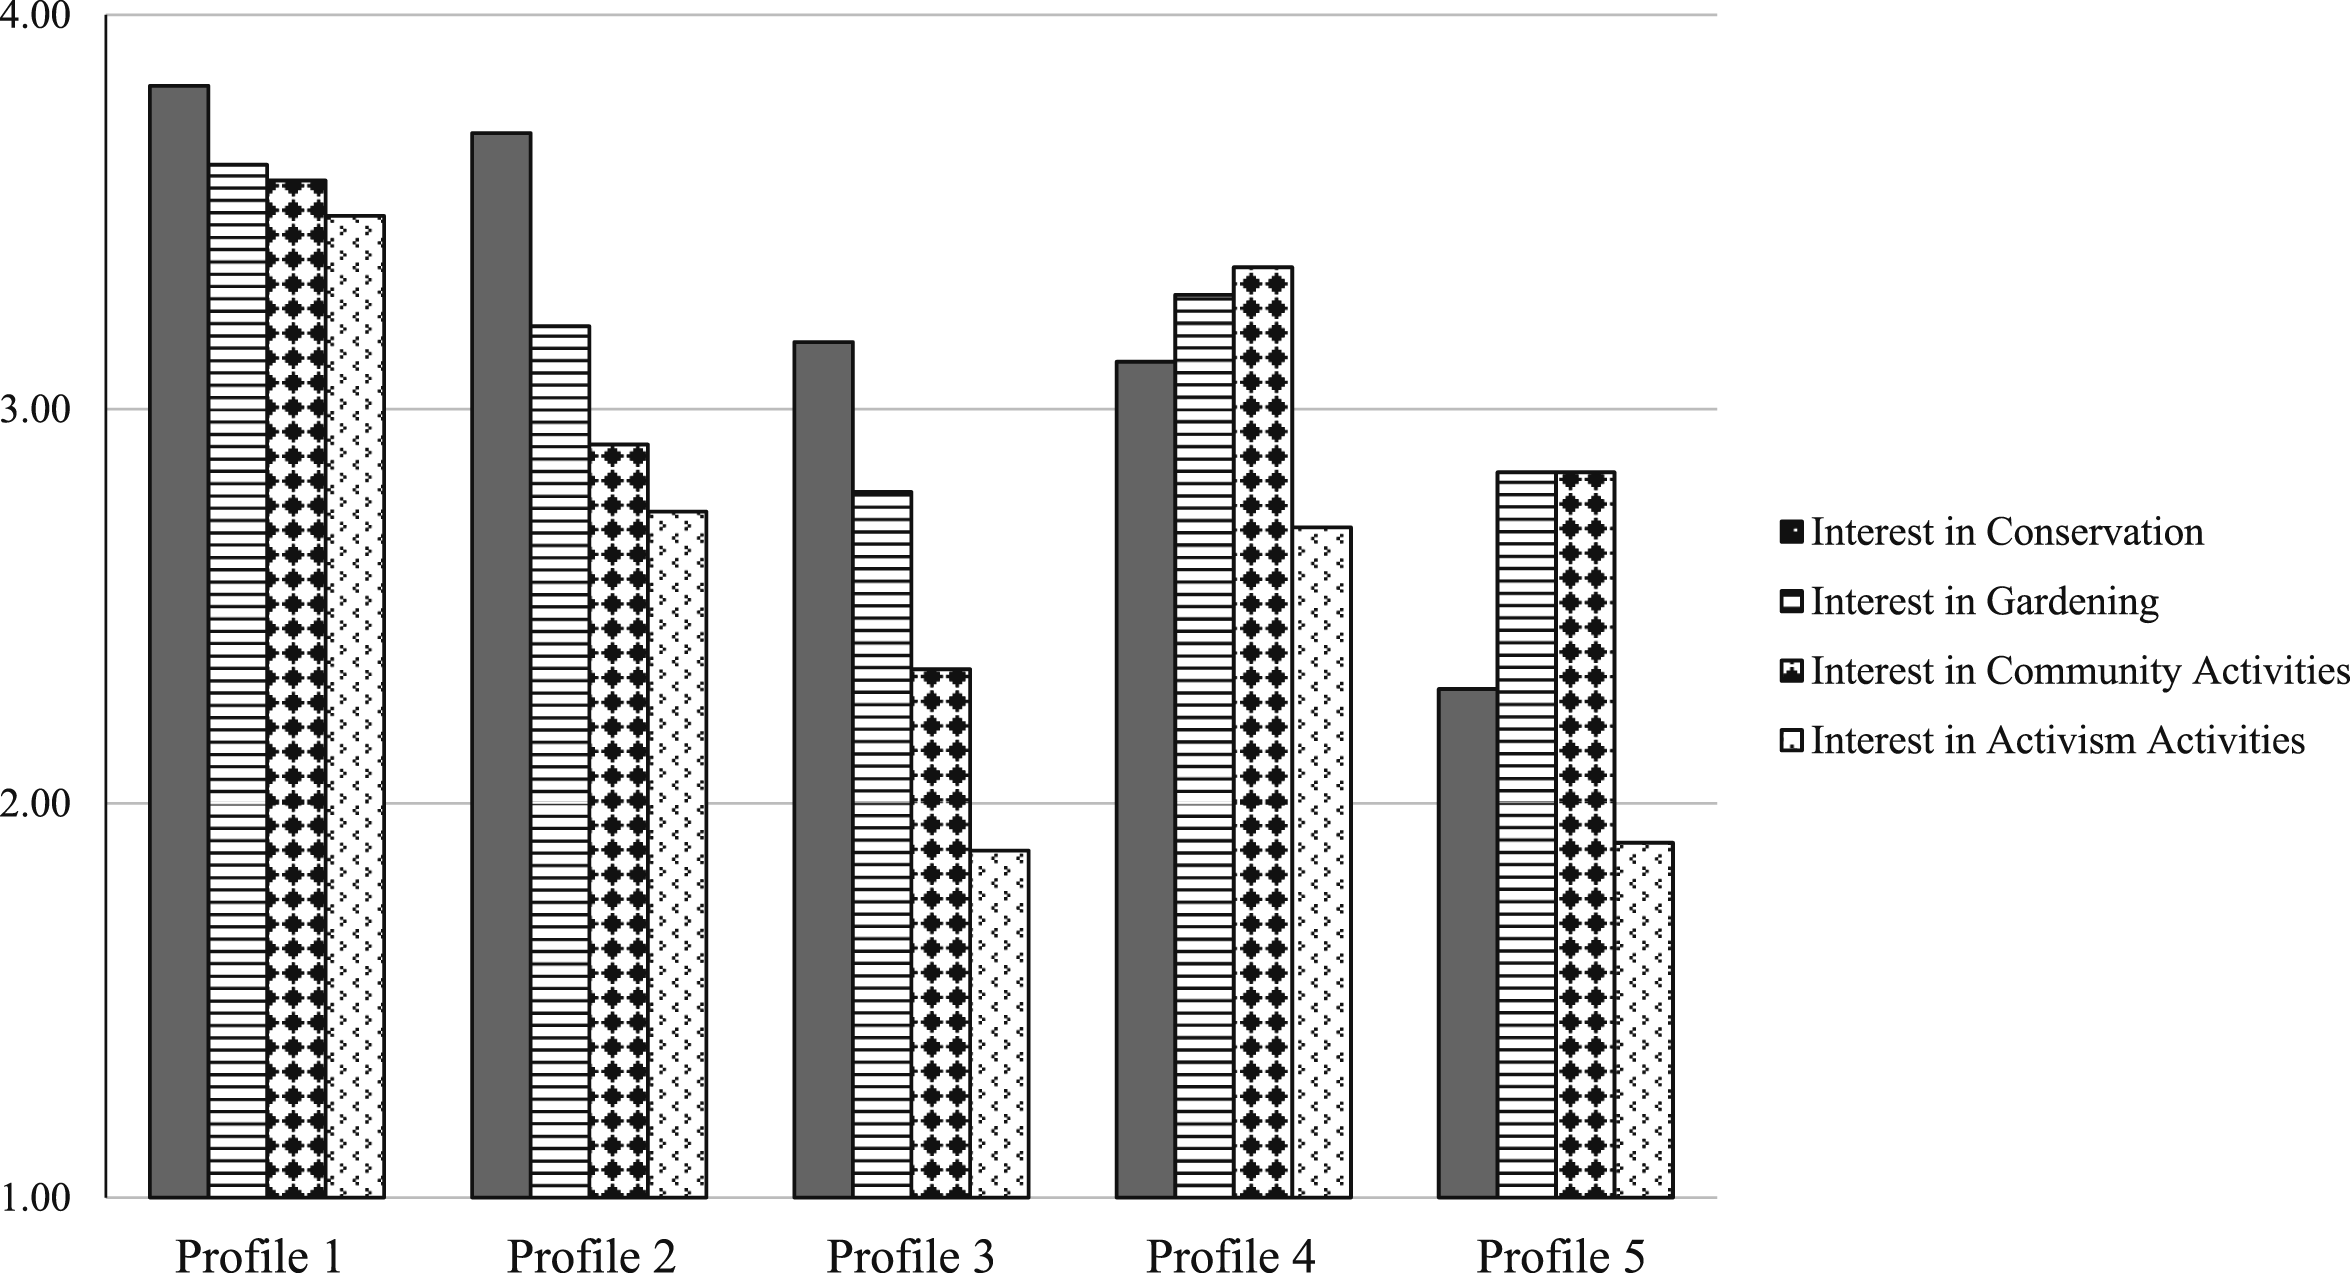
Survey Method
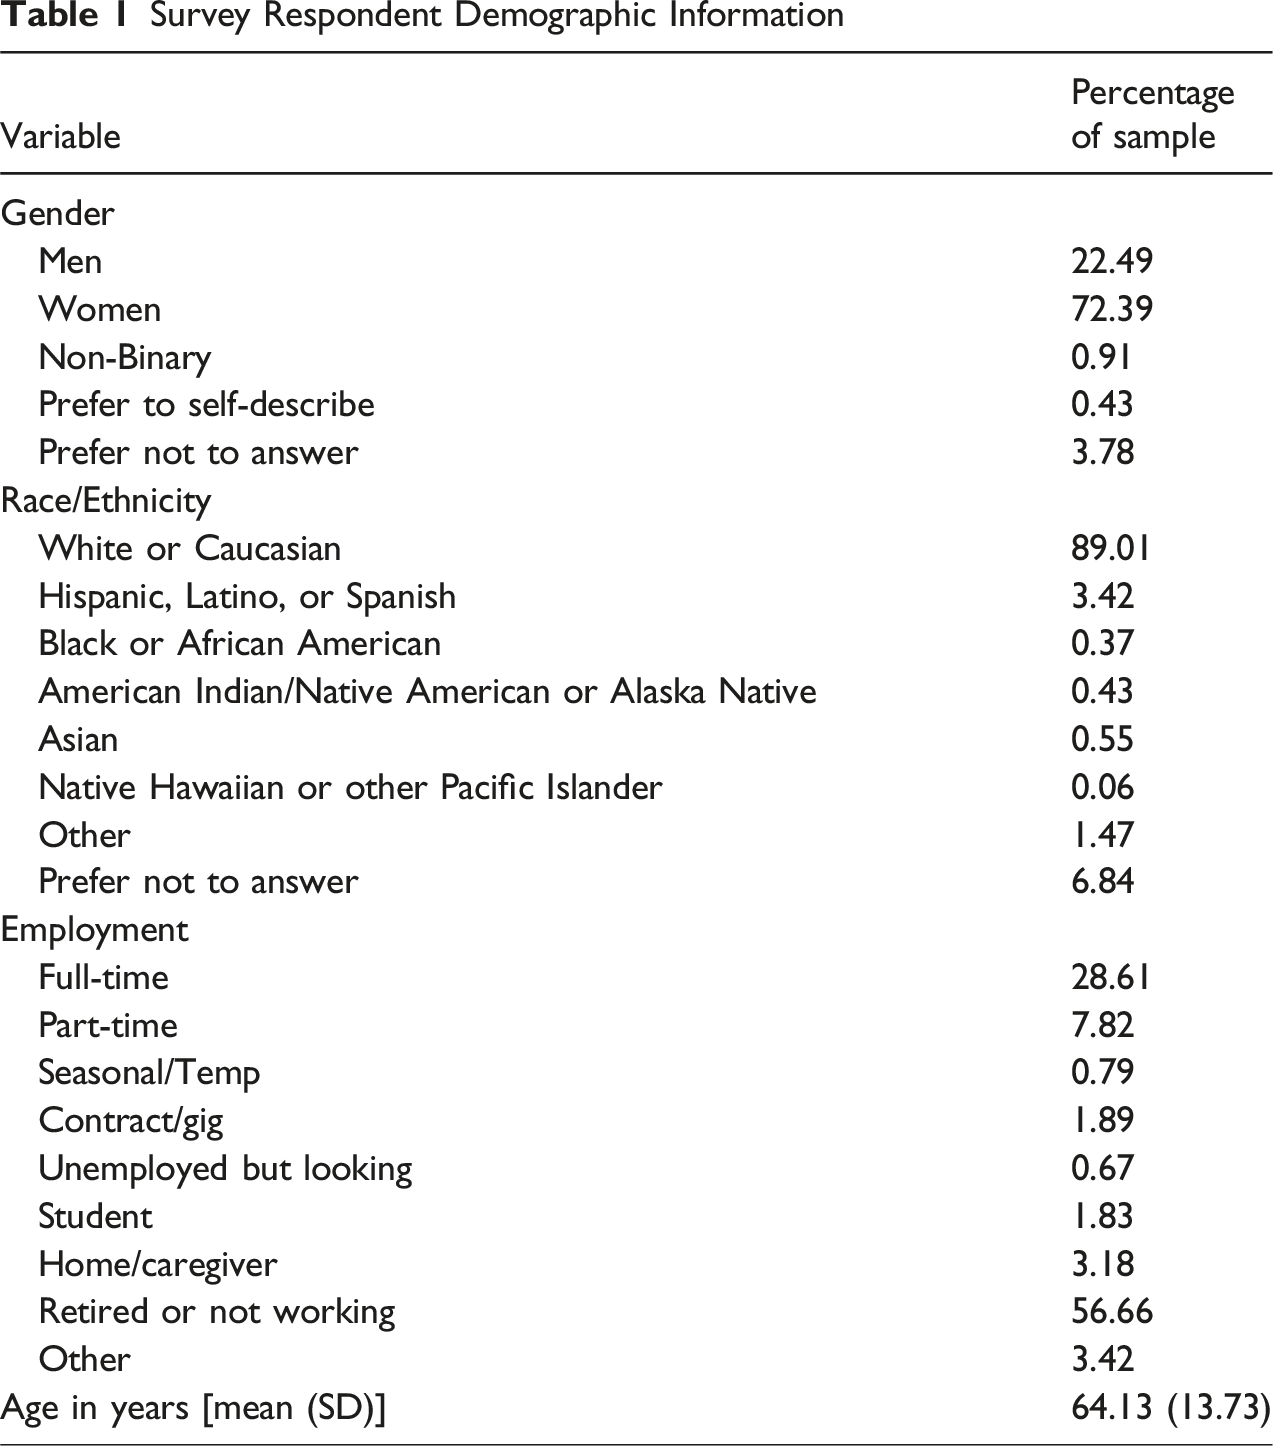
Survey Respondent Demographic Information
LPA Tutorial in Context
Determining the Appropriateness of LPA
There are several conceptual and practical issues to consider before utilizing person-centered analyses like LPA. We highlight some of the most critical considerations but advise those who plan on implementing these analyses to review more comprehensive resources (e.g., Woo et al., 2018). First, person-centered approaches can be employed in both exploratory and confirmatory fashion. Employing these analyses in an exploratory manner before trying to test assumptions (i.e., that the researcher or partnership organization may hold) allows for a more agnostic and potentially less biased approach to the data. In fact, the likely non-ideal state of measures employed in many applied settings make confirmatory conclusions potentially dubious. Additionally, inferential uses of person-centered approaches tend to require either extensive R knowledge or expertise in Mplus, which extends past the scope of the current paper. We focus on the use of LPA as a descriptive tool to help identify member profiles. From this tutorial, we hope a wide audience of management scholars will feel more confident using this tool and providing organizations with feedback about subgroups of survey respondents.
Rationale for Profile Prediction
LPA assumes heterogeneity in the sample population, meaning the presence of subgroups within a given population. While variable-centered approaches can address subpopulations via observed variables (e.g., race, gender), person-centered approaches address unobserved subpopulations. For example, one group of individuals may respond to item A and item C with high values and item B with low values, while another group may respond to item A and item B with moderate values and item C with high values (See Figure 1). These patterns would reflect unobserved heterogeneity. Since the presence of subpopulations is a necessary condition for running an LPA, it is important to have theoretical rationale behind its presence—or, at a bare minimum, data patterns that suggest subpopulations. For example, the NPO that we partnered with is focused on environmental advocacy. It is reasonable to believe that different types of individuals would engage with a nature-driven organization based on different motives: some may be interested in an outdoor hobby whereas others may be interested in learning about their local flora and fauna.
Sample Size
LPA has traditionally been calculated using larger sample sizes than what is recommended as a minimum sample size for common variable-centered analyses like regression or ANOVA. In their LPA review, Woo et al. (2018) found a median sample size of N = 678. Like factor analysis, a hard and fast rule regarding the required sample for LPA does not exist; sample size recommendations vary between 300 and 500 individuals minimum (Nylund et al., 2007; Woo et al., 2018). This is largely due to the computationally intensive model estimation process required to converge a solution.
Monte Carlo studies have been conducted investigating various parameters that can be modified to reduce the necessary sample size all the way down to 100 (Peugh & Fan, 2013; Tein et al., 2013; Wurpts & Geiser, 2014). These modifications include increasing the number of indicators used to form profiles (i.e., instead of 4 or 5, consider using 10–12), using “high-quality” indicators, and estimating few profiles (i.e., 2 or 3 profiles); they can improve LPA statistical power (Peugh & Fan, 2013; Tein et al., 2013; Wurpts & Geiser, 2014).
While increasing the number of indicators or estimating fewer profiles may be more self-explanatory, identifying “high-quality” indicators can be difficult a priori in non-simulated data sets where the quality of indicators is not predefined. A “high-quality” indicator is one that consistently informs how cases are assigned to a ‘most likely profile.’ In other words, if responses to an indicator are highly predictive of profile assignment, it is considered a “high-quality” indicator. While it is not possible to simply see whether a variable can effectively sort cases into latent profiles, the variance of an indicator may provide clues about its quality. It is likely that indicator variables with little variance would be “low-quality” because low variance would suggest little differentiation between cases. For example, if all respondents score a 3 on indicator X, then indicator X would not be able to predict whether respondents will be assigned to Profile Y or Z. Thus, we can recommend plotting potential indicator variable responses and avoiding low variance variables. We recommend referring to Supplemental Figures 1 and 2 to see this in action.
The parameter modifications mentioned above can be used in conjunction to lower the necessary sample size, but applied researchers can also use creative strategies to increase their available sample. For example, an organization that employs fewer than 100 employees might consider using data from job applicants to supplement the incumbent employee sample. Customer-facing organizations such as those in the service, medical, and education industries could consider changing their focus from employee surveys to customer surveys when considering how LPA may help reveal subgroups in the population. In this way, smaller organizations could still use LPA to learn about their clientele.
Data Processing
The first step in conducting an LPA is to prepare the data for analysis in jamovi. We identified several variables as potentially useful for LPA. We noticed the topic interest and activity interest measures seemed to describe at least two possible content areas within each measure. Given our exploratory approach along with the intended purpose of reducing the total number of items in the scale into subscales, we conducted principal components analyses (PCAs) on both scales using jamovi 2.3. As the scales were constructed by the NPO ad hoc without a latent construct in mind, we considered PCA a more appropriate analysis than exploratory factor analysis (EFA) as EFA is used to understand the underlying latent construct (Conway & Huffcutt, 2003; Costello & Osborne, 2005).
Descriptive Statistics and Correlations for LPA Indicators
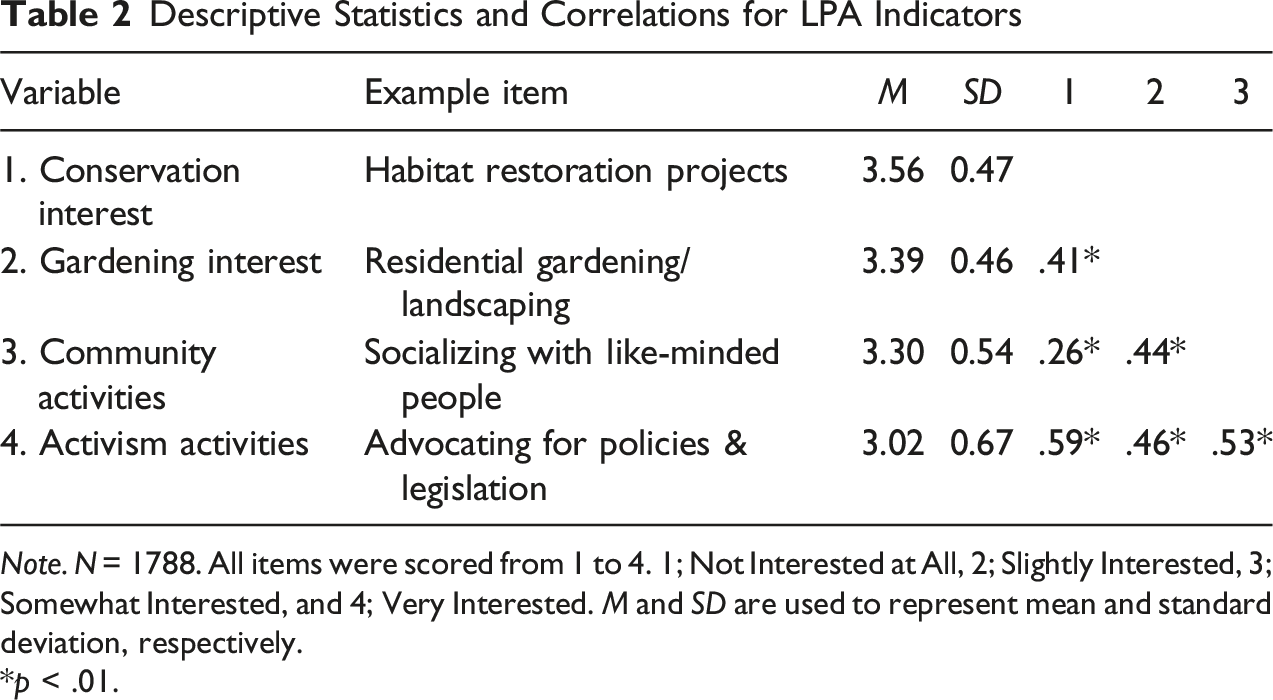
Note. N = 1788. All items were scored from 1 to 4. 1; Not Interested at All, 2; Slightly Interested, 3; Somewhat Interested, and 4; Very Interested. M and SD are used to represent mean and standard deviation, respectively.
*p < .01.
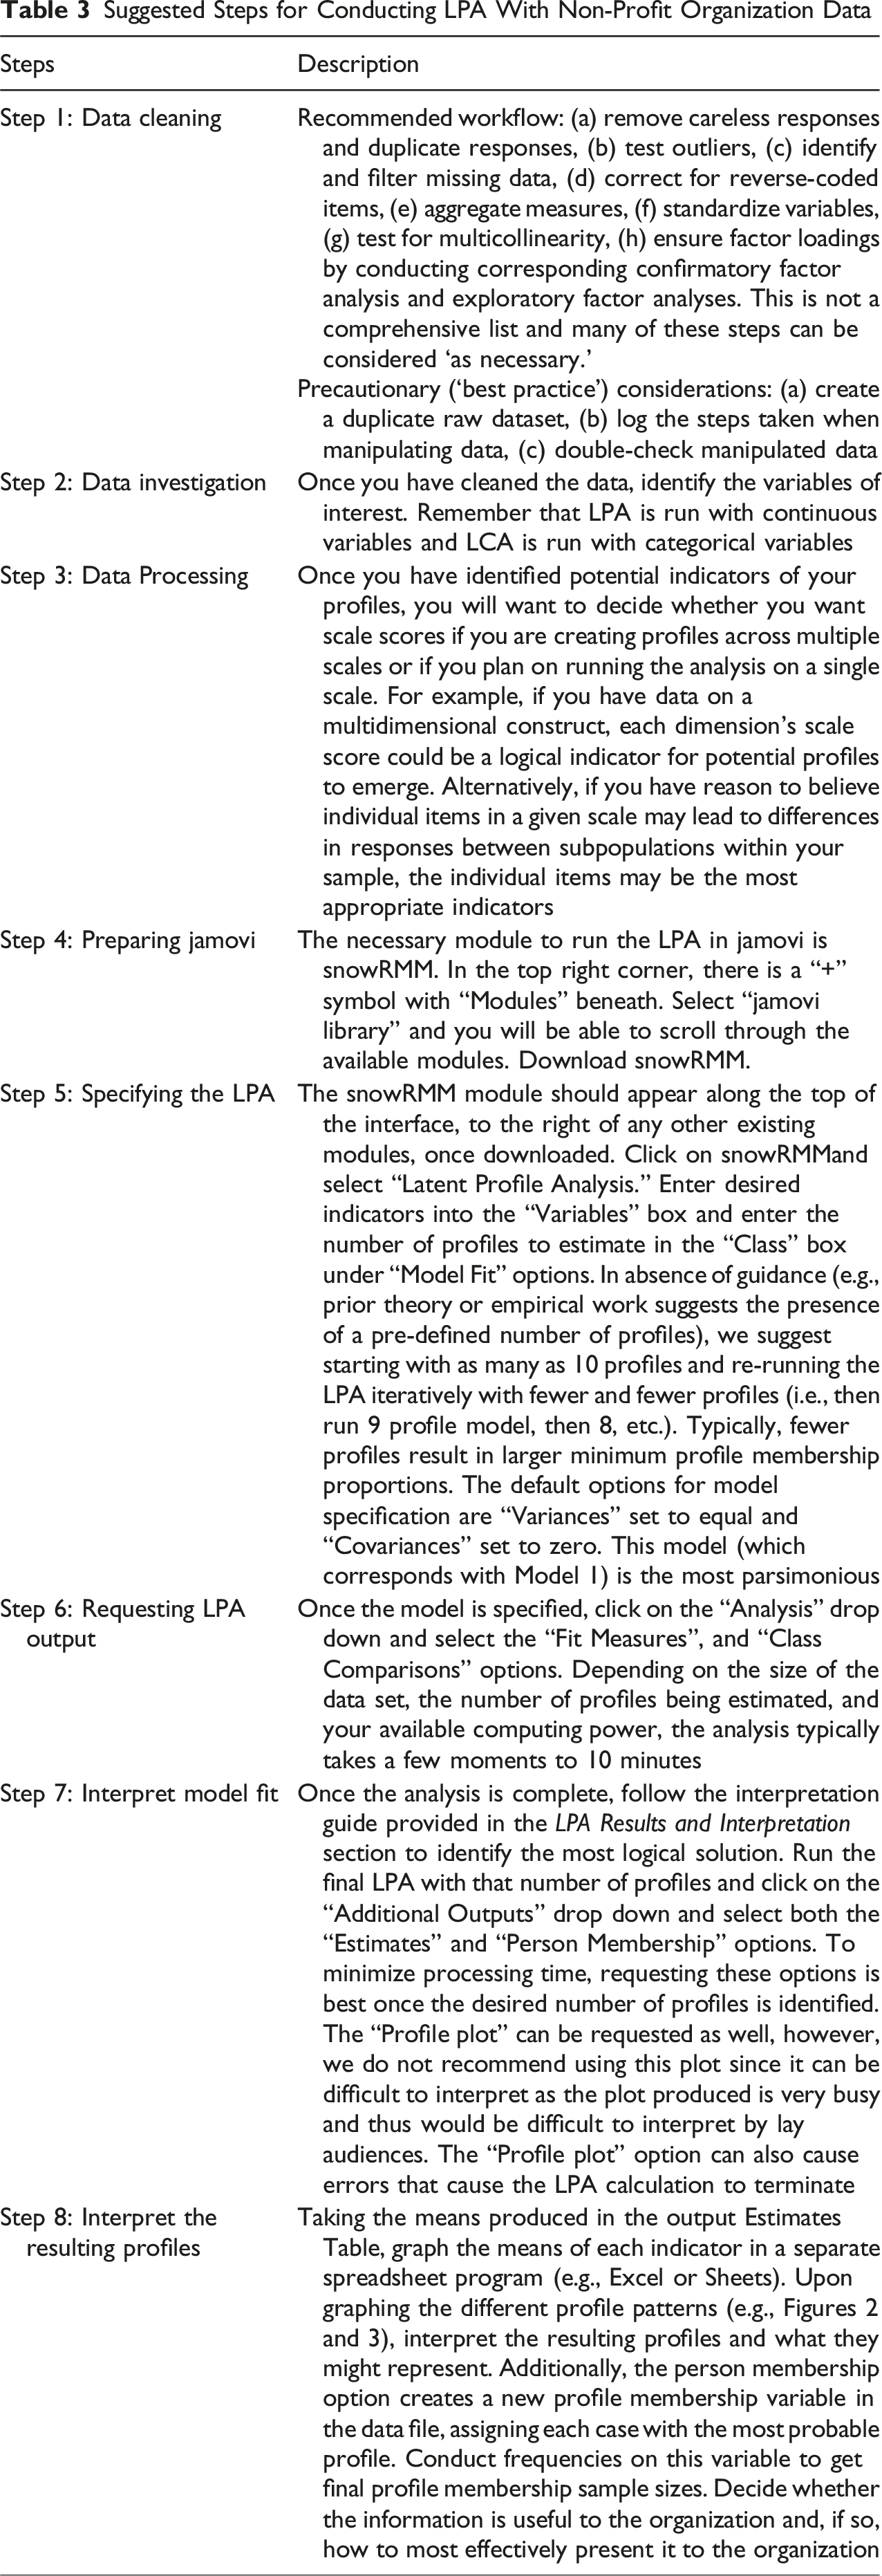
Suggested Steps for Conducting LPA With Non-Profit Organization Data
Interpretating the Profiles
Profile one was named the “Broadly interested” group. This profile is the most populous profile (50.89%) and consists of members who are broadly interested in all four indicator topics (i.e., conservation, activism, community activities, and gardening). The high levels of interest across all four topics would suggest high alignment between members in this profile and the NPO’s values and mission. This profile likely represents the ideal member.
Profile two was named the “Conservation-focused broadly interested” group. This profile represents 19.8% of the sample and is characterized by a particularly high interest in conservation and moderate to high interest in the remaining topics. The NPO could leverage their high interest in conservation when planning conservation initiatives, which often require a significant time and effort investment.
Profile three was named the “Land-focused interest” group. This profile (4.42% of the sample) is characterized by members who have a moderate to high interest in nature-oriented topics (conservation, gardening) and lower interest in social activities (community activities, activism). The organization may have less success trying to engage this group by offering social activities or appealing to social goals in volunteer requests. Instead, activities that do not involve a major social component may be well-suited for members of this profile.
Profile four was named the “Balanced social gardening interest” group. This profile represents 20.02% of the sample and is characterized by a moderate to high balanced interest across the four topics with a higher score on community activities and gardening. This profile may place a higher priority around social activities, which would provide the organization with volunteers well-suited for initiatives to recruit new members to the organization.
Finally, profile five was named the “Social gardening non-activist interest” group (4.87% of the sample). This profile is characterized by a moderate to high interest in gardening and community activities, a moderate interest in conservation, and a low interest in activism activities. This profile is comprised of members who scored the lowest in conservation and activism activity interest compared to the other profiles.
While the NPO considers several factors (e.g., costs, timeliness) when making decisions about programming to engage members, LPA insights provide them with a better idea of who they are targeting with their decisions. Importantly, interests may not always align with actual engagement. If programming is developed to match the interests of membership profiles, the NPO may interpret a lack of attendance or engagement to result not from a lack of interest in the activity but instead from barriers such as transportation, scheduling, or role conflicts. The NPO’s resulting membership engagement strategies may then shift from increasing the breadth of programs toward helping facilitate access to existing activities.
Communicating the Value of LPA Results
Effectively communicating profile implications to organizations is essential to realizing the value of LPA. Organizations may be interested in answering questions such as, “do subgroups exist?” or “are there subgroups of members more likely to hold certain interests or engage in certain behaviors?” LPA can be a fantastic tool for generating helpful feedback to answer these questions and enhance organizational research partnerships. Our organizational partner co-author agreed that this collaborative approach allowed the organization to gain better investment in the process of understanding membership group nuances that can impact organizational strategy.
Organizational scientists and practitioners must also communicate the benefits that come with understanding different member profiles, such as how understanding the interests, motivations, and needs of different groups in the organization can lead to increased retention and engagement as well as better allocation of resources. Applied researchers can explain that if there is a pattern in most profiles having a high interest in a certain activity or topic, they can better allocate resources toward such initiatives. In making recommendations, it is important to consider the holistic view of each profile so that the impact of organizational resources can be maximized. For example, profiles three and five each accounted for approximately 5% of the organization. We can guide our organizational partner to look for common ground between these profiles and more populous ones rather than making decisions that would only benefit a smaller group of members. To help organizational stakeholders see the value in LPA findings, we recommend (1) creating visual aids (such as Figures 2 and 3) and (2) isolating specific profiles when describing LPA results.
Limitations of LPA for Applied Research
As we present our tutorial, there are caveats that should be considered. Our analyses were conducted to support our organizational partner’s needs, without the goal of generalizing beyond the sample. Therefore, the insights gained from using LPA can inform better decision making and resource allocation within the organization. However, this assumption could be questioned if the target population was not effectively sampled. In our analysis, the most populous profile was a broadly interested profile. This could suggest that the organization has effectively recruited members that align broadly with its interests; it could also reflect sampling bias with only broadly interested individuals completing the survey. If you have reason to believe data are missing at random, we recommend assigning non-responding individuals to profiles proportionally based on the membership percentages of existing data.
We also want to reiterate the care that must be taken when interpreting LPA results. Like exploratory factor analysis, the process of identifying the “true” profile solution is highly iterative, which can result in spurious conclusions. Forward-thinking interpretations (i.e., those that illuminate something not already obvious to the organization) are essential to unlocking the benefits of using LPA. Involving more peers in the interpretation process allows for better opportunity to discover these patterns.
What Happens Next?
While some believe organizational leaders don’t have the time or interest to participate in research collaborations, the reality is that researchers must demonstrate the value of such collaborations to foster strong partnerships (Bourgoin & Harms, 2024). Applied researchers can use LPA to align the use of advanced statistical methods with the practical environment of the data. Organizations consider such aligned collaborations with management scholars as strategic alliances (Ireland et al., 2002). Descriptive LPAs are therefore useful in applied research settings because they help management scholars weave a narrative with statistics to support approachable conversations with leaders (Murphy, 2021).
By running these analyses and presenting this information in an easy-to-understand manner, you will have demonstrated value to your organizational partner. Some stakeholders may receive this new information with questions like, “Why should we care about these profiles?” or “Who ends up in these profiles?” These represent follow-up questions to identify outcomes associated with each profile’s membership using ANOVA analyses and predictors of the profiles using multinomial logistic regression. For more information, including an example dataset to try for yourself, refer to the Online Supplemental Materials. We hope this tutorial has helped you to feel like LPA really is an applied research tool for you.
Supplemental Material
Supplemental Material - Rest Easy, Applied Researcher: Latent Profile Analysis is for You
Supplemental Material for Rest Easy, Applied Researcher: Latent Profile Analysis is for You by Matthew A. Ng, Chelsea A. LeNoble, Allen Shorey, Abigail Gregory, and Mark Kateli in Group & Organization Management.
Footnotes
Author Note
An earlier version of this manuscript was drafted while Dr. Matthew Ng was a graduate student at the University of Central Florida.
Ethical Approval
The University of Central Florida Institutional Review Board approved this study (STUDY00005999) with a determination of not research involving human subjects as defined by DHHS and FDA regulations due to the organization providing us with anonymized data to analyze.
Consent to Participate
The requirement for informed consent to participate has been waived by the UCF IRB as an anonymized dataset was provided by the partner organization, making the data non-human-subjects data.
Author Contributions
C.L. and M.N. originated the idea for the project and C.L. convened the full team of co-authors. C.L. and M.N. conceptualized the project with support from A.S. and M.K. M.K. provided data resources and access. M.N. conducted the formal analysis and developed the online appendix materials with support from A.S. C.L., M.N., A.G., and A.S. drafted the original manuscript. All authors reviewed, edited, and approved the final manuscript.
Funding
The authors received no financial support for the research or authorship of this article. Article processing charges were provided in part by the University of Central Florida (UCF) College of Graduate Studies Open Access Publishing Fund, the University of Central Florida College of Sciences Research Dissemination and Travel Award, and the Missouri University of Science and Technology Library Subvention Program.
Declaration of Conflicting Interest
The authors declared no potential conflicts of interest with respect to the research, authorship, and/or publication of this article.
Data Availability Statement
Raw data for this study are not available due to privacy and the data sharing agreement with our partner organization.
Supplemental Material
Supplemental material for this article is available online.
Author Biographies
References
Supplementary Material
Please find the following supplemental material available below.
For Open Access articles published under a Creative Commons License, all supplemental material carries the same license as the article it is associated with.
For non-Open Access articles published, all supplemental material carries a non-exclusive license, and permission requests for re-use of supplemental material or any part of supplemental material shall be sent directly to the copyright owner as specified in the copyright notice associated with the article.