
Abstract
Empirical research investigating the impact of top management team (TMT) diversity on executives’ decision making has produced inconclusive results. To synthesize and aggregate the results on the diversity-performance link, a meta-regression analysis (MRA) is conducted. It integrates more than 200 estimates from 53 empirical studies investigating TMT diversity and its impact on the quality of executives’ decision making as reflected in corporate performance. The analysis contributes to the literature by theoretically discussing and empirically examining the effects of TMT diversity on corporate performance. Our results do not show a link between TMT diversity and performance but provide evidence for publication bias. Thus, the findings raise doubts on the impact of TMT diversity on performance.
TMT Diversity and the Performance Link
There has been a surge of interest in top management team (TMT) research during the last several decades since the publication of the paper by Hambrick and Mason (1984) introducing the upper echelons (UE) perspective. The TMT is defined as “the relatively small group of most influential executives at the apex of an organization—usually the CEO (or general manager) and those who report directly to him or her” (Finkelstein, Hambrick, & Cannella, 2009, p. 10). One of UE’s major views is that “the demographic characteristics of executives can be used as valid, albeit incomplete and imprecise, proxies of executives’ cognitive frames” (Hambrick, 2007, p. 335). Since the initial publication, a distinct body of literature has developed focusing on the impact of diversity characteristics on corporate performance (Bantel, 1994; Carpenter, 2002; Carpenter & Fredrickson, 2001; Hambrick, Cho, & Chen, 1996; Jaw & Lin, 2009; Nielsen, 2010a; Sanders & Carpenter, 1998; Wiersema & Bantel, 1993).
At the core of TMT diversity research stands a theoretical argument valuable for firms: high levels of diversity among board members, TMTs or work groups are assumed to lead to improved performance (Naranjo-Gil, Hartmann, & Maas, 2008; Nielsen, 2010b). We refer to this argument as the diversity-performance link in the remainder of the paper. This paper systematically reviews the body of literature that examines diversity within TMTs and its impact on corporate performance.
We make four contributions to the literature. First, we quantitatively aggregate recent findings on the diversity-performance link. Empirical studies investigating the effects of diversity and related qualitative reviews find conflicting evidence and some argue that diversity is a “double-edged sword” (Amason, Shrader, & Tompson, 2006; Jackson, May, & Whitney, 1995; Jehn, Northcraft, & Neale, 1999; Milliken & Martins, 1996; Pelled, 1996; Williams & O’Reilly, 1998). For example, looking at the research on the diversity-performance link referring to gender diversity, one can find primary studies reporting either positive effects (Carter, Simkins, & Simpson, 2003), negative effects (Kochan et al., 2003), or neutral effects (Rose, 2007). Since the empirical results that researchers have produced are far from being straightforward, a meta-analytic aggregation has the potential to provide new insights on the diversity-performance link.
Second, we employ meta-regression analysis (MRA) as our methodological tool following the procedures described by Stanley (2001). One of the strengths of MRA is its ability to investigate both the impact of different characteristics of primary studies (i.e., potential moderators) and the distortion of results due to publication bias (Doucouliagos, 2005; Stanley, 2001). Alternative meta-analytic techniques such as the more commonly employed Hunter and Schmidt procedure have their own advantages, but are unable to control for distorting factors as MRA is able to do (for a detailed introduction to MRA see Stanley & Doucouliagos, 2012; for an application see Carney, Gedajlovic, Heugens, Van Essen, & Van Oosterhout, 2011).
Third, we investigate whether the diversity-performance link literature is affected by publication bias. Publication bias refers to a possible bias with respect to which studies are published due to an editor’s or referee’s preference for a certain type of result; publication bias is not always investigated in meta-analyses (Banks, Kepes, & McDaniel, 2012; Sutton, Duval, Tweedie, Abrams, & Jones, 2000). Stanley (2008, p. 104) described it as follows: Publication bias, or the “file drawer problem,” is the consequence of choosing research papers for the statistical significance of their findings. “Statistically significant” results are often treated more favorably by researchers, reviewers and/or editors; hence, larger, more significant effects are over-represented.
In the last decade several meta-analyses investigating the effects of diversity in organizations were conducted (Certo, Lester, Dalton, & Dalton, 2006; Horwitz & Horwitz, 2007; Joshi & Roh, 2009; Webber & Donahue, 2001). None of these works investigated issues of publication bias. Kepes, Banks, McDaniel, and Whetzel (2012) find that only a minor fraction of meta-analyses in organization research address the issue of publication bias and note a need for this information. Thus, our work responds to their call for analysis of publication bias in organizational research.
Fourth, we update the findings of previous systematic reviews investigating the effects of TMT diversity on corporate performance. Closest to our work are the analyses by Webber and Donahue (2001) and Certo and colleagues (2006). The former examines the impact of diversity on work group cohesion and performance. The authors use a separate variable to control for TMTs or lower level work groups. Their work covers the period of 1980 to 1999. In contrast, our study systematically identified 120 studies of TMT diversity published during the first decade of the 21st century, implying that Webber and Donahue’s sample ends where ours begins. The latter focuses on the relationship between TMT’s demographics and firm performance of 27 empirical studies in the period of 1992 to 2002. Thus, there is only minimal overlap between their database and the studies included in our database. Our database consists of 53 quantitative studies that qualified for the meta-analysis. Of those 53 studies, 5 studies are included in Certo and colleagues’ (2006) study.
Theoretical Approaches to TMT Diversity
There are two theoretical lenses through which the impact of diversity is usually assessed. The first is the UE approach developed by Hambrick and Mason (1984; see also Hambrick, 2007). According to the UE approach, individual characteristics of top managers have an impact on their strategic actions which, in turn, are related to corporate performance (Hambrick & Mason, 1984). Consequently, corporate performance can be explained by the different characteristics of TMT members (Finkelstein & Hambrick, 1990). Another notion of UE research is related to decision making and cognition. This notion cannot be captured completely by looking at the demographic characteristics of the TMT. However, since the demographic characteristics are a major component of UE research, we decided to include studies using a UE approach in our analysis.
The second lens is rooted in social psychology. This literature has produced two perspectives that frequently guide diversity studies: the information-decision-making perspective and the similarity-attraction perspective (Jehn et al., 1999; van Knippenberg, De Dreu, & Homan, 2004). We briefly outline both perspectives in the following paragraphs.
The information-decision-making perspective underlines the positive impact of diversity on decision making (Bantel & Jackson, 1989; van Knippenberg et al., 2004; Williams & O’Reilly, 1998). From this point of view, decision quality is determined by information exchange within a team and the way this information is processed (Brockmann & Anthony, 2002; Gebert, 2004; Hinsz, Tindale, & Vollrath, 1997). Thus, high levels of team diversity lead to broader perspectives and a greater amount of information shared, consequently enhancing decision quality.
In contrast, the similarity-attraction perspective highlights the positive effects of team homogeneity (Williams & O’Reilly, 1998). According to Allport (1954), individuals strive to reduce uncertainty stemming from unfamiliarity with unknown team members when forming a new group to avoid a relational conflict. Heterogeneity among team members tends to trigger fear and uncertainty. Thus, similarity among team members increases identification within a given team (Jehn, Chadwick, & Thatcher, 1997; van Knippenberg & Schippers, 2007). From this viewpoint, decision quality will be higher when groups are more homogenous (Jehn & Mannix, 2001). Similarity can also contribute to team cohesion, which is positively linked to performance (Michel & Hambrick, 1992) and has been identified as a strategic asset (Michalisin, Karau, & Tangpong, 2004). Hence, there is a trade-off between the information-decision-making and the similarity-attraction perspectives.
Empirical studies that analyze diversity’s impact on team outcomes to date have supported both the predictions based on the information-decision-making perspective and those based on the similarity-attraction perspective (for reviews see Milliken & Martins, 1996; Pelled, 1996; Williams & O’Reilly, 1998). Also, UE studies produced varied results (Carpenter, 2002; Hambrick et al., 1996; Korn, Milliken, & Lant, 1992; Michel & Hambrick, 1992; Murray, 1989). Such inconclusive and varied results have been found in relation to gender diversity (Carter et al., 2003; Kochan et al., 2003; Rose, 2007; Welbourne, Cycyota, & Ferrante, 2007), age diversity (Kilduff, Angelmar, & Mehra, 2000; Richard & Shelor, 2002; Wiersema & Bantel, 1993), and educational diversity (Barkema & Shvyrkov, 2007; Dahlin, Weingart, & Hinds, 2005; Hambrick et al., 1996).
High levels of functional diversity in TMTs have a significant positive effect on performance (Boone & Hendriks, 2009; Bunderson, 2003). TMTs with high functional diversity are found to obtain more venture capital funding (Beckman et al., 2007), higher levels of administrative innovations (Bantel & Jackson, 1989), and greater strategic orientation (Auh & Menguc, 2005). However, functional diversity was found to be negatively related to commitment to strategic status quo (Geletkanycz & Black, 2001), information sharing (Bunderson & Sutcliffe, 2002), ineffective communication (Glick, Miller, & Huber, 1993), and team performance (Bunderson, 2003).
Researchers have also investigated the impact of environmental uncertainty on diversity effects by distinguishing between stable and unstable periods in different industries (Keck, 1997), by analyzing competitors’ actions (Hambrick et al., 1996) or by creating scales to capture environmental uncertainty based on sales volatility (Carpenter & Fredrickson, 2001). Hence, environmental uncertainty can be considered to be an important moderator in TMT research. The current state of research, as briefly described above, qualifies for a meta-analysis. Therefore, our study aims to provide an analytical integration of the available evidence. The next sections describe the methods used in this study.
Method
A systematic search was conducted using different combinations of the key words UE, TMT diversity, performance and functional diversity, gender diversity, tenure diversity, and educational diversity. We carried out our searches using the databases EBSCO, Web of Science and Google Scholar, and checked again with all the selected journals (a list of studies that were included in the analysis is available from the first author). We did not conduct separate searches using the keywords information-decision-making paradigm and similarity-attraction paradigm because these are subsets of the key words already used. Publications were also checked manually for relevant references. The search period ranges from 2000 to 2010. The four meta-analyses addressed previously were checked manually for references that investigate TMT diversity and that were published over the past decade. The systematic-search approach identifies a relevant selection of studies representing the current state of the literature. Due to the nature of the review, we excluded all studies investigating diversity in work groups below the TMT, such as work published by Stewart and Johnson (2009) and Kirkman, Tesluk, and Rosen (2004), that were identified by the search procedure. Additionally, the search procedure ensures that the estimates presented in the studies included in our work can be meaningfully compared to each other. Our initial literature research retrieved 120 published papers on TMT diversity.
For the purposes of this analysis we refine the inclusion criteria further according to the following conditions: First, we focus on quantitative analyses. Studies that conduct qualitative investigations have to be excluded. This restriction does not mean we reject qualitative studies due to their nature, but only quantitative studies can be integrated into a MRA. Second, studies must focus on TMT characteristics to cover the theme of diversity. Jackson and colleagues (2003, p. 802) define diversity as “the distribution of personal attributes among interdependent members of a work unit.” Theoretically an unlimited number of characteristics could be found to measure diversity. However, in the literature, a limited number of characteristics have been investigated (Jackson et al., 1995; Milliken & Martins, 1996; Pelled, 1996). A widely employed categorization distinguishes between observable and underlying diversity attributes (Harrison, Price, & Bell, 1998; Milliken & Martins, 1996; van Knippenberg & Schippers, 2007). Observable attributes include demographic variables such as age, ethnicity, and gender. Underlying diversity attributes capture characteristics such as functional background, education, or tenure (Barker & Patterson, 1996; Bowers, Pharmer, & Salas, 2000; Jehn et al., 1999; Milliken & Martins, 1996). Some authors also include international experience in their underlying diversity measures (Athanassiou & Nigh, 2002; Carpenter & Fredrickson, 2001). We explain the coding of variables in the data and variables section.
One major aim of this paper is to summarize the available evidence of the effects of TMT diversity on firm performance. As a consequence we exclusively select studies reporting an estimate of the diversity-performance relationship. Studies that do not provide relevant quantitative estimates of the diversity-performance link are excluded. Further, we limited our selection to those studies using a standard regression analysis. From our point of view, this increases the comparability of estimates.
Finally, we focus on reviewing papers in the major management outlets (equivalent to Association of Business Schools (ABS) list Grades 4 and 3). We took this decision because not all of the journals have the same currency for management scholars. A list of journals is included in appendix.
Procedures
Meta-analysis is a quantitative technique to summarize empirical results. Meta-analysis helps researchers to integrate conflicting empirical results and to enable them to assess the current state of knowledge on a given subject (Stanley, 2001). Its ultimate goal is to identify and calculate the true underlying empirical effect of a certain treatment or relationship.
A meta-analysis synthesizes the findings of original research papers which are referred to as primary studies. A finding is defined as one empirical relationship referring to the variable of interest that is represented, for example, by a correlation coefficient (Lipsey & Wilson, 2000). Each finding taken has to be transformed into an appropriate effect size; that is, the results of primary studies have to be transformed to a common scale. Otherwise, variables measured on different scales could not be integrated. The effect size should display both magnitude and direction of an underlying effect (Lipsey & Wilson, 2000, p. 5). An overall effect displaying the aggregated strength of the relationship can be computed from a sample of effect sizes (for a detailed list of appropriate effect sizes, see Lipsey & Wilson, 2000 or Ellis, 2010).
This study employs MRA as outlined by Stanley and Jarrell (1989) and Stanley (2001, 2005). This procedure is a variant of meta-analysis that has been developed and applied by various scholars in economics, education, and management. For example, using MRA, economists have shown negative effects of unions on firms’ profits in the United States (Doucouliagos & Laroche, 2009). Educational researchers have calculated optimal school sizes for U.S. secondary schools (Colegrave & Giles, 2008) using this technique. Applications in the management field include works by Stanley and Jarrell (1998) and Carney and colleagues (2011). Using the MRA technique, Stanley and Jarrell (1998) have investigated the gender wage bias, identifying, among other findings, a declining trend over time. Carney and colleagues (2011) have successfully applied MRA to business group affiliations, finding that weak legal, financial, and labor market institutions positively moderate the relationship between business group affiliation and performance. When results from primary studies vary to a great extent, MRA is helpful to explain the source of such variation. As discussed previously, the TMT diversity literature is characterized by a variety of sometimes conflicting findings. Hence, MRA is the preferred methodological choice and a few advantages need to be mentioned (Doucouliagos, 2005; Stanley, 2001).
First, traditional meta-analytic procedures, which are often used in the management literature (see, e.g., the section on prior meta-analyses), do not control for the varying results found in primary studies by using a multivariate approach. Second, MRA allows testing for the existence of a genuine effect, in this case, between diversity and performance. Third, it allows controlling for additional factors that influence outcomes—for example, study or sample characteristics (Borenstein, Hedges, Higgins, & Rothstein, 2009; Doucouliagos, 2005; Stanley, 2005, 2008).
In MRA, the dependent variable is some summary statistic, for example, a t-statistic, or a regression coefficient. Such a choice of dependent variable is appropriate because all primary studies in the data set are of an explanatory nature using some form of regression analysis. Stanley and Jarrell (1989) specify a generic meta-regression model as follows:

In this model ESi is the effect size used (e.g., the reported estimate or the derived effect size from that estimate), taken from the i-th study, α reflects the true effect and X is the vector of independent variables reflecting study characteristics. Epsilon (ϵ) is the error term. The independent variables depict various study characteristics and the associated coefficient is βk. These meta-independent variables are often dummy variables displaying various study characteristics that have been included or omitted from primary studies (Stanley & Jarrell, 1989). They might also include indicators of data quality and differences in model specifications. In the case of the present analysis, dummies that reflect the origin of the data of primary studies, industry and others, are coded. They are explained in detail in the section describing data and variables. Their coefficients are meant to reflect distortions that have been introduced by characteristics of primary studies (Stanley & Jarrell, 1989).
Publication Bias and Genuine Empirical Effect
We followed the procedures as described in Stanley (2005) and Doucouliagos (2005), to analyze publication bias and the presence of a true effect. We use both funnel plots and the funnel asymmetry test (FAT; Egger, Smith, Scheider, & Minder, 1997) to investigate publication bias. A funnel plot is a graphical depiction of effect size against some measure of precision (e.g., inverse of standard error [SE] or sample size). A complete symmetrical funnel plot indicates absence of publication bias and should have the shape of an inverted funnel: wide open at the bottom because an unbiased body of literature will have many studies providing imprecise estimates, whereas only a few will be very precise and, therefore, located at the narrow funnel top.
This graphical analysis can be supported by a statistical test called the funnel asymmetry test (FAT). The FAT can be done either by regressing the reported effect on its SE or by regressing the t-value on the inverse of the SE. If the former model is estimated, that is,
The heteroscedasticity corrected version of the model provides another advantage because it can be used to identify a genuine empirical effect (precision effect test (PET), according to Stanley, 2005). The coefficient serves as a test for the presence of such a genuine empirical effect. A genuine empirical effect is indicated when β3 is significantly different from zero. Since the same equation yields the results for both tests, some refer to it as the FAT-PET (Hay, 2011; Stanley, 2005).
In most cases, primary studies report several estimations of the same relationship using different models. The researcher can decide either to use one finding or to record several findings from a single study. Whenever several findings (estimates) are taken from the same study, the issue of data-dependence arises. There are several ways to solve the dependence issue. The simplest way is to take the average of all estimates that originate from a single study to ensure an acceptable level of independence among studies. A more sophisticated remedy for data dependence is to weight the individual findings. A common procedure in meta-analysis is to weight each effect size with the inverse of its variance (Hedges, 1982; Hedges & Olkin, 1985). Larger variances reflect more imprecise findings. Doucouliagos (2005) further suggests using hierarchical models or bootstrapping procedures. Another approach is to create a subset from the full sample using only one estimate per study (see similar applications in Doucouliagos, 2005 and Doucouliagos & Paldam, 2010). We used “precision squared” as weights for individual studies and also used a one-study-one-estimate set as a robustness check when analyzing publication bias.
Data and Variables
Dependent variable
The dependent variable is the partial correlation coefficient. We calculated the partial correlation coefficients according to equation (1):
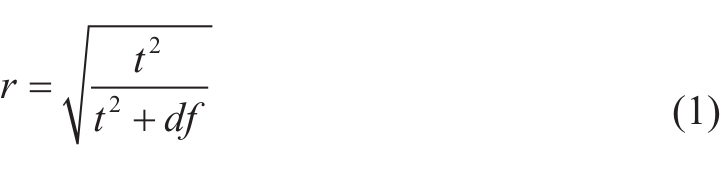
with: r = partial correlation coefficient, t = t-value, df = degrees of freedom
However, many studies do not to report the degrees of freedom (df). (In our case df were reported in less than 5% of the cases). Thus, we approximated the df with sample size which is a common procedure (Stanley, 2005).
Diversity Types
These are dummies for the different diversity types: functional diversity, educational diversity, tenure diversity and gender diversity. We coded for gender diversity to reflect observable diversity attributes but focus on underlying attributes. When we designed the study we originally included age and ethnicity as additional dimensions. However, during the course of the research, we did not find many studies explicitly using the ethnicity dimension. Therefore we decided to drop it. Similarly, whereas many studies use age as a control, only a few use age diversity as a measure. Therefore, we did not find it suitable to include it in our analyses.
Study Characteristics
First, the variable “panel” distinguishes between primary studies based on cross-sectional or panel data. Second, regional dummies for United States, EU, Asia and the rest of the world are included. Third, four industry categories are coded: IT and HighTech sectors combined, manufacturing, mixed and other. The category Other refers to studies that focus on a single industry other than IT/high tech or manufacturing only. Fourth, different dummies for firm size distinguishing between multinational companies (MNC) and small and medium sized firms (SME) as well as mixed samples are included. Since the review of the literature identified environmental uncertainty as a significant moderator of diversity effects, we record whether a primary study controlled for environmental uncertainty (1 if yes, 0 otherwise). Table 1 summarizes the coding of the variables.
Coding of Variables.
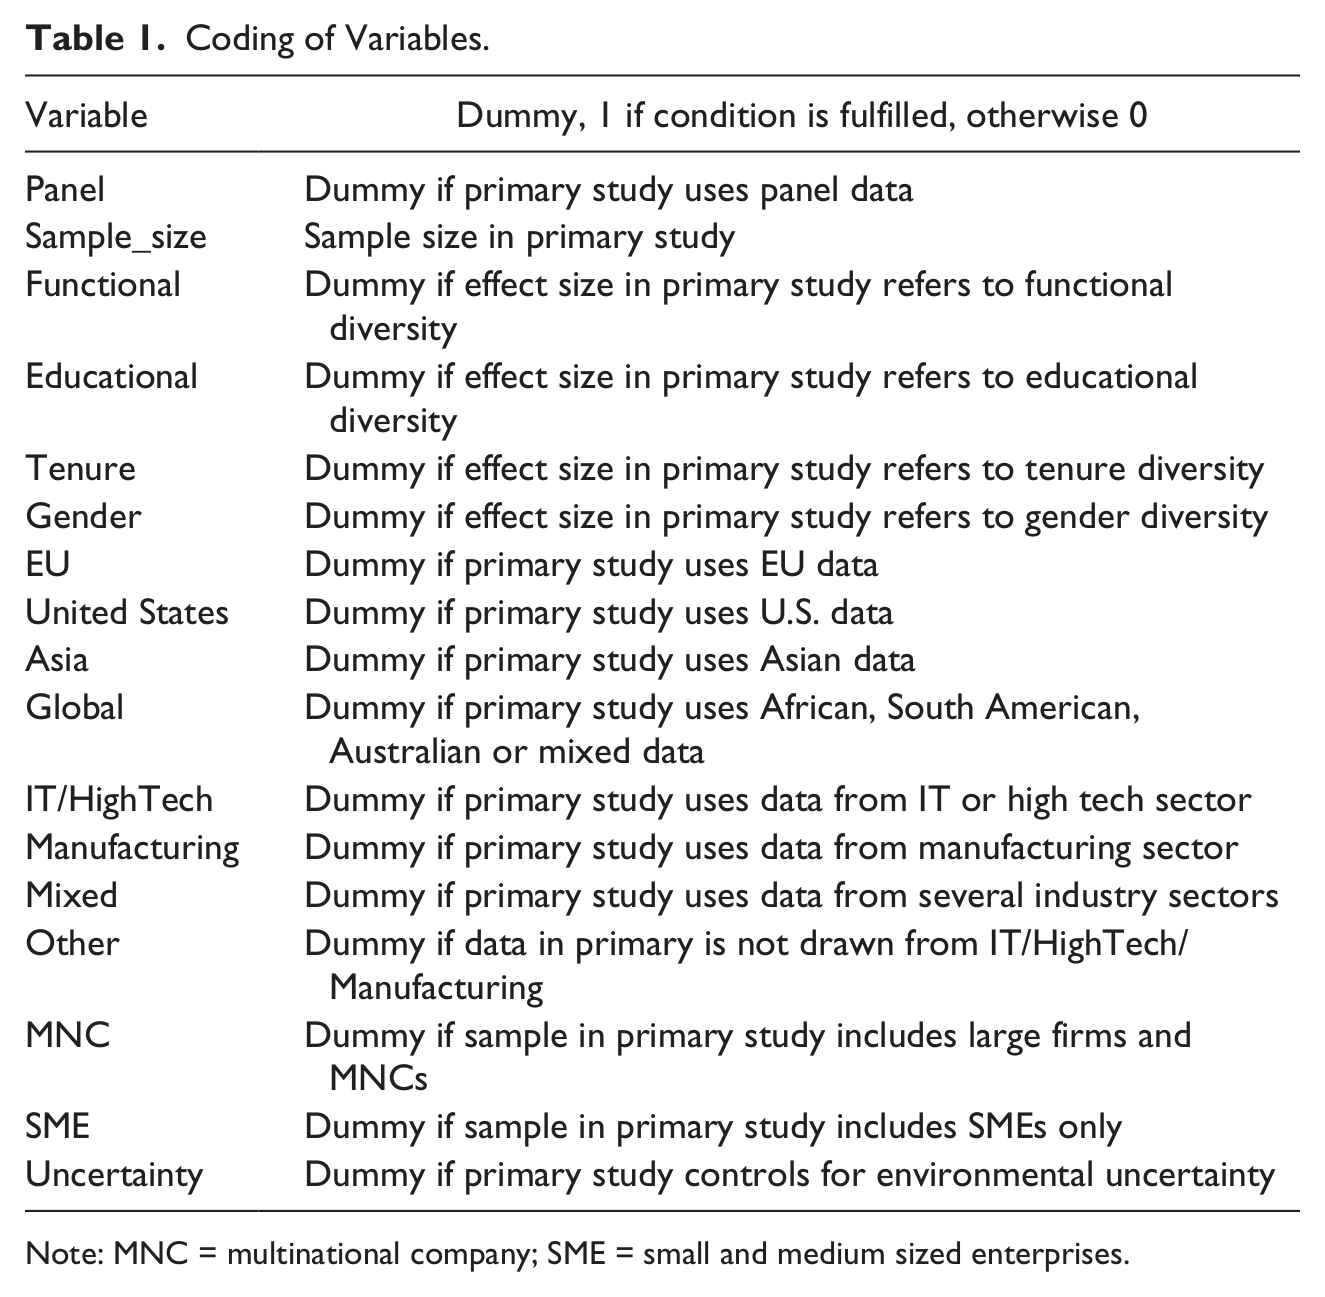
Note: MNC = multinational company; SME = small and medium sized enterprises.
Results
This section describes the results of the analyses. We begin describing the data, then present the results of the FAT-PET test, and finally show the results of the full MRA.
We recorded the year(s) in which the data used in the primary studies were collected. The oldest data set used in a primary study was from 1970, the latest was from 2007. On average, primary studies used data gathered over a period of three and a half years. The largest data set covers 24 years. The average data set used data collected from 1991 to 1996. Table 2 describes the data set in detail. U.S. studies dominate the sample and studies covering different industries are most frequent. A majority of studies provided estimates of functional diversity.
Descriptive Summary of the Full Set.
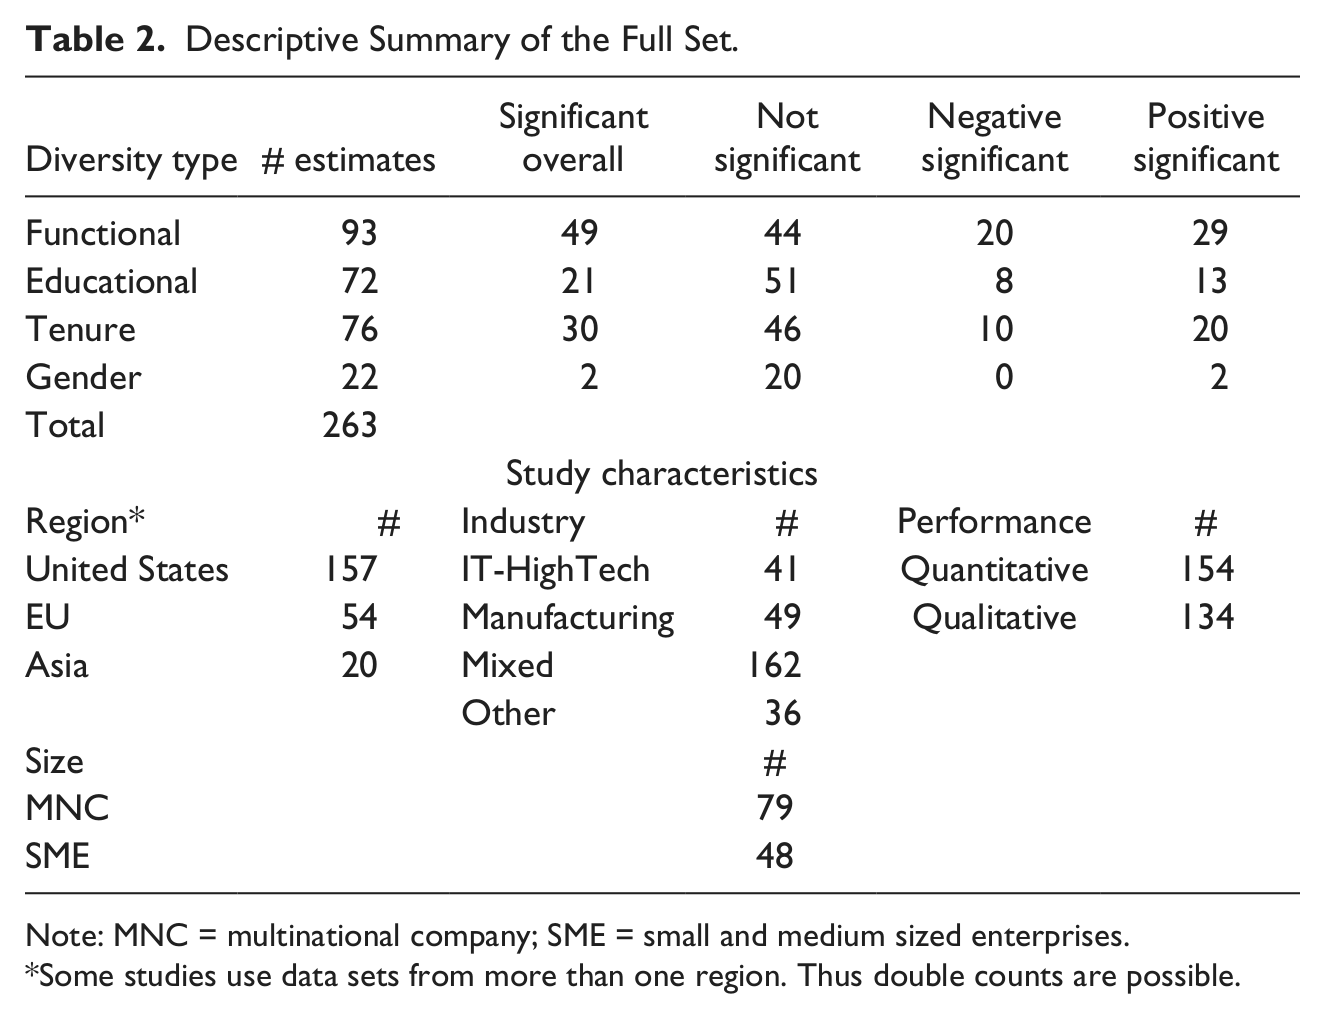
Note: MNC = multinational company; SME = small and medium sized enterprises.
Some studies use data sets from more than one region. Thus double counts are possible.
In reviewing the studies, we identified two types of performance, which we defined as quantitative and qualitative performance. Quantitative performance captures generally accepted performance measures for firms such as return on assets, return on investment, or stock market returns. Qualitative performance includes measures that try to assess the quality of decision-making processes and measures. Examples are studies measuring the comprehensiveness of the decision-making process (Papadakis & Barwise, 2002) or aspects of strategic reorientation (Gordon, Stewart, Sweo, & Luker, 2000). According to Gordon and colleagues (2000, p.914) strategic reorientation is defined as “a change in strategy coupled with changes of at least two in structure, power, and control, which must occur within 2 years.”
Based on this distinction between quantitative and qualitative outcome measures, we decided to separate the sample into three data sets, the full set, the quantitative performance set, and the qualitative performance set. The two subsets were restricted to estimates that related either to quantitative performance indicators only or to qualitative performance indicators only. The results section presents the analyses with regard to both reduced sets and the full set.
FAT-PET Results
We began by checking for publication bias in the analyzed literature using the FAT as described in the method section. With regard to the full set, the FAT-PET indicated the presence of publication bias in the diversity-performance link literature, as the constant was statistically significant (coefficient = 0.802, t-value = 7.72, p < .001). These results hold for the both the quantitative and qualitative performance subset as well (see Table 3).
Results of FAT-PET.
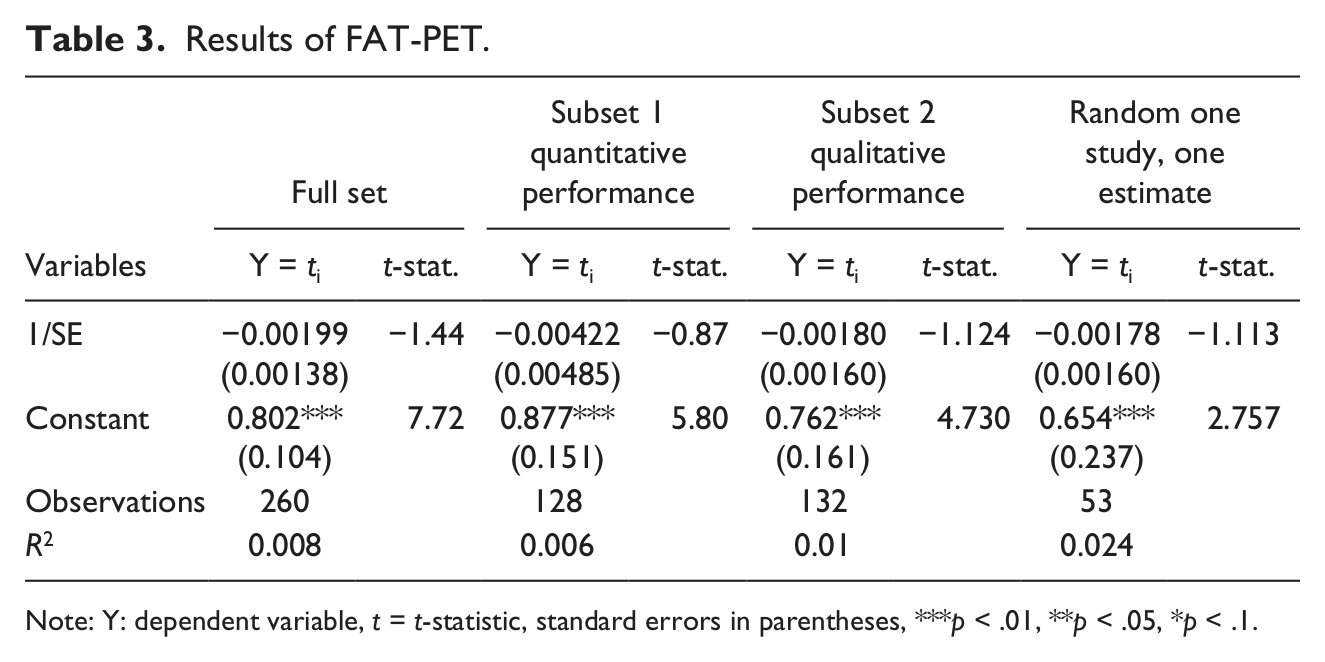
Note: Y: dependent variable, t = t-statistic, standard errors in parentheses, ***p < .01, **p < .05, *p < .1.
Further, the coefficient of the inverse of the SE (1/SE) served as an indicator of a true underlying empirical effect. Surprisingly, this coefficient was not significant (after controlling for publication bias), implying the absence of a genuine empirical effect in the diversity-performance link literature when jointly analyzing all diversity categories. The FAT-PET did not find a significant coefficient, either in the full set or in the two subsets. Before running the FAT-PET, the funnel plots were visually inspected and judged asymmetrical by both authors.
Given the number of studies that found significant effects, this seemed to be a surprising result. Thus, we decided to draw a random sample from the full set. The random sample consisted of one finding per study and, thus, was a one-study-one-estimate data set, eliminating potential biases due to data dependence. Again, only the constant exhibited significance, indicating the presence of publication bias. We concluded from the results of the FAT-PET test that there is a significant publication bias in the diversity-performance link literature and that there is no direct genuine link between diversity and performance (after controlling for publication bias).
Meta-Regression Results
The next step was to analyze the characteristics of primary studies that might affect results. For this analysis, we selected common study characteristics such as region, industry, firm size, and environmental uncertainty, as they might influence the diversity-performance link. Table 4 presents the results of three weighted-least-square regressions of partial correlation coefficients on the study characteristics. Model 1 includes the full set and Model 2 the quantitative performance set. Since diversity might have a stronger effect on strategic choices and social outcomes than on quantitative performance measures (Hambrick & Mason, 1984; Harrison et al., 1998), the next step was to analyze the impact of the diversity variables on the qualitative performance subset (Model 3).
All Sets WLS Regressions Results.
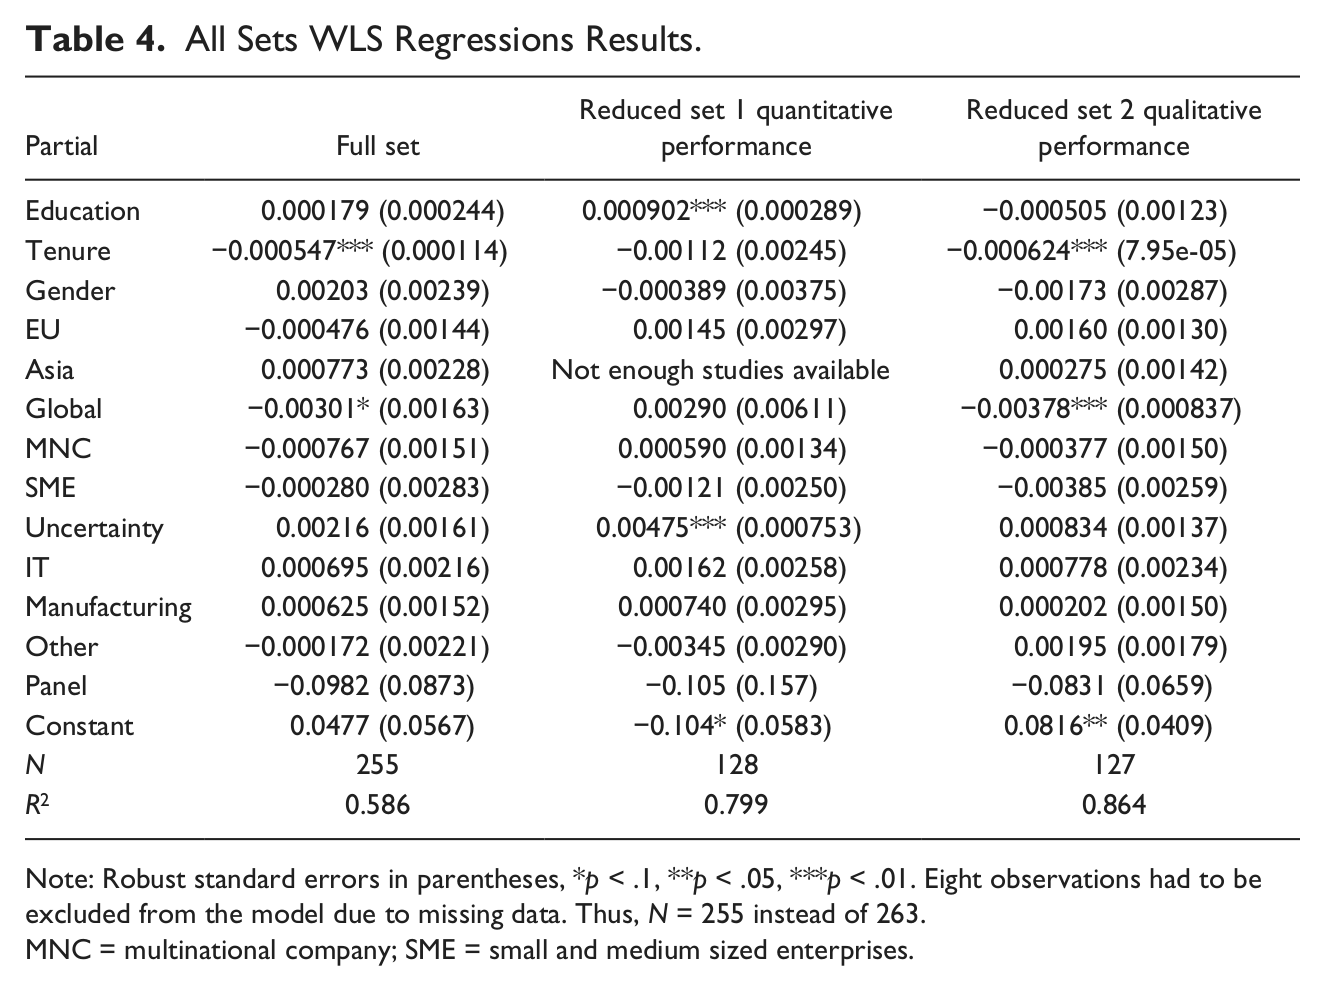
Note: Robust standard errors in parentheses, *p < .1, **p < .05, ***p < .01. Eight observations had to be excluded from the model due to missing data. Thus, N = 255 instead of 263.
MNC = multinational company; SME = small and medium sized enterprises.
The findings can be summarized as follows. First, when the analysis is based on a global data set as opposed to the common U.S. data set most often found in published studies, the coefficients shift slightly downwards (coefficient = −0.003*). Second, when the data set of a primary study controls for environmental uncertainty, the coefficients are biased upwards slightly (coefficient = 0.004***). However, this effect can be found in the quantitative performance subset set only. Finally, although educational diversity in the quantitative performance subset and tenure diversity in the full set as well as the qualitative performance set were strongly significant, the effect remained small. We interpreted this finding as supporting the absence of a true effect found in the joint funnel-asymmetry precision effect test above.
Discussion and Conclusions
This study started from the observation that there might be a diversity-performance link because it is commonly assumed that diversity in TMTs enhances TMT decision making. Such improved decision making should be reflected in corporate performance. The connected literature has provided manifold results for and against the diversity-performance link. This is well reflected in our sample of primary studies. Table 2 presents a wide variety of findings in primary studies. This condition might indicate that the results of diversity studies depend strongly on context and study design, making our choice of MRA to investigate such variation more justifiable. MRA allows summarizing such varying results.
Three major conclusions can be drawn from the results of the analyses. First and most striking, no evidence for the existence of a true underlying empirical effect is found in any of the sets. Instead the significant constant in the FAT indicates the presence of publication bias. According to these results, the existence of the diversity-performance link must be questioned. This result seems to be unexpected, given the large body of literature heralding the positive effects of diversity on corporate performance. However, it is in line with Webber and Donahue’s (2001) finding of the lack of a relationship of work group diversity with performance, and Certo and colleagues’ (2006) finding of an ambiguous relationship between TMT’s demographics and performance.
Second, the results presented in diversity studies seem to suffer from publication bias. In this context, Table 2 might be confusing, as it also displays a high number of nonsignificant findings. However, publication bias may stem from a number of sources. For example, publication bias may be driven by either preferences of referees to assess studies with significant findings more positively or a reluctance on the part of authors to submit nonsignificant results to journals. Authors might also be driven by their previous experiences which suggest that reviewers are unlikely to evaluate nonsignificant results positively. Additionally, it could be that authors do not craft papers based on seemingly unfavorable results, for example in case they do not align with a dominant paradigm, because the chance of publication is low (Rost & Ehrmann, in press).
As mentioned in the introduction, publication bias may reflect the preference of reviewers and editors for particular results (Stanley, 2008). Such preferences can relate to theoretical approaches or simply to the presentation of significant results (O’Boyle, Humphrey, Pollack, Hawver, & Story, 2011). Consequently, studies reporting so-called nonfindings or studies employing uncommon designs or theories are unlikely to be represented in the body of published studies available when publication bias is present. Banks and colleagues (2012, p. 182) more generally state that “publication bias exists to the extent that available research results are unrepresentative of all research results.” In this sense, our results indicated that there is overrepresentation of traditional approaches and that significant results are overreported in the diversity-performance link literature.
We control for two potential moderators in this study. The results show that two study characteristics, environmental uncertainty and the origin of the data set, may have an impact on the results. Environmental uncertainty has been identified as an important moderator in narrative reviews (Nielsen, 2010b). The results support this assertion, at least for the subset relating to quantitative performance. The disappearance of the significant effect of environmental uncertainty might be explained by the focus on the traditional quantitative performance measures we have introduced in the subset. Prior research has shown that these quantitative performance measures are affected in changing environments. In contrast, the qualitative performance measures might be more stable. Thus, they might mitigate the distorting effects of environmental uncertainty. Further, the origin of the data has an impact on the results. It seems that it is more difficult to detect positive effects of diversity characteristics on performance in non-U.S. samples. We can only speculate about why this is the case. It may be due to the fact that the United States has a more diverse population, whereas other countries included in this study tend to be more homogeneous.
Recent works by Aguinis, Pierce, Bosco, Dalton, and Dalton (2011) and, in particular, by Dalton, Aguinis, Dalton, Bosco, and Pierce (2011) have suggested that publication bias might be a myth. Although this idea is interesting and Dalton and colleagues (2011) provide a new way of looking at publication bias, this position must be considered in light of the large number of studies that analyze and acknowledge publication bias. To cite only a few, the works of Stanley (2005, 2008), Doucouliagos (2005), and Feld and Heckemeyer (2011) provide strong evidence for the existence of publication bias and explain various methods to detect it. Additionally, many authors consider publication bias a serious issue (Banks & McDaniel, 2011; McDaniel, Rothstein, & Whetzel, 2006). Our support for the existence of publication bias links to discussions about the quality of the paper selection and the peer review process. According to Starbuck (2005), reviewer judgments rarely agree. Others argue that reviewers more often find methodological flaws in nonmainstream papers (Lawrence, 2003; Mahoney, 1977).
Finally, our findings indicate that the diversity variables do not have a meaningful influence on the performance measures. These findings also seem plausible when compared to the results of the previous meta-analyses conducted by Certo and colleagues (2006) and Joshi, Liao, and Roh (2011), who find varying effect sizes ranging from small negative to small positive numbers. Thus, our findings have potential to stimulate further discussion on the effects of TMT diversity.
Managerial Implications
Top managers can interpret the findings of this study in meaningful and applicable ways. These results are in no way meant to provide arguments for the abolition of diversity management initiatives. The concept of diversity management has been popular among managers for many years. However, criticisms have been raised in regard to its implementation, highlighting that conditions for traditionally marginalized groups have changed only minimally (Junankar, Paul, & Yasmeen, 2004). Our results point in a similar direction, suggesting that the benefits of diversity do not occur from the simple fact of having a diverse workforce. Similarly, Syed and Özbilgin (2009, p. 2448) note that “( . . . ) organizational policies may range from a legally driven approach towards equal opportunity to a more proactive managing diversity approach consistent with the values of multiculturalism.” Diversity should be managed because diversity can be an asset in itself (Tsui, Egan, & O’Reilly, 1992).
Limitations and Future Research Directions
This work has several limitations. First, additional insight might lie in model-specification dummies which could be included in an extended analysis. Some researchers have coded the gender of authors, the author’s country of origin, or the quality of journals according to impact factors. Also, the decision to rely on published sources only is a limitation that should be reconsidered in future work.
Second, the choice of MRA as the analytical tool implies some limitations. One is the list of variables coded, because different researchers might have different rationales for selecting specific study characteristics. In this case, we made the decision for inclusion or exclusion of a variable based on the initial literature review and tried to capture the variety of study-specific characteristics in the underlying body of research.
Another limitation is the strong reliance on the data reported in primary studies that forces meta-analysts to make choices. Recent work by Aguinis, Dalton, and Bosco (2011) has highlighted the sheer number of choices meta-analysts have to make. We tried to mitigate this source of bias by explaining, in detail, the choices made and the reasoning behind them.
The limitations mentioned might simultaneously open several opportunities that yield fruitful insights, but have not been addressed by this study and also have been neglected by prior research. First, study characteristics referring to task complexity might yield additional value. A substream of the diversity-performance link literature investigates such differences in tasks. However, often these studies refer to work groups and not to TMTs. The latter are generally assumed to deal exclusively with complex tasks—a simplification that could be questioned in future studies. Second, a stronger focus on the dimension of cognitive diversity seems to be useful. The proxies for cognitive diversity that are used in this work and that have been widely employed in the literature are questionable. In depth qualitative studies of decision-making episodes that integrate TMT composition in the analysis might be more helpful than the mainstream quantitative approaches present in the TMT diversity literature. Third, on the theoretical level, our results neither reject nor support any of the theories mentioned in earlier sections of this study. Rather they seem to challenge the existing notions of all three approaches discussed (i.e., UE, similarity-attraction and information-decision-making perspectives). For example, according to similarity-attraction perspectives, diversity should have a negative impact on performance, whereas we find no effect. This result may indicate that researchers need better tests for existing theories and should strive to find better indicators for diversity variables and outcome variables. For example, the “performance” variable takes various forms in primary studies, ranging from standard measures, such as return on investment or ROE, to load factors that are used in the aviation industry. Such variety might not be captured by the theories that drive analyses. Finally, it has to be emphasized that the results of this analysis refer to TMTs only. The results should be interpreted with caution because the diversity-performance link in work groups and other teams on lower hierarchical levels was not addressed in this study.
Footnotes
Appendix—List of Journals
Academy of Management Journal, Administrative Science Quarterly, British Journal of Management, Cross Cultural Management, Group & Organization Management, International Journal of Human Resource Management, International Journal of Marketing, Journal of Business Venturing, Entrepreneurship: Theory and Practice, Journal of Financial Economics, Journal of Management, Journal of Management Inquiry, Journal of Management Studies, Journal of Organizational Behavior, Management International Review, Management Science, Nonprofit and Voluntary Sector Quarterly, Organization Science, Organization Studies, Strategic Management Journal.
Declaration of Conflicting Interests
The authors declared no potential conflicts of interest with respect to the research, authorship, and/or publication of this article.
Funding
The research was funded by the Swiss National Science Foundation, Grant No. 100018_129585.
Author Biographies