
Abstract
We analyze how
Introduction
Environmental taxes refer to charges levied on activities which are considered to be harmful to the environment. As summarized by the European Commission (Remeur, 2020): “The aim of environmental taxation, in principle, is to factor environmental damage, or negative externalities, into prices in order to steer production and consumption choices in a more eco-friendly direction.” A common example is the carbon tax: as of 2023, it has been adopted in 37 countries (Worldbank, 2023); other examples include taxes on industrial waste and water disposal, and charges levied on specific pollutants (Harrington and Morgenstern, 2004).
In this article, we investigate the extent to which the environmental taxation can incentivize the use of cleaner production technologies by heterogenous competing firms. The reason to be skeptical is that several earlier sustainable operations studies demonstrated that environmental taxes can, under some conditions, incentivize dirty technologies. First, in the general monopolistic case, Krass et al. (2013) showed that this could be driven by fixed costs. As the tax increases, the cleaner technologies become more profitable, but the increase in total costs leads to higher equilibrium prices and lower production volumes. Thus, the total additional profit may be insufficient to offset the fixed costs of cleaner technologies, leading the firm to select the dirtier technology instead. Subsequently and in more specific contexts, Sunar and Plambeck (2016) showed that in the context of border adjustment taxes the same effect could be driven by the rules allocating emissions among co-products, and Aflaki and Nettesine (2017) showed that in the context of electricity markets this effect could be driven by the intermittency of renewable energy sources.
This article extends the general-context model of Krass et al. (2013) to oligopolistic competition and shows that while environmental taxes can be an effective mechanism under many conditions, the limitations and potential for undesirable outcomes are even stronger in this context. Moreover, the negative effects are more subtle and arise from the nature of the oligopolistic competition itself; fixed costs play no role in the current article, and hence the previously proposed remedies will not work either.
We consider an industry with
Firms pay environmental tax per unit of pollutant emitted, with the tax level set exogenously by the regulator. We analyze how changes in the tax rate affect the structure of the market equilibrium (i.e., which firms participate in it), the equilibrium production quantities, market shares, profits of individual firms, as well as industry-wide measures such as the total production quantity, total industry profits and total emissions, as well as per-unit emissions (the emission intensity). We analyze these effects under two different market demand functions: iso-elastic (log-log) and linear, which cover the spectrum of effects one might observe with many other demand functions, see Section 1.2.
Key Findings and Insights
Our main findings can be summarized as follows:
Finding 1: Structure of the Equilibrium
In Section 3, we show that at any tax level,
Finding 2: Asymptotic Sensitivity Analysis
In Section 4, we analyze the case of the k-clean equilibrium—a situation where the active production set consists of
Finding 3: Local Sensitivity Analysis
In Section 4, we also analyze the impact of “local” changes in
Finding 4: Sensitivity With Respect to Environmental Efficiency
In Section 5, we analyze the impact of varying the environmental efficiency of one of the firms while holding
Our work generates four insights, linked to the technical conditions for when the effects arise:
Insight 1: Environmental Taxation Erodes the Benefits of operational Efficiency [Theorems I.4 and L.4, Corollary I.2, and Examples 2 and 4]
Firms that are both operationally and environmentally efficient may see their profits and market shares decreased when environmental taxes are increased. This is because taxes erode benefits of operational efficiency—which is particularly important for the operations scholars to emphasize.
Insight 2: Industry Profits and PUEs May Increase With Tax [Theorems I.6 and L.6 and Examples 3 and 5]
The fact that industry profits may increase confirms prior findings from Anand and Giraud-Carrier (2020) and Fu et al. (2023) and extends them to oligopolistic competition case with full heterogeneity and non-linear demands, where this effect emerges over much wider regions. The potential increase in PUEs is a new insight, which is particularly troubling. By increasing costs, environmental taxes naturally increase prices and thus reduce production. The hope, however, is that due to market share gains of environmentally cleaner firms the resultant emissions decline even more. We show that this is not always the case.
Insight 3: Per Unit and Total Emissions May Increase as Technologies Become Greener [see Section 5]
This new insight is also troubling. The effect stems from the fact that when one firm’s technology becomes greener, its own emissions intensity decreases, but the total production increases, which can offset the emissions reduction at the focal firm.
Insight 4: How the Industry Responds to Tax May Qualitatively Differ Depending on the Demand Function Used [Examples 2 and 4; the ConditionsUnder Which Different Forms of the Demand Function May Arise Are Discussed in the Last Paragraph of Section 1.2]
This is another new and important insight for sustainable operations. Very few papers consider alternative demand models; we show that such analysis is crucial.
Literature Review
While the literature on various regulatory aspects of sustainable operations, including e-waste regulation, disclosures, eco-labels, and so on, is quite extensive, there are only a few studies that focus on environmental taxation, see recent reviews by Atasu et al. (2020) and Sunar and Swaminathan (2022). Moreover, these studies often make restrictive assumptions, such as that the industry consists of
Anand and Giraud-Carrier (2020) and Fu et al. (2023) are the two papers that are closest to ours and merit a more detailed discussion. The former considers the impact of cap-and-trade and emissions tax on the competitive industry with
Fu et al. (2023) considered the production quantity decisions in response to an environmental tax in an industry with
Also relevant to our work are the economics studies on the impact of regulation on green technology adoption. They utilize a different set of assumptions: both the “classical” (Carlsson, 2000; Katsoulacos and Xepapadeas, 1995; Levi and Nault, 2004; Requate, 2006) and the recent papers, for example, (Bian et al., 2020; Buccella et al., 2021), typically assume that the quantities of interest, such as demands, emissions, production, and abatement costs, are represented by continuous twice-differentiable functions that jointly possess a set of desirable properties. This approach is convenient for subsequent derivations, but misses important operational details, such as that in practice managers rarely deal with a continuous “abatement functions”; rather, they are faced with distinct technological alternatives that exhibit full heterogeneity. For this reason, most of the effects listed in Section 1.1 are invisible within the frameworks adopted in this literature.
Lastly, to the best of our knowledge (Cohen et al., 2016) is the only other paper in sustainable operations literature to investigate the impact of the form of market demand function—a key aspect of our paper. Three arguments support our focus on the iso-elastic (log-log) and linear forms. First, both functions are very popular in the management science literature. The linear demand function is ubiquitous in analytical investigations due to its simple algebraic form; the iso-elastic function is more popular in empirical studies, because the demand elasticity can be directly estimated by running a log-log regression. These two functional forms are used in six out of nine studies mentioned by Cohen et al. (2021) and in the meta-analyses of hundreds of studies referenced in Table 6.3 of Bodea and Ferguson (2014). Second, Cohen et al. (2021) showed that for many commonly used demand functions (including quadratic, monomial, and semi-log) optimizing the price under the appropriately selected linear demand incurs a very small profit loss. In contrast, approximating an iso-elastic demand curve with a linear one leads to unbounded profit losses. Therefore, by considering the linear and iso-elastic forms, we effectively cover the spectrum of effects one might observe with many other functions. Third, the linear and iso-elastic demand functions are based on profoundly different assumptions about the underlying consumer preferences: the former corresponds to a uniform distribution of consumers’ willingness to pay (WTP) over some bounded interval of prices
We note that in the current article, we treat technology choices as given and study the production decisions of competing firms; a situation where firms simultaneously choose technologies and production quantities presents a rather different set of technical challenges.
The Model
We consider
When firm
We consider Cournot competition with the equilibrium market price
The profit of firm

For
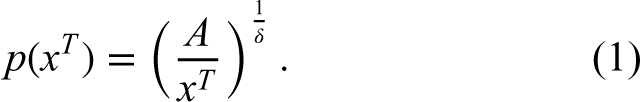
Equilibrium for Iso-Elastic Demand
For a fixed tax level The vector For For
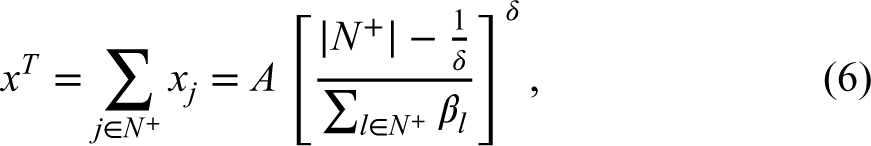
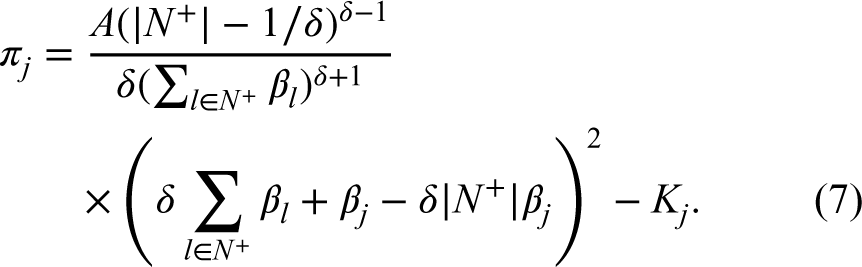
The first summand in the RHS of (7), which equals
It is intuitive that for a given
For a fixed
That
Importantly, the tax level
There exist a discrete set
At a first glance, the preceding result may seem obvious as the variable costs
Structure of the Equilibrium in the Iso-Elastic Demand Case. Consider Critical taxation levels and the structure of the equilibrium in the iso-elastic demand case.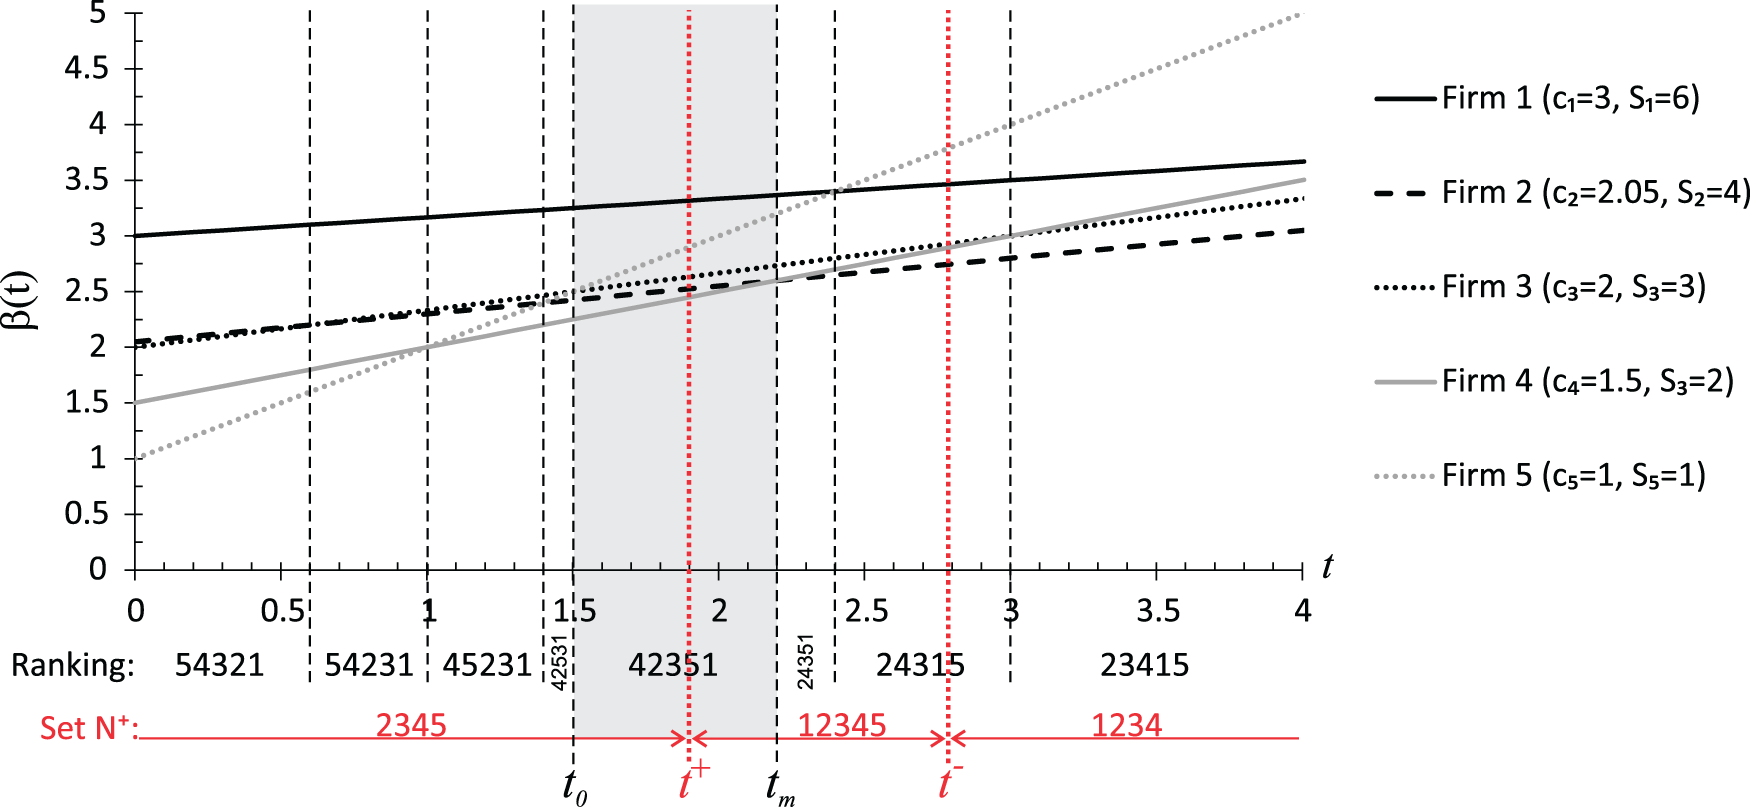
Consider some
We now illustrate how to compute the set
To these we must add breakpoints at which
Proceeding iteratively, we find that firm
To finish this section, we explore an important special case of N-positive equilibrium—a situation where all firms are active (
The N-positive equilibrium
This corollary links the existence of the N-positive equilibrium with the total variable costs all falling within a “band” around some
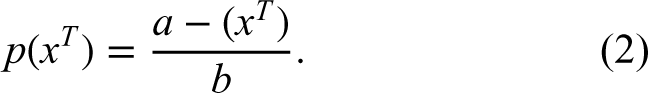
In this section, we extend the results of the previous section to the linear demand function (2).
With sets The vector For For
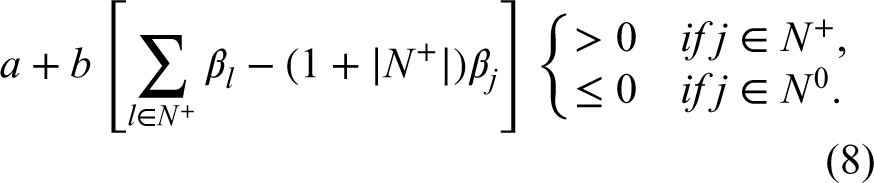
For a fixed
Both previous results are very similar to their iso-elastic counterparts, with the exception of the last clause in Theorem L.2, which indicates that the positive production set is empty for sufficiently large
Theorem I.3 holds for the linear demand: there exists a discrete set
As in the iso-elastic case,
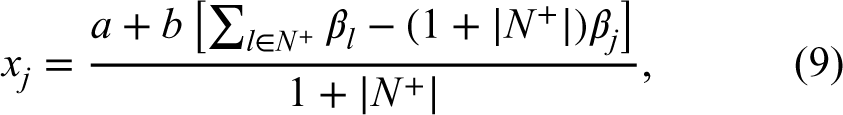
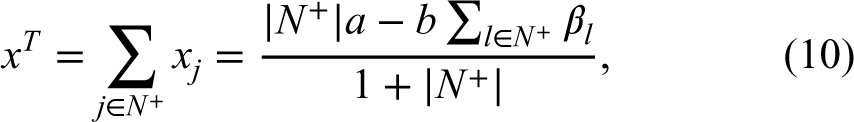
The positive equilibrium
The key difference between this result and its iso-elastic counterpart is the expression for the upper bound on
In this section, we examine how the composition of the equilibrium, as well as equilibrium market shares, profits, and emissions, change in response to changes in
Asymptotic Impact of
in the Iso-Elastic Demand Case
A natural question stemming from Theorems I.2 and I.3 is whether it is possible, by selecting a sufficiently high tax rate, to ensure that
For
Order firms by non-increasing values of
This result implies that a
While Theorem I.4 established only the structure of the asymptotic positive production set, it also has implications for other measures of interest, such as market shares, profits, and emissions.
Assume firms are ordered by non-increasing The market shares converge to The profit The PUEs converge to
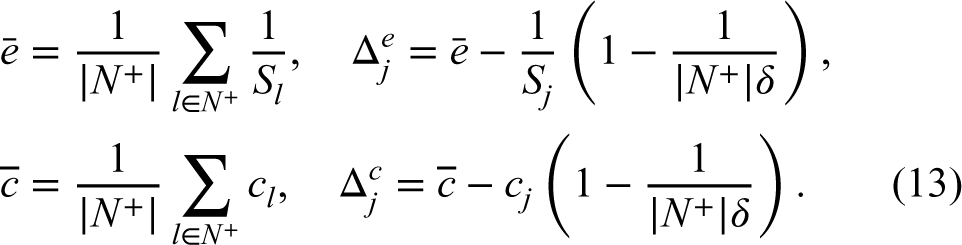
Thus, similar to the composition of the asymptotic positive production set, the asymptotic market shares and PUEs are fully determined by firms’ environmental technologies, particularly by the relationship between each firm’s adjusted environmental impact
Asymptotic Behavior With Iso-Elastic Demand. Continuing with the setting of Example 1, for
We can also compute the tax threshold
We also note that in both cases above, the value of
The results of Corollary I.2 are illustrated in Figure 2. Panel (a) shows that firm 1, which possesses the cleanest technology, benefits from increasing Market shares, profits, and emissions as a function of 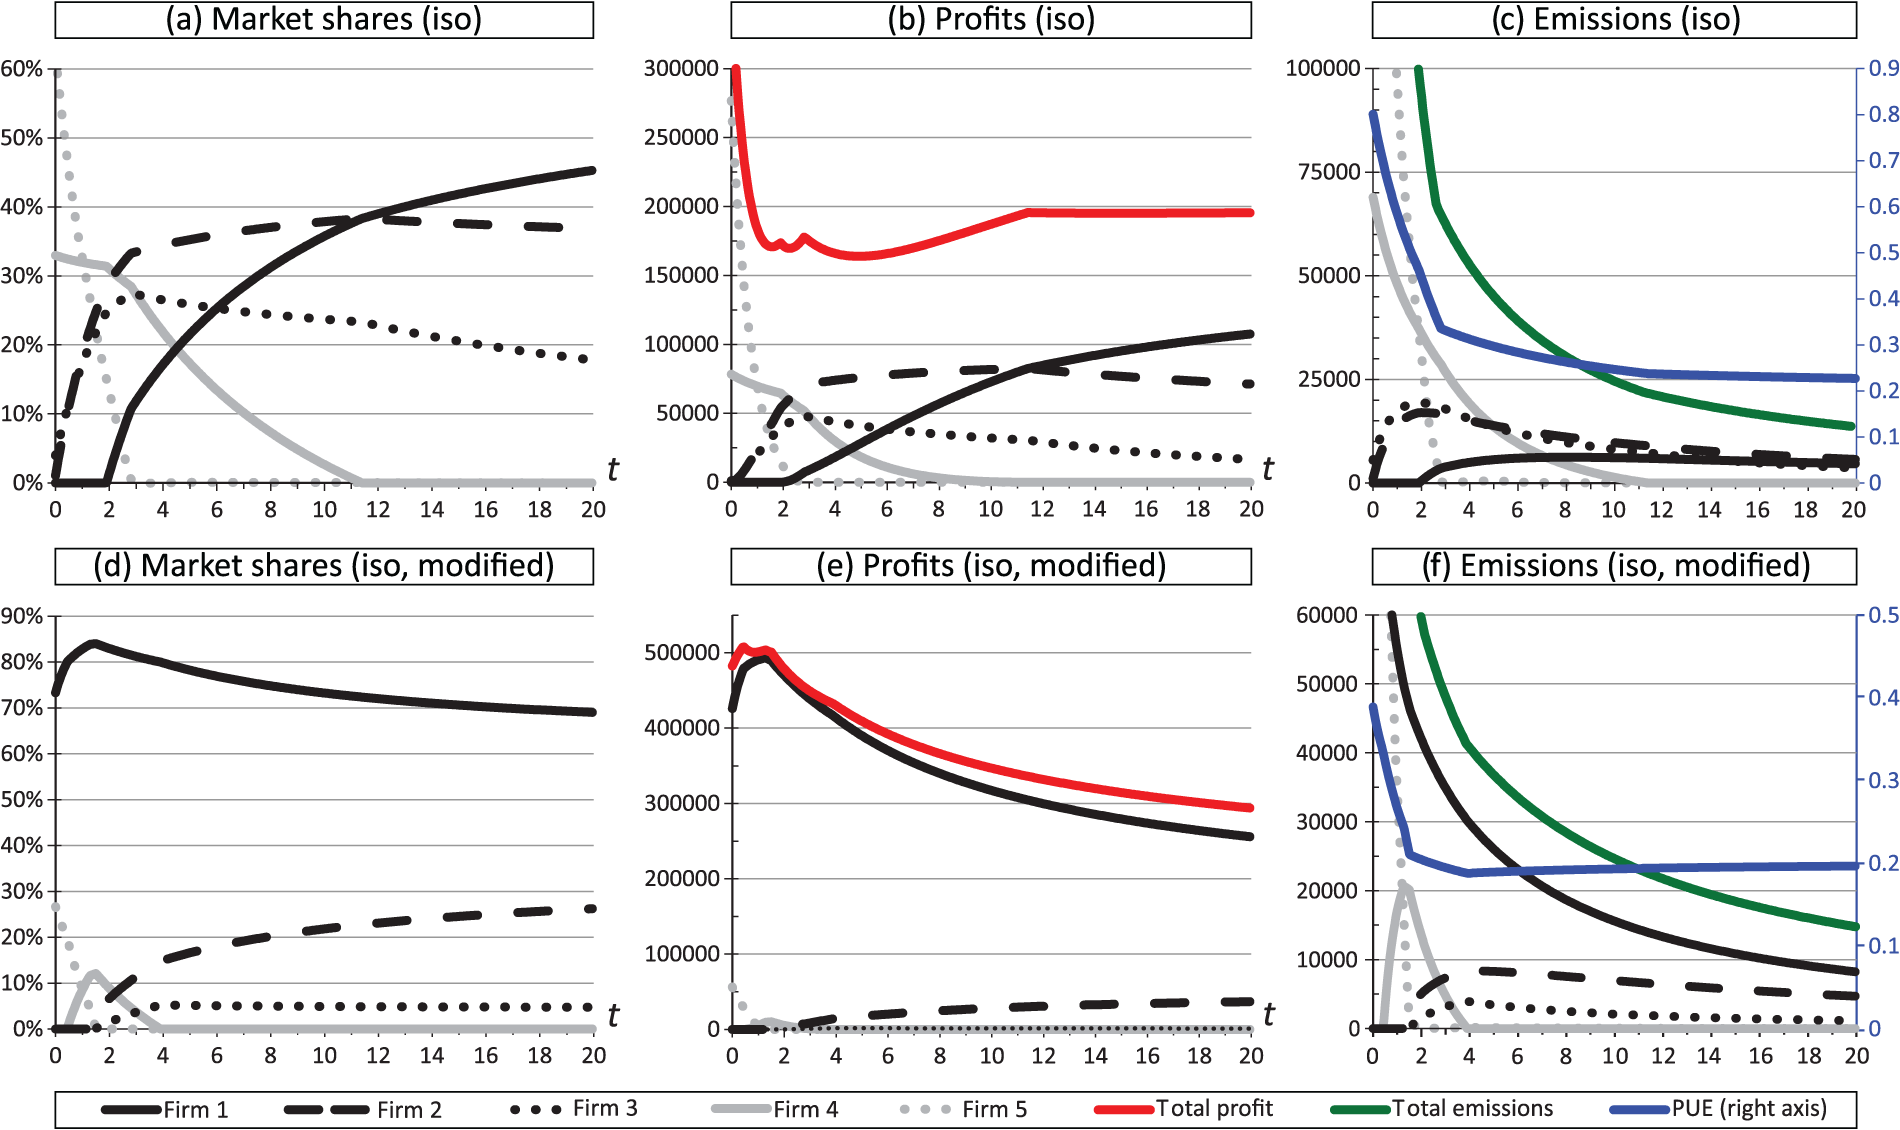
The previous discussion shows that the three-dimensional impact of the tax level (reduction in production quantities, increase in prices, and reallocation of production from dirtier to cleaner firms) can result in a situation where high tax rates are providing benefits to firm(s) operating the cleanest technologies. On the other hand, the limitations of the taxation mechanism are also evident: from the failure to exclude firms with inefficient technology from the positive production set, to PUEs being far above the level of the best available technology.
However, as suggested in Corollary I.2, increasing
The results for this modified setting, depicted in panels (d) to (f) of Figure 2, are quite dramatic. Panel (d) shows that as
From Theorem I.3, we know that for any
Here set
Consider firm If If
The intuition behind case (i) is clear: here firm
Next, we analyze the impact of the tax rate on the market shares and emissions of firms in
For firm The market share The per-unit emissions
Focusing first on part (i), note that in order for a firm to gain market share as a result of an increase in
Turning our attention to part (ii) of Theorem I.6, we can interpret the numerator on the right-hand side of the inequality as the operational cost weighted by the environmental efficiency: this term is large when larger
Local Impact of
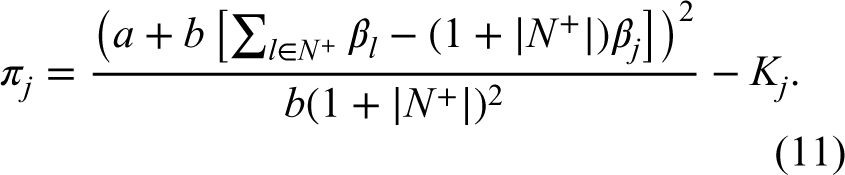
The profit of each firm as a function of
Turning our attention to market shares, we compute the ratios in part (i) of Theorem I.6:
Finally, we compute the condition of part (ii) in Theorem I.6: the left-hand side is
From Theorem L.2, we already know that in the linear demand case the positive production set is empty for
As in Definition 1, we order firms by environmental efficiency (non-increasing order for
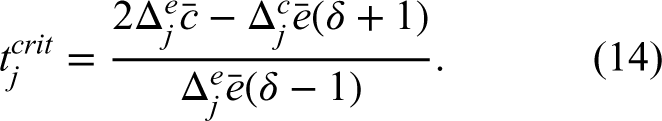
Before stating the result we define the following quantities that are closely related to their counterparts for the iso-elastic case defined in equation (13). For
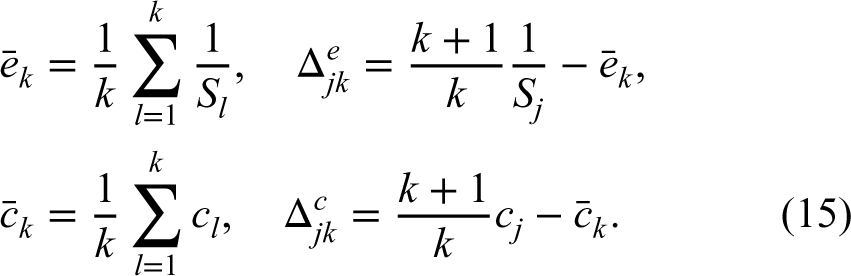
As before,
Assume firms are ordered by non-increasing order of
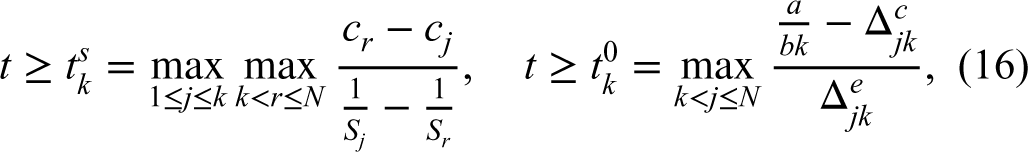
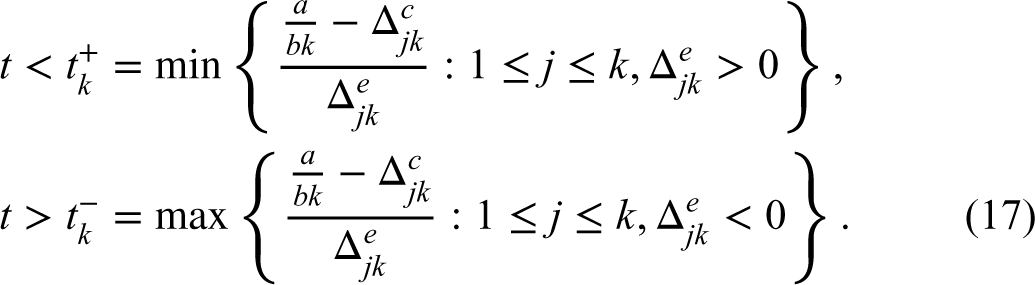
The conditions above come directly from the equilibrium existence conditions of Theorems L.1 and L.2. Indeed, for a
While (16) always imposes lower bounds on
Theorem L.4 has several important implications. One immediate consequence is that if firms
Asymptotic Effect of
We next compute
However, the situation where any
To summarize, we obtained several insights about the asymptotic behavior of the equilibrium with linear demand. First, provided the firms are sufficiently well-separated either with respect to the environmental efficiencies or with respect to the variable costs (or both), the regulator has full control over the number of firms,
In parallel to Section 4.2, we next analyze the local impact of environmental tax in the case with linear demand, that is, where
Recall that
Consider firm
This result is quite intuitive: firms that are relatively environmentally inefficient, that is, with
For firm The market share The per-unit emissions
The impact of environmental efficiency on market share (part (i) above) is similar to the iso-elastic case: a cleaner firm (with higher
Overall, the impact of local tax increases are much more intuitive in the linear case: the best firms (with low
Local Effect of Linear demand Example 5: profits, market shares, and emissions as a function of 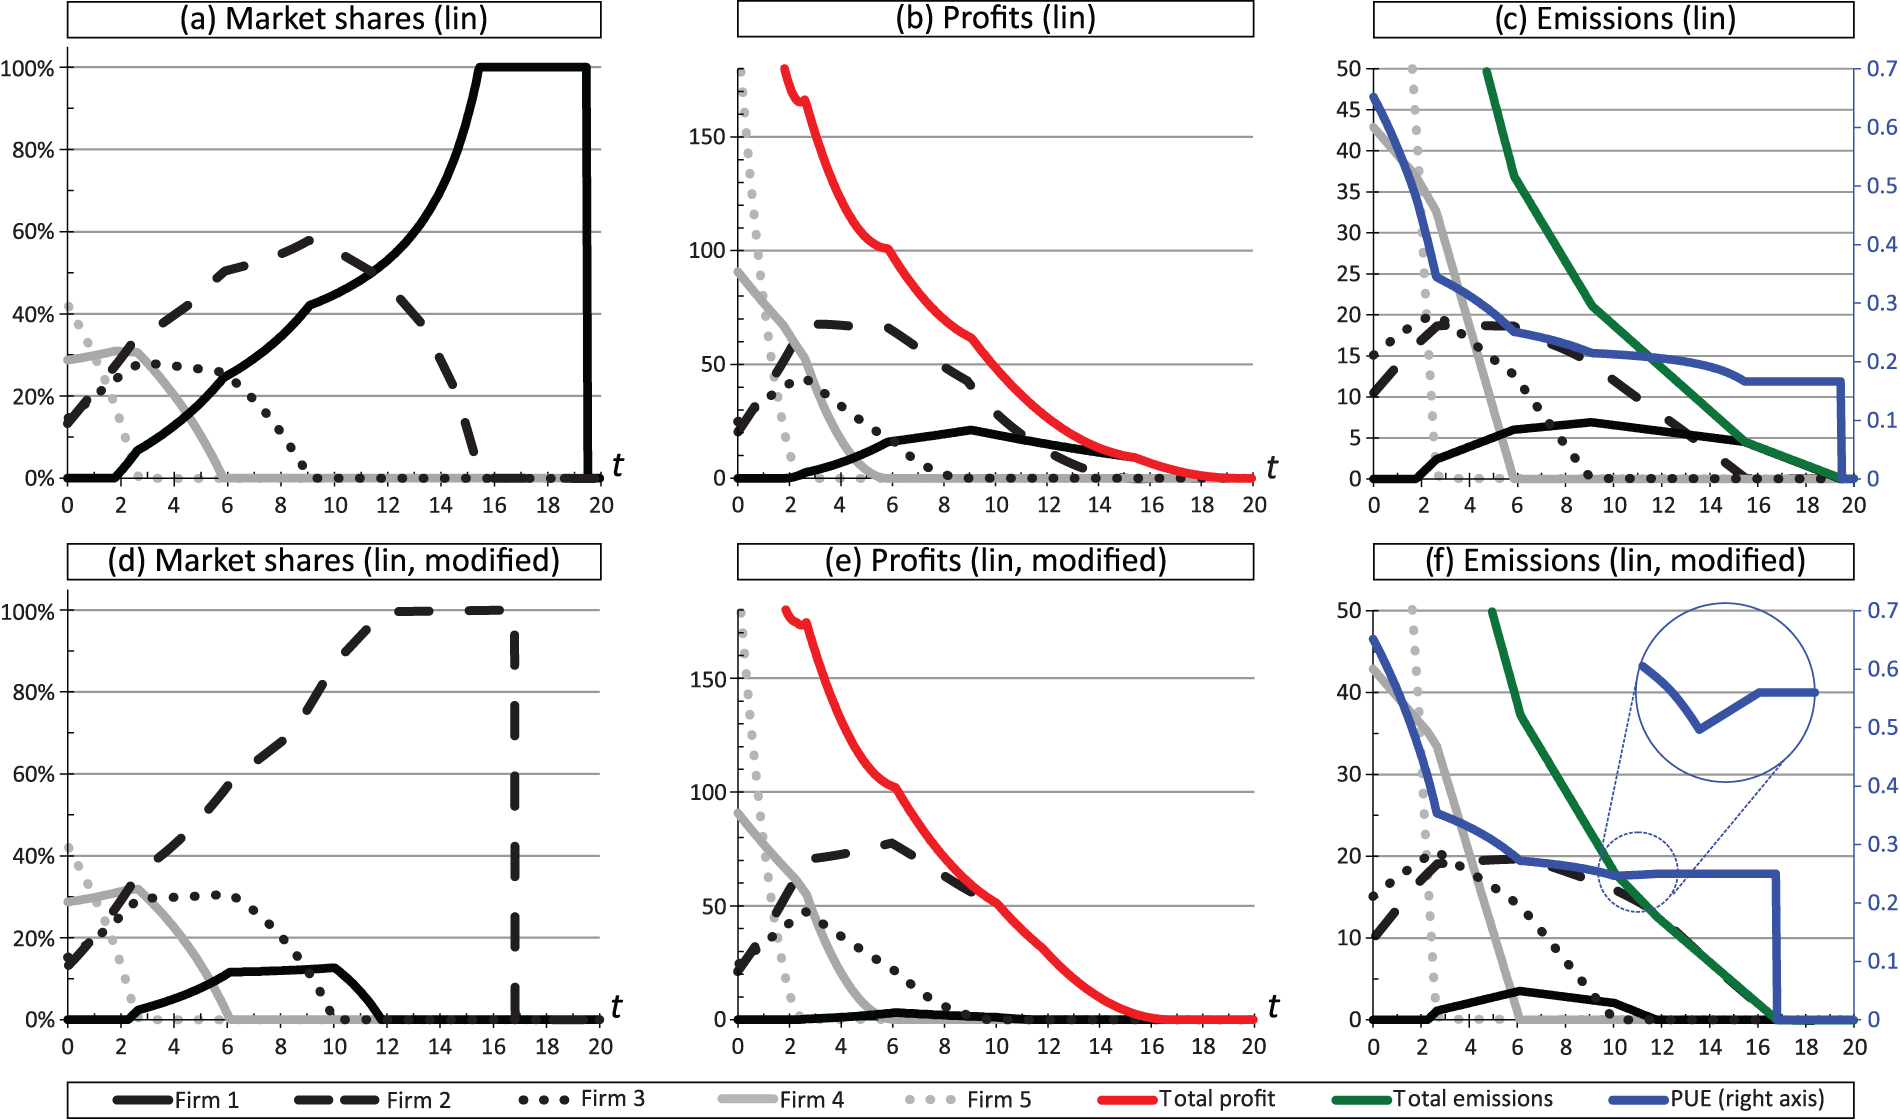
Next, comparing the market shares in panels (a) and (d), we observe that at each
Finally, comparing the emissions plots on panels (c) and (f) we note that while total emissions
In this section, we study the impact of the technological environmental efficiency parameter, Region Region Region Impact of increase in environmental efficiency These regions are represented by the three shades of gray in Figure 4. Note, for the iso-elastic case in panels (a) to (c), The conditions for regions
 (non-competitive) occurs for
  (competitive) occurs when
  (monopolistic), occurs when
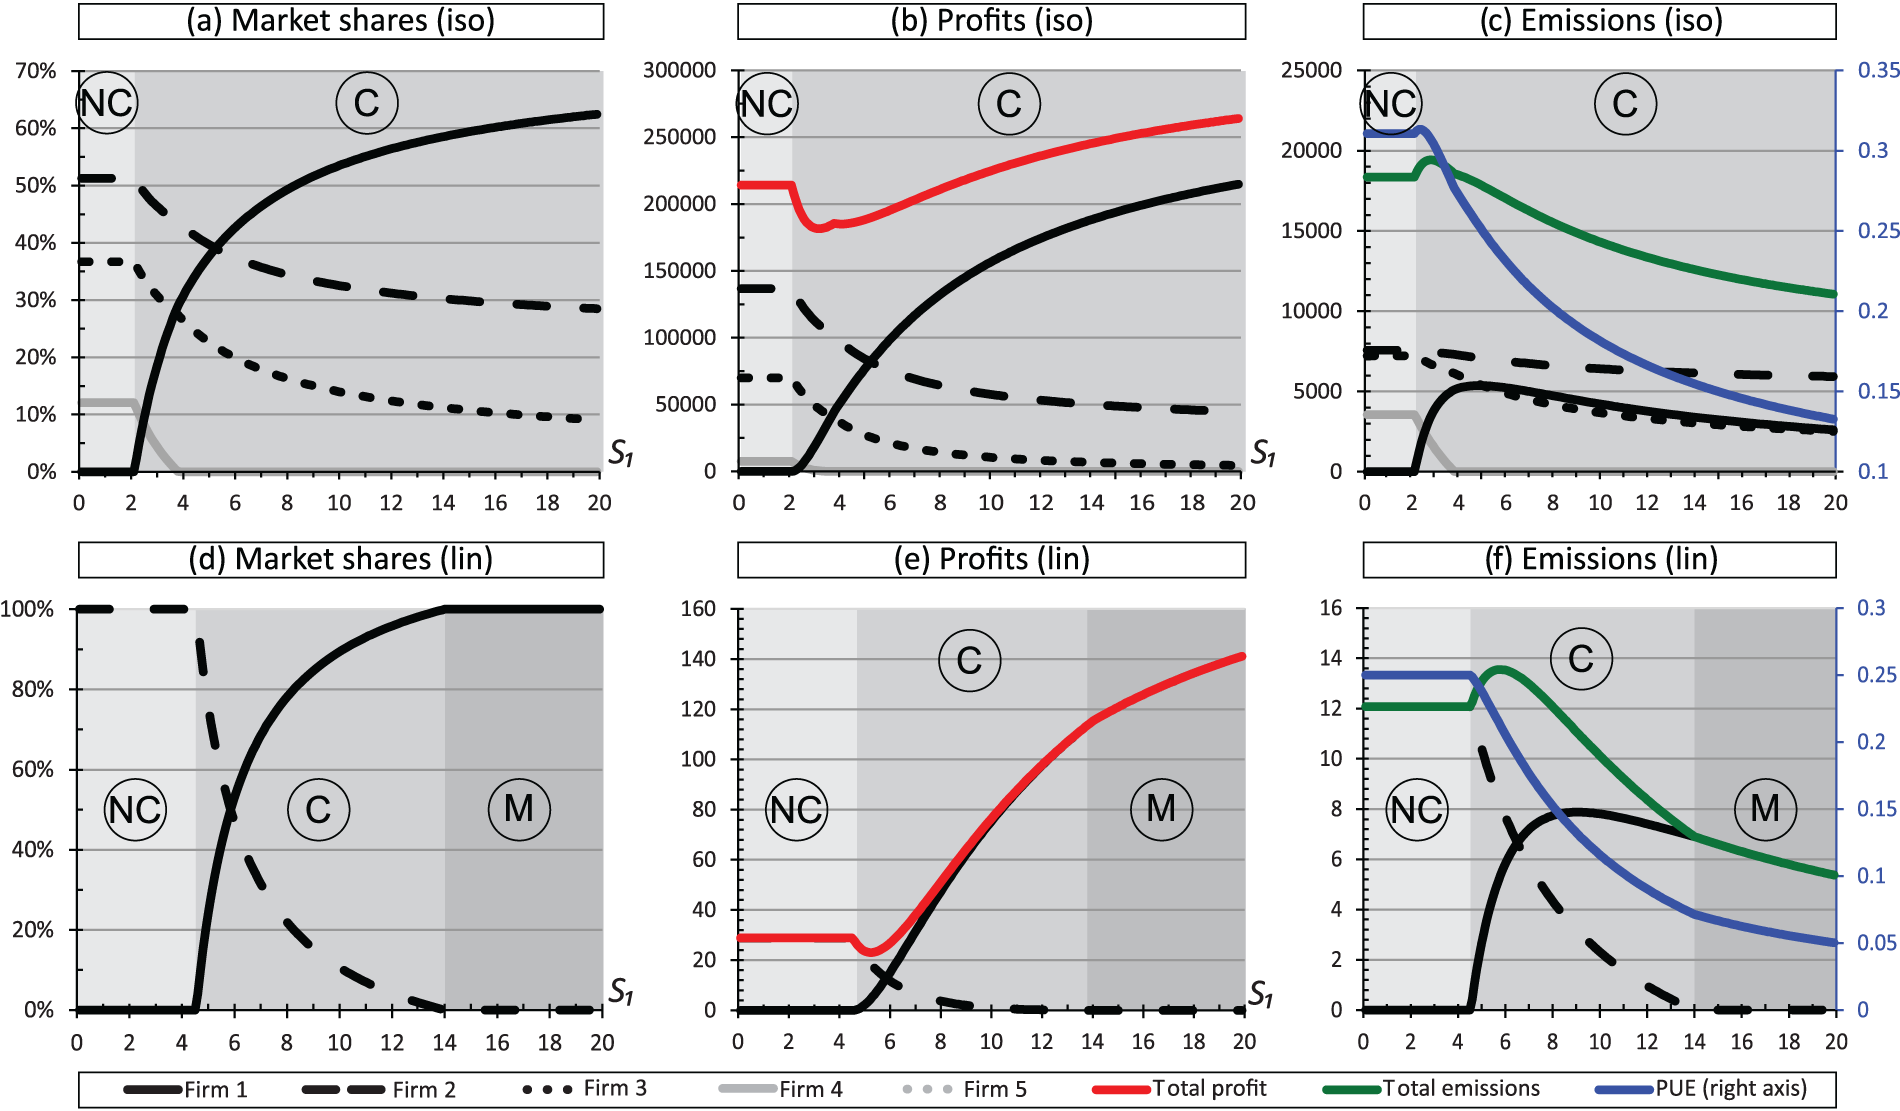
 does not exist.
 and
and  to exist are
  and
and  to exist, the base-line cost of firm
  the profit
  , while the market share is always decreasing with
  , the behavior in region
  is more complex. Both per-unit and total emissions may initially increase with
We study how an industry consisting of fully heterogenous firms responds to environmental taxes under linear and iso-elastic demands. Our results and insights are summarized in Section 1.1. Below we discuss potential extensions and future work.
As noted earlier, we assumed that firms come endowed with technologies and study their “market,” that is, production quantity, response. A situation where firms simultaneously select their technologies and production levels is analyzed in the companion working paper. We believe that both settings are of practical importance: while technology selections do occur, they are rare; much of the response to environmental taxation is likely to be of market type studied here. Both market and technological responses provide incentives to develop greener technologies, for example, see Wang et al. (2020), and it would be of interest to extend our fully heterogeneous competition model to study such incentives. Broadly, welfare implications of both the market-only response considered in this article, and a more general technology and market response to environmental taxation in a fully heterogeneous competitive industry, are interesting directions for future research.
Second, we consider the setting where each firm produces a single product using a single technology. In practice, firms sometimes operate portfolios of technologies (e.g., use different technologies at different production plants) and produce portfolios of products. Kök et al. (2016) considered multiple firms in the context of investing in a portfolio of technologies, and the portfolio approach is also adopted by Drake et al. (2016) and Wang et al. (2013). Considering competition between portfolios would be of interest.
Third, while we considered asymmetries between firms, other asymmetries could be important as well. For example, regulation may be asymmetric; think of domestic and foreign firms as in Drake (2018), Huang et al. (2021), and Sunar and Plambeck (2016). Likewise, industries may be asymmetric; for example, better technologies may exist to decarbonize the production of steel than cement. Such asymmetries could lead to non-trivial substitutions within supply chains (e.g., see Wang et al., 2022), and studying how they would interact with environmental taxation is also an interesting avenue for future research.
Supplemental Material
sj-pdf-1-pao-10.1177_10591478251331345 - Supplemental material for Competitive Industry’s Response to Environmental Taxation
Supplemental material, sj-pdf-1-pao-10.1177_10591478251331345 for Competitive Industry’s Response to Environmental Taxation by Dmitry Krass and Anton Ovchinnikov in Production and Operations Management
Footnotes
Declaration of Conflicting Interests
The author(s) declared no potential conflicts of interest with respect to the research, authorship, and/or publication of this article.
Funding
The author(s) disclosed receipt of the following financial support for the research, authorship, and/or publication of this article: This article draws on research supported by the Natural Sciences and Engineering Research Council of Canada (NSERC) Discovery Grant and Sydney Cooper Business and Technology Chair funds held by Dmitry Krass, and by the Social Sciences and Humanities Research Council of Canada (SSHRC), grant # 435-2023-0466, held by Anton Ovchinnikov.
How to cite this article
Krass D and Ovchinnikov A (2025) Competitive Industry’s Response to Environmental Taxation. Production and Operations Management 34(10): 3214–3229.
References
Supplementary Material
Please find the following supplemental material available below.
For Open Access articles published under a Creative Commons License, all supplemental material carries the same license as the article it is associated with.
For non-Open Access articles published, all supplemental material carries a non-exclusive license, and permission requests for re-use of supplemental material or any part of supplemental material shall be sent directly to the copyright owner as specified in the copyright notice associated with the article.