
Abstract
Prior to the Internet, many industries catering to mass audiences, particularly entertainment industries, tended to have very skewed sales distributions with most sales volume accruing to a small share of products (titles) generally known by terms such as “blockbusters.” The long tail hypothesis claims that increased Internet usage will weaken the dominance of blockbusters in these industries, so that the large number of obscure products, in aggregate, will become an important, perhaps primary, portion of the market. Such a change would have significant implications for firms’ operations. We test this hypothesis for the book industry with two analyses. First, using unusually rich data on book sales, we examine the temporal share of sales taken by niche titles as Internet retailing grew from obscurity to ubiquity. Changes in the distribution of sales by title popularity are weakly consistent with the direction of the hypothesis but not with the magnitude. Second, we exploit the 2011 bankruptcy of the Borders bookstore chain, and the resulting sudden shutdown of all its physical stores as a natural experiment. This analysis also finds a shift in sales away from the most successful titles. But the major beneficiaries are not the most obscure titles but instead titles that would regularly be found in most bookstores. Both analyses support a version of the long tail where the share of obscure titles changes from one very small value to a somewhat greater but still very small value. These results are inconsistent with proposed radical changes in management practices to accommodate a presumed large increase in product variety.
1 Introduction
The phrase “long tail” came into general prominence owing to Anderson (2006), who wrote his best-selling and academically influential book while corresponding with the authors of related academic work, particularly, Brynjolfsson et al. (2003). The long tail hypothesis states that increased online retailing would lead to a sizable shift in purchases away from the traditional “hits” toward slow-selling but plentiful niche products in the tail. The hypothesis claims that sales of these niche products would collectively move from having a relatively unimportant market share to a relatively important share, perhaps even becoming the primary drivers of revenue in some industries. This increased share of obscure products has been taken to imply large disruptions in markets operations, for example, from the impact of product variety on distribution systems and sales performance (Baldauf et al., 2024; Bi et al., 2023; Rabinovich et al., 2011; Rajagopalan and Xia, 2012; Ramdas, 2003; Wan et al., 2012).
When the long tail hypothesis was introduced, the purchase and distribution of consumer products via the Internet was in its infancy and largely dominated by entertainment products. At that time, retailing of these goods was primarily conducted by offline firms with in-store inventories limited by the store sizes. Although producers of entertainment goods owned vast libraries of old products (titles), most of their revenue was generated by a small number of new titles described as “best-sellers,” “blockbusters,” and “hits,” among a larger number of less successful new titles. Because online retailing was associated with expanded inventories, advanced search features, tailor-made product recommendations, and ubiquitous customer reviews, all of which were generally thought likely to skew choices away from the hits and toward more obscure niche content, the replacement of offline retailing by online retailing was expected to increase sales of a very large number of obscure titles—or “selling less of more” as Anderson (2006) phrased it.
Internet retailing has become almost ubiquitous in the US and other industrialized countries for at least a decade, which enables assessing the extent to which the predictions of the long tail hypothesis have proven true and evaluating whether the managerial advice based on the predicted large market transformations is justified. Fortunately, we have data particularly well-suited for this purpose—namely, virtually complete data on the book industry in the years when the e-commerce grew most rapidly. Books were the first consumer product to be marketed online by Amazon, and the focal industry that Anderson (2006) and then Brynjolfsson et al. (2003) examined. We use these data to examine whether the cumulative sales of obscure titles grew over a 13-year period of intense expansion in online retailing of books. Next, we examine the 2011 bankruptcy of the Borders bookstore chain as a natural experiment, exploiting how the shuttering of the business caused a shift toward the online channel for the chain's former customers. In both cases, we find, perhaps surprisingly, only a very small movement of sales from the head toward the back of the distribution, rather than the sizable long tail previously envisioned.
As we will elaborate in the next section, the development of a long tail, or its failure, could have major implications for product assortment decisions, for demand planning, for the manufacturing processes required to produce a greater number of products, for the supply chain management of the greater variety, and for the design and calibration of recommendation systems and product review platforms when demand is more disperse. How these operations management implications would need to be addressed depends on the size of the long tail. Based on our results for books, long tail effects are much smaller than previously suggested. Consequently, an evidence-based approach indicates that caution, if not outright rejection, is the policy that should be adopted rather than accepting dramatic long tail predictions.
2 The Long Tail Hypothesis
After the turn of the 21st century, Internet retailers such as Amazon were gobbling up market share from brick-and-mortar retailers in numerous industries, particularly in the market that Amazon entered first, physical books. This transformation from offline to online retailing was expected to alter many traditional purchasing patterns, and the long tail hypothesis was one of the most influential factors underlying this expectation.
The long tail hypothesis predicted that the collective share of the obscure niche products would increase dramatically as online sales replaced offline sales. The greater selection of products available online relative to the products available from offline retailers would presumably benefit obscure products more than top sellers. Moreover, the long tail hypothesis suggested a shift that would be large enough to fundamentally alter retailers’ business models. The hypothesis was usually stated in terms of a much larger portion of sales, perhaps the majority, would come from obscure products after the Internet gained a foothold in the economy. This outcome is clearly described by Brynjolfsson et al. (2011): “Anderson (2004) coined a term—‘the long tail’—to describe the phenomenon that niche products can grow to become a large share of total sales.” Nevertheless, while the sales of these niche products were expected to grow, they were not expected to become hits. As Anderson (2006) states, “[a]ll those niches add up. Although none sell in huge numbers, there are so many niche products that collectively they can comprise a market rivaling the hits.”
The emergence of the digital economy has affected consumers, retailers, and producers, causing large disruptions to production and operations and affecting the market landscape. In this context, the long tail literature has identified several strands that could together potentially lead to a sizable increase in the cumulative share of niche products in the market and thus disrupt the management of production and operations.
A first strand relates to how digitization led to reductions in the inventory costs for Internet retailers relative to brick-and-mortar stores. This advantage of drop shipping or holding vast inventories at central distribution centers covering large regions or entire metropolitan areas allows online retailers to sell obscure products about as easily as popular ones. In contrast, the offline selling experience is limited to the inventory that the physical store can hold and display at one time. Products not in stock can only be obtained with additional transaction costs (Baldauf et al., 2024; Smith and Zentner, 2016). Because the online purchase of obscure titles is not disadvantaged (relative to the online purchase of hits) when using an Internet retailer, the share of obscure titles should be higher for Internet retailers than for offline retailers, all else equal. This can and has been viewed as an improvement in taste matching due to the Internet (Borenstein and Saloner, 2001). Consequently, demand and inventory planning would be affected since, for instance, supply chains would have to adapt to carry a wider selection of products (Baldauf et al., 2024; Bi et al., 2023; Rabinovich et al., 2011; Rajagopalan and Xia, 2012). However, it should be noted that there is evidence of rapidly diminishing purchase propensity from an increase in assortment size (Wan et al., 2012; Wang et al., 2023).
A second strand relates to demand-side considerations. With digital tools, online consumers have access to search and recommendation systems that might favor more obscure and less promoted products. Crowd-sourced reviews provide information on the quality of products that professional reviewers would likely overlook (Chevalier and Mayzlin, 2006; Jabr and Zheng, 2014). Similarly, platform recommendation systems, based on purchases by patrons with similar search patterns, might suggest obscure items of which the user would otherwise be unaware (Carmi et al., 2017). Furthermore, online transactions allow consumers to escape social inhibitions or avoid potential embarrassment related to offline interactions, which may lead to long tail effects (Goldfarb et al., 2015). The emergence of the digital economy has also made available large amounts of data. As such, big data analytics can guide operations related to the calibration and monitoring of recommendation systems and product review platforms and those related to the integration of multichannel distribution and their effects on product demand planning and demand dispersion (Guha and Kumar, 2018; Kumar et al., 2014; Oestreicher-Singer and Sundararajan, 2012).
A third strand relates to creativity. Digitization of the creative process reduced the costs of translating an idea into a product (e.g., a book or a song). A larger number of products are now available to consumers, often bypassing traditional middlemen. Lower distribution costs blur of the line between “professional” and “amateur,” as works previously created for the intrinsic pleasure of creation can now find extrinsic marketability (Waldfogel, 2017). A larger set of products available to retailers affects the manufacturing process and assortment planning (Cachon et al., 2005; Rabinovich et al., 2011; Ramdas, 2003). For instance, in our focal case of books, titles with high sales are produced using offset printing, whereas print-on-demand (POD) technologies have increasingly become the efficient production technology for slow-selling editions. The long tail would imply more of the latter and less of the former, with attendant but uncertain changes in inventory costs since POD generally avoids any need for inventory.
Given the plausibility of these suggestions, a digitization-induced increase in the share of sales of obscure titles seems like a fairly reasonable prediction. However, other aspects of a switch to Internet sales could potentially have countervailing effects. For example, consumers may be overwhelmed by having too many choices (Kuksov and Villas-Boas, 2010; Rabinovich et al., 2011; Wan et al., 2012; Wang et al., 2023), recommender systems (and big data) may mainly suggest superstar titles (Fleder and Hosanagar, 2009), and economies of scale may decrease marketing or logistics costs to a larger extent for superstar products than for obscure products (Gallino et al., 2017). These aspects would have separate and possibly confounding impacts on the distribution of sales among various titles.
3 Previous Examinations of the Long Tail Hypothesis
Despite the wide influence of Anderson's long tail hypothesis, and his largely anecdotal support, it has undergone few direct empirical examinations. An early and influential claim supporting the long tail hypothesis comes from Brynjolfsson et al. (2003), who claim that niche book titles have a much larger share of online sales (at Amazon) than they do in offline markets. This result is generally reported as though the relative market shares of obscure titles sold on Amazon had been measured. Instead, book sales were inferred from Amazon sales rankings by assuming that there is a straight line relating the log of titles’ sales ranks and the log of unit sales. As Liebowitz and Zentner (2024) show, the relationship between log rank and log sales has a strongly concave shape causing Brynjolfsson et al. (2003) to vastly overestimate sales of obscure books and the variety-induced welfare gains from those books. In a different market, Quan and Williams (2018) also find smaller welfare gains from variety.
Tan et al. (2017), using monthly data on DVD rentals in 2001–2005, find that an increase in the number of DVD titles available appears to increase the concentration of DVD rentals among consumers using offline video rental stores for a portion of the industry. This finding seems contrary to the logic of the long tail (although consistent with our findings); however, the study does not focus on the impact of the Internet per se. Elberse (2007) examines portions of the video and music markets and, while claiming to find results both supportive of the long tail theory (more titles) and contrary to it (e.g., higher concentration measured as a share of a given top percentage of titles), underscores that it would be a mistake to follow Anderson's business advice (“it is highly disputable that much money can be made in the tail”). Her predictions made using data from an early stage of online retailing are consistent with what our data will show actually happened with book purchases as online retailing grew from obscurity to ubiquity during our study period.
Zentner et al. (2013) examine weekly online video rentals versus in-store rentals for a major video rental chain in 2009–2010 and find that the online rentals are much less concentrated than the in-store rentals. After controlling for potential confounding effects and various aspects of self-selection by consumers, they find support for the long tail hypothesis in the video rental industry. Brynjolfsson et al. (2011), although sometimes presented as a test of the long tail, do not compare online retailers with brick-and-mortar retailers, but instead compare online sales to catalog sales, finding that online search tools enhance the share of obscure products. Thus, although their results are consistent with a long tail claim, we do not view it as a test of the long tail per se. Ratchford et al. (2023) show the presence of large differences in fashion goods that consumers buy online versus offline, and they find that these differences have large impacts in the measurement and interpretation of long tail effects. They also find that consumers do not buy greater overall variety when they use both the offline and online channels. Furthermore, multiple papers focus on how various changes in operations management affect the dispersion of sales. For instance, Gallino et al. (2017) study how the introduction of cross-channel functionalities affects the dispersion of sales, and other studies argue how greater variety does not necessarily lead to more sales due to consumer choice overload (Rabinovich et al., 2011; Wan et al., 2012; Wang et al., 2023). Finally, another strand of research analyzing mobile commerce suggests that customers using a personal computer tend to buy more long tail products, while customers using a mobile device tend to buy more popular products (e.g., Ghose et al., 2013; Jain and Tan, 2022).
Therefore, the relatively scant prior empirical testing seems to provide as much evidence against the long tail theory as in favor of it. This underscores the necessity of research in this area to inform managers’ decision-making processes.
4 Data on the Book Industry
The book industry usually groups books into several major categories such as “K-12,” “Higher Ed,” and “Trade.” Trade books represent titles directly purchased by individuals rather than schools or other entities, and they make up the majority category by revenue. These books are further subdivided into Adult Fiction, Adult Nonfiction, and Juvenile (Children and Young Adults).
Our data, obtained from Nielsen (later named NPD and now Circana) BookScan, include annual unit sales of printed books for the years 2004–2016 for each of the top 250,000 book title editions in each subdivision of trade books (Adult Fiction, Adult Nonfiction, and Juvenile), both nationally and in 99 major metropolitan geographic markets. BookScan collects point-of-sale data from approximately 16,000 retail outlets, including all the major online and offline book retailers and mass merchandisers (e.g., Barnes & Noble, Borders, Amazon, Target, Costco, and Walmart), smaller retail outlets, and thousands of independent bookstores. BookScan claims that the retailers in their data panel cover roughly 85% of the US trade book market. The data include online sales of print books (including self-published books) and exclude sales of eBooks (e.g., the data include sales of print books from Amazon.com but not the Amazon Kindle Store), which only achieved a market share over 5% after 2010 (Statista, 2011). These details about the data are also important to understand the competitive landscape in the context of our second empirical analysis, which exploits the 2011 bankruptcy of Borders.
To the best of our knowledge, these data are more complete than in any previous study, given the longer time frame, almost complete title coverage, and the inclusion of almost all transactions, publishers, and retailers. BookScan is considered the gold standard for data on book sales, and the quality of BookScan data is evidenced by the fact that BookScan's subscribers are mainly book publishers tracking how their titles are selling because they do not know the actual sales of their titles until retailers finish returning the copies that do not sell. Further evidence of the widespread regard for BookScan data is shown by Amazon giving authors access to BookScan sales data (Kellogg, 2010) to obtain detailed information about their book sales.
The time period covered by the data matches the large growth of Internet retailing. While only 22% of American adults purchased anything online in the year 2000, over 79% had done so by 2016. Nevertheless, 64% of Americans still indicated that, “all things being equal, they prefer buying from physical stores to buying online” (Smith and Anderson, 2016). The Internet share of book sales to individuals, measured in terms of revenues, increased tremendously from 2004 until 2016, from 3.8% in 2004 to 36.6% in 2016, a 10-fold increase (Association of American Publishers AAP Statshot, 2004, 2018). Thus, our 2004–2016 sample period spans a period of enormous growth of online book sales and is ideally suited to measure any transition to a long tail.
Our data set contains the entire population of books (subject to BookScan limitations) in the Adult Fiction and Juvenile categories for which at least one copy is sold, except in some later years. The limitation of 250,000 distinct editions was not binding for the Adult Fiction and Juvenile categories until 2011 and 2014, respectively. For those categories, we imputed the number of titles selling one or two units for those years. Our imputation method suggests that truncation causes only 0.048% of total sales to be missing from our data in 2016, the year with the most missing titles. 1 However, the truncation to 250,000 distinct editions is so restrictive for the Adult Nonfiction category that we chose to exclude this category from most of our analyses.
Many titles have multiple editions (e.g., paperback/hardcover or old/new), and each edition is treated as a separate observation in the BookScan data. 2 Determining whether different versions of a title should be considered the same product or different products is not straightforward; for example, the paperback and hardcover editions of a title may or may not be perceived as the same product by consumers. Further, both editions may not be available at physical stores. The BookScan data allow comparison of the results when editions of the same title are treated either as the same or as different products. We conduct the analysis by both merging all editions of each title and also by treating them as separate observations. Merging has virtually no impact on the market share changes over time of different popularity portions of the sales distributions (Figure 3 shown below is virtually unaffected whether merging editions or not). Our baseline results merge the different editions with identical author–title combinations, and we present the results treating all editions as separate products in Appendix A in the e-companion.
One potential complication is that some editions of a particular title have different author spellings or title wordings, meaning that they cannot simply be mechanically merged into the main author–title combination. 3 We refer to these as “orphan” editions. In Appendix A in the e-companion, we assess the aggregate size of these orphan editions and the likely impact these orphans have on the empirical results. We find that aggregate orphan editions tend to make up at most 2%–3% of the sales, which puts a low ceiling on any impact they could have on market share changes over time. In addition, examining the distribution of orphan edition sales using a sample of orphan titles, we find no evidence of a movement from the head of the distribution to the tail of obscure titles. We present these findings in Appendix A in the e-companion, showing an even smaller impact of potential orphan editions on long tail-induced changes in market shares.
5 How Has Sales Concentration Changed Over Time?
As with most other cultural industries, book sales exhibit substantial levels of concentration, generating extremely skewed distributions. This pattern can be seen in Figure 1, which shows the “head” of the sales distribution by presenting a comparison of cumulative unit sales as a share of total sales (truncated at 75% of sales), with the titles being ordered on the horizontal axis from the highest selling to the lowest selling (stopping at the top 25%), for the years 2004, 2009, and 2016.
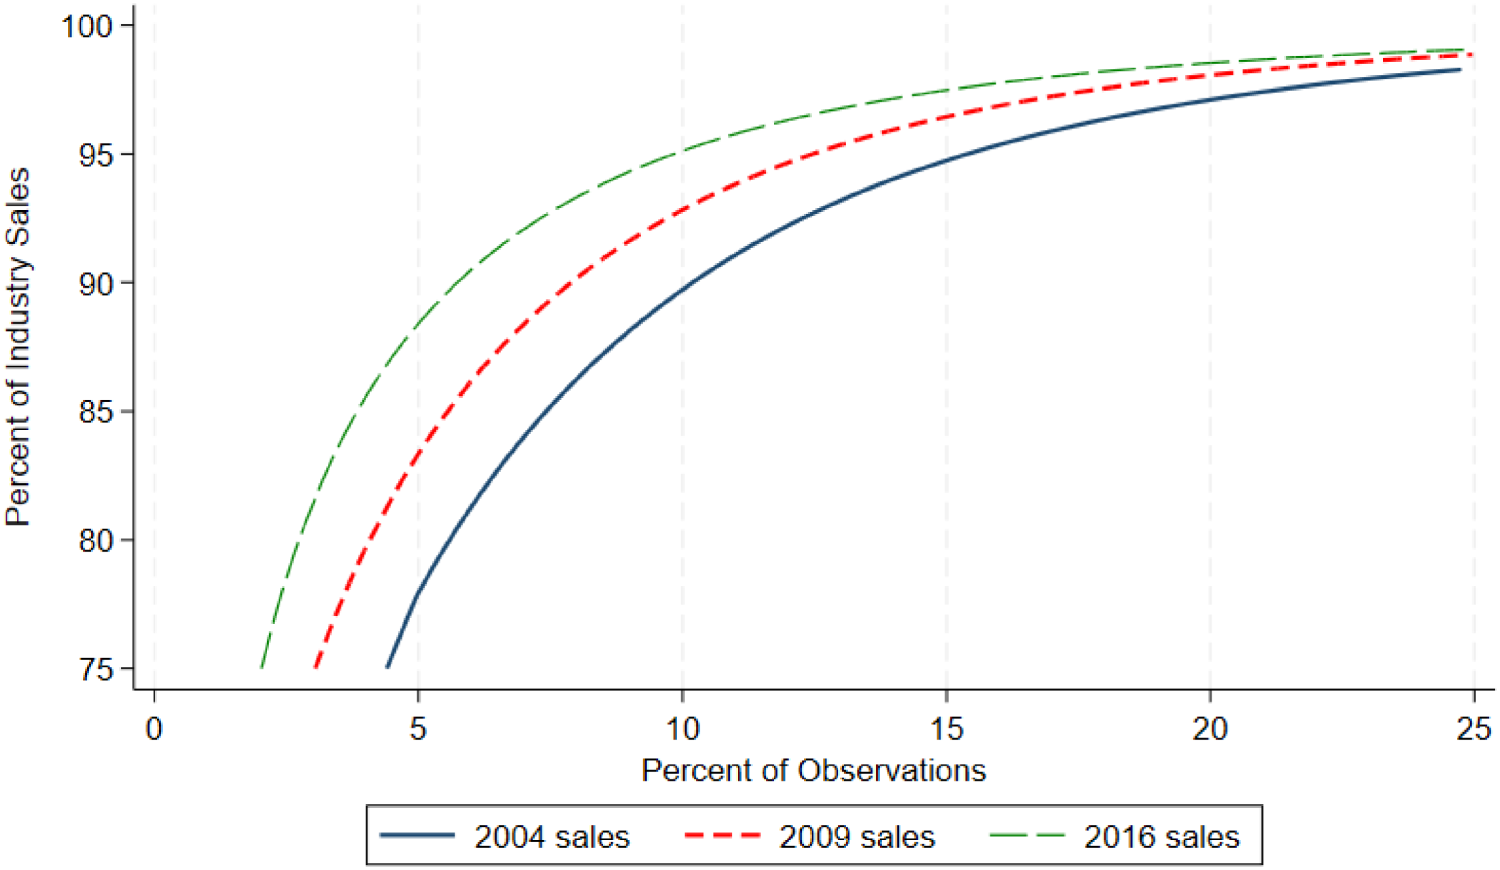
Share of sales starting with best-selling titles.
The figure, which does not impose any distributional assumptions, shows that the top 20% of titles account for virtually all the sales (approximately 98%) in the industry, with the top 10% of titles accounting for about 90%–95% of sales and the top 5% of titles accounting for about 78%–88% of sales. One takeaway from this figure is that a relatively small percentage of titles account for a large share of total sales. The other takeaway is the curve shifting to the left over time, meaning that a given percentage of top titles take a larger market share over time. This finding suggests a movement to a “shorter” tail, contrary to the long tail hypothesis.
However, this result is partially an artifact of using relative measures of concentration. Indeed, results in the long tail literature have varied depending on whether the measure of concentration is relative or absolute. Digitization has brought down the cost of bringing a new title to market. Since costs are lower, publishers can go forward with book projects that they would have previously declined to publish. In fact, Figure 2 indicates that the number of distinct titles more than doubles over our time frame, while the aggregate unit sales fluctuate over the study period and increase only 14% from beginning to end. The number of titles selling exactly one unit increases by over 90,000 during these years. The number of titles selling between two and 10 units increases by over 127,000. Over 96% of the increase in titles is due to niche titles that sell too few units (outside the top 100,000 titles) to be found even in book superstores using Brynjolfsson et al.’s (2003) criteria for “niche” that we adopt below. We shift to absolute cutoffs to give the long tail hypothesis its greatest likelihood of support; however, even in this case, our results do not support the existence of large long tail effects.
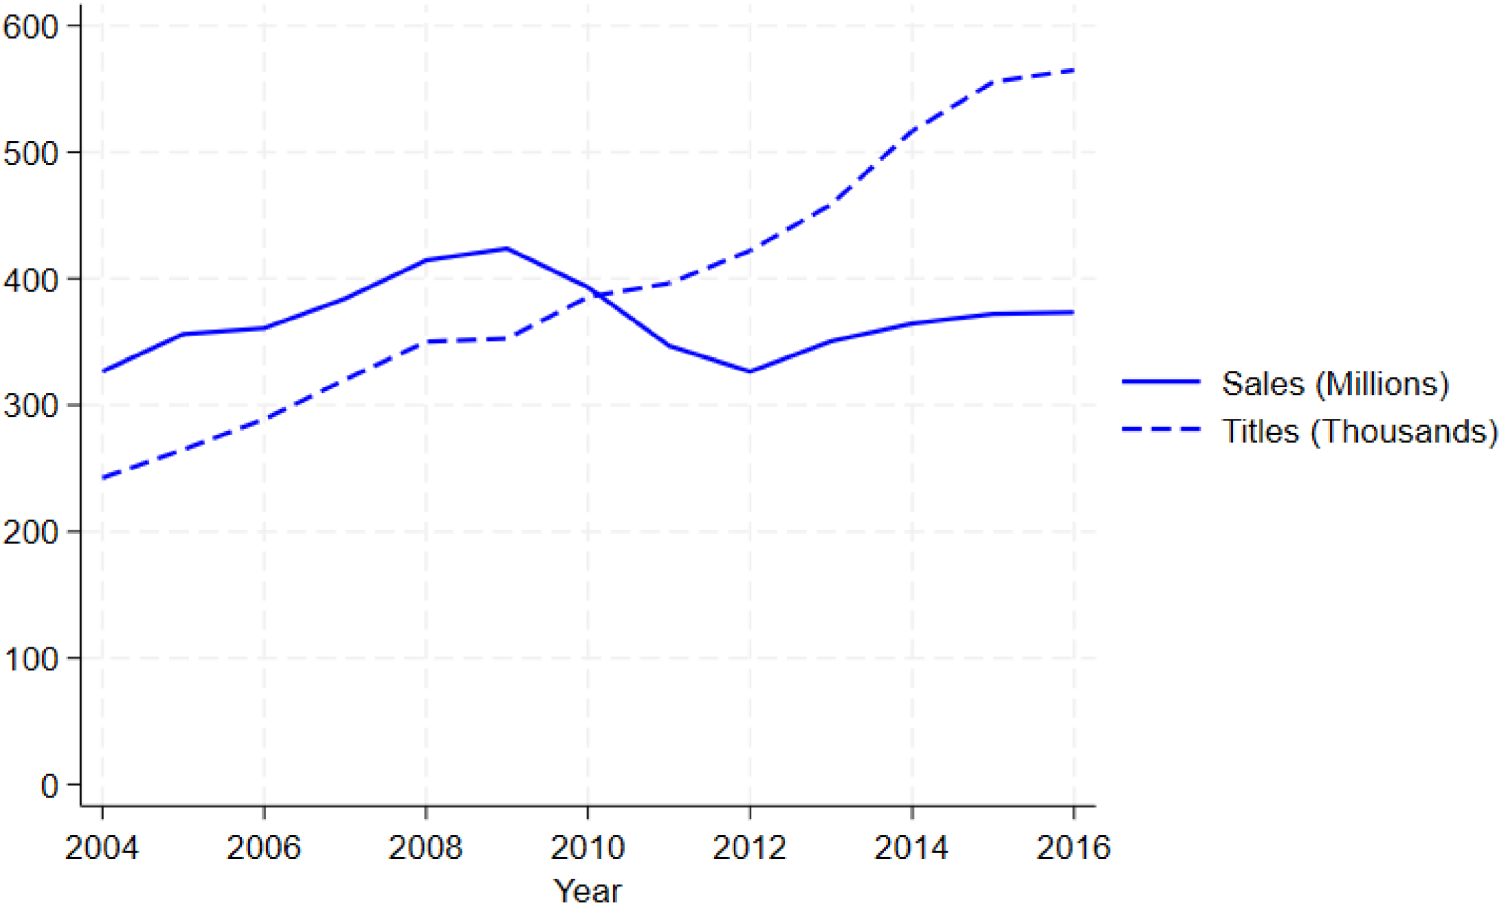
Unit sales and unique titles over time.
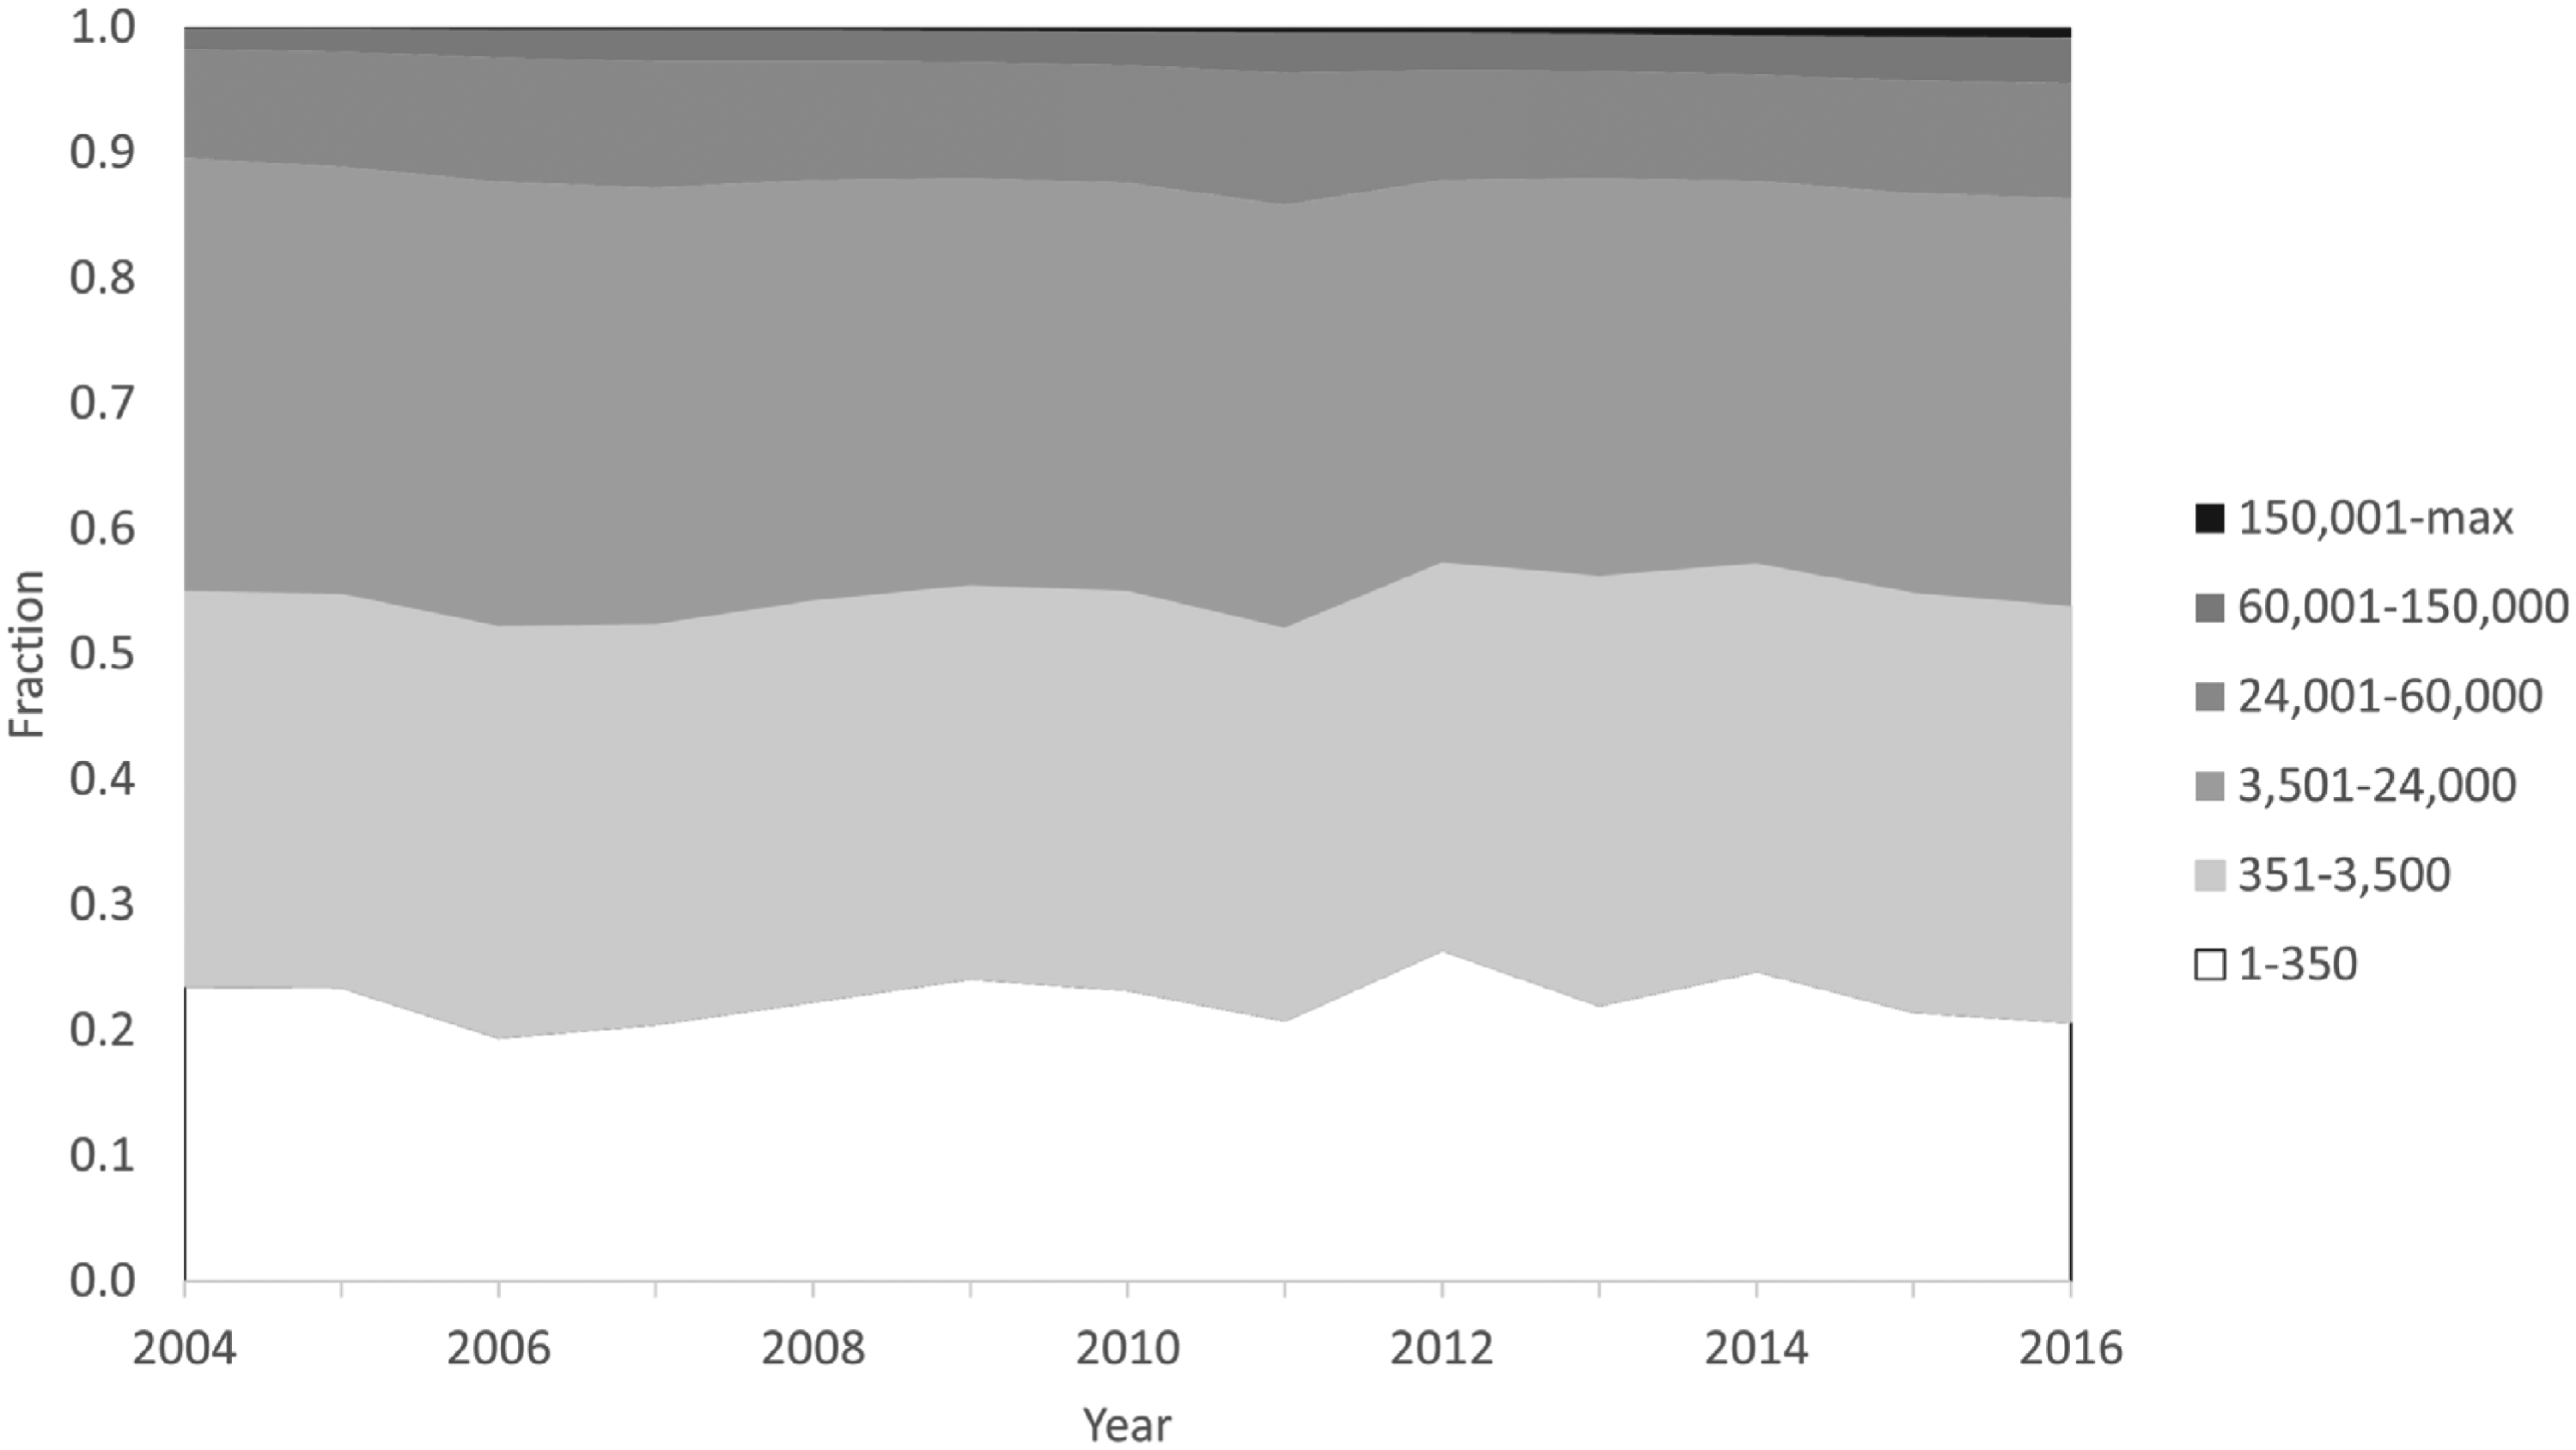
Share of sales by sales rank using absolute cutoffs.
Figure 3 presents an analysis examining changes in concentration using absolute measures (the share of a fixed number of titles). Brynjolfsson et al. (2003) provide two specific sales rank demarcation levels for obscure titles: rankings of 40,000 and 100,000. They choose these two values to distinguish between the number of titles found in typical bookstores (40,000) and the number of titles found in book superstores (100,000). Online customers would also have access to even lower ranked obscure titles not available offline. In emulating the demarcations used by Brynjolfsson et al. (2003), our specific cutoff numbers are different because we exclude titles in the nonfiction group. 4 We define six categories: category 1 includes titles ranked 1–350; category 2, titles ranked 351–3,500; category 3, titles ranked 3,501–24,000; category 4, titles ranked 24,001–60,000; category 5, titles ranked 60,001–150,000; and category 6, titles ranked 150,001 or lower. In Figure 3, the legend provides the actual cutoffs we used so that categories 4, 5, and 6 would be niche under Brynjolfsson et al.’s (2003) lower cutoff and categories 5 and 6 would be niche under their higher cutoff. 5
The first category in Figure 3 represents the yearly share of the leading 350 titles, which we classify as superstar. 6 The evolution of the share of these titles does not have a consistent pattern. Category 2 represents star titles, and they also do not show a consistent trend in their market share over the period. Category 3 includes results for titles ranked between 3,501 and 24,000, representing the nonstar titles likely to be found in ordinary bookstores. These values show a slight decline in the share of sales over time. Category 4 provides shares for titles that are common enough to be found in book superstores but niche enough to not be carried in ordinary bookstores. These titles have no discernable pattern over time. Books in barely legible categories 5 and 6 experience some growth, but category 6 is so miniscule that any growth is barely noticeable. The two categories encompass niche titles that are unlikely to be found in most bookstores. Although they comprise 75%–90% of all titles, the cumulative sales within categories 5 and 6 are very low, at about 2% of sales at the beginning of our period and about 4.5% of sales at the end.
Superstar and star books command higher average list prices, $17.95 and $12.23, respectively, versus $10.10, $9.87, $10.35, and $9.05 for the other categories. Retailer costs are likely higher for popular books due to higher author royalty rates and perhaps some market power on the part of leading authors. Since obscure titles have lower prices but also potentially lower costs, it is not clear if obscure titles have higher mark-ups.
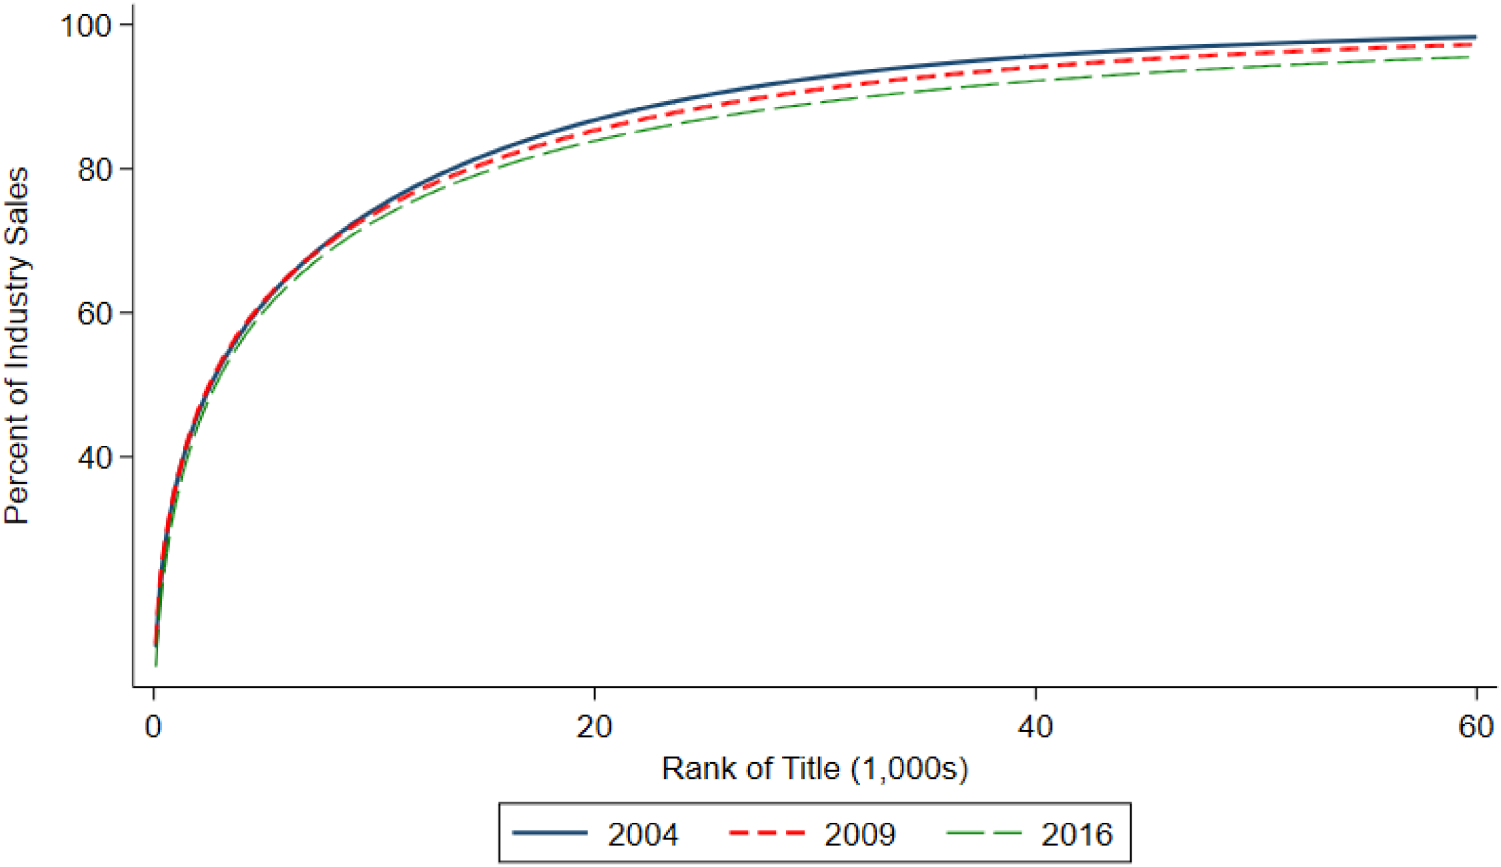
Categories 1 and 2 in combination, representing about half of all sales, show no clear trend over time in Figure 3. Thus, this top half of sales does not decline as would be expected if the cumulative share of obscure titles grew to become similar in size to the successful titles. A slight decrease of about 2% points occurs in the share of categories 3 and 4 in combination, representing nonstar titles available in bookstores or at least in book superstores. Categories 5 and 6 together, representing obscure titles, grew by only 2.5% points over these years. This outcome is evidence in favor of a much smaller “longish” version of a tail. This can also be seen in Figure 4, based on absolute sales rank, in which the cumulative function moves to the southeast over time as opposed to the northwest movement in Figure 1. The greater availability of obscure titles leads to a small increase in their share, but nothing like the 30%–40% originally hypothesized. Advising book publishers and retailers to alter operations to accommodate niche titles, such as those with sales ranks below 60,000, seems like poor business advice, indeed. Book publishing's POD production capability give it an advantage over many other industries when it comes to producing fringe products, so that everything else equal, we would expect other industries to have less of a long tail than does the book industry.
Share of sales over time using absolute cutoffs.
A question that arises is whether the introduction of the mobile channel might influence our conclusions. We note that smartphones did not exist until 2007. Figure 4 demonstrates little to no difference between the early years of our study period, when the mobile channel could not possibly affect our results, and later years.
Another question is whether eBooks, which are missing from our data, might influence our conclusions. While we do not have the same type of rich data for the eBook market that we have for physical books, the information we have suggests that the inclusion of eBooks is unlikely to change our conclusions. First, the eBook market was less than 6% of the market before 2010 (BookStats, 2011), too small to have much of an impact on the overall book market, yet Figures 3 and 4 indicate that the share of obscure titles failed to increase substantially amid the high growth in e-commerce during 2004–2010. Second, the distribution of eBook sales likely mimics the skewness of the distribution of printed books. For example, the top-selling physical book titles also do very well as eBooks, as five of the top 10 Amazon eBook best-sellers in both 2015 and 2016 were also among the top 10 physical titles in the BookScan data for that year (Amazon, 2022). This evidence suggests that the sales distributions of physical books and eBooks have similar shapes.
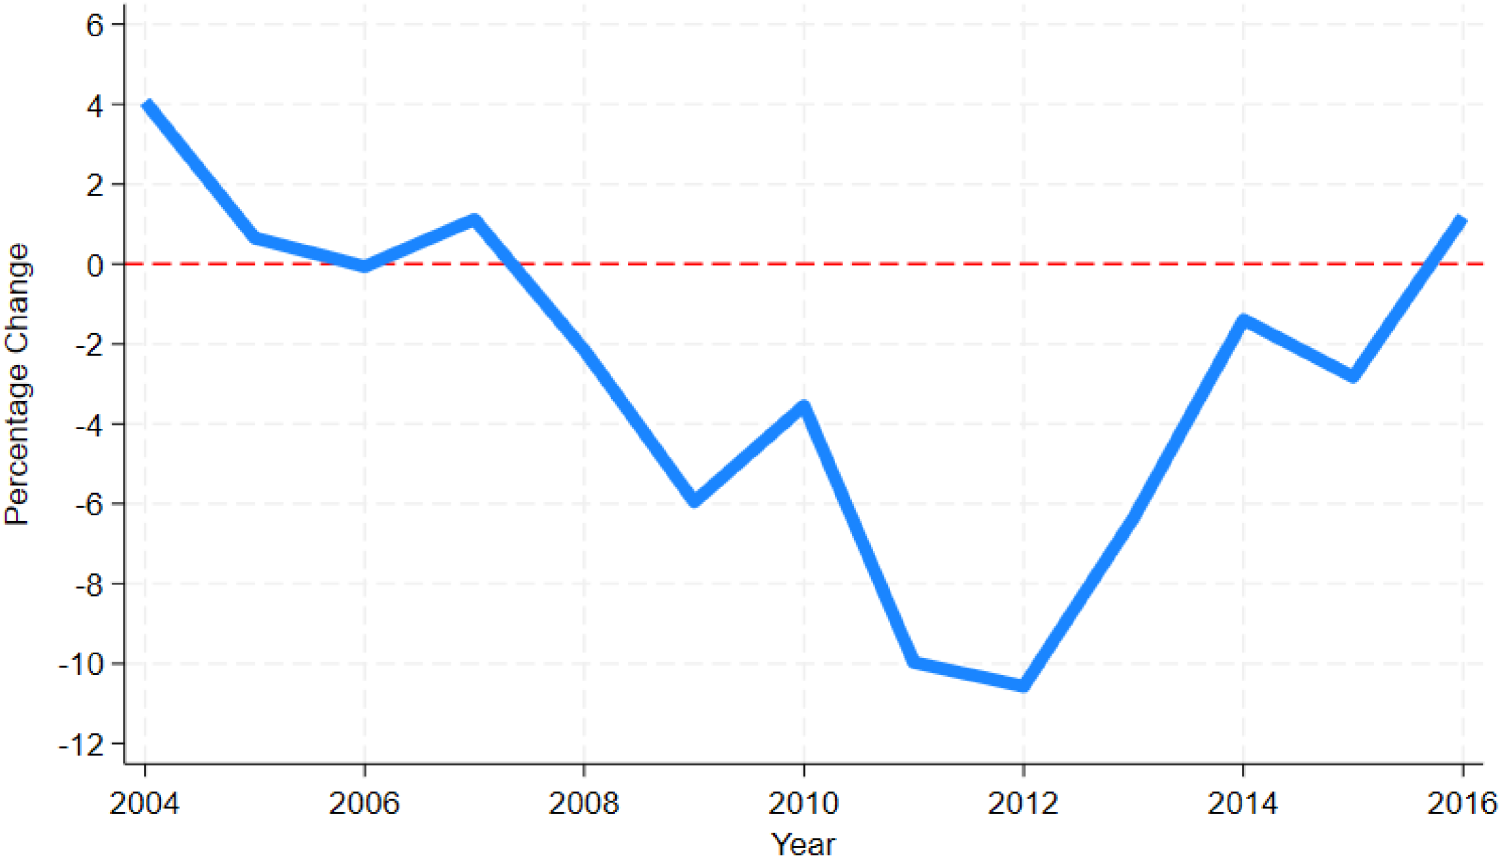
Yearly changes in US physical bookstore revenues.
6 The Borders Bankruptcy as a Natural Experiment
Borders Group Inc. was the second largest bookstore company in the world. It was known for its large number of eponymous superstores as well as its smaller stores mainly branded as Waldenbooks. It had an unimportant online bookstore (Borders.com) run by Amazon. In 2006 the firm began to lose money on its operations and was in dire financial straits by 2010. It started eliminating most of its Waldenbooks stores prior to 2011 but retained almost all its domestic superstores, and as of 29 January 2011, it operated 489 Borders superstores and 153 smaller stores (Borders Annual Report, various years). On 16 February 2011, Borders announced a planned Chapter 11 bankruptcy, during which it intended to eliminate or sell off 226 Borders superstores while continuing operations using the remaining stores. The Chapter 11 plan failed, and on 19 July 2011, Borders announced it was closing all remaining stores starting on 22 July (Spector and Trachtenberg, 2011). All stores were closed by the end of the year.
Effects of store entry and exit shocks have been shown to have implications for operations management (e.g., Akturk and Ketzenberg, 2022; Samuel et al., 2020; Soysal et al., 2019; Tang et al., 2021). For instance, store closures are found to increase sales of retail competitors (Akturk and Ketzenburg, 2022). Because most of Borders closed stores were superstores, the disruption from the closings would be expected to particularly hit customers who were interested in less common titles that were more readily available in superstores. For some former Borders patrons, the transition to another brick-and-mortar store would have been trivial. For others, however, perhaps more distant to other outlets or superstores, the preferred choice was likely to increase their online book purchases.
Borders’ bankruptcy represented a large discrete shock to consumers’ retail choices. Borders’ revenues were $2.253 billion in 2010, whereas, national bookstore revenues, that is, physical retail outlets primarily selling books, were $15.24 billion. 7 This would imply that Borders revenues made up 14.8% of all bookstore sales in the USA in 2010, and the closing of the stores producing these revenues would be expected to have a considerable impact on the industry. In particular, the consumers who had patronized Borders’ stores, if they wanted to continue to purchase physical books, would need to either switch to other bookstores, other types of physical stores that sell books, or online book retailers, all of which are included in our BookScan data.
6.1 Shift to Online Shopping
Our interest is with the consumers who switched to the Internet after Borders’ stores closed in 2011. The Internet had become an increasingly important channel for physical books prior to 2011 as a part of online commerce's growth. In fact, the book market was an early pioneer in online purchasing since 1994 when Amazon began, initially as a book seller. It seems likely, therefore, that some former Borders customers would switch to the Internet channel, especially those more distant to remaining stores (Nault and Rahman 2019). In particular, customers wanting titles unavailable in regular (nonsuperstore) bookstores would seem particularly inclined to switch. These online purchasers could take advantage of both the deeper inventory and the greater ease of online search to purchase obscure titles. This would presumably lead to a larger shift of purchases into “the long tail” in those localities where Borders was more important relative to other localities that were less well served by Borders stores.
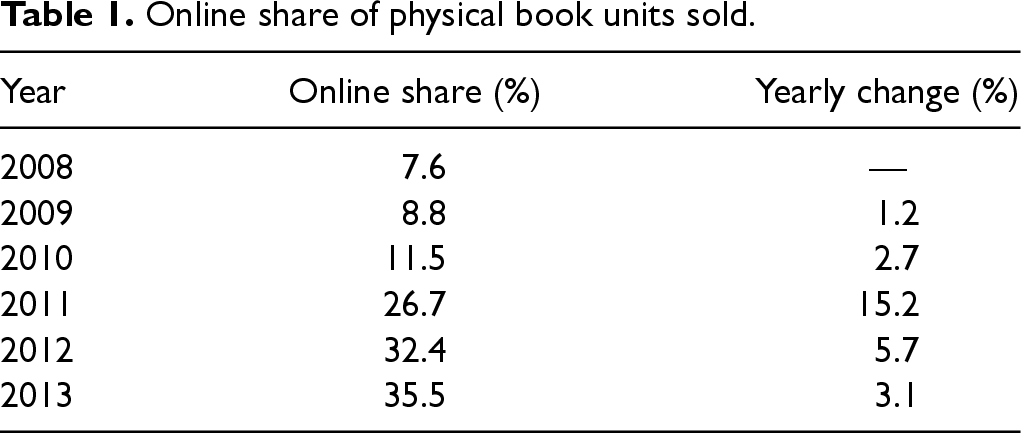
There is evidence that Borders closings caused both a decline in offline book purchases and an increase in online book purchasing. Although the Borders closings were completed during 2011, the first full year with no Borders stores was 2012; thus, the impact of the closing would be expected to be partially felt in 2011 and fully felt in 2012. Figure 5 shows the yearly changes in offline bookstore revenues in the US during the years of interest (Statista, 2023). The declines in 2011 and 2012 are the largest among any of the years shown and are the largest of any years from 1992 to 2019. If Borders customers could easily switch to a competing physical bookstore, we would not see the types of declines found in Figure 5 for the years 2011 and 2012 unless some idiosyncratic cause for bookstore declines was contemporaneous with Borders closing. Table 1 indicates that much of the lost physical bookstore sales were diverted to online sales. It reports the online share of book sales for 2008–2013, showing a spike in the growth of online sales occurring in 2011, coinciding with the closure of Borders stores. 8 Together, Figure 5 and Table 1 suggest that Borders’ closure caused a large diversion of sales from offline to online retailers.
Online share of physical book units sold.
6.2 Empirical Strategy
If the closure of Borders did induce more online book shopping, the long tail hypothesis implies that overall sales would shift toward more obscure titles. Importantly, our test does not depend on measuring the magnitude of the shift to online purchasing. Instead, we test for the relative effects for books in different positions in the sales distribution. We operationalize this insight with a series of difference-in-differences regressions using data from two years (2010 and 2012). We relate the change in the share of book purchases of different sales rank categories in a city from 2010 to 2012 to the size of Borders stores’ presence in a city, immediately before the closure of all its stores, as in equation (1):

The identifying assumption is that, conditional on city and year, Borders store closure decisions were not affected by changes in the relative popularity or obscurity of books. This assumption is supported by the sudden and near simultaneous closure of all Borders stores. The city fixed effect,
Many of the results from the difference-in-differences analysis can be gleaned from Figure 6, which uses a dummy for Borders exiting a DMA as treatment. In the upper left panel for the top 1–350 titles, these shares appear to follow similar trajectories but with a gap of about 2% points prior to Borders’ closure. After 2011, the gap almost disappears, indicating that the share of sales in this bin, representing superstar products, fell by approximately 2% points where Borders had operated (solid green) relative to where it did not (dashed red). The change in these gaps in the next two bins is less pronounced. But all three bins in the bottom row show an increase in the lines for DMAs affected by the Borders bankruptcy relative to the lines for those unaffected. However, the vertical scales across the graphs are different, and on the bottom row, they are much smaller. This result indicates that, despite being visually detectable, these effects are very small in magnitude. The panels in Figure 6 also suggest that the parallel pretreatments condition for treated and untreated DMAs holds; we present some more formal tests of parallel trends below.
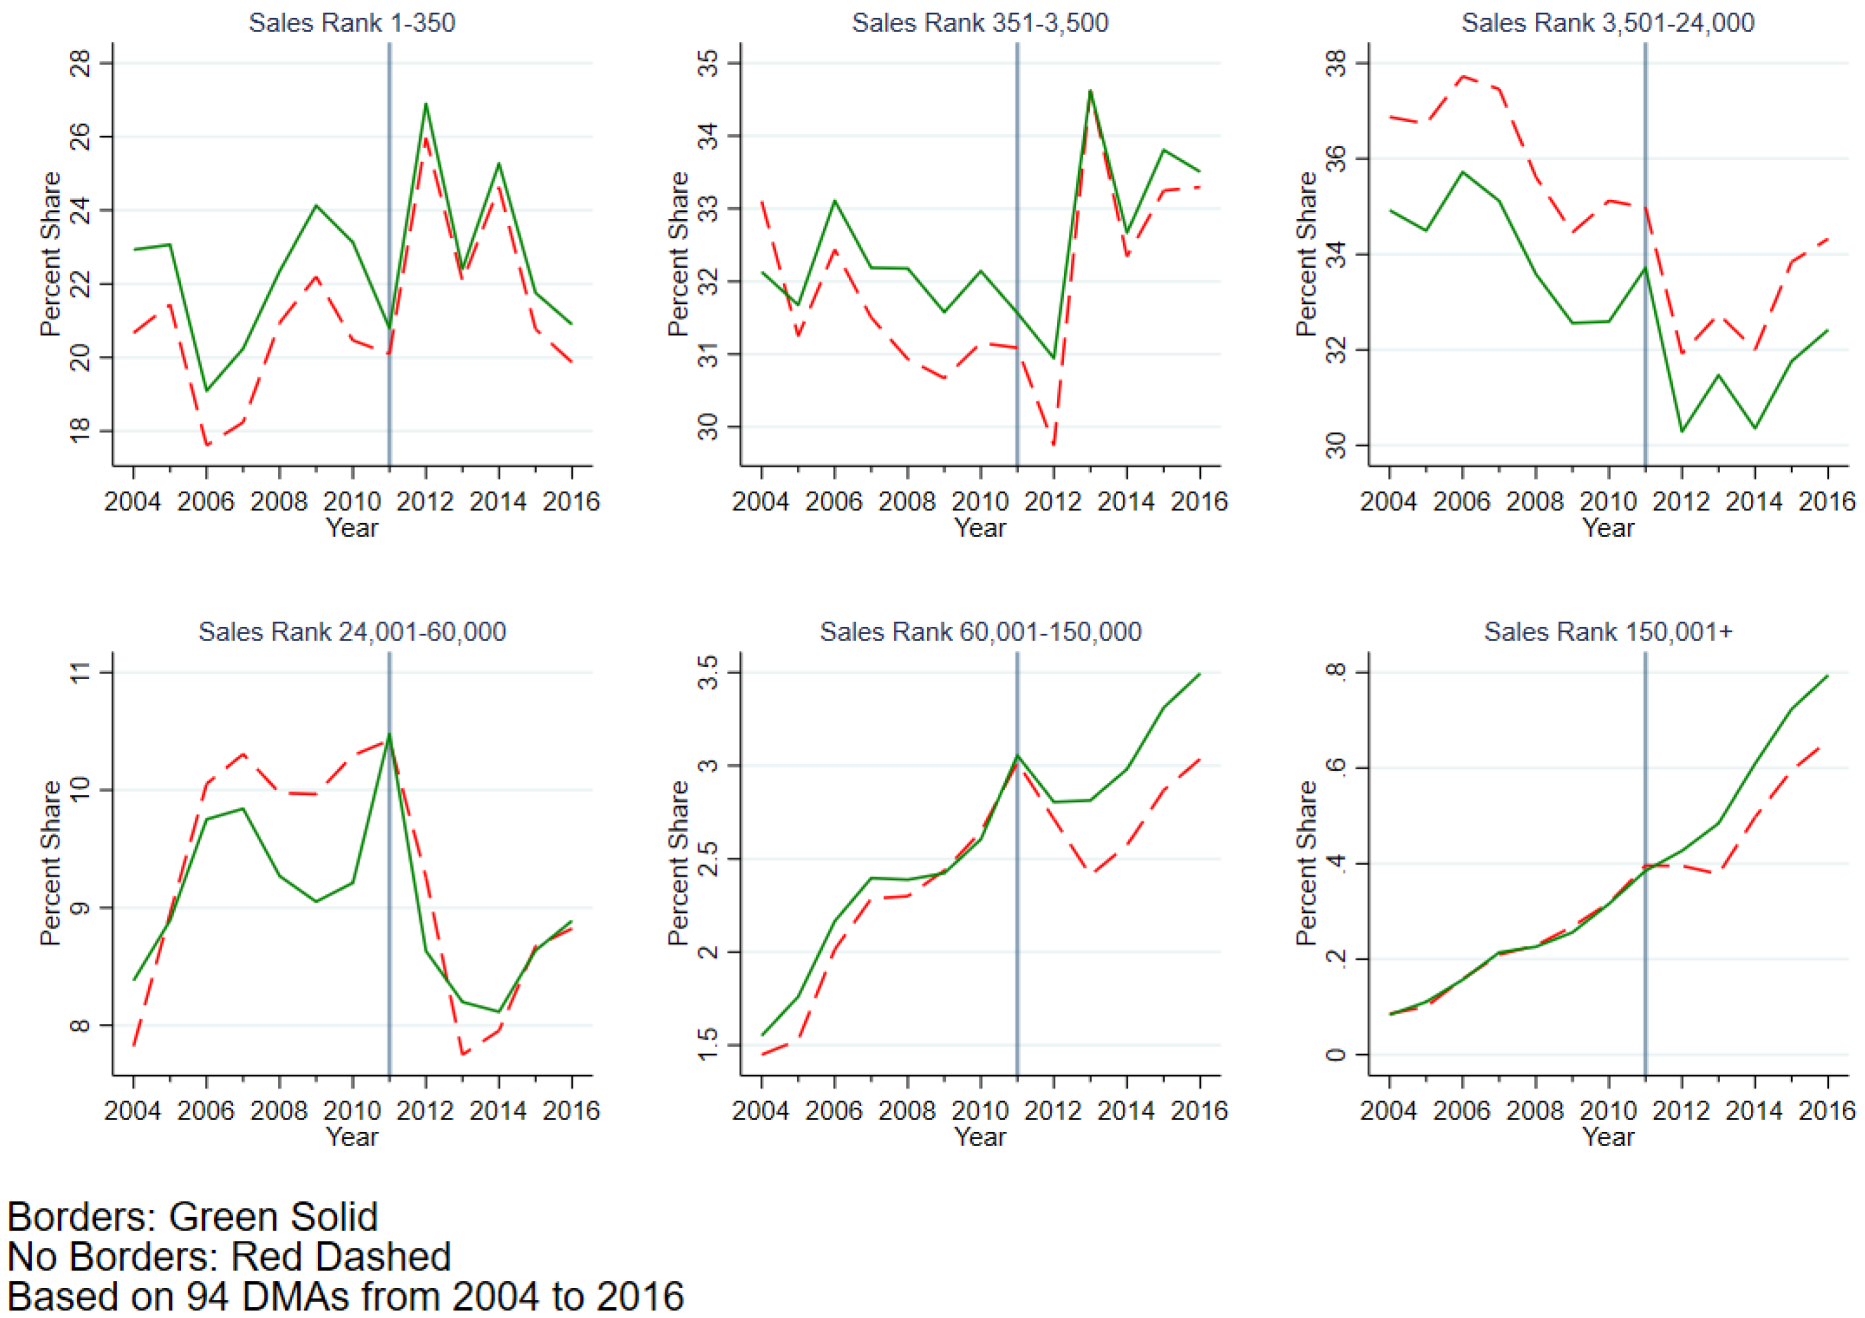
Trends in sales bin share by treatment state (closure of Borders stores), with scales on the vertical axis differing across panels.
In order to use the market share treatment, we calculate two different measurements of Borders’
The first measure of Borders’ 2011 market share in each DMA is a store-based market share calculated by converting all stores into “superstore equivalents” and finding Borders’ share. Borders’ stores are identified as superstores or regular stores depending on whether the square footage exceeded 12,000 or not. CBP stores are identified as superstores if they had 10 or more employees. Regular stores are converted into superstore equivalents assuming that a regular store is 14.18% of a superstore based on the relative square footage among Borders stores (Borders Annual Report, various years). The ratio of Borders’ superstore equivalents to total superstore equivalents in a DMA is our first variable,
The second measure of Borders market share is an employee-based market share calculated as the number of Borders employees in a DMA divided by total bookstore employees in the DMA,
Summary statistics are reported in Table 2. The first three sales share categories, for books ranked in the top 24,000, account for 87% of all sales. The next three divide what can be construed as candidate “long tail” categories into bins that are increasingly smaller by sales volume but increasingly larger by the number of book titles. The average DMA has approximately 21 superstore-equivalent stores with Borders’ (weighted) share at about 23%, and the average DMA bookstore employment is 843 with Borders’ weighted share at about 22% before shutting down.
Summary Statistics by DMA.
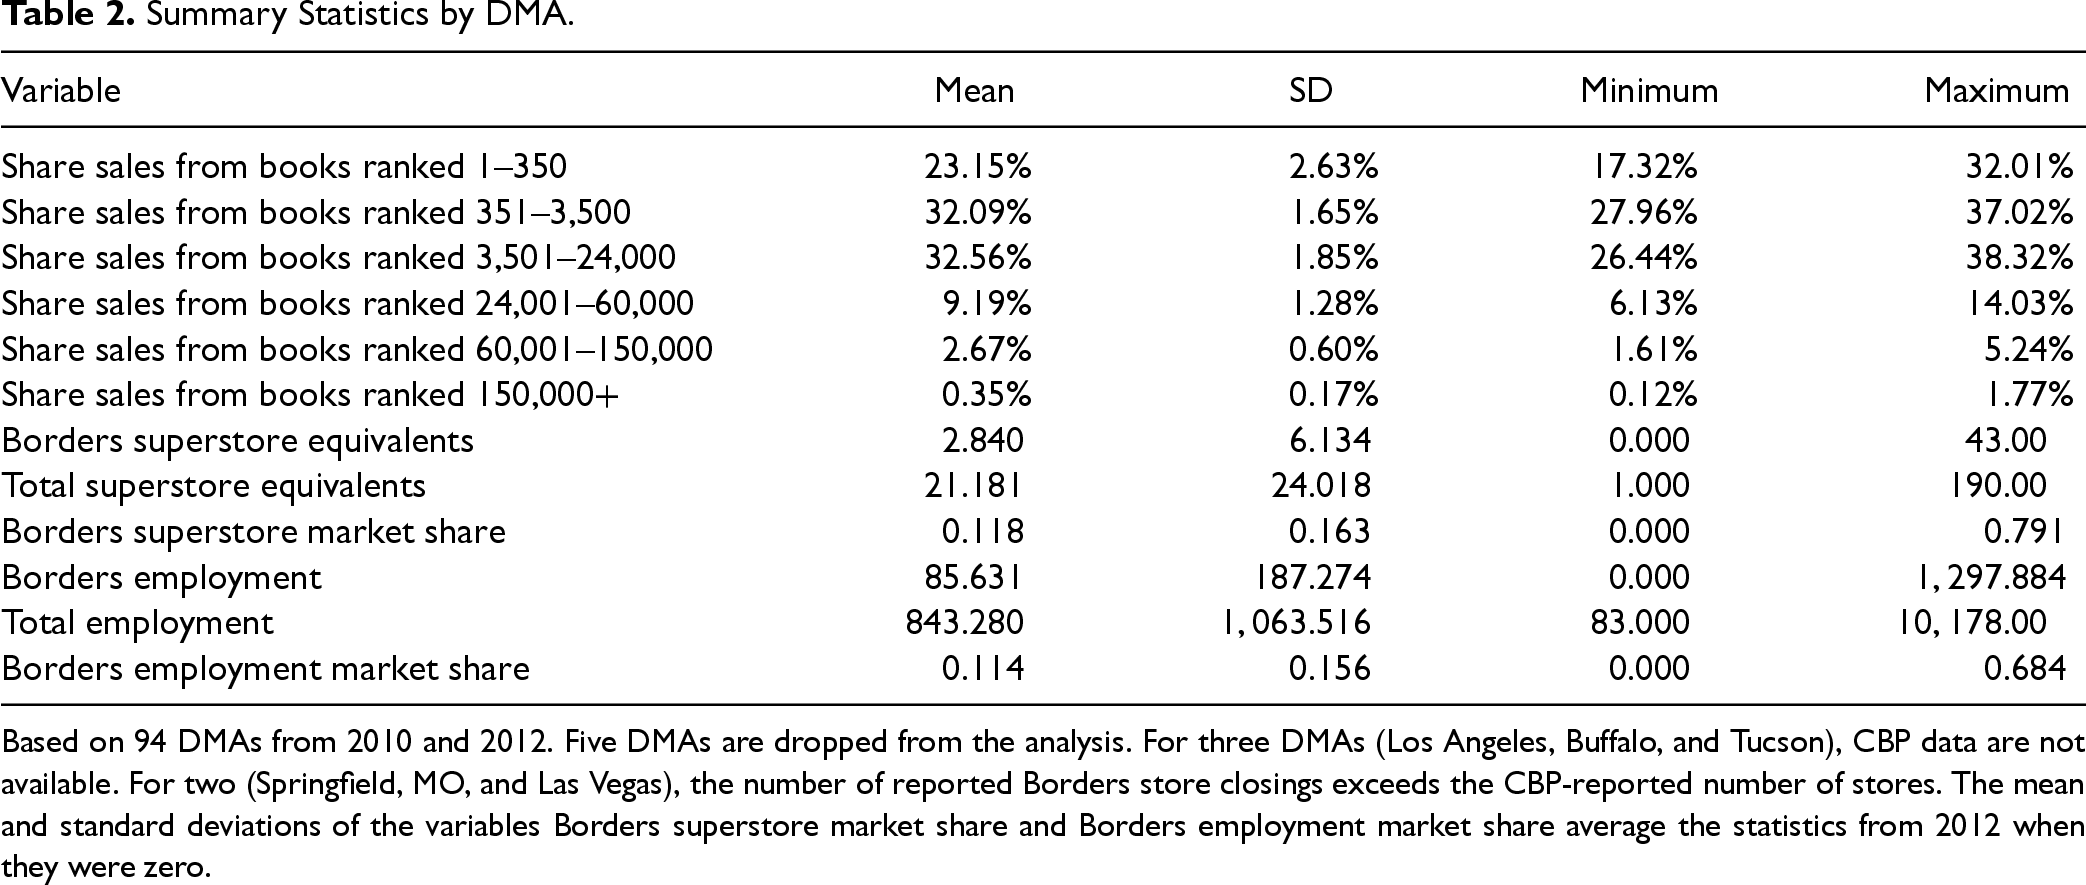
Based on 94 DMAs from 2010 and 2012. Five DMAs are dropped from the analysis. For three DMAs (Los Angeles, Buffalo, and Tucson), CBP data are not available. For two (Springfield, MO, and Las Vegas), the number of reported Borders store closings exceeds the CBP-reported number of stores. The mean and standard deviations of the variables Borders superstore market share and Borders employment market share average the statistics from 2012 when they were zero.
6.2.1 Regression Results.
The results from running the regressions in equation (1) are reported in Table 3. The various columns represent the differential effects of the Borders bankruptcy on the market share of popularity categories of titles (as in Figure 3). The three rows represent the estimated effects from our three treatment variables estimated from three different regression estimations. The first row uses a simple dummy indicator as treatment and measures the average effect of Borders closure in percentage points. Since the other two rows use Borders prebankruptcy market share as the treatment, the size of the coefficients represents the change (in percentage points) of sales in a popularity category as the change in Borders’ bookstore market share goes from 100% to 0%, which is out of sample since Borders’ market shares range from 0% to slightly below 80% (70%) using the store-based (employee based) measure of market share, as seen in Table 2.
The effect of borders’ closing on the distribution of books sales.
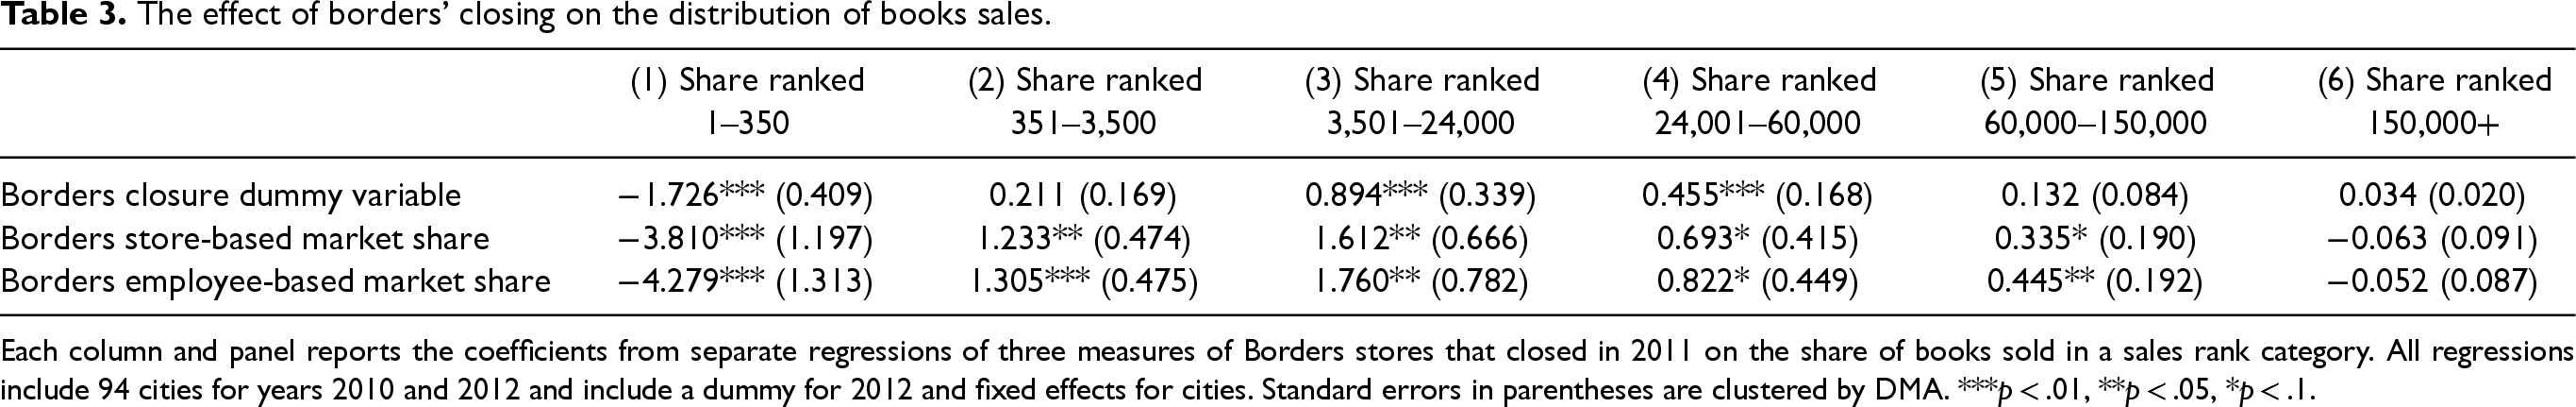
Each column and panel reports the coefficients from separate regressions of three measures of Borders stores that closed in 2011 on the share of books sold in a sales rank category. All regressions include 94 cities for years 2010 and 2012 and include a dummy for 2012 and fixed effects for cities. Standard errors in parentheses are clustered by DMA. ***p < .01, **p < .05, *p < .1.
The long tail hypothesis would be strongly supported if, for example, the sales share of titles fell in the first three columns and rose in the last three columns. Moreover, to justify changes in operational management, the rise in the last two columns would need to be large. The pattern in Table 3 does not support the hypothesis. Instead, the main conclusion from Table 3 is that the bankruptcy caused only a small rearrangement in the distribution of sales, mostly from superstar titles in column 1 to other moderately successful titles. Table 3 also shows some small increases in the share of sales taken by star titles (ranked 351–3500) when using the Borders prebankruptcy market share variables as treatments and some small increases in the share taken by popular books ranked 3,501–24,000 for all three treatment variables. The estimated increases in columns 2 and 3 are small. For instance, the coefficient estimates in column 3 indicate an average effect of less than 1% point. 11
Looking in more detail, column 1 of Table 3 shows the statistically significant and small in size decline in sales of the top 350 titles in all three rows. 12 The increased share of the star titles in column 2 when using Borders prebankruptcy market share variables as treatments, with sales in 2011 ranging from about 17,000 copies per year to almost 100,000 units per year, cannot be considered an increase in niche titles. Titles in column 3 also sell quite well, from about 2,200 to 17,000 units sold per year. The lowest ranked titles contained in column 3 are likely to be found in most bookstores and are among the top 6% of all titles. We do not believe that these titles fit the classification of “niche.”
The titles represented in columns 4, 5, and 6 would seem much more likely to fit the classification of niche titles. In contrast to long tail predictions, column 6, representing the bottom 64% of all titles in 2012, all clearly niche titles, has no significant growth. The results in columns 4 and 5 are more compatible with the long tail hypothesis as they represent somewhat obscure titles, and the positive coefficients mean that they are increasing their collective market share. But even here, the estimated effect is small. Combined, the titles in columns 4, 5, and 6 show an average increase of less than 1 percentage point in sales. 13 The implied very small estimate shift is not toward the truly obscure titles found in column 6, but instead toward the titles that we might classify as “top obscure.” Regression results without the imputed titles do not change in a material way, which is expected since the imputation represents only 0.01% of sales (we explain this in Appendix C in the e-companion).
Although our focus has been on the Borders’ bankruptcy causing a shift toward online sales, the bankruptcy might also shift some former Borders’ customers to purchase from ordinary (nonbookstore) offline retailers such as supermarkets, drug stores, and big box retailers (e.g., Walmart, Target, and Costco). These types of outlets, which are covered in our data, generally carry a very small number of titles, mainly the best-sellers in column 1 and perhaps some in column 2. To the extent that former Borders customers are willing to drastically limit their selection of titles in this manner, we should find that the bankruptcy increased the share of the top titles, with declines in the middle two categories that consist of titles generally available in Borders’ stores but no longer available to these former Borders consumers. However, this shift of Borders’ customers to nonbookstore physical retailers is not expected to have had an impact on the last two categories of clearly obscure titles since titles in those categories were not available in Borders’ stores and remain unavailable to this set of former Borders customers. Thus, the shift to other offline retailers would not negate our conclusion that the shift to online retailing failed to substantially increase the share of titles that are clearly obscure since no physical store carries these titles.
The number of retailers in an industry is related to market power, which may affect the operations landscape (Hartwig et al., 2015; Jain et al., 2011; Li and Zhang, 2023; Yin et al., 2023). With Borders closed, the remaining physical booksellers face less competition, which may result in increased market power and higher offline prices, and substitution to online sellers. However, since supermarkets, drug stores, and big box retailers still present substantial competition with regard to top-selling titles, and obscure titles were almost never carried by any offline stores, the titles in both the head and the tail of the distribution should be the least affected by this change in the competitive landscape. Price increases related to market power would thus tend to be concentrated among titles sold in bookstores that were not top sellers, or in columns 3 and 4 in Table 3 for titles ranked 3,501–60,000. If so, sales of these titles should have fallen. The finding that sales in these columns change only slightly does not suggest that changes in retail prices related to market power were a significant factor in changing the distribution of sales. Moreover, the sign of the coefficient estimates in Table 3 indicates a slight increase in the market share of columns 3 and 4, although higher prices from market power would predict a decrease in these column's market share.
Borders direct competitors were other physical booksellers such as Barnes and Noble or Books-a-Million. To further explore how market power may affect our results, we obtained information from RetailStat on the geographic location of Barnes and Noble and Books-A-Million stores as of July 2011, when Borders closed. In 2011, Barnes & Noble and Books-A-Million had 707 and 234 stores, respectively. These data allow us to study whether there are heterogenous effects based on how much competition Borders faced from these two main direct competitors. To conduct this analysis, we estimate equation (2):
The effect of borders’ closing in more concentrated markets.
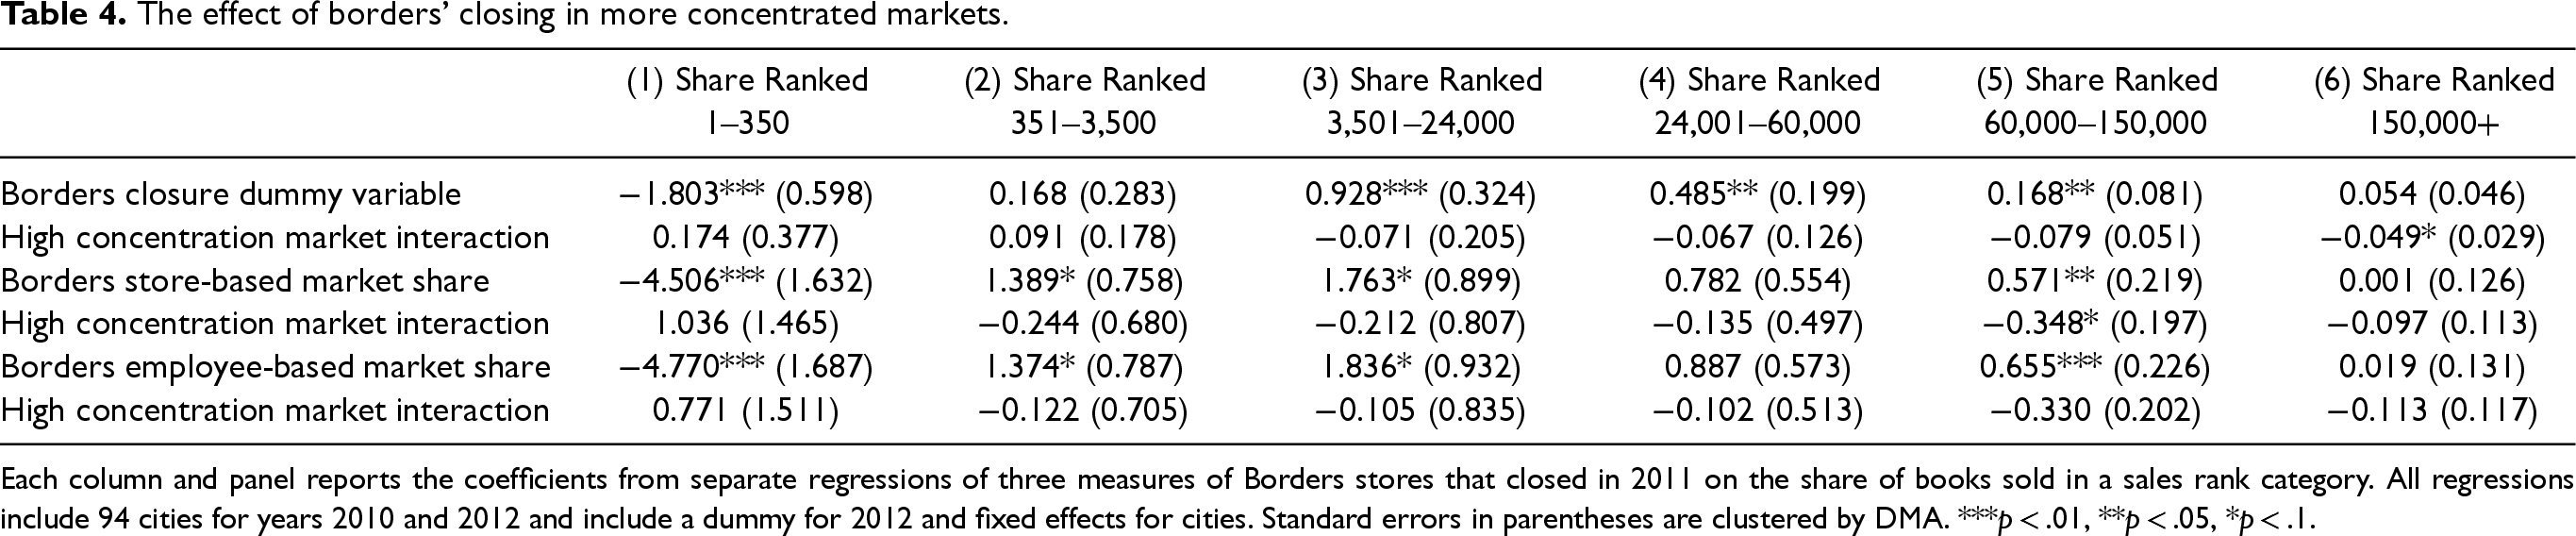
Each column and panel reports the coefficients from separate regressions of three measures of Borders stores that closed in 2011 on the share of books sold in a sales rank category. All regressions include 94 cities for years 2010 and 2012 and include a dummy for 2012 and fixed effects for cities. Standard errors in parentheses are clustered by DMA. ***p < .01, **p < .05, *p < .1.
The results of estimating equation (2) are reported in Table 4, which is analogous to Table 3, but includes the additional interaction term. Across all six columns and all three treatment measures, none of the interaction terms are statistically significant. Moreover, in terms of magnitude, the estimated effects in Table 4 are similar to those in Table 3. This suggests that the effect of Borders closure was not heterogenous across cities based on how much direct competition Borders faced from Barnes and Noble and Books-A-Million stores and how Borders closure affected market power.
Another possibility is that some former Borders’ consumers switched to eBooks (Sharma et al., 2024). This should not influence our results directly if these new eBook consumers were similar to other Borders’ customers in terms of their predilection for top and niche titles. Since these consumers leave our data set, the only way they could influence our results would be for their removal to change average values for remaining observations, which would not occur unless these consumers were atypical. Given that eBooks presumably share many of the inventory advantages of online retailers, it might be interesting to know if a shift to eBooks has similar impacts as a shift toward online retailers of physical titles. Since our data do not include eBooks, this question will have to be answered by future research.
6.2.2. Propensity Score Matching Estimates and Parallel Pretreatment Trends.
Borders was more likely to operate in larger markets, which may lead to biased estimates if treatment and control DMAs are not comparable. To study this possibility, we compute difference-in-differences estimates using propensity scores to match treatment and control DMAs. We show results of this analysis in Appendix B in the e-companion that confirm our conclusions indicating that the exit of Borders caused only a small rearrangement from superstar titles to other less successful titles.
Similarly, the difference-in-differences estimator assumes that the experience in untreated DMAs represents valid counterfactuals for what would have happened if Borders had not closed. Evidence against this assumption would be established if the observed pretreatment patterns in outcomes for treated DMAs differed systematically from untreated DMAs. As previously shown, a visual inspection of Figure 6 suggests that the pretreatment observations appear to follow parallel trends. In Appendix B in the e-companion, we include results testing parallel trends for the complete sample and for the propensity score-matched sample of DMAs. The parallel pretrends hypothesis fails to be rejected for both the head and tail of the sales distribution, which are the most important portions of the distribution for examining the long tail hypothesis in general and for gauging the robustness of our results.
7 Discussion
Prior to the Internet and e-commerce, offline bookstores needed to determine how many titles to hold, and bookstore chains needed to determine the size distribution of bookstores. Because the market allowed different size bookstores to enter and compete with one another, we would expect a market landscape with some level of efficiency to have arisen in equilibrium given that firms were trying to maximize their profits. There was no natural physical limit to how large bookstores could be as many physical stores in other industries were larger than the largest bookstores. The arrival of the Internet allowed the possibility for online vendors to hold inventory for a much larger number of titles than normally held by typical bookstores. A question that emerges is how close the offline bookstores had come to meeting the tastes of book readers with the inventory and other business decisions they had chosen.
Our general finding is that the Internet had only a small impact on the sales distribution of book sales. Our results thus indicate that offline booksellers’ inventory, operations, and management decisions that had been honed for decades were sufficiently efficient that when e-commerce came into existence, those earlier decisions did not need to be substantially changed, contrary to the predictions of the long tail hypothesis. It turns out that the offline stores had gauged the market fairly well. Following the question of Baldauf et al. (2024) on the value of carrying additional inventory and where to cut the long tail, our results suggest that the proper cutoff for books barely changed from preInternet days. We note that this may not be true in all industries and that in the book industry, the dimension of variety increases with additional titles. This simplifies the analysis compared to industries where we might need to take account of product architecture and degree of customization (Ramdas, 2003).
Our results are related to previous work suggesting that choice overload reduces the impact of variety on sales (Rabinovich et al., 2011; Wan et al., 2012; Wang et al., 2023). Furthermore, the failure of a substantial long tail to emerge in bookselling suggests that large consumer welfare gains due to the larger choice of inventoried titles available with online shopping did not happen, contrary to one implication of long tail hypothesis as espoused by Brynjolfsson et al. (2003). The lack of large changes in the sales distribution suggest that increased retailer demand from better taste matching to obscure titles (Borenstein and Saloner, 2001) are limited or nonexistent, at least for books, because the tastes were apparently almost fully matched by the more limited selection found in offline bookstores prior to the Internet.
The actionable managerial implications of our findings are largely a negative response to the suggested changes proposed from assuming the existence of substantial sales in the long tail. Increasing product variety to accommodate a long tail can be costly and affect the manufacturing process and assortment planning (Cachon et al., 2005; Rabinovich et al., 2011; Ramdas, 2003). For instance, carrying more variety may require adapting the supply chain to accommodate low-demand products (Baldauf et al., 2024), which sometimes exhibit intermittent demand (Bi et al., 2023) or may induce consumers to make erroneous purchase decisions with the consequent costs from product returns (Rabinovich et al., 2011). Similarly, demand forecast, inventory management, and competition are different for superstar and niche products (Gallino et al., 2017; Li and Wan, 2023). However, since these implications are predicated on the existence of an important long tail, our findings suggest that advising managers in our focal industry to cater to the long tail expecting an enormous bounty of sales represents erroneous advice indeed. Furthermore, irrationally focusing on niche products can lower economies of scale in ordering (Gallino et al., 2017) and increase supply–demand mismatch costs, such as the need to offer discounts (Moreno and Terwiesch, 2017; Rajagopalan, 2013).
Similarly, our results indicate limited applicability of other operations management strategies that may be predicated on a long tail. Managers should consider avoiding potential errors from calibrating recommendation systems seeking to steer sales toward fringe products in the long tail (Fleder and Hosanagar, 2009; Kumar et al., 2014; Oestreicher-Singer and Sundararajan, 2012). For example, web designers should consider refraining from optimizing search functions or creating “long tail keywords” that focus on obscure products. Managers should reconsider physical store entry and exit decisions believing that e-commerce leads to a long tail of sales (Akturk and Ketzenberg, 2022; Samuel et al., 2020; Soysal et al., 2019; Sun and Gilbert, 2019). Entry and exit decisions may still incorporate other aspects of product differentiation from online competitors, for example, better consumer logistics, broader geographic footprint, or greater process automation. Likewise, omnichannel and showroom operations decisions should not anticipate increased demand in the long tail (Bell et al., 2015; Samuel et al., 2020). Again, other considerations, such as a more personalized shopping experience or enhanced customer support, may of course support multichannel operations.
8. Conclusion
The long tail hypothesis from 2004 predicted that an increasing online retail share would drastically change the distribution of sales in the coming years. It was based on the expectation that online retailing would grow rapidly over time and on a theory about how online retailing would lead to different and far less concentrated distributions of sales, while greater consumer choice would dramatically increase overall welfare. The formerly tiny cumulative sales of obscure titles would become a major portion of the market, and the formerly dominant hits would become relatively less important. A long tail would present new challenges for firms in their operations and decision-making, as we expounded upon in Sections 2, 3, and 7. First, in the presence of a long tail, firms would need to reevaluate their decisions related to manufacturing, inventory management, and supply chain logistics (Baldauf et al., 2024; Cachon et al., 2005; Gallino et al., 2017; Rabinovich et al., 2011; Ramdas, 2003). Second, firms would face new challenges in decision-making concerning demand planning, order fulfillment, and returns (Baldauf et al., 2024; Bi et al., 2023; Rabinovich et al., 2011). Finally, a long tail would require adapting firms’ operations concerning customer service, marketing, and data analysis (Baldauf et al., 2024; Gallino et al., 2017; Guha and Kumar, 2018; Wan et al., 2012). For instance, sophisticated inventory management techniques to handle a diverse range of products efficiently would have to be developed. More robust supply chain relationships to accommodate a larger number of suppliers would have to be established. Order fulfillment processes to balance economies of scale with diverse product demands would need to be reoptimized. Data analytics methods for personalized customer experiences over more choices would have to be updated. These factors could impact the effectiveness of existing targeted marketing strategies to reach niche markets. Furthermore, these complex adaptations to operational management would take time and expense to realize.
Although the long tail prediction had no specific deadline for realization, an implicit assumption was that it would occur as online shopping became a prevalent mode of shopping. For books, the recent large online market share suggests that this transition may already have occurred. With the passage of time since these claims were first made, and with access to both a data set capable of measuring the changing distribution of sales for much of the book industry and a natural experiment to conduct a difference-in-differences comparison, we were able to check the accuracy of these predictions for that market. While operations management must continually adapt to new market situations and digitization has indeed reshaped the retail landscape, our results suggest little to no need for firms to adjust to the long tail.
In the first of two approaches, we investigate the distribution of sales, year-by-year, over the 13-year interval of our data. Although relative measures of concentration such as the share of a given top percentage of all titles show a result clearly the opposite of that predicted, we conclude that we cannot rely on relative measures because the entry of many small titles is likely to cause misleading results. Using absolute measures provides results somewhat less incongruous with the long tail hypothesis. The changes in sales distribution, however, are fairly small with an increase in the share of obscure titles of only a handful of percentage points. Although the direction of change is consistent with the hypothesis, the size of the change is not remotely large enough to be viewed as supporting the hypothesis; however, it does support a “longish” or mini version of the hypothesis. Nevertheless, the lengthy period used for our analysis allows other uncontrolled factors to possibly confound these results.
Our second approach, consequently, is to run a difference-in-differences analysis based on the natural experiment of Borders’ bankruptcy. This event should have changed Internet usage in cities with a large Borders’ presence more than in cities with a small Borders’ presence. This comparison of cities with different degrees of Borders’ presence allows us to estimate the impact of bankruptcy-induced Internet usage change on the distribution of sales. The results from this natural experiment are consistent with the results from the analysis over time in that the small estimated effects can only support a miniature version of the long tail hypothesis. Consistent with the direction of the hypothesis, the results show slight decreases in sales of superstar titles with slight increases for other categories of successful titles. Contrary to the hypothesis, the results rule out all but a trivial increase in share for the titles considered obscure.
Because the key element of the long tail hypothesis is its large size, we must conclude that it fails. The longish tail hypothesis is very different from the long tail hypothesis. The changes in market structure and strategic advice that follows differ considerably. With no large increase in the demand for obscure products, massive investments in obscure projects are not warranted. Likewise, the absence of a large shift in demand suggests no large windfall in consumer surplus due to product variety. Of course, we do not know whether the results for the book industry will hold for other related industries. The similarities that have usually been assumed about industries dominated by a relatively small number of hits would imply that they would provide similar findings. However, such a conclusion is unsupported at this time and indicates an area for future research.
Supplemental Material
sj-docx-1-pao-10.1177_10591478251318915 - Supplemental material for Only a “Longish” Tail
Supplemental material, sj-docx-1-pao-10.1177_10591478251318915 for Only a “Longish” Tail by Stan Liebowitz, Michael Ward and Alejandro Zentner in Production and Operations Management
Footnotes
Acknowledgments
We are thankful for excellent comments from Samuel, Jayarajan, and Edmund L. Prater. Joanna Jia provided superb research assistance.
Declaration of Conflicting Interests
The author(s) declared no potential conflicts of interest with respect to the research, authorship, and/or publication of this article.
Funding
The author(s) received no financial support for the research, authorship and/or publication of this article.
Notes
How to cite this article
Liebowitz S, Ward M and Zentner A (2025) Only a “Longish” Tail. Production and Operations Management 34(8): 2331–2347.
References
Supplementary Material
Please find the following supplemental material available below.
For Open Access articles published under a Creative Commons License, all supplemental material carries the same license as the article it is associated with.
For non-Open Access articles published, all supplemental material carries a non-exclusive license, and permission requests for re-use of supplemental material or any part of supplemental material shall be sent directly to the copyright owner as specified in the copyright notice associated with the article.