
Abstract
Although safety within operational systems depends on compliance with regulations, non-compliance is common in many settings. Trucking is a meaningful industry for studying operational safety compliance given that the industry is large and important, truck accidents kill thousands annually, and such accidents collectively cost the U.S. economy billions of dollars. Although the truck driving occupation is dominated by men, significant efforts are underway to recruit more women into the profession. If women are safer behind the wheel than men, increasing their ranks could improve overall safety compliance. Building on theory and evidence suggesting that men have a greater willingness to take risky actions and break rules, we used data on 22 million truck inspections from 2010 to 2022 to identify an operational safety compliance gap between men and women truckers. Overall, men were 7.4% more likely to be cited for a major violation of rules governing working hours (known as hours-of-service or HOS rules) and 13.2% more likely to have a major unsafe driving violation. We then examined whether gap changes based on carrier size and type. We found that the HOS compliance gap is smaller for small carriers (vs. large) and private carriers (vs. for-hire), but not the unsafe driving gap. Finally, we tested whether the introduction of an intervention—electronic logging devices (ELDs) that automatically record truckers’ driving hours—closes the gap by increasing men's compliance. In line with predictions, differences between men and women disappeared after the mandate; but again, only for HOS compliance. Surprisingly, women had significantly more HOS violations in 2021 and 2022 than men—an outcome that may be tied to women truckers’ personal safety issues. In summary, the results and additional robustness checks indicate that men committed more unsafe driving violations (e.g., speeding) than women across the entire study period, while the pattern of HOS violations varied based on external events. We conclude by highlighting possible pathways for reducing the number of collisions involving trucks and thus lowering the number of fatalities and extent of economic losses.
Introduction
High levels of safety compliance within operational systems are essential. When safety compliance is lacking, more people can get injured and killed, costs increase, and the reputation of an organization suffers. For example, workplace injuries cost U.S. businesses more than $58 billion per year (Liberty Mutual, 2023). The trucking industry is perhaps the most visible example of the need for operational safety. More than 5000 people died in accidents involving large trucks in 2021—a 14% increase over 2020 (FMCSA, 2023)—and large truck crashes cost the U.S. economy tens of billions of dollars annually (Abramson, 2015). The financial consequences of highway accidents also loom over trucking companies. The public has little tolerance for carriers whose drivers are involved in highway accidents, and juries can award victims and their families tens of millions of dollars in damages—what the industry calls “nuclear verdicts” (Mahoney, 2023).
In recognition of the need for operational safety, regulators put regulations in place to prevent unsafe behaviors. We use the term operational safety compliance to refer to an employee's willingness to obey specific regulations that encourage workplace safety. Unfortunately, non-compliance with rules and regulations is common—and costly—in many settings (Pierce and Snyder, 2008). For example, rules about how much weight employees can lift are regularly broken, and the resulting injuries cost nearly $13 billion annually (Liberty Mutual, 2023). Within the trucking context, serious accidents are more likely to occur when drivers work more hours than government regulations allow or drive at excessive speeds (ATRI, 2018). Thus, the extent to which truck drivers adhere to regulations has important ramifications for carriers, the public, and policymakers (Cantor et al., 2013; Douglas, 2021; Miller and Saldanha, 2016). To help address rule breaking, monitoring employees’ behavior has become the norm in many industries (Leicht-Deobald et al., 2019), and electronic monitoring provides enhanced oversight to ensure that employees are in compliance (Staats et al., 2017).
Given the interest in gender-based differences within operations management research (e.g., Anderson et al., 2023; Ma et al., 2021; Tang et al., 2021), we were surprised to not identify any past inquiry on the influence of gender on operational safety compliance. One possible explanation is that most operational occupations, including trucking, traditionally have been dominated by men (Torre, 2019). However, labor shortages in traditionally “masculine” operational jobs have led companies to actively recruit women, and the trucking industry serves as a noteworthy example. A critical shortage of qualified drivers has become a policy concern, so much so that federal legislation was passed to provide funding to help recruit and retain women drivers (Lockridge, 2021). As a result of this effort and others, the proportion of women truckers has increased, albeit slowly, over the last decade (Scott and Davis-Sramek, 2023).
These developments, as well as the size of the trucking industry (over $940 billion in revenue in 2022) and its central role in the economy (trucks move over 70% of all freight 1 ), make it important to quantify the role of gender in operational safety compliance. Our study is not intended to provide a theoretical contribution regarding gender-based differences. Past evidence indicates that women behave more safely in a variety of tasks (e.g., Eckel and Grossman, 2008; Franke et al., 1997; Jaffee and Hyde, 2000), and we expect this to generalize to truck driver behavior. However, the size of the effect is important. To the extent that women truckers exhibit better operational safety compliance than men, this creates even more incentive for the relevant stakeholders to work together to change industry norms and make the truck driving profession more appealing to women. This leads to our first research question: Is there an operational safety gap between men and women truck drivers and, if so, what is the magnitude of the gap? Our interest lies not only in whether a gap exists, but also in the size of the gap and whether it differs between major and minor violations. Using publicly available data and data obtained via Freedom of Information Act (FOIA) requests to the Federal Motor Carrier Safety Administration (FMCSA), we examined two distinct types of safety compliance violations—excess driving hours and unsafe driving—from 2010 to 2022. Consistent with our predictions, men were 7.4% more likely to have a major violation regarding working hours and 13.2% more likely to have a major unsafe driving violation.
While the public sees big trucks on the highway that generally all look alike, it is important to note that the trucking industry is heterogenous. Carriers can be classified in different ways, and different types serve several different purposes. One possible result of these differences is significant variation in carrier scale, resources, and technological investments in monitoring capabilities, which can affect operational safety compliance (Cantor et al., 2016; Miller, 2017). If so, there could be regulatory implications related to which carriers should be subject to more inspections. Beyond our fundamental goal of establishing the magnitude of the safety compliance gap between men and women, the heterogeneity among carriers led us to ask a second research question: Do carrier size and carrier type influence the operational safety compliance gap between men and women and, if so, how? 2 We found that the gap between men and women who are employed by small carriers and private carriers narrows for working hour violations, but not for unsafe driving. That is, a man's likelihood of violating safe driving regulations is consistent regardless of what type of carrier employs him.
Finally, the trucking industry context allows us to examine whether a monitoring intervention influences the compliance gap between men and women. A regulation that went into effect in December 2017 requires trucks to be equipped with a device that tracks a driver's working hours, and Scott et al. (2021) found that the requiring these electronic logging devices (ELDs) increased operational safety compliance rates across the industry. While interventions using electronic monitoring have shown their effectiveness (e.g., Staats et al., 2017), we take an important next step by examining if gender-based differences in compliance exist after a mandate. If enhanced electronic monitoring increases the operational safety compliance rate of men to be equal to that of women, this would suggest that mandating technology, or companies choosing to make early investments in technology, could have significant benefits—especially in occupations like trucking, which are dominated by men. This leads to our third research question: Did the industry-wide mandate requiring enhanced electronic monitoring close the operational safety compliance gap between men and women? We found that in the second year that the ELD mandate was in effect, the compliance gap closed for violations of working hours regulations, but there was no spillover effect to an unmonitored behavior: unsafe driving. Men remained more likely to violate unsafe driving regulations throughout our study period. However, in 2021 and 2022, women who worked for small carriers had significantly more work hours violations than men, perhaps due to safety concerns created by a shortage of safe parking options.
Overall, this research extends the literature on operational safety compliance. While previous studies have examined gender-based differences in outcomes such as accident and injury rates (e.g., Cantor et al., 2013), enhanced knowledge about what factors influence safety compliance can help prevent future accidents (Miller, 2020). While there is operations management research on gender-based differences in managerial behavior (e.g., Wowak et al., 2021; Kumar et al., 2020; de Véricourt et al., 2013), much of the focus across business disciplines has been differences related to pay (e.g., O'Neill, 2003) and selection for top management positions (e.g., Fernandez-Mateo and Fernandez, 2016). This study contributes to this important dialogue by focusing on gender-based differences in the execution of operational work by employees who hold operational roles and are directly responsible for operational outcomes.
Background
Safety Compliance in Operational Occupations
Safety in operations has long been of interest to researchers because of its impact on a variety of firm and employee outcomes (Brown, 1996; Cantor, 2008). Workplace safety has been positively linked to productivity (Pagell et al., 2014, 2015), product quality (Das et al., 2008), and the likelihood that a firm will survive over time (Pagell et al., 2020). Safety is especially important in operational (“blue-collar”) occupations since these are generally more hazardous than professional (“white-collar”) jobs. Given this important aspect, safety has been examined in the manufacturing (Brown et al., 2000; Wiengarten et al., 2019), warehousing (de Koster et al., 2011; de Vries et al., 2016), and transportation settings (see Douglas, 2021 for a recent review of the literature).
To the extent that workers comply with safety regulations, the likelihood of adverse events such as accidents is reduced (Battmann and Klumb, 1993). Because reaching full compliance or even meaningfully increasing compliance can be elusive (Martin et al., 2013), companies rely on monitoring employee work activities (Ball and Margulis, 2011). Following its introduction late in the last century, electronic monitoring has evolved and advanced to become a low-cost and efficient means of tracking and improving behavior (Leicht–Deobald et al., 2019). For example, electronic monitoring has been found to increase healthcare workers’ likelihood rate of washing their hands (Staats et al., 2017) and truckers’ compliance with work-hour regulations (Scott et al., 2021). However, whether the effectiveness of electronic monitoring varies with key individual and firm characteristics remains unknown.
Our study adds to research related to safety compliance, and the trucking industry provides a valuable context to compare safety compliance behaviors between men and women. If women are indeed more likely than men to comply with operational safety rules, one implication is that recruiting more women would increase overall compliance levels. We also examined whether the extent of the differences between men and women (i.e., the operational safety compliance gap) is context dependent. Carriers in the trucking industry are different—with size and type (for-hire vs private) serving as two distinctions—and examining these characteristics allows us to gain a more nuanced understanding of gender-based differences in an industry that depends on driver compliance with safety regulations to protect road travelers.
Safety Compliance in Trucking
Safety violations committed behind the steering wheel of a truck put other people in harm's way. Given the size of the industry, the stakes are high. Trucks haul billions of tons of commercial goods in the United States every year—far more than any other form of transportation (Acocella et al., 2020). Millions of workers are employed as truck drivers and in support roles such as truck maintenance, repair, and dispatching staff (Balthrop, 2021). Since truck safety affects the public— accidents involving trucks kill thousands of people and injure more than 100,000 in a typical year (FMCSA, 2023)—it is regulated by the federal government. The U.S. Department of Transportation (DOT) sets and enforces policy on transportation safety via the Federal Motor Carrier Safety Administration (FMCSA). For example, the FMCSA requires transportation firms (carriers) to maintain their equipment to specified standards, drive in accordance with the rules of the road, and comply with regulations related to work hours, or “hours-of-service” (HOS) rules. Regarding the latter, drivers are allowed a maximum of 11 hours of driving time in a 24-hour period, after which a rest period of 10 hours must be taken.
A safety mandate implemented in December 2017 requires truck drivers to use ELDs to automatically track their working hours. The mandate requires drivers without a properly functioning ELD to cease operating until they acquire one. Since cheating is significantly more difficult with ELD technology when compared to falsifying a paper logbook, the mandate increased the likelihood of inspectors being able to detect HOS violations. Scott et al. (2021) found that this monitoring technology is effective since the mandate decreased the overall incidence of HOS violations.
One hotly debated potential regulation from the FMCSA would require trucks to be equipped with speed limiters that prevent them from driving over a pre-set velocity (Cannon, 2023). Highway safety advocates are also calling for mandates to require sensors and cameras inside truck cabs to detect distracted driving and driver fatigue. Although this enhanced safety technology has not been mandated, some carriers are making significant investments in these systems in anticipation of possible mandates, as well as to decrease the number of highway accidents.
Women in Trucking
A persistent shortage of truck drivers undermines supply chains’ ability to efficiently deliver goods (Adler, 2020). One reason for this shortage is that few women enter the profession, which is not uncommon for blue-collar jobs (Torre, 2019). Trucking appears to be a classic case of gender segregation, which Barbulescu and Bidwell (2013: 737) define as “the tendency for women to work in systematically different occupations and industries than men.” Both potential employees and employers tend to contribute to gender segregation. In terms of employee-based factors, Barbulescu and Bidwell (2013: 737) found that “women's preference for jobs with better anticipated work–life balance, their lower identification with stereotypically masculine jobs, and their lower expectations of job offer success in such stereotypically masculine jobs,” which helps explain why women in their study “were less likely than men to apply to finance and consulting jobs and more likely to apply to general management positions.” In our context, many women may avoid trucking because the profession is stereotypically masculine, a characterization that is reinforced in depictions of truckers in popular culture, and because many trucking jobs require substantial time away from one's home and family.
Regarding employer factors, research suggests that “women face substantial barriers toward being hired into certain positions because of unconscious employer stereotypes” (Barbulescu & Bidwell 2013: 737). It is not difficult to imagine women applicants being turned away by hiring officers at trucking companies based on the long-standing stereotype that truckers are men (Scott & Davis-Sramek, 2023). Thus, consistent with the conclusions of research on gender segregation, it seems likely that both the preferences of individuals and employers contribute to trucking's status as an industry overwhelmingly dominated by men.
As shown in Figure 1, today less than 5% of truck drivers are women (Scott and Davis-Sramek, 2023), although their numbers are increasing over time. Congress passed legislation to bolster hiring efforts and provide additional support to encourage more women to enter the profession (Lockridge, 2021), but it will take time to see significant results. This leads to an important motivation for this research. If women have higher compliance rates 3 and are safer drivers, then improved highway safety could be a positive unintended consequence of company-based and public policy initiatives to attract more women to the profession.
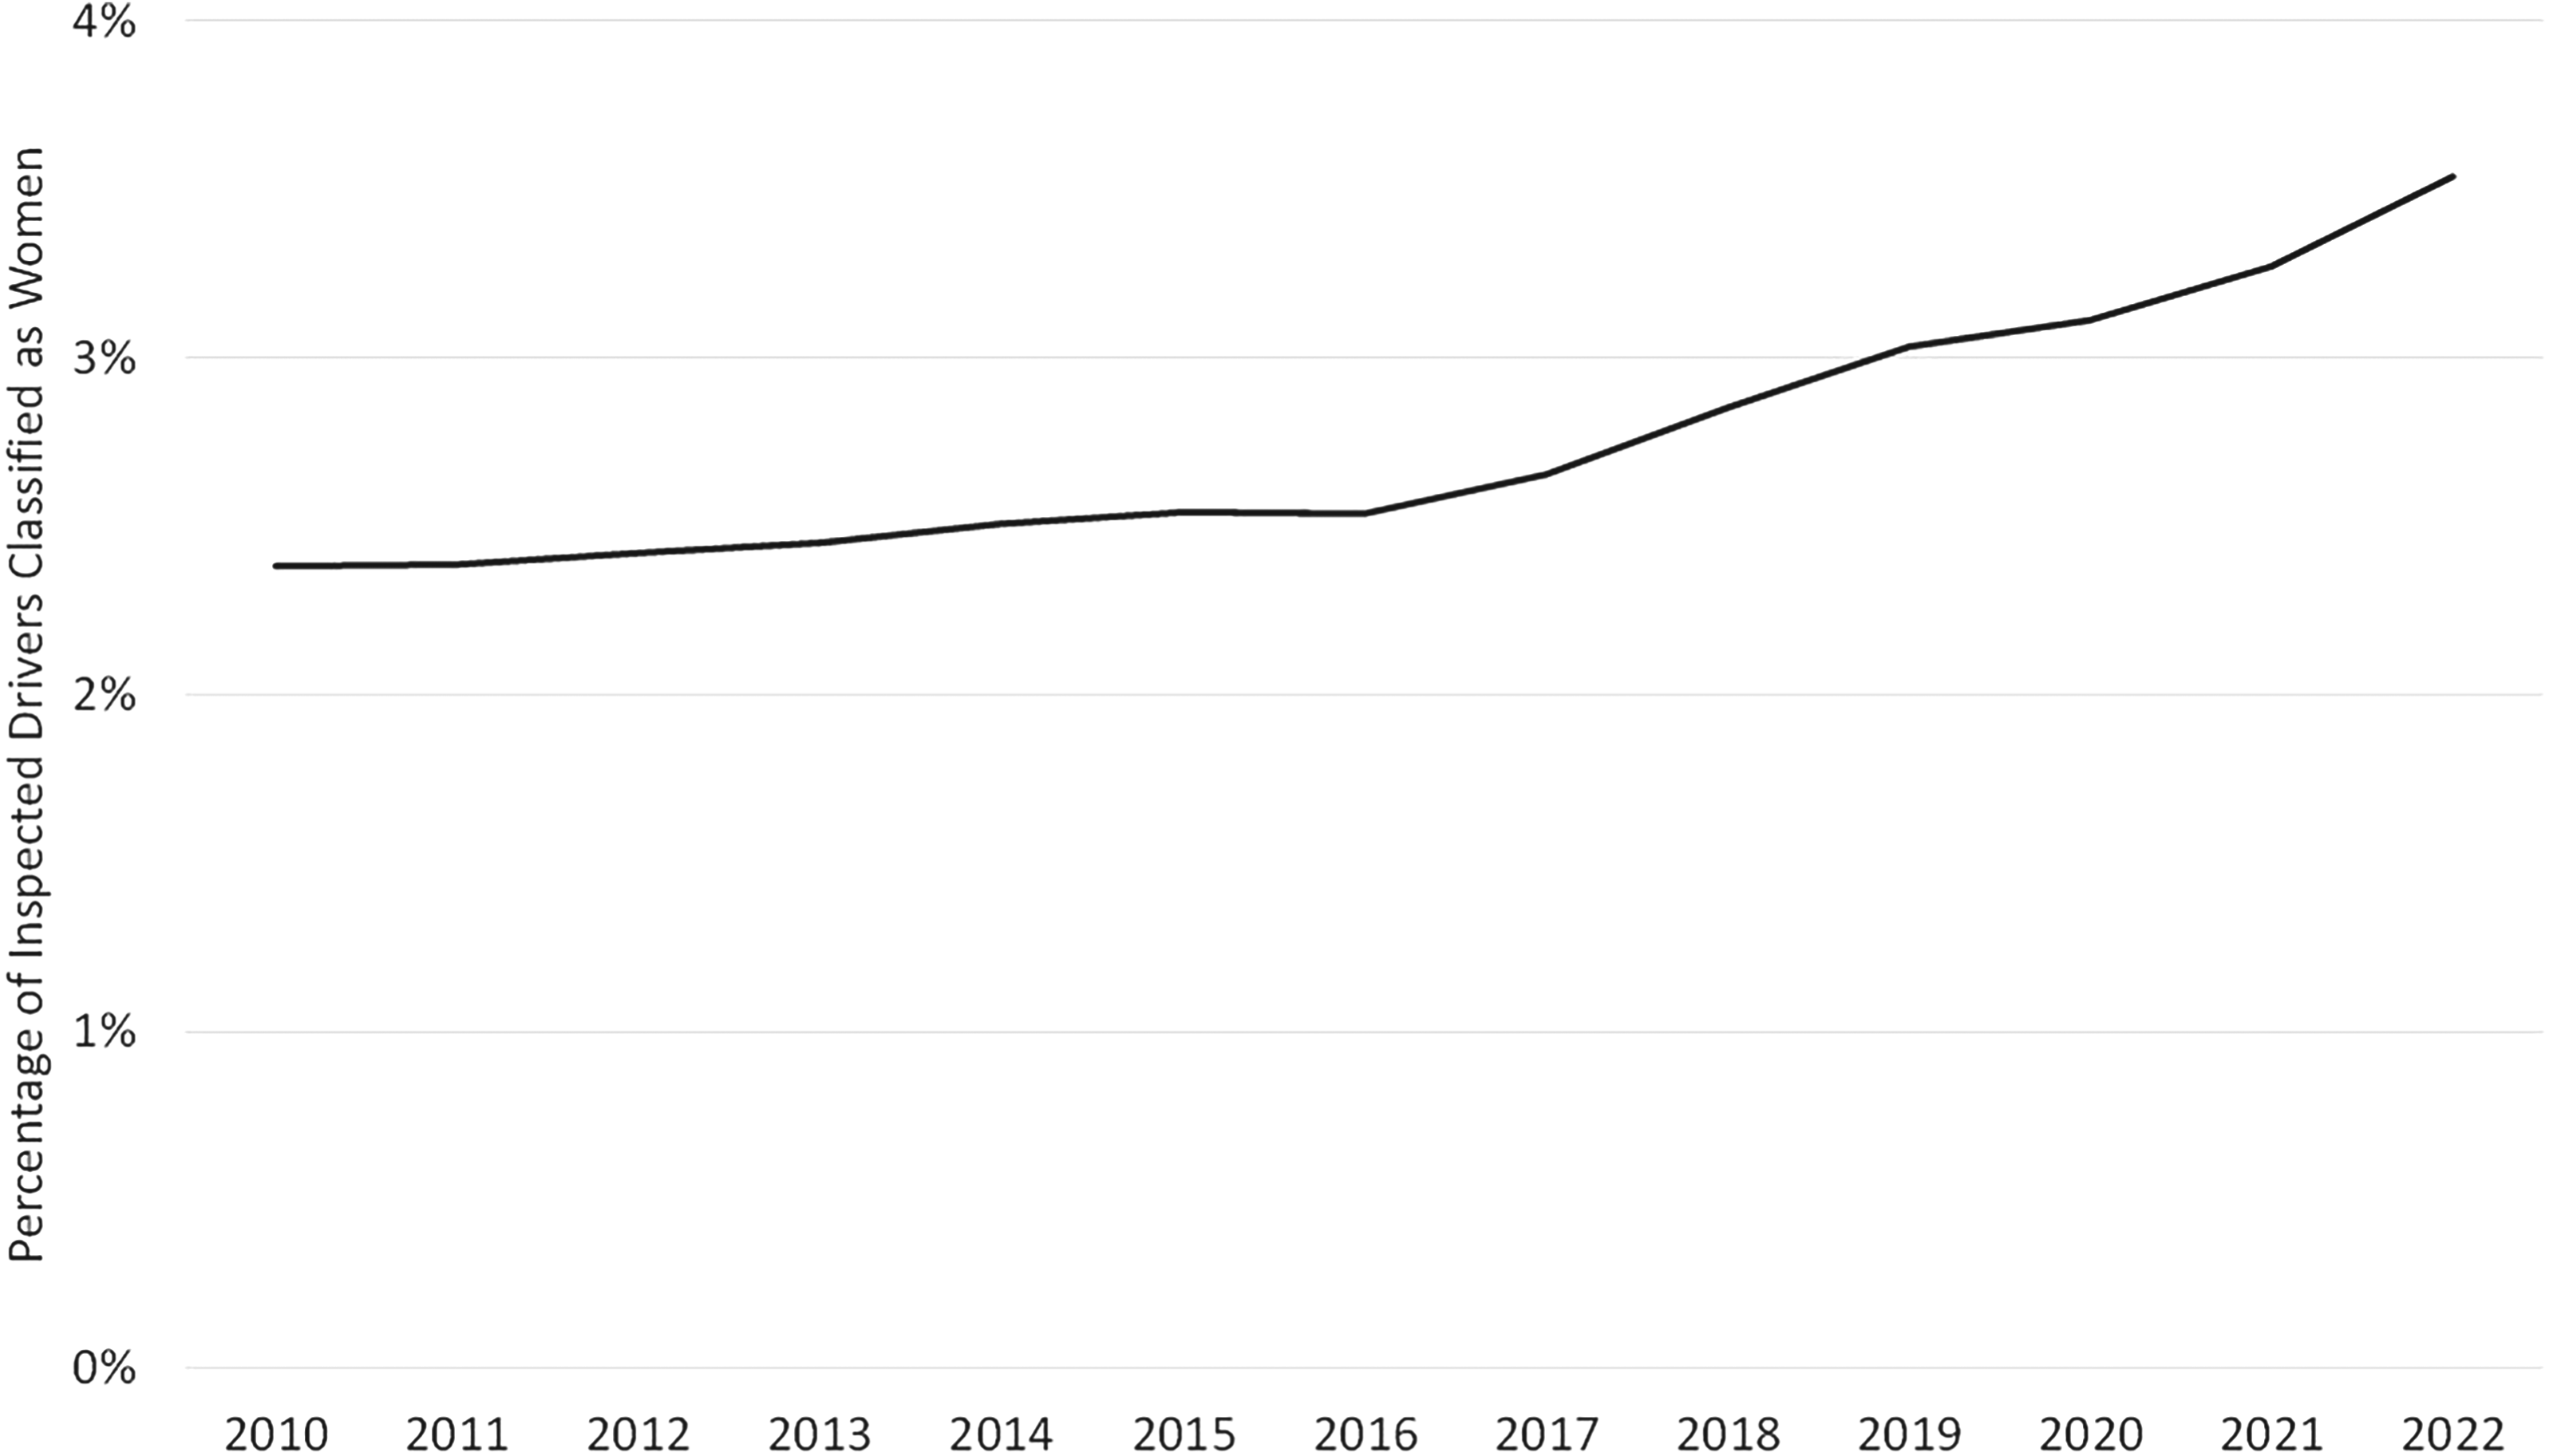
Percentage of inspected drivers classified as women over time.
Gender-Based Differences in Operational Safety Compliance
As early as the 1950s, researchers observed that men and women behave differently within organizations (Green and Melnick, 1950). The implications of these gender-based differences have been studied within fields such as psychology (Franke et al., 1997), marketing (Darley and Smith, 1995), and management (e.g., Gupta et al., 2020; Post and Byron, 2015; Wowak et al., 2021). Investigations of gender-based differences within the operations management context add important insights. In de Véricourt et al.'s (2013) newsvendor study, men ordered significantly more inventory than women within high-margin contexts. The authors theorized that this difference arises because men “tend to prefer taking greater risks than women” (p. 86). More recently, the results of a behavioral experiment led Ma et al. (2021) to conclude that women exhibit more collaborative behaviors due to differences in how men and women value social interactions.
While most business research on gender-based differences examines managerial behavior, we consider gender-based behavioral differences within an operational occupation. Our expectation is that there is an operational compliance safety gap wherein men working in trucking have more safety violations than women. Two related bodies of work offer grounding for this expectation. The first is a research stream that has established that men are more likely to engage in risky actions than women (Eckel and Grossman, 2008). Risky behavior involves taking chances to pursue additional gains with the knowledge that bigger losses also are possible. Such behavior expands the range of possible outcomes in both positive and negative ways (referred to as upside and downside risk, respectively). While both upside and downside risk are likely in every opportunity to break safety rules, decisions depend on how individuals perceive each one, and gender appears to play a role in these perceptions. For example, Eagly and Steffen's (1986: 309) meta-analysis of 63 studies found that “the tendency for men to aggress more than women was more pronounced for aggression that produces pain or physical injury.” In a meta-analysis of 150 studies on risk encompassing more than 100,000 people, the results “clearly support the idea that” men “are more likely to take risks than” women (Byrnes et al., 1999: 377) This occurs because men tend to focus more on the potential gains of risky choices (upside risk) while believing that possible negative outcomes (downside risk) are both less severe and less likely to occur (Croson and Gneezy, 2009; Darley and Smith, 1995; Harris et al., 2006).
A second research stream highlights that men engage in more rule-breaking behavior than women. This may be due to socialization (Franke et al., 1997), evolutionary biology (Lee et al., 2017), or their interaction. This phenomenon has been observed across a variety of situations. One is pedestrian behavior relative to rules about safely crossing streets. Studies consistently have shown that men break these rules more frequently than women. For example, Rosenbloom's (2009) study of Israeli pedestrians found that men were significantly more likely to make an illegal street crossing during red lights (20.6 vs. 8.5%), as did Tom and Granié’s (2011) study of French pedestrians (18 vs. 4.1%). These gender-based differences in rule breaking have serious consequences: men pedestrians account for over 70% of injuries due to crashes (Leaf and Preusser, 1999), and they are one and a half times more likely to be killed (Joly et al., 1992).
Existing research has examined the riskiness of driving behaviors among non-professionals. For example, Lucas et al. (2017) found that men have less respect for speed limits and feel more comfortable than women driving when tired or after consuming alcohol. There also is evidence to suggest that men are more likely than women to violate traffic laws and that they receive more traffic citations (González-Iglesias et al., 2012). However, we note that truck drivers’ choices related to compliance with FMCSA regulations and general traffic laws are unique from those of “everyday” drivers because their livelihood is affected by these choices. Driving without adequate rest and exceeding speed limits can get drivers to their destinations faster and increase their earnings (i.e., upside risk); however, these behaviors also make accident and fines for non-compliance more likely (i.e., downside risk). In summary, consistent with conceptual and empirical work suggesting that men are more likely to emphasize the upside risk of non-compliance and women are more likely to make choices aligned with the downside risk of non-compliance, we predict the following:
Hypothesis 1: In the truck driving occupation, there is an operational safety compliance gap such that men have more safety violations than women.
One caveat is that the research evidence supporting this hypothesis refers to overall tendencies that do not describe all individuals. In other words, although some men and women do not display the tendencies presented above, findings across several bodies of literature provide a foundation to make general assumptions that guide our hypothesizing. We also acknowledge that a self-selection process may exist whereby women who enter the truck driving profession may have certain key traits in common with men drivers, such as a higher propensity for risk-taking and fewer life constraints. To the extent that employee factors (i.e., self-selection) rather than employer factors determine which women enter the industry, the likelihood of finding gender-based differences in safety violations when testing Hypothesis 1 could be reduced. 4
Gender-Based Differences in the Severity of Violations
We expect the safety compliance gap between men and women to be accentuated when the stakes are higher. The likelihood of significant harm resulting from operational activities increases when major safety violations are involved. For example, in the trucking context, the federal government considers speeding more than 15 miles per hour (MPH) over a posted speed limit to be a major safety violation, while exceeding the limit by 1 to 5 MPH is considered a minor violation. The physics of speed and vehicle braking are such that, all else being equal, a serious accident in a 70 MPH zone is much more likely for a trucker traveling at 90 MPH than it is one going 72 MPH—it simply takes much longer for a truck to stop in the former scenario.
Referring back to the two aforementioned research streams, we suggest that a major violation is riskier than a minor violation and represents more flagrant rule breaking. Major violations offer more upside risk than minor violations; for example, driving at 90 MPH allows a trucker to reach a destination 25% faster than driving at 72 MPH. Based on findings suggesting that men tend to be guided by potential gains made possible through risky choices (upside risk) while downplaying downside risk (Croson and Gneezy, 2009; Darley and Smith, 1995; Harris et al., 2006), we expect that men will be more willing to commit major safety violations than women. Meanwhile, since the potential gains from minor violations are small, men will not perceive strong incentives to commit them. This should help make the gender gap with respect to minor violations relatively small. Turning to women, we expect that their higher risk aversion and greater rule-following tendencies relative to men will more strongly discourage them from committing major violations. As such, we hypothesize the following:
Hypothesis 2: In the truck driving occupation, the operational safety compliance gap between men and women is larger for major violations than for minor violations.
Gender-Based Differences in Carrier Characteristics
Above we built on existing theory and findings to explain why we expect a safety compliance gap between men and women truckers. We next examine whether the size of the gap varies depending on two key characteristics of trucking companies: carrier size and carrier type. These characteristics create differences in access to resources and investment in monitoring capabilities and thus seem likely to matter.
Past studies have found that large carriers have fewer safety violations than small carriers (Cantor et al., 2016; Miller, 2017; Miller et al., 2017), but there are various explanations for why. Miller (2020) reconciled these studies by demonstrating that large carriers have more resources to invest in safety compliance personnel and monitoring technologies. He also showed that large carriers are incentivized to emphasize safety compliance due to their exposure to more inspections and the reputational damage that comes from having a poor safety compliance record.
In contrast to large carriers, small trucking companies face greater resource constraints and are thus more vulnerable to problems such as economic downturns and surging fuel prices. The freight market has fluctuating prices similar to commodity goods because they are based on supply and demand conditions (Strickland, 2023). These conditions make trucking a low-margin business, and the risk of bankruptcy for small carriers looms large. For instance, a trucking recession in 2019 put hundreds of small trucking companies out of business, and in 2022, the industry saw large companies expand hiring activities while many small carriers did not survive (Premack and Hawes, 2022).
We expect that the safety compliance gap between men and women is smaller among small carriers because carrier size produces uniquely different conditions for drivers. Since scarce resource conditions can reduce the emphasis on operational safety (Meuris and Leana, 2015), small carriers are more likely to have lower monitoring capabilities and weaker compliance norms than their large competitors. Pressure to “make hay while the sun shines” can lead to the perception that the upside risk of additional revenue outweighs the downside risk of incurring the costs from additional violations. This is significant because research has found that since women's behavior is more pliable and context specific (Croson and Gneezy, 2009), women drivers’ behavior may be more malleable in an environment with less rigorous compliance oversight and monitoring.
These conditions not only expand on why small carriers would have more safety violations than large carriers (Miller, 2020), but also why the operational safety compliance gap between men and women drivers could be smaller. That is, a gap remains because men's general propensity to break the rules will result in more violations, but women driving for small carriers may be more influenced by resource constraints such that non-compliance behavior by women drivers will increase. Thus, we predict the following:
Hypothesis 3: In the truck driving occupation, the operational safety compliance gap between men and women is smaller for small carriers than for large carriers.
Another distinction in the trucking industry is carrier type. A for-hire carrier is a transportation company like Werner Enterprises that moves goods for other companies. In contrast, trucking is not the primary business of a private carrier. For example, Walmart operates its own fleet to transport goods to its facilities. This difference keeps private carriers insulated from freight market fluctuations because their trucking operations do not directly generate revenue for the company.
Private carriers are unique to other carriers in at least two other ways. First, private carriers tend to use their resources to equip their fleets with safety monitoring technology such as collision avoidance, speed limiters, and driver behavior monitoring systems before other types of carriers (Lockridge and Harlow, 2014). Second, private carrier jobs are preferred positions among drivers. Private carriers offer much higher pay than for-hire carriers and private carriers’ driver turnover rate is significantly lower (Scott and Davis-Sramek, 2023). As a result, typically only experienced drivers with clean safety records can acquire these jobs.
We predict that the operational safety compliance gap between men and women is smaller for private carriers than for-hire carriers. Private carriers’ drivers are subject to closer internal monitoring, and their higher driver pay allows private carriers to easily replace drivers that do not follow safety regulations (Lockridge and Harlow, 2014). Here the downside risk of non-compliance (i.e., potential job loss) far outweighs the upside risk of additional compensation. Although men generally focus on the upside risk (Croson and Gneezy, 2009), risky behavior for men truck drivers working for private carriers could be attenuated when they compare the magnitude of the loss to the incremental gain. As such, we hypothesize the following:
Hypothesis 4: In the truck driving occupation, the operational safety compliance gap between men and women is smaller for private carriers than for-hire carriers.
Gender-Based Differences With an Enhanced Monitoring Mandate
Our previous theorizing about differences in behavior between men and women drivers is based on research related to risk taking and rule breaking (i.e., Hypotheses 1 and 2), as well as how the operational safety compliance gap between men and women differs across carrier types (i.e., Hypotheses 3 and 4). We are also interested in how the operational safety compliance gap between men and women changes as a result of an industry-wide safety compliance intervention that requires enhanced monitoring technology. This is possible to examine because the ELD mandate puts all carriers—and, by extension, all drivers—under the same level of safety compliance scrutiny and accountability.
Historically, it was fairly easy for drivers to falsify paper logbooks that tracked their work hours. However, the ELD technology mandated in December 2017 made cheating without getting caught difficult. Any time a driver is subject to an inspection, the officer has access to the electronic log of the driver's activity and will detect any excess work hours violations. The possible penalties for non-compliance include fines and being placed “out of service” for an extended period. Carriers’ monitoring capabilities are also enhanced because they have real-time access to work hours data and a driver's location.
The mandate has been effective in that the overall incidence of work hours violations has decreased (Scott et al., 2021). Likewise, we expect that the operational safety compliance gap between men and women drivers disappeared after the ELD mandate went into effect. The increased likelihood of being caught increases the cost associated with violations. Thus, the inability to successfully cheat will lead men to become more compliant as their risk assessment shifts. Similar to the logic in Hypothesis 4, the downside risk becomes more salient when men realize that the negative consequences of being caught are not only painful but also more likely because ELDs work as intended. While this mandate is specific to enhancing compliance with work hours regulations, there could also be a spillover effect to unsafe driving violations. The presence of electronic monitoring may make drivers feel more accountable and thus alter their safety compliance behavior regarding unsafe driving when they are behind the wheel (Staats et al., 2017).
In summary, we predict that the industry-wide electronic monitoring mandate will eliminate the operational compliance safety gap because both men and women will be risk averse and more likely to follow safety compliance mandates, regardless of carrier characteristics. Thus, we hypothesize the following:
Hypothesis 5: In the truck driving occupation, the operational safety compliance gap between men and women closes after the full implementation of an industry-wide monitoring intervention (i.e., ELD mandate).
Research Setting and Data
The setting for our study is the U.S. trucking industry. To enforce safety regulations, the Federal Motor Carrier Safety Administration (FMCSA), an agency within the Department of Transportation (DOT), oversees millions of inspections of trucks at fixed locations along highways (e.g., weigh stations), during traffic stops, at truck stops, and at other locations. Our sample was 22,444,353 inspections from 2010 to 2022. During an inspection, an inspector checks whether the driver and vehicle are operating in compliance with detailed regulations. 5 If the inspector deems a driver or vehicle to be out of compliance, a violation is documented and recorded on both the carrier's and the driver's records.
The FMCSA (2021) categorizes violations into six Behavior Analysis and Safety Improvement Categories (BASICs)—unsafe driving, HOS, vehicle maintenance, controlled substances (drugs and alcohol), hazardous materials, and driver fitness—and carriers are scored on their compliance with each. We focused on the two most frequent and dangerous categories of driver violations: unsafe driving and HOS violations (ATRI, 2018). As an illustration, 17 of the 20 most frequent driver violations in 2018—accounting for 578,569 total violations—fell under these categories (FMCSA, 2020). These violations also are directly under a driver's control (Scott and Nyaga, 2019), unlike others that are typically the carriers’ fault such as vehicle and hazardous materials violations. While controlled substance violations are important and under drivers’ control, we do not focus on them because citations are rare (e.g., 419 incidents in 2018; FMCSA, 2020: 25).
Notably, violations vary in their egregiousness. The FMCSA assigns “severity weights” to violations based on how much they contribute to accidents (Corsi, 2018). For example, driving “while fatigued” or exceeding the speed limit by 15 MPH or more are characterized as highly dangerous and assigned the maximum severity weight of 10 (FMCSA, 2021). Illegally parking at a rest stop is not considered dangerous and thus has the smallest severity weight of 1. Drivers are financially incentivized to commit more severe violations because most of these behaviors are also generally associated with higher payoffs for drivers. Drivers are typically paid based on how much they produce (how many miles they drive, which loads they deliver); thus, speeding or driving beyond the legal hour limits can increase their take-home pay (Scott and Nyaga, 2019). This variation in the riskiness of the behavior—both in terms of the potential safety impact on other drivers and the punishment if caught—allows us to test whether men are more likely to commit major violations than women.
Data
We first obtained FMCSA data on all tractor-trailer inspections, including all violations found during those inspections, from 2010 to 2022. While these files include every specific violation found during an inspection, they do not include the severity associated with each. To obtain the severity of each violation, we linked the violation codes from the inspection files with specific violations and their associated severity weights from the FMCSA's website. 6 We linked the inspections with the firms that were inspected using Census files from the FMCSA, which include information on all firms that are authorized to operate in the United States.
The FMCSA does not use all 10 numbers when assigning severity weights to violations. HOS violations have a severity weight of 1, 5, 7, or 10; in other words, no HOS violations have a weight of 2, 3, 4, 6, 8, or 9. Likewise, unsafe driving violations have a severity weight of 1, 3, 4, 5, 7, or 10. We defined a violation as “major” if it had a severity weight in the upper half of the range (i.e., between 6 and 10) and as “minor” if it had a severity weight in the lower half of the range (i.e., between 1 and 5). Tables E1 and E2 in our e-companion show the most frequently occurring major and minor HOS and unsafe driving violations in our data.
Our second data set was obtained via Freedom of Information Act (FOIA) requests to the FMCSA. During an inspection, the inspector records the name of the driver, but not direct demographic information. Drivers’ names are considered confidential and cannot be shared by the FMCSA, even through the FOIA process. The FMCSA agreed that it would assign gender to each observation in our dataset by following a system we created using Social Security Administration data on all births in the United States from 1880 to 2022. For example, 100% of babies named “Mary” were registered as women with the SSA. Likewise, 100% of babies named “James” were registered by the SSA as “man” (these two are the only genders listed in the SSA's data). Thus, the FMCSA categorized drivers named Mary as woman and those named James as a man, both with a probability of 100%. Drivers with names that had significant overlap were excluded from the data collection, such as “Kelly,” which is 85% women and 15% men in the SSA data. Since one's first name is not associated with major life outcomes (Silberzahn et al., 2014; Simonsohn, 2011a; Simonsohn, 2011b), excluding these drivers should not bias our sample.
Variables and Empirical Strategy
Independent Variable
We coded driver Gender as 1 (woman) if the driver's first name was 99% or more linked to women based on SSA data or 0 (man) if the name was 99% or more linked to men. This classification is consistent with previous research (e.g., Chan and Wang, 2018 used a 95% threshold). We used a restrictive classification of names to reduce measurement error associated with the name-gender classification and because most of the data were retained with a 99% threshold (90.4% of all observations). Our results do not depend on the 99% threshold. Table E3 in the e-companion displays summary statistics for Gender and all other study variables.
Dependent Variables
To capture whether an inspector found a major HOS violation, we coded Major HOS as 1 if the inspector reported an HOS violation with a severity weight of 6 or more, and 0 otherwise. 7 Minor HOS was coded as 1 if an HOS violation with a severity weight of 5 or less was reported. Likewise, Major Unsafe was coded as 1 if the inspector reported an unsafe driving violation with a severity weight of 6 or more, while Minor Unsafe was coded as 1 if an unsafe driving violation with a severity weight of 5 or less was reported.
Moderators
Size captures the size of the carrier that the driver works for based on the number of trucks reported in the Census files, which is consistent with prior research (Saldanha et al., 2014). We included dummy variables grouped into five categories (1 truck, 2 trucks, 3 to 10 trucks, 11 to 100 trucks, and 100 to 50,000 trucks). This is consistent with the FMCSA's groupings of carriers (FMCSA, 2020: 13). We excluded carriers with more than 50,000 trucks because there are no truckload carriers with more than 50,000 trucks. We also excluded carriers whose information was obviously misreported (e.g., some carriers list 99,999 trucks and 1 driver).
For-hire carriers, such as J.B. Hunt Transport, provide transportation services for other companies while private carriers, such as Walmart's private fleet, exist to move goods between facilities of their parent company. We coded For-hire as 1 if the carrier is classified as for-hire and 0 if not. We also coded Private as 1 if the carrier is classified as private and 0 if not. A small percentage of carriers (1.7% of our sample) are neither for-hire nor private. These carriers perform uncommon functions, such as exclusively hauling exempt agricultural products or U.S. mail. To reduce undesirable heterogeneity, we dropped these carriers from the analysis.
Monitoring Intervention
In December 2017, the DOT required all drivers to use ELDs to track their work hours; this was announced well in advance (Federal Register, 2015). ELDs are more difficult to manipulate than the previously used paper logbooks, thus making HOS violations easier to discover—and thereby discouraging drivers from committing them. Most small carriers waited until shortly before the deadline to comply (Miller et al., 2020), with HOS violations appearing flat before the ELD implementation deadline and then dropping considerably (Scott et al., 2021). The ELD intervention can be thought of as one where carriers had the option to use ELDs before the intervention (Cantor et al., 2016) and one in which all carriers were required to use them after. To test whether the introduction of enhanced monitoring affects gender-based differences with respect to violations, we considered the years prior to 2018 as the pretreatment period and 2018 and after as the treated period.
Control Variables
We included the percentage of owner–operators (Percent owner–operators) to control for differences in the operational rights of owner–operators (drivers who own their trucks) and company drivers. This operationalization is similar to that of Scott and Balthrop (2021). We included state-level fixed effects (State) to control for potential enforcement differences at the state level, fixed effects for the type of inspection (Inspection Type; e.g., driver only, driver and truck inspection), and year fixed effects (Year) to control for possible changes in enforcement over time.
Empirical Strategy
Since our dependent variables are binary, we relied on logit models for our data analysis. The unit of analysis is an individual inspection (i), wherein we observed whether there was, for example, a major HOS violation (Yi = 1) or not (Yi = 0). We estimated the following model:

To test the third hypothesis—that the gender gap is smaller for small carriers when compared to large carriers—we interacted Gender with the Size variable. If the coefficients associated with the larger size categories are significantly smaller than for the smaller size categories, then this would support Hypothesis 3. We used β6 to test Hypothesis 4. If the odds ratio for the interaction between Gender and Private is greater than 1, this would suggest that the gender gap for private carriers is smaller than the gender gap for for-hire carriers.
To test whether enhanced monitoring reduced potential gender gaps in compliance, we interacted Gender with the year fixed effects to examine the gap over time. We estimated the following model:

The large number of inspections and the design of the inspection system to be both comprehensive in nature and random presents empirical advantages and disadvantages. First, practically the entire population of carriers is represented; all carriers must register with the DOT and are subject to inspections. The inspection system is designed to inspect carriers who have not been inspected in the recent past via the “insufficient data” rule in the inspection selection algorithm, 8 which ensures that nearly all carriers are present in our data. Second, the inspections are designed to be unpredictable for drivers (i.e., partly, if not perfectly, random); if they were not, then drivers could take actions to avoid them when in violation (Balthrop et al., 2023). Third, inspectors typically cannot observe a driver's gender at the moment an inspection decision is made, thus reducing the likelihood of potential inspector bias with respect to gender. While the data do not include the entire population under study—i.e., observations of all drivers at all times—it is a sizable sample that represents the population at random points in time and space.
Regarding disadvantages, there is a risk when using secondary data that omitted variables rather than hypothesized effects explain the results. We took steps to reduce the risk of spurious findings. First, we ran multiple specifications with various controls, including carrier-level fixed effects and truck-level controls, in robustness checks. Second, we used multiple clustering strategies to show that the results do not depend on specific assumptions around the standard errors. Third, we performed several subsample analyses, including a subgroup for which we could evaluate the effect of experience and a subgroup that we were certain had speed limiters. Relatedly, when using a large dataset, there is a risk of finding relationships that are statistically, but not practically, significant (i.e., the effect sizes are small, but statistically significant). While practical significance is subjective, in the results section we explain why we believe the effects we found are meaningful. To be clear, the effects that we found are representative of all truck drivers in the United States, of which there are 2 to 3 million on the roads at all times.
One complication associated with the ELD mandate is that some carriers already used ELDs prior to the mandate. Pre-mandate, drivers could readily violate HOS rules by falsifying paper logbooks. That is, the use of paper logbooks is a concomitant variable with violations (Wainer, 1989)—an outcome variable stemming from the desire to violate HOS regulations in the first place. After the mandate, there was no discretion in the use of ELDs, and drivers found without an ELD were not allowed to work until one was installed. Thus, our test can be thought of as going from a regime within which there is broad discretion over how a driver reports their work schedule to one in which that discretion is removed. To control for potential differences in which carriers adopted which technologies, we included carrier fixed effects and used a linear probability model. Lastly, it is possible that women work for carriers with lower violation rates but that, when controlling for these carrier differences, there is no gender gap. If so, that is an important finding and supports our hypotheses, which would be an across-carrier finding. To address this possibility, the inclusion of carrier fixed effects controls for average differences across carriers and therefore assesses within-carrier variation.
Gender-Based Differences in Compliance
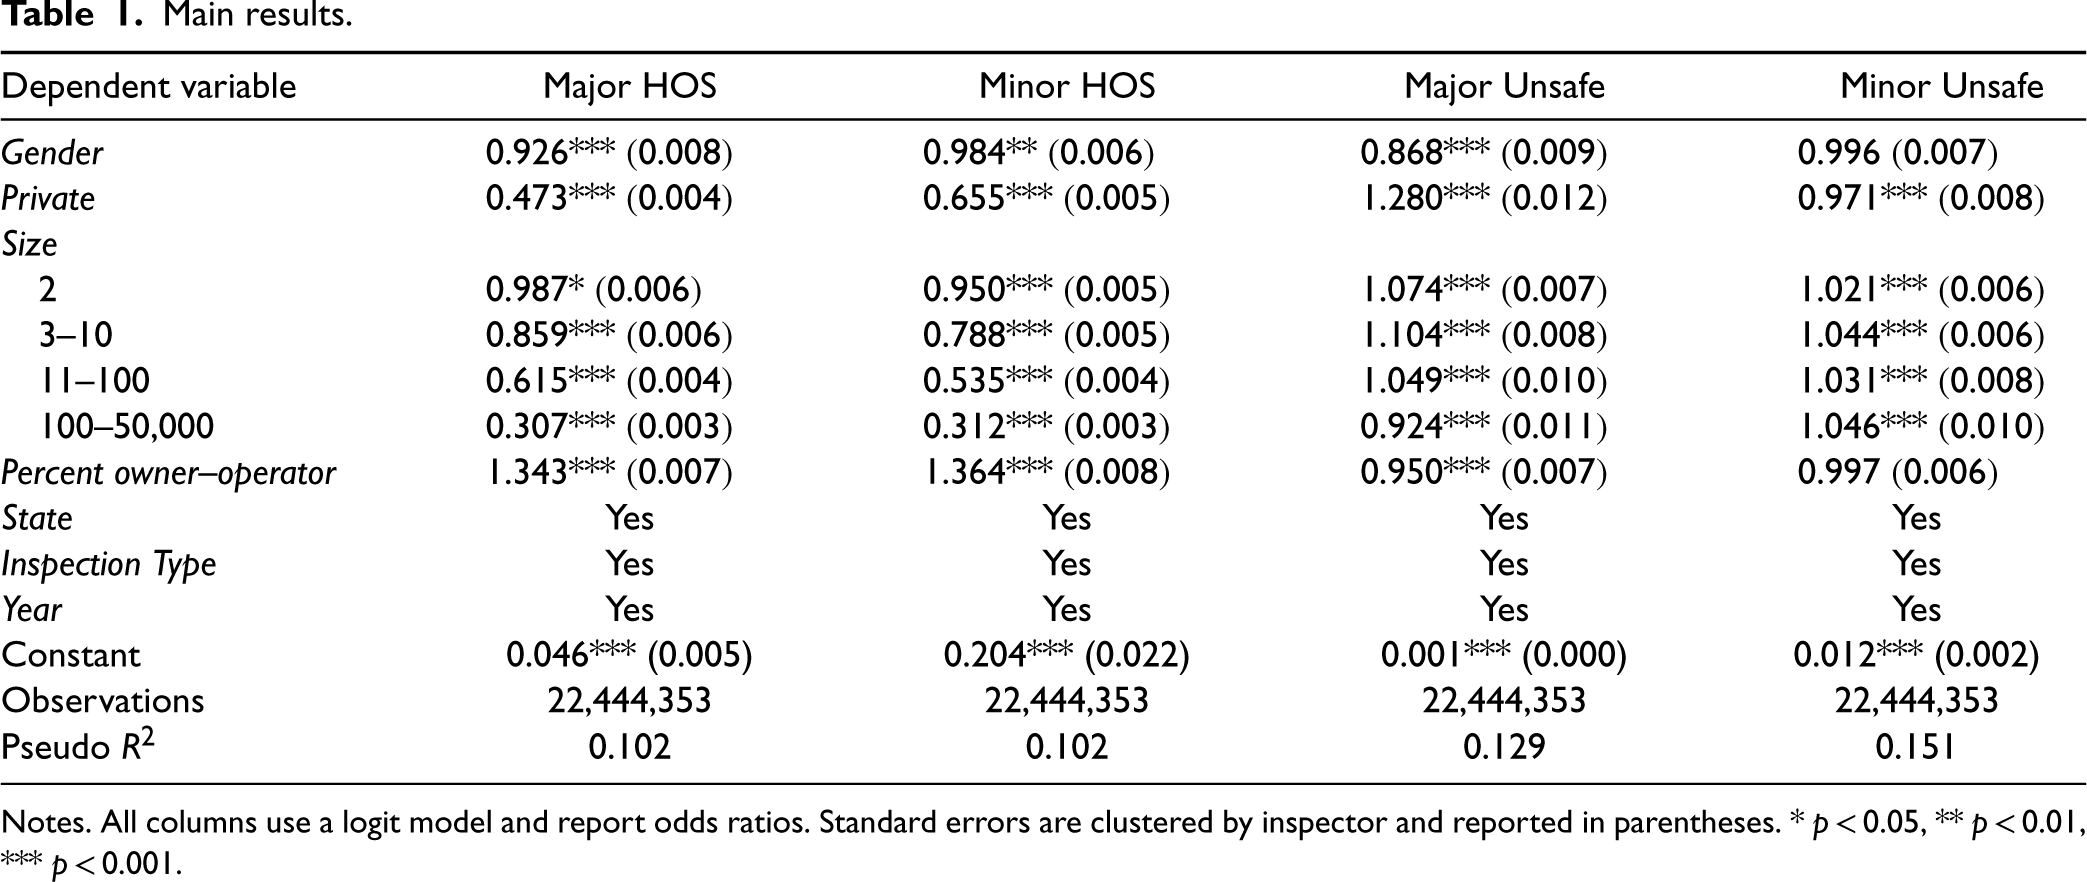
To test Hypothesis 1, we investigated whether differences in compliance exist between men and women drivers. To do so, we examined whether an inspection of a woman driver was more or less likely to have a particular type of violation. Table 1 reports the main results, including odds ratios. An odds ratio of less than 1 indicates that a violation was less likely to be found.
Main results.
Main results.
Notes. All columns use a logit model and report odds ratios. Standard errors are clustered by inspector and reported in parentheses. * p < 0.05, ** p < 0.01, *** p < 0.001.
The coefficients for the control variables are consistent with what we expected, which lends credence to the results. Larger carriers were much less likely to have an HOS violation, reflecting their tighter controls and driver monitoring (Scott and Nyaga, 2019). The percentage of owner–operators was positively associated with HOS violations than company drivers for similar reasons, which is consistent with prior research (Cantor et al., 2013). Similarly, drivers for private carriers were less likely to violate HOS than for-hire firms (the omitted category), which reflects that for-hire carriers’ drivers have more incentive to break these rules (Miller and Saldanha, 2016). Interestingly, unsafe driving violations did not follow the same patterns of HOS violations with respect to firm size and for-hire versus private firms, indicating that unsafe driving behaviors are more difficult for a firm to control than HOS violations. The differences in the probability of an unsafe driving violation between for-hire and private carriers, small and large carriers, and the percentage of owner–operators are all much smaller than for HOS violations, and in the opposite direction in some cases.
In all models except that of minor unsafe driving violations, women were significantly less likely to have a violation than men, which supports Hypothesis 1. Women were 7.4% less likely to have a major HOS violation (column 2; p < 0.001) and 1.6% less likely to have a minor HOS violation (column 3; p < 0.001). Women were also 13.2% less likely to have a major unsafe driving violation (column 4; p < 0.001), but not less likely to have a minor unsafe driving violation (column 5; p = 0.598).
In Hypothesis 2, we predicted that gender gap between men and women would be greater for major violations than for minor violations. Several pieces of evidence support Hypothesis 2. First, the odds ratio for major HOS violations is much smaller than for minor HOS violations (0.926 vs. 0.984), as well as for major and minor unsafe driving violations (0.868 vs. 0.996). Second, the 95% confidence intervals for these coefficients do not overlap. Third, we ran a seemingly unrelated regression model wherein the major and minor violations were included as dependent variables with the same predictors. This allowed us to test for the equality of the β1 coefficients for HOS and unsafe driving violations. In both models, the null hypothesis that the coefficients of the major and minor violations were equal was rejected with p < 0.001.
Since the compliance gap is larger for major violations than minor violations and because major violations have a greater impact on safety, we focused on major violations for the remainder of the analysis. In Hypothesis 3, we predicted that the gender gap would be smaller for small carriers than for large carriers. To test this, we used the model specified in equation 1 with the interaction terms. The results are reported in Table 2 with single-truck for-hire carriers as the omitted category. For major HOS violations, there is no statistically significant gender gap for carriers with a single truck, 2 trucks, or 3 to 10 trucks. Only for carriers with 11 or more trucks is there a gender gap, which is largest for the largest carriers (22.5%, p < 0.001). For major unsafe violations, the overall gender gap is large and significant (11.3%, p < 0.001). However, the size of the carrier does not have a statistically significant effect on the gender gap. These results support Hypothesis 3 for major HOS violations, but not for major unsafe violations.
Size and private interactions.
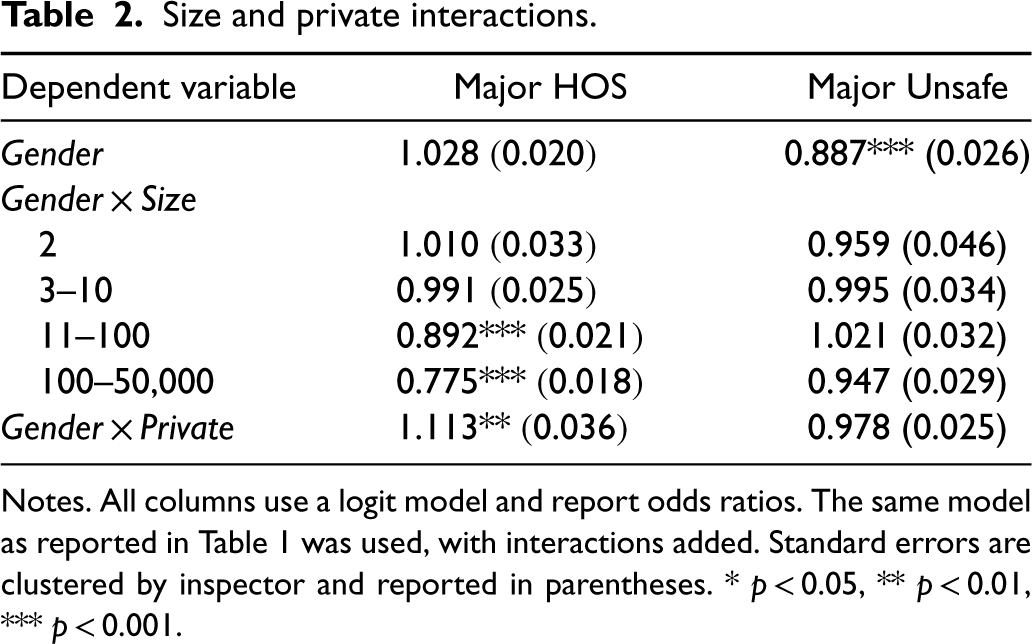
Notes. All columns use a logit model and report odds ratios. The same model as reported in Table 1 was used, with interactions added. Standard errors are clustered by inspector and reported in parentheses. * p < 0.05, ** p < 0.01, *** p < 0.001.
In Hypothesis 4, we predicted that the gender gap would be smaller for private carriers when compared to for-hire carriers. The coefficient of the Gender × Private interaction tested this hypothesis. As shown in column 2 of Table 2, the Gender × Private coefficient is larger than 1 and significant for major HOS violations. However, Gender × Private for major unsafe violations is insignificant, indicating that the gender gap is not smaller among private carriers. Similar to Hypothesis 3, the results support Hypothesis 4 for major HOS violations, but not for major unsafe driving violations.
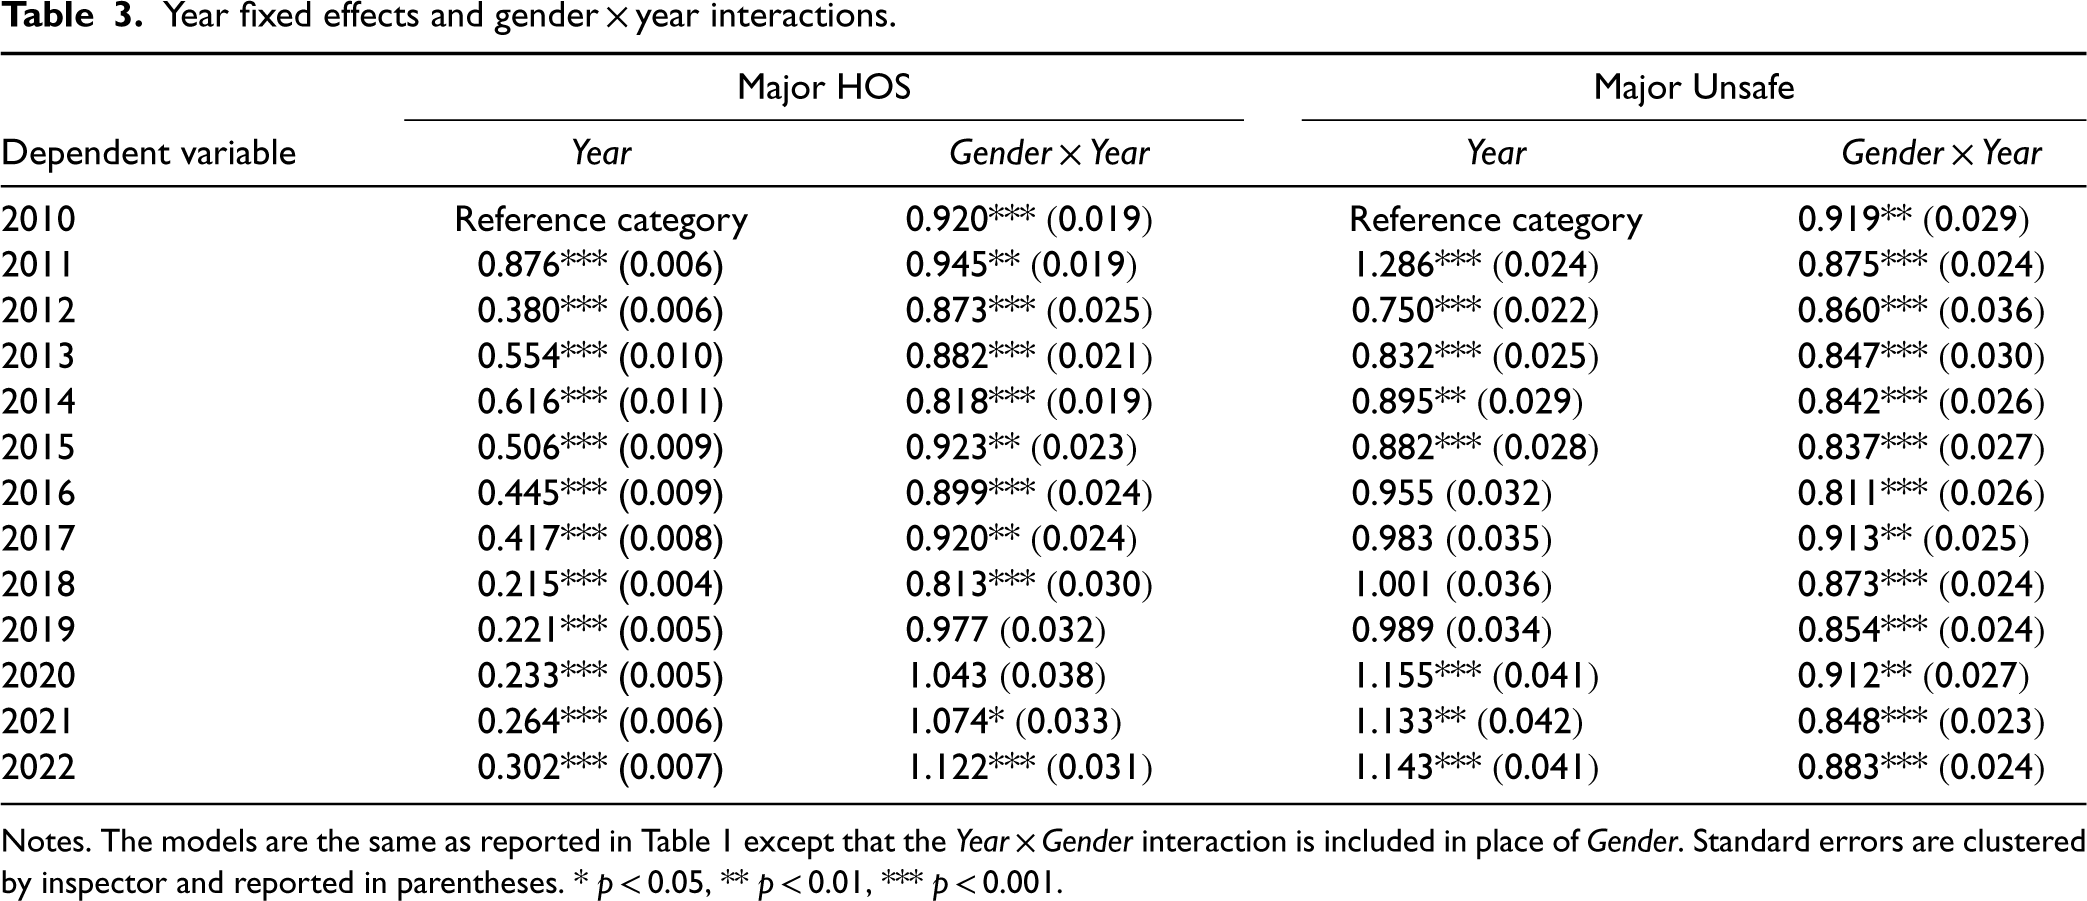
To test whether enhanced monitoring eliminated the gender-based compliance gap as ELDs became universally accepted (Hypothesis 5), we interacted Gender with the Year fixed. In this model, years prior to 2018 were the untreated years and 2018 through 2022 were the treated years because the ELD mandate went into effect at the end of 2017 (Miller et al., 2020). Although ELDs do not monitor unsafe driving, we examined whether a spillover effect from drivers being monitored closed the gender gap for unsafe driving.
First, we verified that major HOS violations declined overall during the treated years, as found by Scott et al. (2021), irrespective of driver gender. The Year fixed effects are reported in Table 3, where 2010 is the omitted year. In the Year column under the Major HOS heading, the odds ratios show a sharp decline in the year 2012, but relative stability through 2017. This initial decline from 2010 to 2012 is likely due to changes to the inspection and violation systems (Corsi, 2018; Miller et al., 2017). From 2018 to 2022, there was a substantial reduction in major HOS violations relative to years prior. The odds ratios for a major HOS violation in these five years ranged from 0.215 to 0.302 whereas in 2016 and 2017 the odds ratios were 0.445 and 0.417, respectively. Unsafe driving violations do not show a similar post-mandate decline.
Year fixed effects and gender × year interactions.
Year fixed effects and gender × year interactions.
Notes. The models are the same as reported in Table 1 except that the Year × Gender interaction is included in place of Gender. Standard errors are clustered by inspector and reported in parentheses. * p < 0.05, ** p < 0.01, *** p < 0.001.
The column Gender × Year under the Major HOS heading in Table 3 presents the odds ratios over time for major HOS violations. The coefficients of interest for the effect of increased monitoring are the 2018 to 2022 Gender × Year interactions for major HOS violations. The gender gap unexpectedly increased from 8.0% in 2017 to 18.7% in 2018; a significant difference (p = 0.001). However, this gap disappeared in 2019 and 2020 after enhanced monitoring became pervasive. The Gender × Year coefficients for 2019 and 2020 were not significant for major HOS violations, which supports Hypothesis 5. Surprisingly, the compliance gap reversed for major HOS violations in 2021 and 2022, with women being more likely to violate than men. Although we explore why this may have happened in below, the findings generally suggest that enhanced electronic monitoring can eliminate compliance gaps between men and women along the monitored dimension. In contrast, the gender gap for unsafe driving violations—which were not monitored via ELDs—persisted in the same general range (8–19%) for all years between 2010 and 2022.
Why did the major HOS compliance gap increase in 2018 and then reverse in 2021 and 2022? Concerning the first question, summary evidence suggests that men were less likely to have an ELD after the mandate took effect. An inspection for a man had a 2.00% chance of him being cited for not having an ELD in 2018 9 , whereas an inspection for a woman had a 1.65% chance. In other words, although ELDs were required, men were 22.0% more likely than women to not have one installed. Thus, it appears that men were more likely to work for carriers that did not install ELDs or were themselves more resistant to the mandate. The percentages of men and women cited in 2019 for not having an ELD were 1.16% and 0.95%, respectively, a nearly-identical 22.1% difference. However, the gross percentages dropped by almost half in 2019.
The later gender gap shown in Table 3 wherein women had more major work hour violations appears to be linked to carrier size. Women had significantly more violations, but the difference was concentrated in carriers with 10 trucks or fewer. The difference is both sizable and highly significant, in the range of 20 to 30% for these small carriers. There were no gender-based differences in 2021 and 2022 among drivers for large carriers. Our reliance on archival data prevented us from uncovering explanations within our research design. However, since we were intrigued that women drivers at small companies were suddenly committing more HOS violations than men at small companies, we drew on alternative sources to identify possible causes. We readily acknowledge that these sources were not rigorous and that the explanations we generated must be viewed as speculative. Our goal here is not to provide definitive answers, but rather to set the stage for additional inquiry.
We shared our unexpected findings with the Chief Financial Officer of a large trucking company and the founder of the Women in Trucking Association; both are women. The latter reached out to women truckers for input via a Women in Trucking social media group. Safety issues emerged from these interactions as a leading suspect. A woman trucker captured these concerns in noting, “Women truck drivers face unique challenges when it comes to finding a safe and comfortable place to park for their mandated 10-h rest. With a shortage of truck parking spaces and facilities, it's no wonder there are more HOS violations.” The freight market ramped up in 2021, but many locations—such as the distribution centers where truck drivers picked up and dropped off loads—no longer allowed drivers to park due to social distancing rules created in response to the pandemic (Wehrman, 2021). Likewise, many truck stops followed social distancing rules which reduced their parking capacity. In 2022, the parking shortage got worse as trucks moved over 500 million more tons of freight than in 2021. 10 Today, this problem still plagues the industry, and a recent New York Times exposé details the dangers created when truckers cannot find parking (Walker, 2023). Drivers face a dilemma because their only options are to violate work hours regulations or park illegally—most often on the shoulder of a road. Such parking not only puts drivers at risk of a violation, but it creates personal safety concerns for women. As another woman trucker commented, “Maybe women drive longer because they are not willing to park illegally.” When women must break one rule or the other, the findings suggest that they err on the side of personal safety.
We also asked why women's increased HOS violations were concentrated among small carriers. The women we spoke with noted that larger carriers have invested in technology and hired fleet managers to coordinate loads and take care of many trip-planning activities. For instance, fleet managers can plan their drivers’ routes around the ability to reserve parking at facilities with adequate lighting and amenities. 11 Many small carriers lack the financial and human resources to make such investments. This would seem to provide a likely explanation as to why there were no differences in HOS violations in 2021 and 2022 between men and women that worked for carriers with 11 or more trucks—those companies were better able to mitigate women's safety concerns via careful planning. Looking to the future, if parking shortages continue to put women drivers’ safety at risk, we would expect that women will be more likely to violate work-hour rules than men.
Robustness checks.
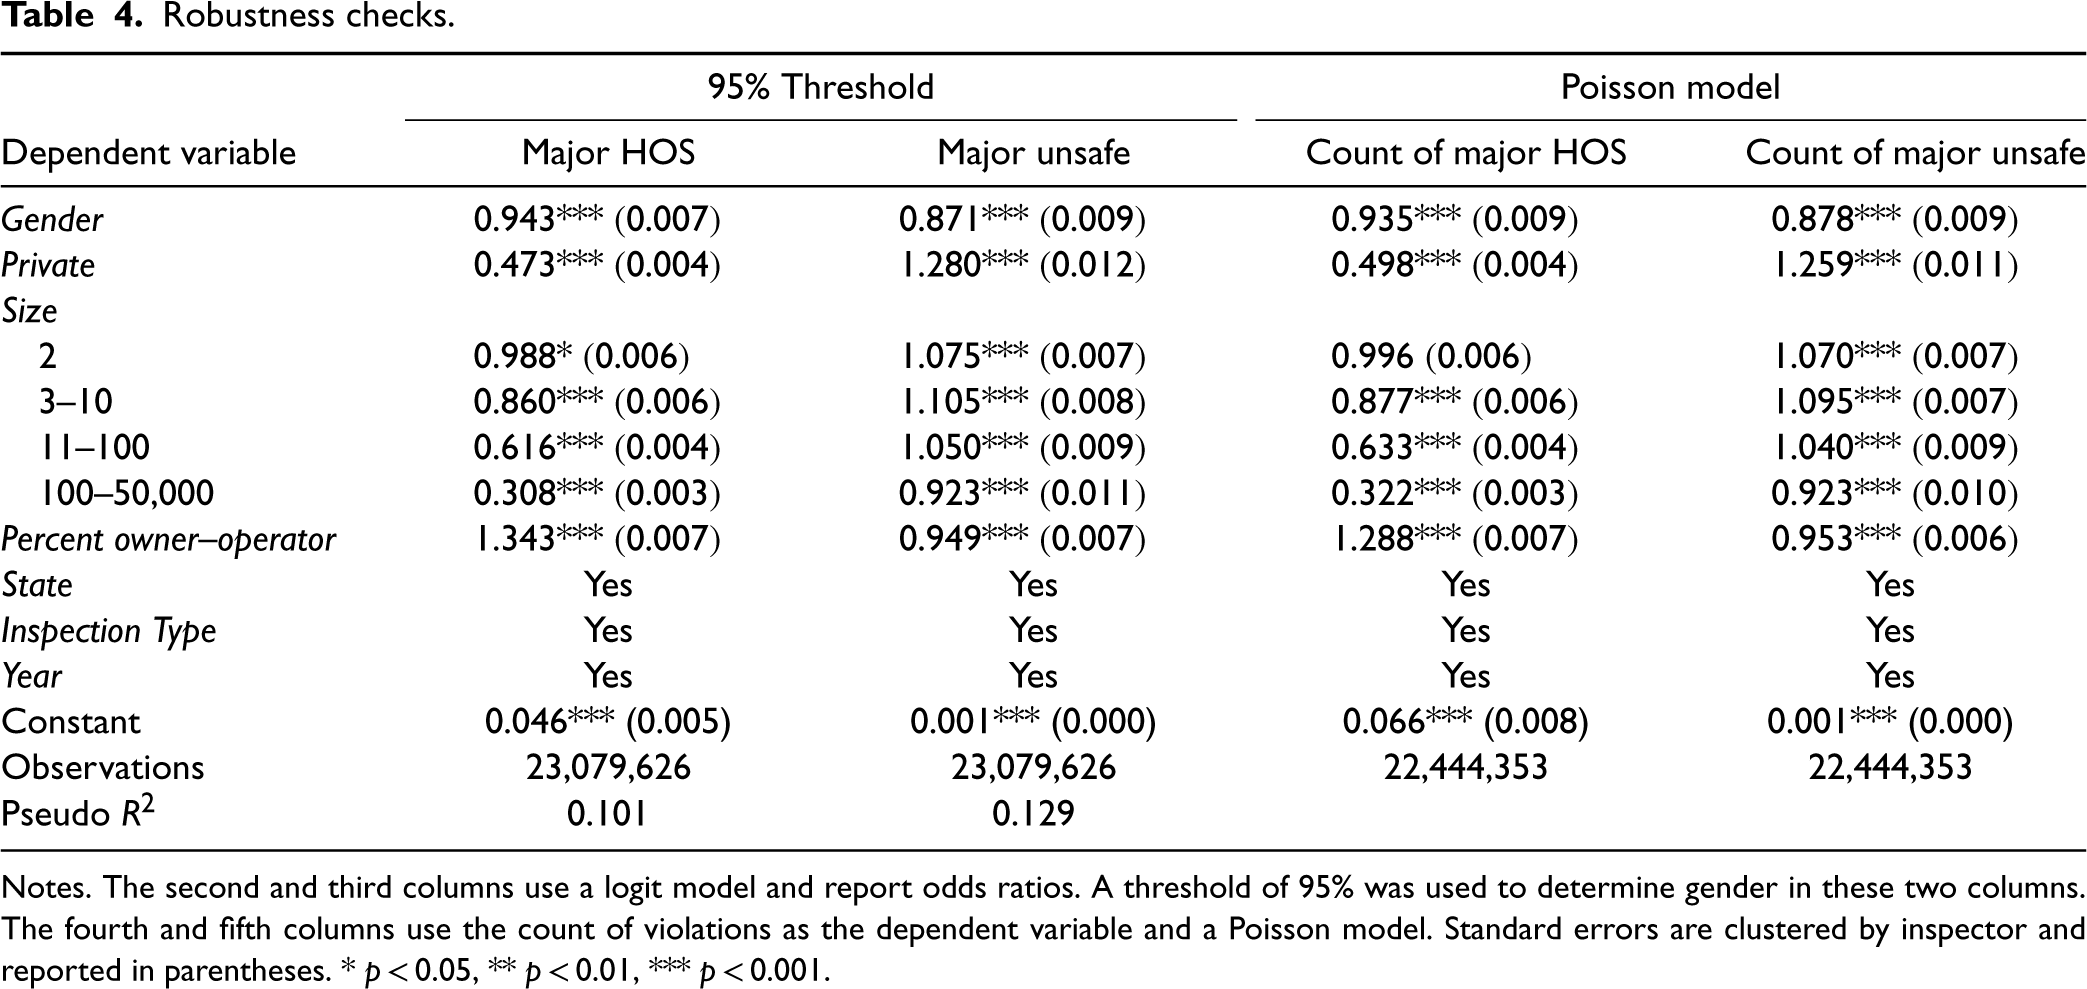
Notes. The second and third columns use a logit model and report odds ratios. A threshold of 95% was used to determine gender in these two columns. The fourth and fifth columns use the count of violations as the dependent variable and a Poisson model. Standard errors are clustered by inspector and reported in parentheses. * p < 0.05, ** p < 0.01, *** p < 0.001.
In this section, we report several robustness tests. First, men and women may operate different types and ages of trucks that could have different technologies. This could affect both the ability of a driver to work excess hours and drive unsafely (e.g., speed). To rule this out, we included vehicle controls (the model years and makes of trucks) with the results reported in the second and third columns of Table E4 in the e-companion. The results are nearly identical with respect to size and significance after including these variables. Second, more women than men may drive for firms that use technology to address speeding, which could contribute to the unsafe driving gap. To rule this out, we used the carriers identified by the Owner–Operators and Independent Drivers Association (OOIDA 2016) as having speed limiters in their truck fleet prior to 2010 as a subsample. When restricting the analysis to this group, the gender gap in unsafe driving remains both sizable and statistically significant, as seen in the fourth and fifth columns of Table E4. Thus, even monitoring unsafe driving behaviors electronically does not close the gap—men are still more likely than women to violate regulations.
Since inspectors do not record demographic information, we were unable to control for factors such as driver experience and background. It is conceivable that, as drivers gain more experience, the gender gap in unsafe driving could disappear. To identify experienced drivers, we looked at independent owner–operators (i.e., firms with one truck) and calculated their minimum experience based on when the firm was founded and the date of the inspection. For example, if an independent owner–operator was inspected in May 2018 and the driver's company was founded in May 2012, we know that this driver has at least 6 years of experience. Table E5 in the e-companion reports the results for independent owner–operators with at least 5 years of experience (second and third columns) and less than 5 years of experience as an independent owner–operator (fourth and fifth columns). The results show that, similar to the main analysis, there is no gender gap in major work hours violations. However, the gender gap for major unsafe driving violations remains both sizable and significant—experienced men are more prone to unsafe driving than experienced women.
We assumed the gender of the driver based on a 99% threshold when linking first name to gender data.
Table 4 shows the results when we used a 95% threshold instead; the results remained similar. We also used a 0/1 variable as the dependent variable. However, there could be more than one major violation found in an inspection, which results in a count variable. The fourth and fifth columns of Table 4 show a Poisson model, and the results remain the same as when we used a logit model and binary outcome.
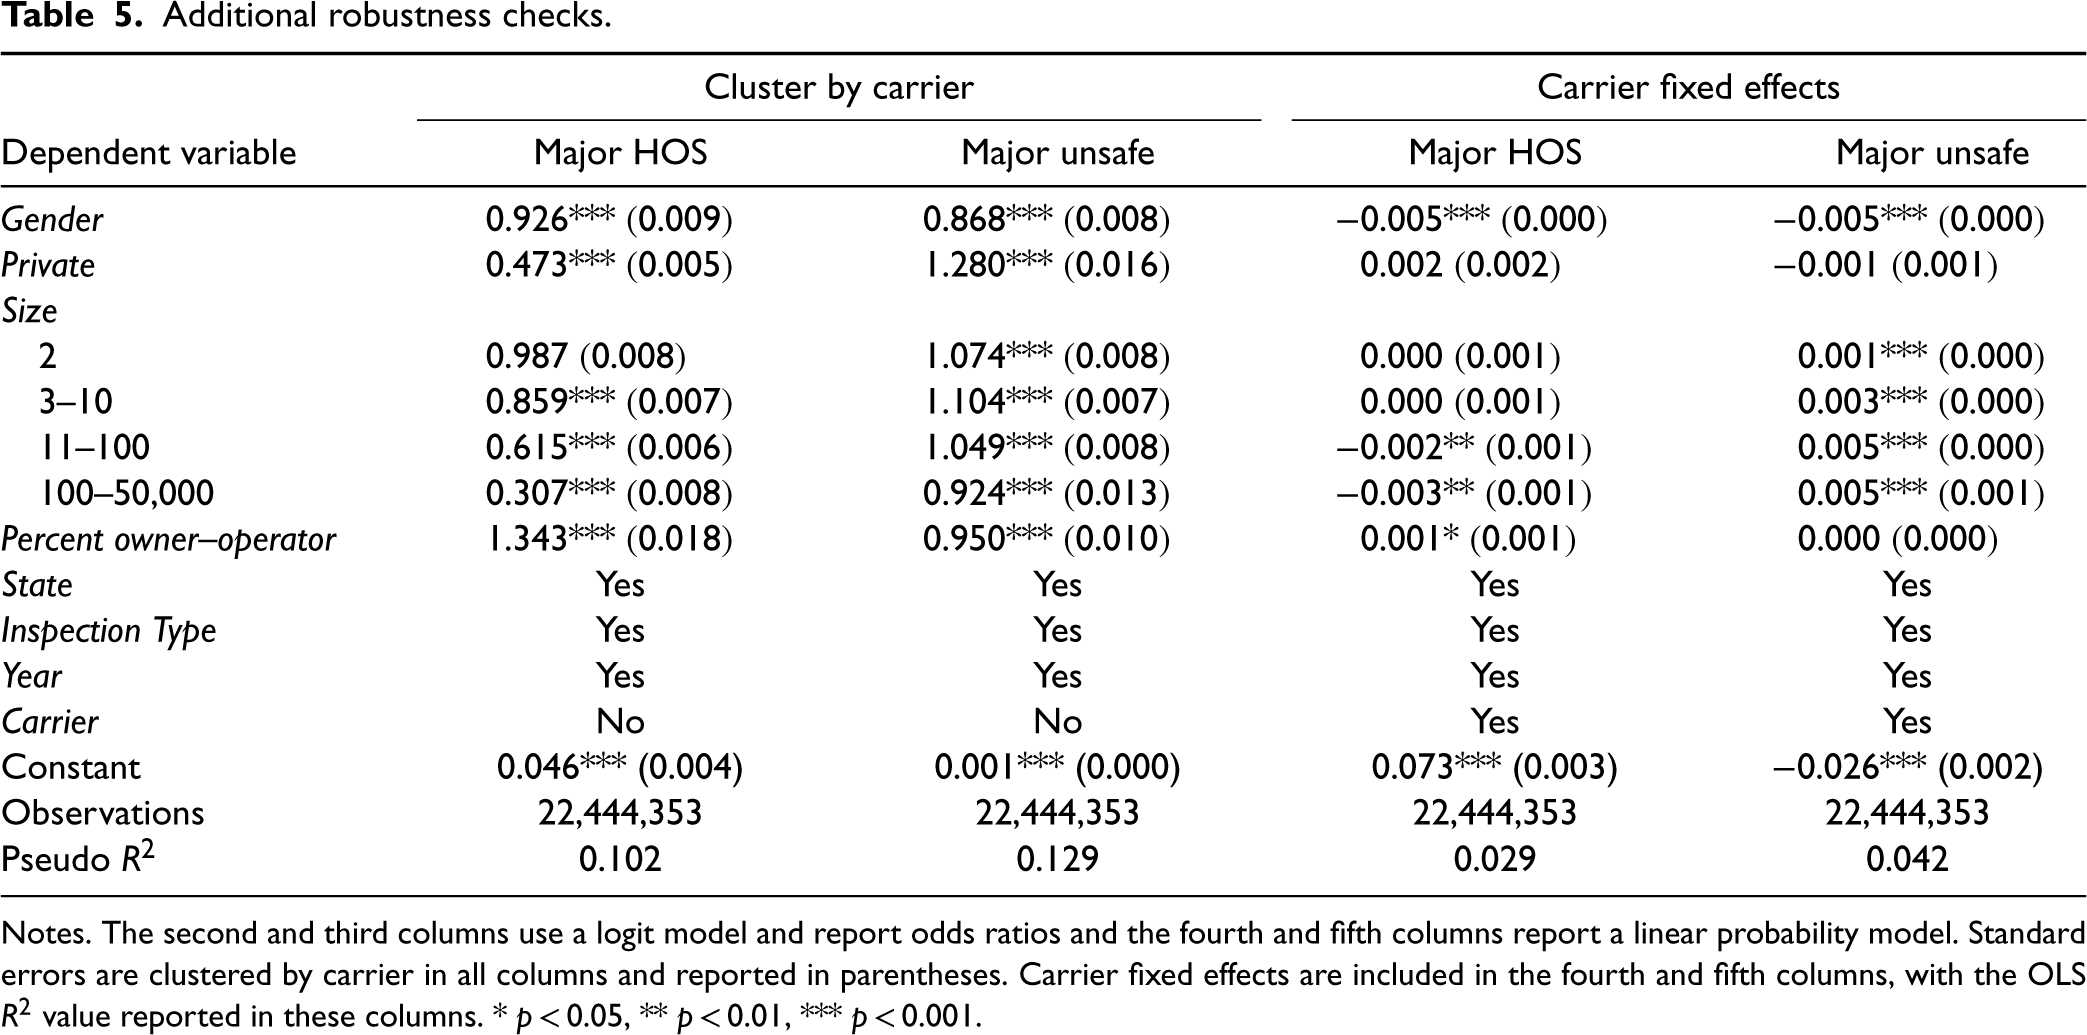
In all models, we clustered by inspector to account for potential inspector biases and idiosyncrasies. In Table 5, we report models where we clustered by carrier, and the results remained similar. To control for arbitrary differences across carriers, such as technology adoption, we included carrier fixed effects in columns four and five of Table 5 and estimated a linear probability model. When carrier fixed effects were included, the results remained the same as the primary specifications.
Additional robustness checks.
Additional robustness checks.
Notes. The second and third columns use a logit model and report odds ratios and the fourth and fifth columns report a linear probability model. Standard errors are clustered by carrier in all columns and reported in parentheses. Carrier fixed effects are included in the fourth and fifth columns, with the OLS R2 value reported in these columns. * p < 0.05, ** p < 0.01, *** p < 0.001.
As shown in Table 6, we examined how gender compliance differences changed over time when carrier fixed effects were included. Carrier fixed effects control for potential average differences in technology adoption and safety practice. They also account for the possibility that women are more likely to work for carriers with more and/or better safety equipment and practices. The results show a similar pattern to the main results (i.e., those without carrier fixed effects). Women had significantly fewer major work hours violations prior to 2019, but then the difference disappears. For the entire study period, women had significantly fewer major unsafe driving violations. This suggests that, even if women choose to work for carriers with better safety equipment and practices than men, there are still within-carrier differences between genders.
Carrier and year fixed effects and gender × year interactions.
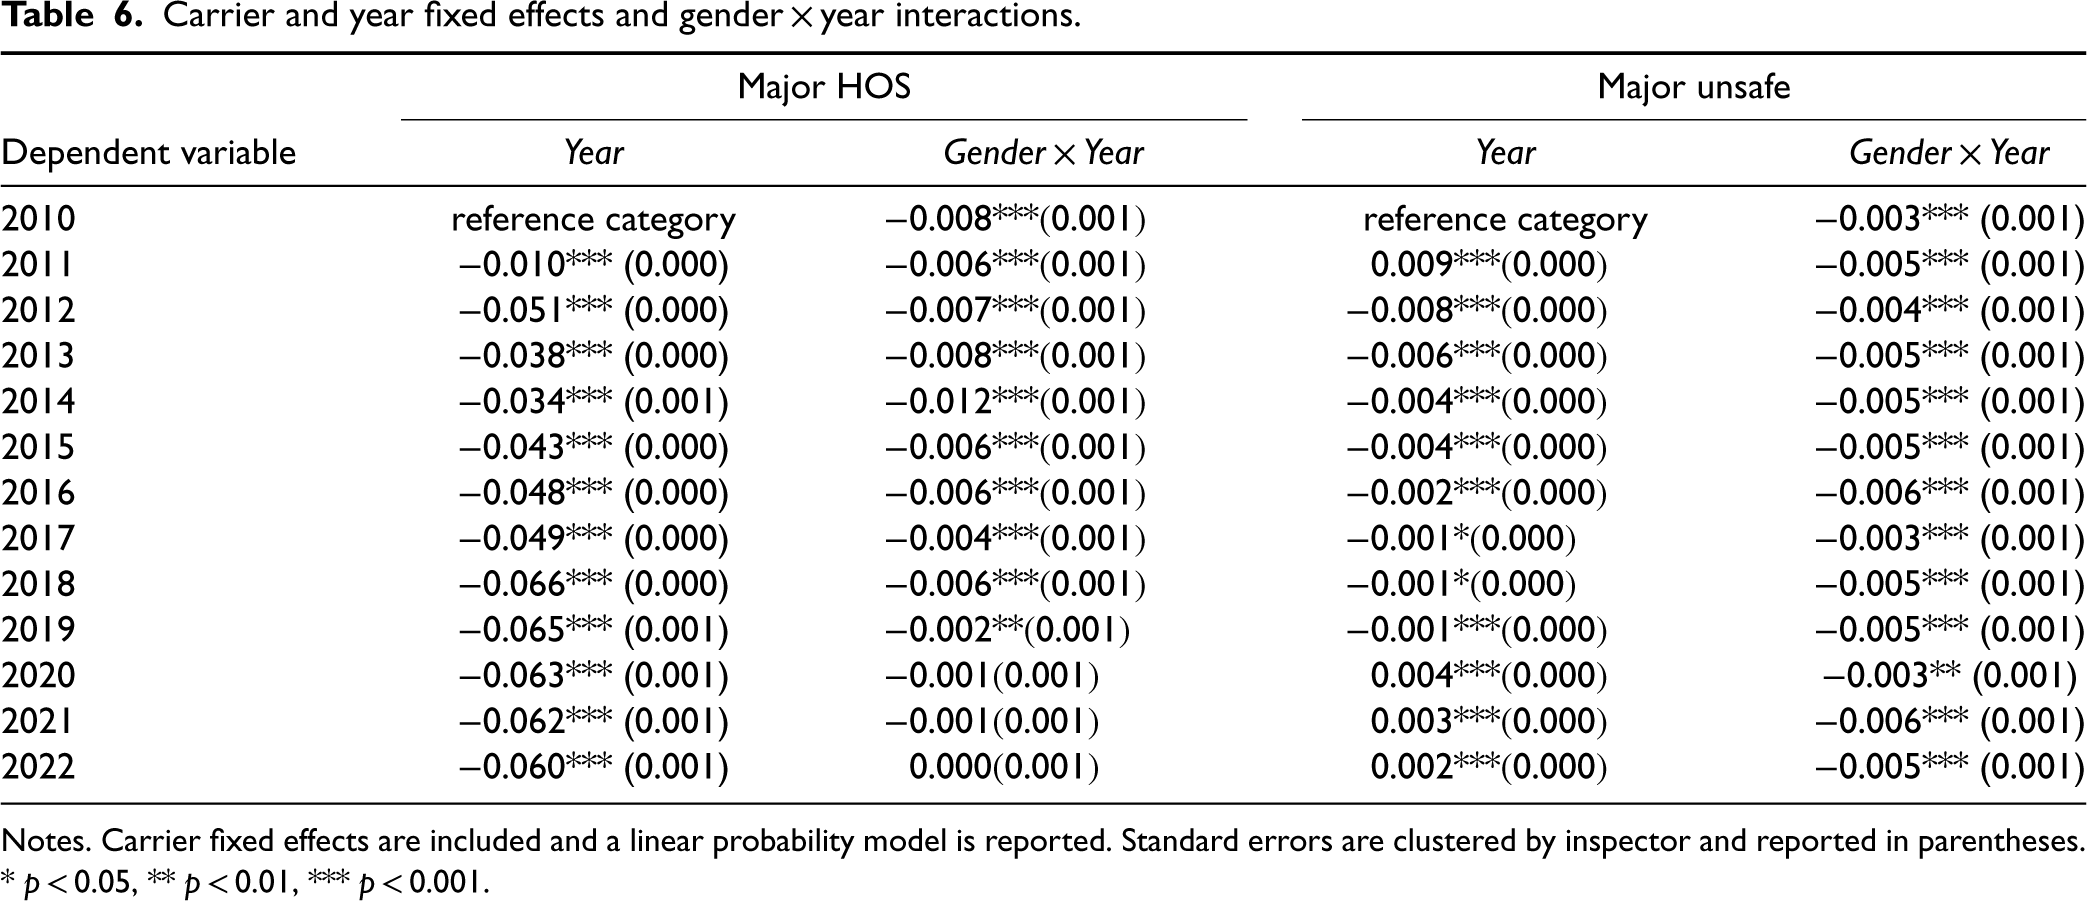
Notes. Carrier fixed effects are included and a linear probability model is reported. Standard errors are clustered by inspector and reported in parentheses. * p < 0.05, ** p < 0.01, *** p < 0.001.
Our large-scale study of safety compliance in the trucking industry revealed a significant gap in operational safety compliance between men and women truck drivers in terms of work hours, with a larger gap for more severe violations. After the ELD mandate, the gap initially increased as men appeared to resist changing with the new technology. The gap then disappeared—perhaps all drivers eventually accepted that the technology was here to stay and that violations would almost certainly be detected. In the latter portion of our study period, women employed by small carriers committed more work hours violations. While our secondary data could not uncover the reasons, women in the industry pointed to a parking shortage that has worsened. From their perspective, personal safety issues are leading women who drive for small carriers to break work hour rules that historically they have been more likely to follow than men.
The findings related to unsafe driving were straightforward. Men consistently were more likely than women to engage in risky driving behavior, regardless of the circumstances or the type of carrier, from 2010 to 2022. This is an important finding given that unsafe driving behaviors such as speeding make truck accidents more likely and more deadly. The gender gap ranged from 8 to 19% across the study period; these are sizable differences across thousands of drivers and millions of miles driven. One clear implication is that unsafe driving could be reduced by recruiting more women to be truckers, by changing men's behavior, or both.
In terms of potentially changing men's behavior, the success of ELDs in curbing work hours violations might create hope that technology such as speed limiters could close the safety compliance gap. However, it is important to note that speed limiters involve a key difference from ELDs—speed limiters can be cheated under some conditions. For instance, a speed limiter can be set to 65 or 70 MPH to prevent speeding on interstates; however, the forces of gravity that exist when coming down a hill can increase a truck's speed beyond the specified limit. Also, because current speed limiter technology does not adjust when a truck reaches a road with a lower speed limit, a driver could readily travel 65 or 70 MPH within a 45 MPH speed zone. In summary, our findings related to unsafe driving suggest that when there is an opportunity to be non-compliant and get away with it, men tend to focus on the gains (upside risk) that stem from unsafe driving and are more dismissive of the negative consequences (downside risk) that can result from violating safety rules (Croson and Gneezy, 2009; Darley and Smith, 1995; Harris et al., 2006). Since changing men's behavior appears to be difficult, increasing the number of women truckers may be a more promising pathway to reducing overall unsafe driving violations.
Research Implications
Establishing where theorizing and findings do and do not apply (i.e., finding boundary conditions) is an important task for operations management research (Craighead et al., 2019), especially when conducting industry studies. Since research in other fields has tied men to riskier behavior (e.g., Eckel and Grossman, 2008), more rule breaking (e.g., Franke et al., 1997), and lax attitudes about the welfare of others (Jaffee and Hyde, 2000), we expected to find that men would behave badly relative to women. However, we saw value in establishing the magnitude of the effect given the size and importance of the trucking industry and the harm caused by unsafe behavior by truckers.
We hope that our research will encourage inquiry into how and under what conditions gender-based differences impact safety compliance in operational contexts and blue-collar operational roles (Joglekar et al., 2016). Notably, the magnitude of the effects may be different in other operational occupations. Trucking is unique relative to many operational occupations in that truckers have significant autonomy and they work without direct human supervision, while people in other operational occupations are more closely watched by managers. Also, trucking industry's culture has long had a strong anti-authority element, especially relative to traffic laws, and there are often tangible benefits to non-compliance with driving regulations. Although our results suggest that men are more likely to be non-compliant as long as there is an opportunity to violate rules without getting caught, we wonder whether gender-based safety gaps are different under close supervision, in the absence of a renegade culture, and without financial incentives to behave unsafely.
The dynamics involved in gender-based differences in safety compliance within an occupation dominated by women—e.g., medical assistants, 90% of whom are women—are also of interest. Although research has found that women's behavior is more context specific (Ma et al., 2021), it remains unclear whether men working in occupations dominated by women are likely to adopt the risk-averse approach of the majority. Perhaps for various operational occupations, there are optimal levels of supervision to maximize both efficiency and safety that researchers could identify. If such optimums exist, we wonder if they differ by gender. There may also be combinations of genders in different roles that maximize safety (e.g., perhaps men who have women supervisors are less likely to violate safety rules than men with men supervisors).
Our research shows how interventions such as electronic monitoring can increase operational safety compliance overall. However, whether such interventions can completely close the gap between men and women seems to depend on the context. More research is needed to understand how and under what conditions a monitoring intervention can change the decision calculus. Factors that should be considered include how men and women assess downside risk (i.e., the cost of violations) based on their perceptions of the enhanced monitoring. For example, at the end of our study period, drivers appear to have been forced to factor a fundamental concern—personal safety—into their calculus due to an escalating parking shortage problem, with more women than men apparently choosing to keep driving past the allowable limit rather than resting in vulnerable locations.
Also, in our context, the monitoring intervention changed the likelihood of being caught in violation of regulations, but not the associated penalties. One logical research question is whether the same effects would be observed if penalties—and not the likelihood of being caught—were changed. Also, there was a time lag between when the monitoring intervention went into effect and when the gender-based compliance gap disappeared. Research could explore if there are conditions under which the compliance gap would decrease immediately, as opposed to the initial widening our data revealed. Finally, although we posited that work hours compliance would improve due to an increased likelihood of violations being detected, it would be interesting to learn if behavior changes due to positive consequences from compliance. For instance, would the gender gap also close if a monitoring intervention led to non-financial rewards such as better shifts or a position that is less physically demanding?
Industry and Public Policy Implications
For several years, the trucking industry has been suffering from a chronic shortage of drivers, difficulty recruiting young drivers, an aging population of mostly men drivers, a poor track record for recruiting and retaining women (Fuller, 2021; Lockridge, 2021). Another problem in the industry exacerbates all the other problems: a chronic parking shortage. The Owner–Operator Independent Drivers Association recently reported that there is only one open parking space available for every 11 truck drivers. 12 Bi-partisan efforts in Congress are underway to address the parking shortage. The Truck Parking Safety Improvement Act was introduced in 2023, providing $755 million over 3 years to increase the capacity of truck parking (Walker, 2023).
Regardless of its many woes, the industry faces substantial scrutiny from policymakers and the general public—and rightly so. In 2021 alone, 5149 trucks were involved in fatal crashes, 110,000 trucks were involved in crashes that led to injuries, and 379,000 trucks were involved in incidents that involved property damage (FMCSA, 2023). Although these statistics do not provide information about whether the truck driver was at fault, they do underscore the significance of ensuring driver safety compliance on the road. Some crashes have been tied to the parking shortage. In July 2023, a Greyhound bus hit three tractor-trailers parked on an exit ramp, killing three passengers (Walker, 2023).
Even with escalating legal costs for accidents (ATRI, 2020), carriers large and small struggle with the same problem: there are structural incentives for drivers that encourage non-compliance. Since most drivers get paid on a per-mile basis, breaking HOS rules and speeding can be financially rewarding. Our research suggests that recruiting more women to be truck drivers would likely result in higher compliance with safety regulations, presuming that adequate numbers of safe parking facilities are available for required rest periods. A higher level of compliance should result in fewer accidents, and fewer accidents result in lower costs. Recent legislation promotes efforts to increase the number of women truck drivers (Lockridge, 2021), and there have been industry efforts as well (Scott and Davis-Sramek, 2023). Our findings suggest that industry stakeholders should double down on these efforts. There are clear and compelling reasons to increase the number of women truck drivers: doing so would reap both social and financial rewards. Efforts should include passing the Truck Parking Safety Improvement Act or something similar. Any recruitment or retention efforts will be stymied if women do not feel like they will be safe due to a lack of safe and convenient places for them to park during the mandatory 10-h break.
The significance of safe driving and the escalating industry costs also raise the question of whether policymakers should extend electronic monitoring to other driving behaviors beyond work hours. There is currently a fierce debate about a potential mandate requiring all carriers to install speed limiters (Cannon, 2023), with concerns being raised about their limited usefulness, as discussed above. Unintended consequences are also a concern—speed limiters could cause more traffic congestion and “road rage” when trucks pass each other on the highway. 13 There are also questions about whether such mandates would exacerbate the truck driver shortage and whether small carriers could absorb the cost of the technology. We suggest that these complex questions should be resolved before decisions are made about a possible mandate.
Limitations
Our study should be considered in light of its limitations. Since the FMCSA does not collect demographic information during an inspection, we could not include drivers’ demographics other than gender (which we inferred from the first name). If age differences exist, for example, between men and women truckers on average, and if age affects the propensity to violate safety regulations, then our results would be affected by the inclusion of this demographic information. While we cannot rule this out, it seems unlikely that age would wholly account for the gender-based differences because women are likely to be newer entrants to the industry and younger drivers have been associated with more violations (ATRI, 2018). Thus, if younger drivers are more likely to violate safety regulations and women drivers are younger on average than men drivers, then our findings would underestimate gender effects when compared to an analysis that includes age. We also could not observe drivers’ work schedules. If there are gender-based differences in average work schedules, this could affect our results. Relatedly, our use of secondary data precludes us from examining the extent to which self-selection drives the entry of women into the trucking profession. Untangling the extent to which self-selection versus employer-based factors explain entry would require primary data.
We could not observe the monitoring technology being used by each driver. Since driver behavior is affected by monitoring technology, including variables such as whether the driver had an ELD before the mandate or whether the driver's truck had a speed limiter could affect the magnitude of the results. One way we accounted for these potential differences was by including carrier fixed effects, where we assumed that carriers require roughly the same technology for all of their drivers. When we did this, the results remained significant. Also, the technology that a driver adopts is endogenous to the driver. Thus, if men choose to have less monitoring technology, this is another causal pathway through which gender can affect safety compliance.
Another limitation is that truck drivers, both men and women, may not be representative of the general population. For example, truck drivers may prefer autonomy in their jobs more than the average person. Thus, generalizing our results to other occupations and settings should be done with caution. This underscores the importance of researching safety compliance in other industries to establish the boundary conditions of extant theory and findings.
Supplemental Material
sj-docx-1-pao-10.1177_10591478241235145 - Supplemental material for Men at Work…Unsafely: Gender Differences in Compliance with Safety Regulations in the Trucking Industry
Supplemental material, sj-docx-1-pao-10.1177_10591478241235145 for Men at Work…Unsafely: Gender Differences in Compliance with Safety Regulations in the Trucking Industry by Alex Scott, Beth Davis-Sramek and David J Ketchen in Production and Operations Management
Footnotes
Declaration of Conflicting Interests
The authors declared no potential conflicts of interest with respect to the research, authorship, and/or publication of this article.
Funding
The authors received no financial support for the research, authorship, and/or publication of this article.
Notes
How to cite this article
Scott A, Davis-Sramek B and Ketchen DJ Jr (2024) Men at Work...Unsafely: Gender Differences in Compliance with Safety Regulations in the Trucking Industry. Production and Operations Management 33(4): 995–1013.
References
Supplementary Material
Please find the following supplemental material available below.
For Open Access articles published under a Creative Commons License, all supplemental material carries the same license as the article it is associated with.
For non-Open Access articles published, all supplemental material carries a non-exclusive license, and permission requests for re-use of supplemental material or any part of supplemental material shall be sent directly to the copyright owner as specified in the copyright notice associated with the article.