
Abstract
Hot forming processes are extensively used to produce semi-finished and finished components. At elevated temperatures, dynamic recovery and recrystallization processes occur that enable large shape changes at low forming forces. In steel, non-metallic inclusions cannot be avoided during metallurgical processes. They may induce damage in the same way as at room temperature, but the softening of the matrix due to dynamic recrystallization may be used to control the initiation and progression of damage. Damage models do not take into account that dynamic recrystallization reduces the local stresses at the interface of matrix–inclusion. The purpose of the presented study is to analyze the interaction between dynamic recrystallization and damage initiation. Using representative volume elements, the influence of dynamic recrystallization on damage initiation is studied at different temperatures, strain rates, and stress states. Based on this study, a damage model is devised that couples dynamic recrystallization and damage on the macro level and hence can be used in macroscopic process simulations.
Keywords
Introduction
Hot forming processes are widely used in the industry to form semi-finished products and components. Elevated temperatures lower the forming forces, allow for large deformation, and for transforming the microstructure from the inhomogeneous, coarse state after casting into a dense, worked microstructure. Apart from the grain structure inhomogeneities, segregations, voids, and second phase particles (e.g. non-metallic inclusions) are the main source of microstructural inhomogeneities that stem from the casting process. Hot working processes may close pre-existing voids (Faini et al., 2018; Nalawade et al., 2016; Wang et al., 1996), homogenize the element distribution and grain size, and can, thus, improve the strength and integrity of the material. However, the presence of non-metallic inclusions may lead to additional damage.
Non-metallic inclusions are inevitable in industrially processed steels. Depending on their type, inclusion can plastically deform with the matrix or behave in a rigid manner. Especially hard inclusions may thus promote decohesion of the matrix–inclusion interface and initiate damage.
In the literature, the deformation behavior of inclusions and decohesion of the matrix–inclusion interface at elevated temperature were investigated both experimentally and numerically. Malkiewicz and Rudnik (1963) and Rudnik (1966) experimentally studied the deformation behavior of inclusions and showed that inclusions elongate along the rolling direction. Cheng et al. (2017) determined the deformation of MnO13%–Al2O318%–SiO269% inclusions by simulation and showed that at low temperature, a void nucleates at the interface between the matrix and an inclusion. Foster et al. (2007) experimentally showed the decohesion of the matrix–inclusion interface and claimed that the nucleated voids elongate along the direction of applied tensile load. Luo (2001) numerically studied the damage development under compressive loading conditions around a rigid inclusion and concluded that the tensile stresses are responsible for the matrix–inclusion interface separation. The large difference between the mechanical strength of an inclusion and the matrix causes decohesion of the interface (Luo and Stahlberg, 1998).
Apart from the damage investigations considering inclusions, the damage evolution during hot forming can be predicted using different modeling approaches. On the one hand, damage criteria such as Oyane's fracture criterion can be modified for hot forming process, by making it dependent on the temperature and the strain rate (Novella et al., 2015). Hu et al. (2015) adopted the continuum damage mechanics approach and coupled a thermo-elastic-plastic constitutive model with damage to predict cracking during hot stamping. Both models were calibrated for hot tensile tests; however, the models did not address the role of dynamic recrystallization (DRX). Yang et al. (2015) modeled the flow softening and damage behavior of the TA15 titanium alloy at elevated temperatures where the flow softening caused by modeling the phase transformation of the α- to β-phase was considered. Sommitsch et al. (2006) coupled the continuum damage model with the dynamically recrystallized volume fraction and reported the retarded damage growth due to DRX. However, their model reduces the damage variable when DRX occurs and does not take the influence of DRX on damage initiation into account. It is unlikely that DRX can heal damage when the decohesion occurs. Rather, DRX may reduce local stresses at the interface matrix–inclusion and avoid decohesion altogether.
Metallographic investigations of Shang et al. (2017) showed that the partially recrystallized (relatively coarse) grains in the vicinity of the inclusion led to higher damage, while fully recrystallized (relatively small) grains were found at inclusions which showed less decohesion of the interface.
Damage mechanisms are sensitive to the loading direction. Roux et al. (2014) analyzed the influence of loading path on the damage mechanisms at room temperature and concluded that the loading path controls damage evolution. In the literature, the damage evolution for hot forming is only analyzed under compression. However, in hot working processes, tensile stresses occur, e.g. at the outer edges of a bar or slab material in hot rolling, which promote damage initiation and growth at the matrix–inclusion interface (Lin et al., 2007).
In the literature, many previous works investigate the role of deformation temperature (Amri et al., 2017), strain rate (Dighe et al., 2000), total strain (Luo, 2001), and inclusion size (Ji et al., 2014; Zhang et al., 2013) as factors influencing the damage development. However, a detailed analysis of these influencing factors in relation to DRX has not been performed in the literature so far. For an improved damage model for hot forming, it is required to understand and model the damage initiation and growth taking coupling to DRX and the stress state into account.
As reported in the literature (Shang et al., 2017; Sommitsch et al., 2006), DRX has a beneficial influence on damage control during hot forming. It is hence required to predict the flow behavior of the material coupling DRX to damage evolution. The Gurson–Tvergaard–Needleman (GTN) damage model (Tvergaard and Needleman, 1984) is a reasonable choice to predict the material strength due to the void nucleation and growth in hot working. However, in current form of the model, it cannot be applied to hot forming process as the damage nucleation model is independent of DRX. One attempt of coupling the GTN model with DRX has been made by Shang et al., (2017) who modify the GTN damage nucleation model. The dynamically recrystallized volume fraction is used as a scaling factor, shifting the void nucleation strain. As a consequence, the maximum rate of void initiation shifts with increasing recrystallized volume fraction. This may lead to situation where DRX accelerates the damage initiation which would be inconsistent with the physical phenomenon observed so far. Moreover, the nucleation criterion in the GTN model is purely phenomenological and does not take the interaction between the matrix and an inclusion into account.
The main aim of the current research work is to analyze the interaction of DRX and damage initiation at the matrix–inclusion interface using representative volume elements (RVE) and to derive a damage initiation law that is coupled to DRX and can be integrated into macroscopic finite element (FE) simulations. A continuum based unit-cell RVE approach is used to quantify the damage evolution. The matrix dynamically recrystallizes according to the well-known Beynon–Sellars model, which is often used in macroscopic FE simulations of hot forming processes. The decohesion of the interface follows a temperature-dependent cohesive zone damage law. The influence of various factors like DRX, loading direction, temperature, strain rate, total strain, and inclusion size on the damage is analyzed.
Materials and methods
Materials
In the present study, the damage behavior of case hardening steel 16MnCrS5 is investigated. The investigated material is typically case-hardened to high surface hardness to yield a high resistance against wear, fatigue, and impact failure. However, the presence of non-metallic inclusions (MnS, Al2O3, SiO2) may cause the initiation and growth of damage at the matrix–inclusion interface during hot forming, which would reduce the service performance. As an example, the detachment of the matrix from the inclusion under tension loading is shown in Figure 1. The chemical composition of the investigated material is given in Table 1.
Decohesion of steel matrix from inclusion under tension loading at 1100℃ and 1 s−1. Chemical composition of the 16MnCrS5 steel.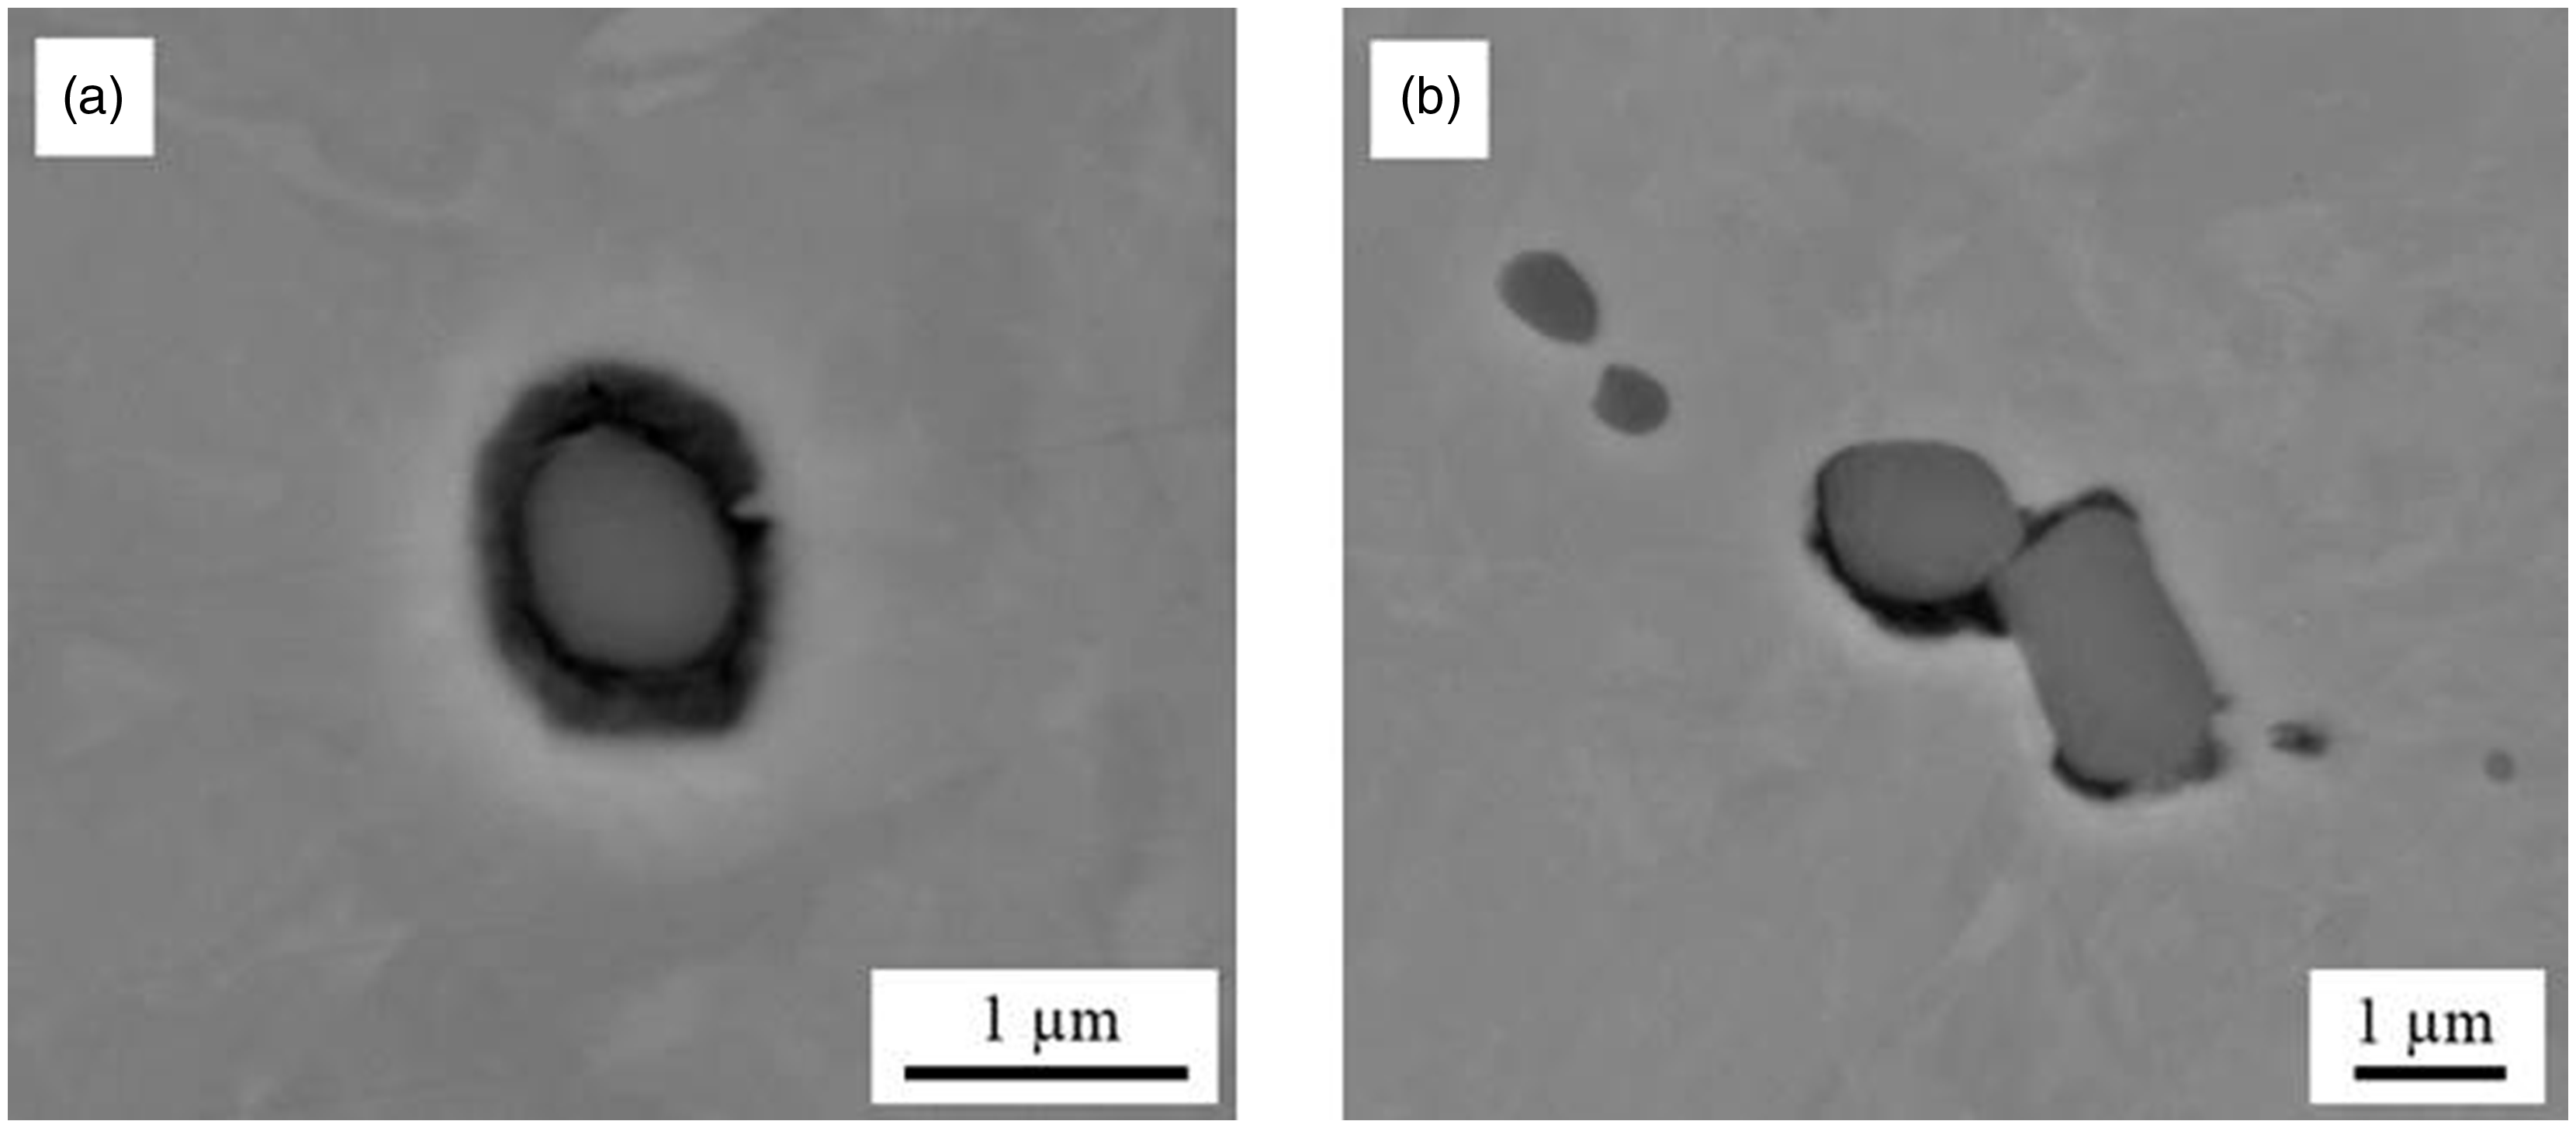

Methods
Hot compression tests
Experimental data for the investigated material were obtained from hot compression tests performed in a servotest thermo-mechanical treatment simulator machine equipped with a piezoelectric sensor for force measurement. Cylindrical specimens of 10 mm in diameter and 15 mm in height were deformed at five temperatures (800, 900, 1000, 1100 and 1200℃) and three strain rates (0.1, 1 and 10 s−1). The specimens were heated by induction at a rate of 10 K/s to the required temperature, kept for 5 min to ensure complete soaking and deformed under isothermal conditions. The friction between the specimens and the punches was reduced by deploying glass powder. After deformation, the specimens were water quenched.
Particle distribution analysis
The inclusion size distribution was obtained using a field emission gun scanning electron microscope “JEOL JSM 7000F”. The automated particle analysis of the “EDAX Genesis” Software V6.53 allows for investigating areas of over 1 mm2. This is automatically done by collecting backscatter electron images of the polished cross section (longitudinal and perpendicular). Each individual image has a width and length of 64 × 50 µm2, allowing also small inclusions to be detected. The inclusions are distinguished from the matrix by selecting a suitable threshold gray value. This delivers the morphology information such as area, average diameter or aspect ratio of each inclusion. Energy dispersive X-ray spectroscopy (EDX) is performed on each inclusion to obtain additional data about the elemental composition. Classification of inclusion-EDX data is performed to identify different types of inclusions or preparation and measurement artifacts.
Continuum-based unit-cell RVE model
The decohesion behavior of the matrix–inclusion interface is investigated using a continuum based unit-cell RVE approach. A simple configuration of a cylindrical matrix containing a spherical inclusion is considered. Due to circumferential symmetry of the model, a 2D axisymmetric model is considered. The schematic model of a matrix containing a spherical inclusion is shown in Figure 2(a). Due to the symmetrical geometry and loading conditions, only one-fourth of the model is considered. Figure 2(b) presents the discretized FE model for the damage investigations. Axisymmetric boundary conditions are applied along the r- and z-axis. The dimensions of the RVE are selected based on the largest size of the inclusion present in the material. The largest inclusion diameter is 4.25 µm and the size of the RVE is 10 times higher than the largest inclusion. The interaction between the matrix and the inclusion is defined using the temperature-dependent cohesive zone elements with a thickness of 0.01 µm. The matrix and inclusion are discretized using four-node bilinear axisymmetric elements (CAX4R) and the cohesive zone is meshed using four-node axisymmetric cohesive elements (COHAX4). The computations are performed in Abaqus/Standard 2017. For the hot deformation conditions, the inclusion is modeled as a rigid body and the matrix as visco-plastic material. The plastic deformation properties of the matrix are defined using a DRX model.
Illustration of a continuum base unit-cell RVE model (matrix–inclusion system) (a) and discretized finite element model (b).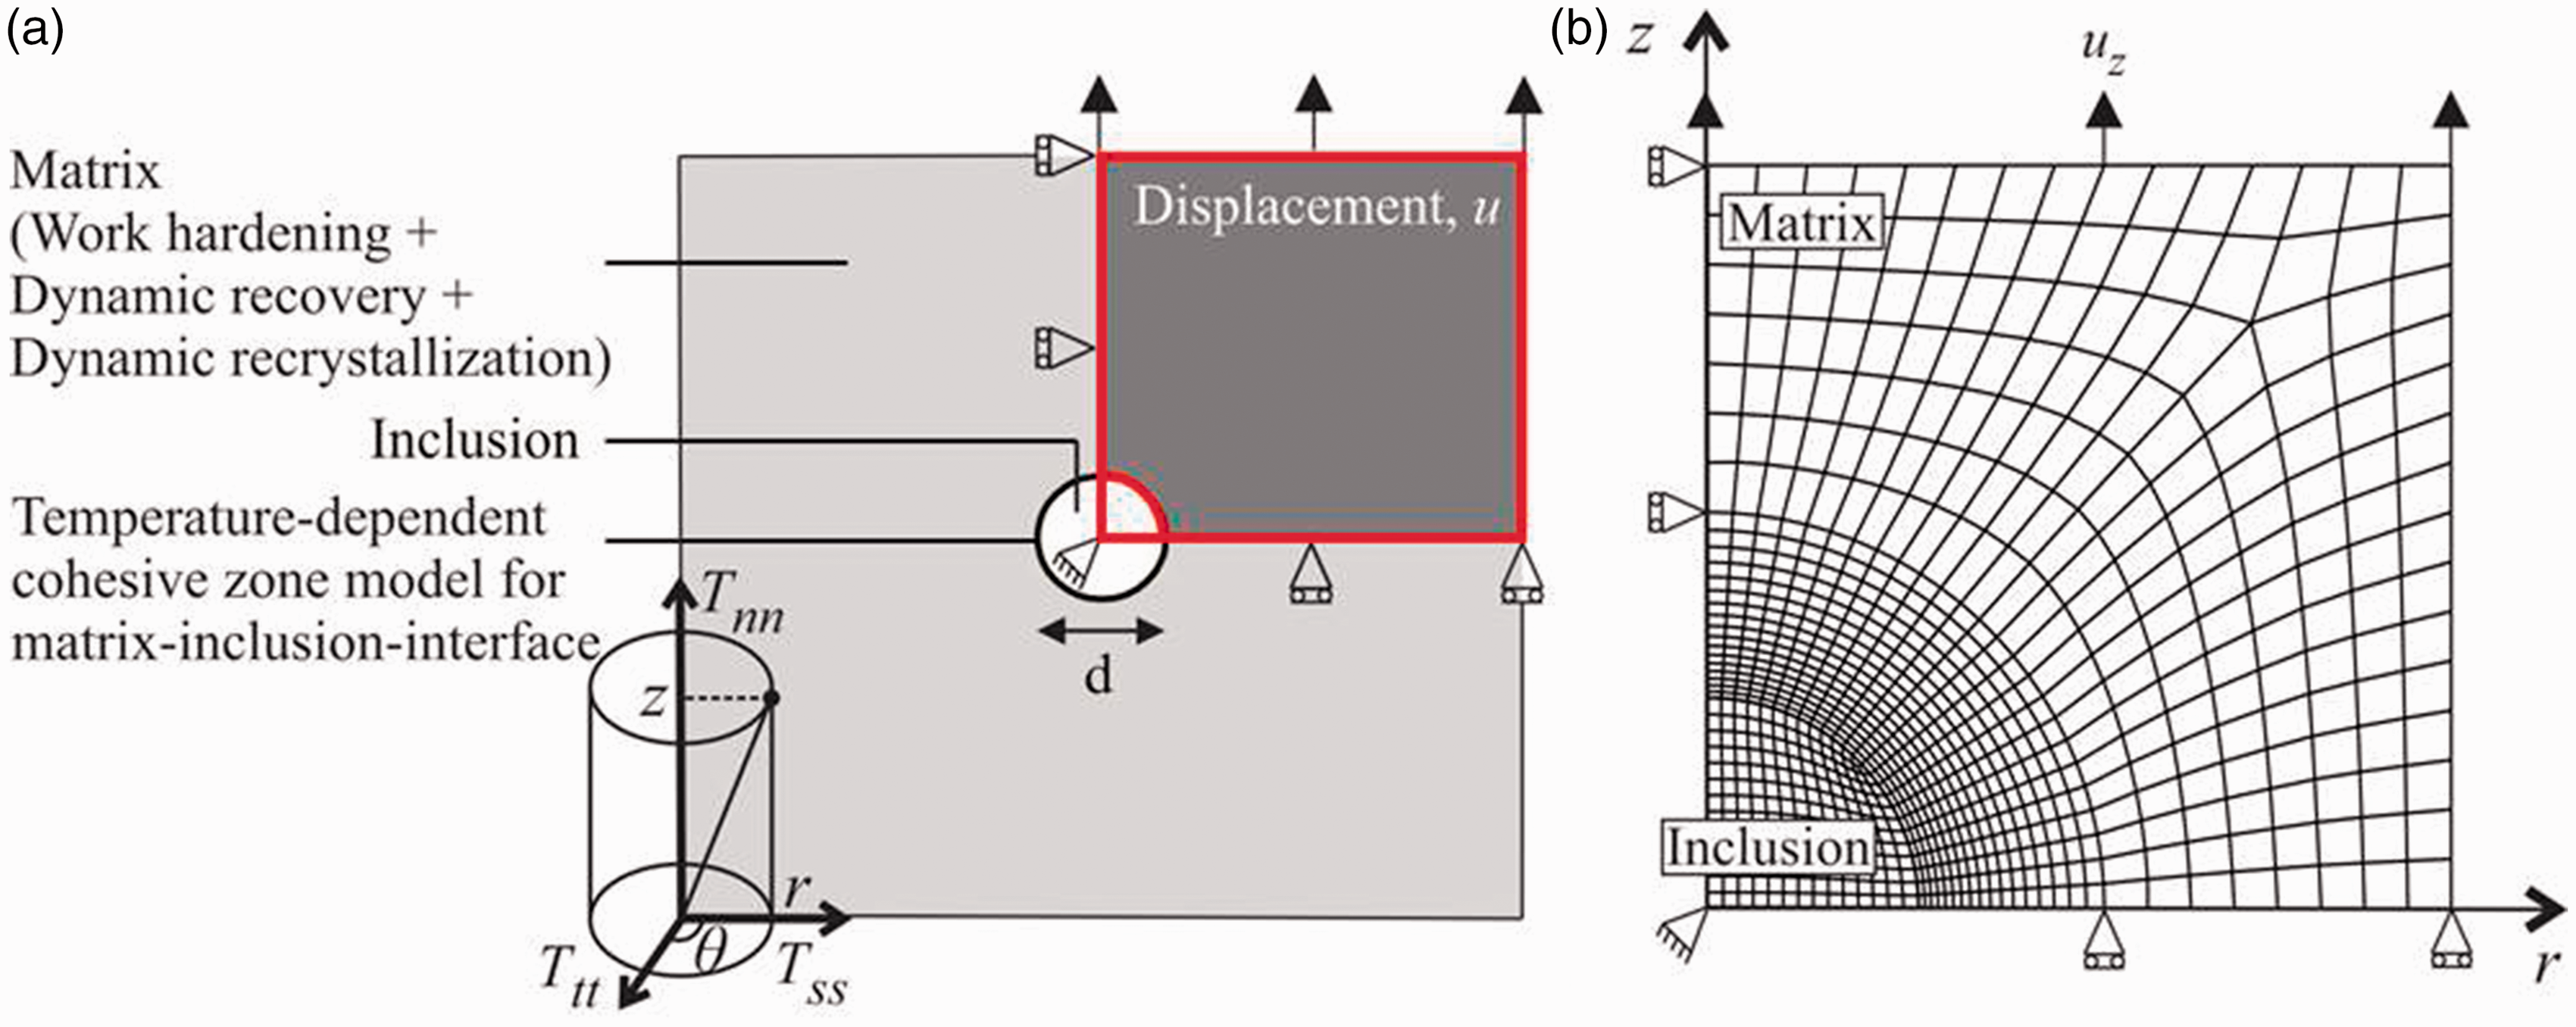
Matrix–inclusion interface damage model
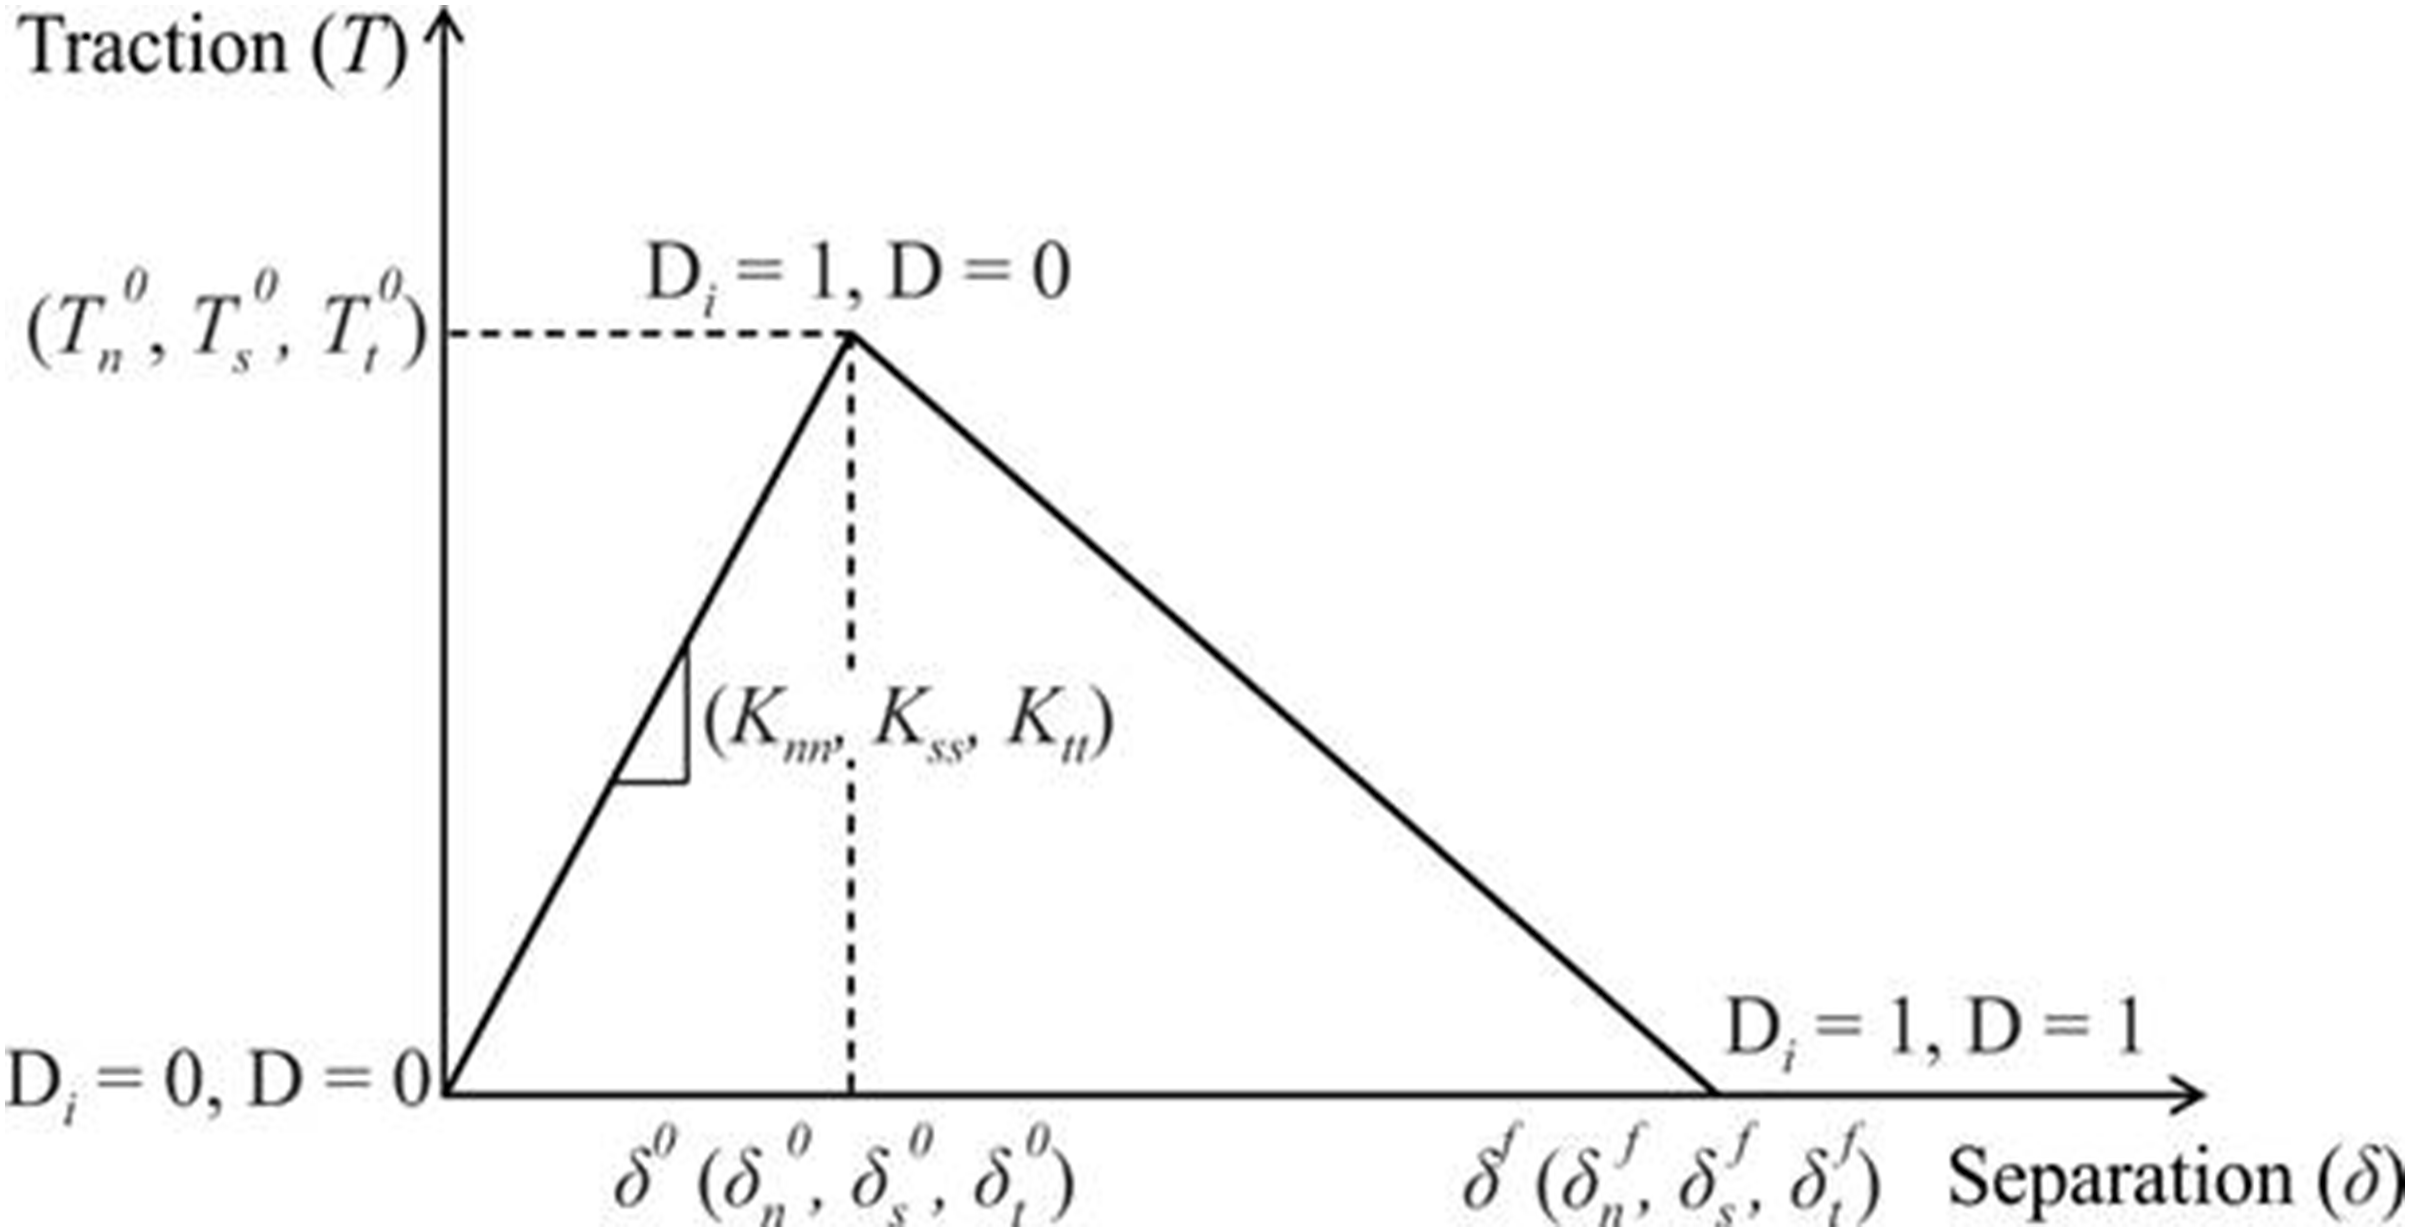
The interface between the steel matrix and the hard inclusion is modeled using a cohesive zone modeling (CZM) approach. Figure 3 shows a typical traction-separation law for the CZM. The tractions increase up to the point of damage initiation at the critical separation and then decreases to zero at complete damage. The elastic constitutive behavior of the CZM in terms of the constitutive matrix Schematic of traction-separation evolution in the cohesive zone model.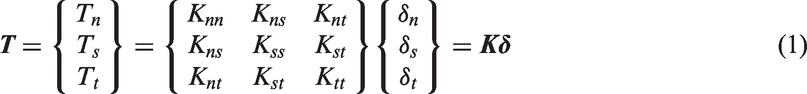
In the present study, it is intended to quantify the role of softening due to DRX on the damage initiation. For the moment, the stiffness values of the interface (
In the present study, it is assumed that the damage is initiated when the maximum separation ratio reaches maximum value

Macaulay brackets are used to define the damage initiation criterion for the case where the cohesive element shrinks along the normal direction due to compression, which cannot cause separation. After damage initiation, the damage is calculated using a linear damage evolution by effective separation
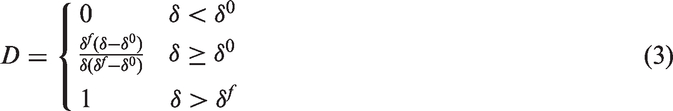
In order to quantify the overall damage at the matrix–inclusion interface, the average damage is calculated as follows


DRX model
During hot working, the considered steel dynamically recrystallizes as the temperature exceeds about 60% of the melting temperature. To accurately predict the damage development during FE simulation, the matrix material model should take DRX into account. In the present study, which draws upon a continuum-based RVE approach, a semi-empirical DRX model proposed by Beynon and Sellars (1992) is utilized. According to this model, the work hardening (WH) is modeled as
Illustration of the flow curves for the work hardening, dynamic recovery (dashed line), and softening due to dynamic recrystallization (solid line).
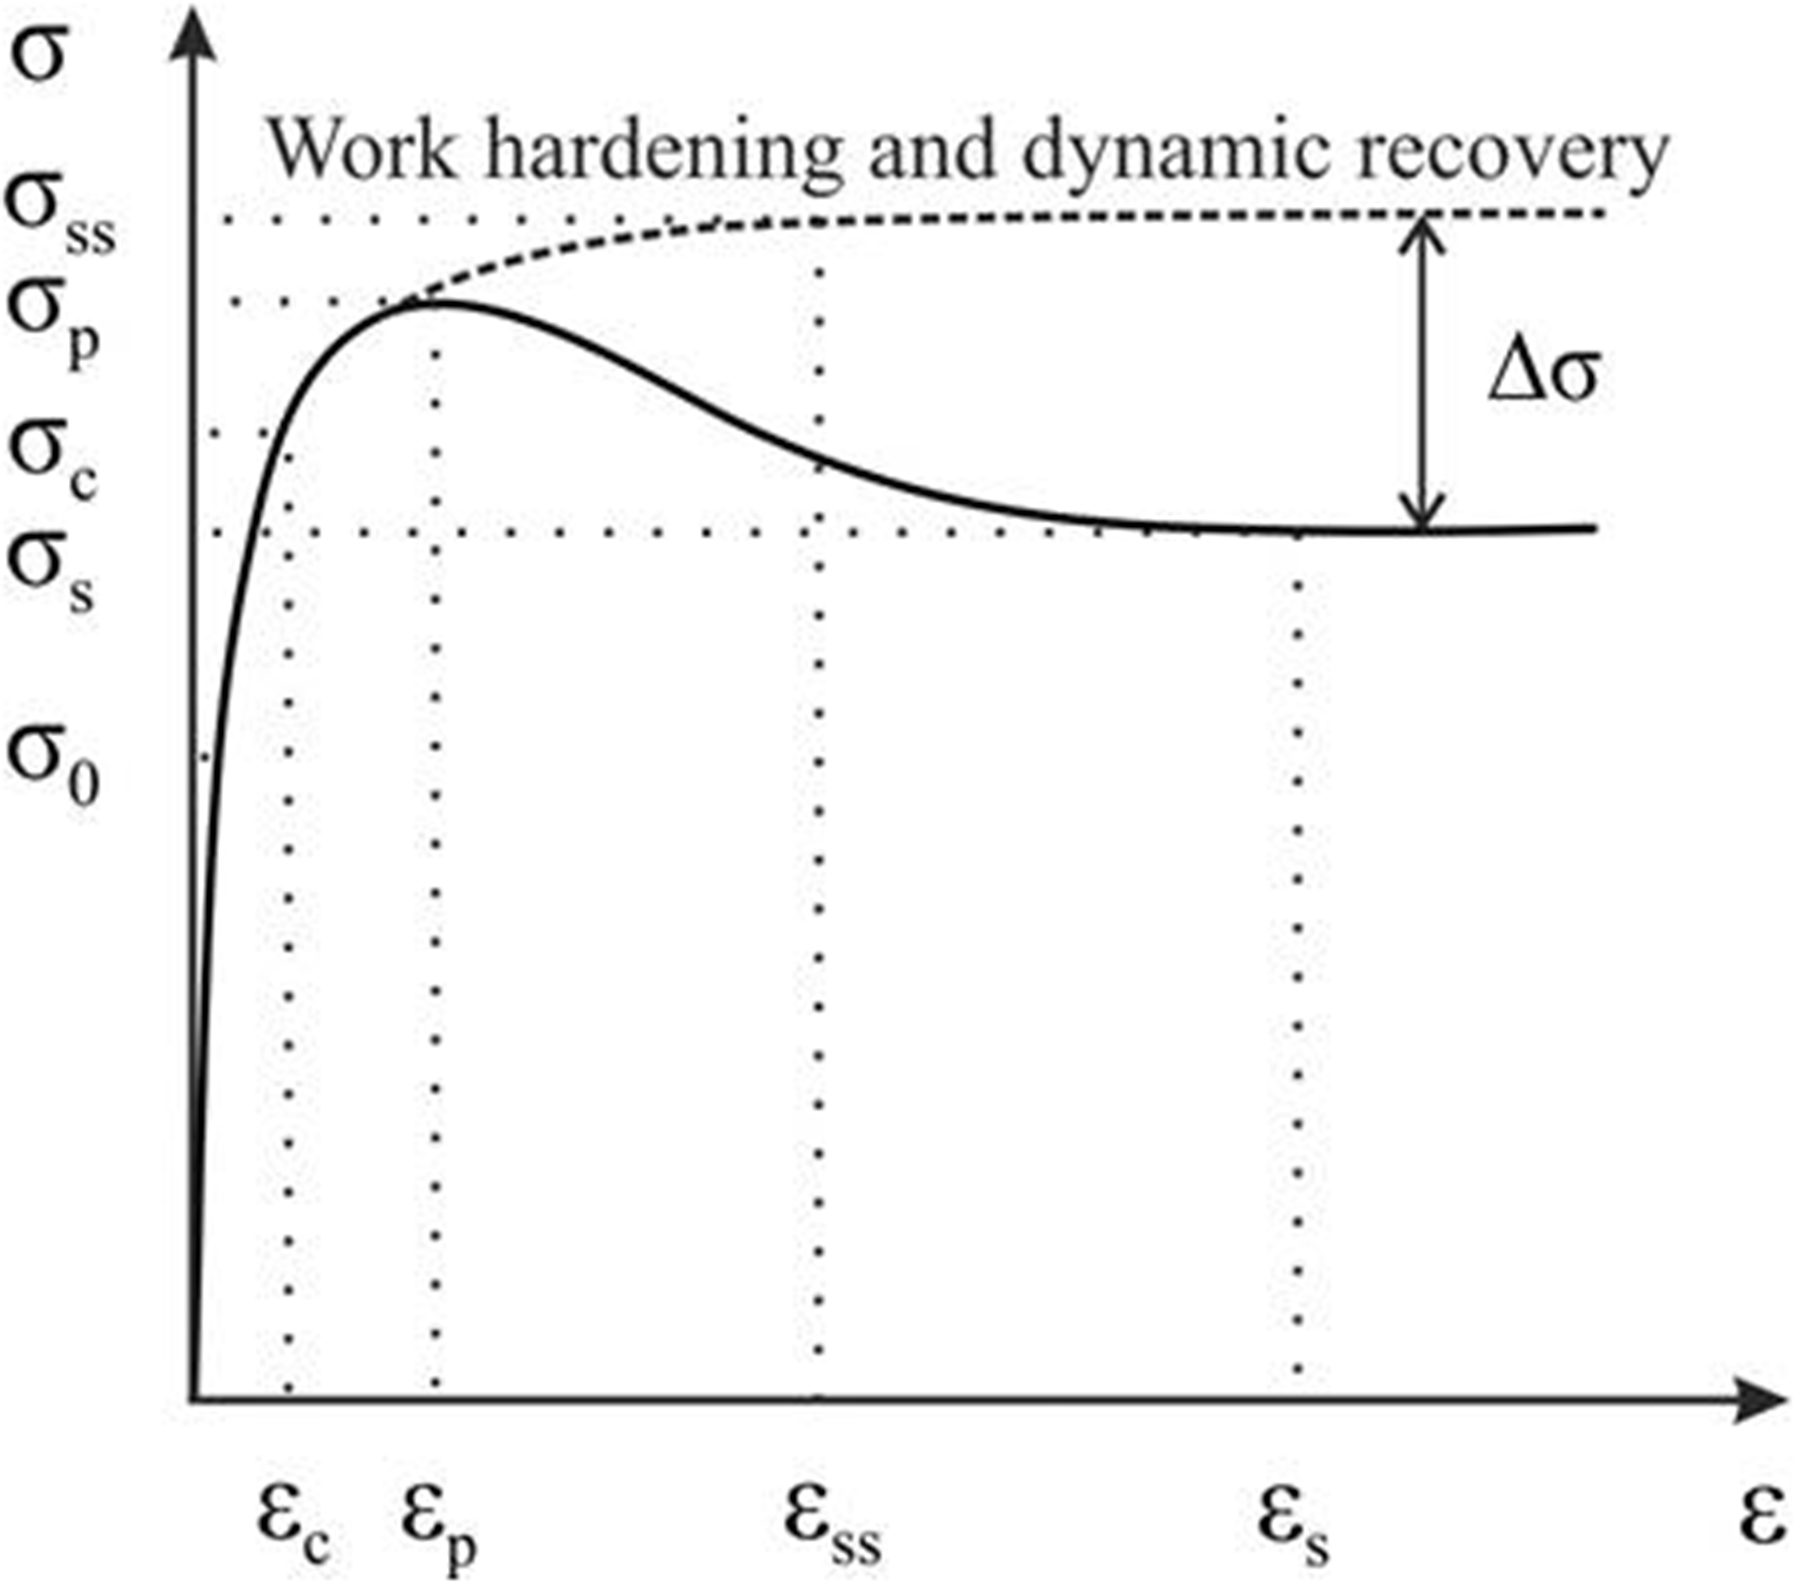
The work softening due to DRX is modeled as


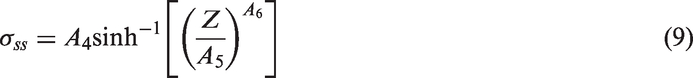
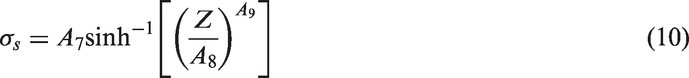

The recrystallized volume fraction 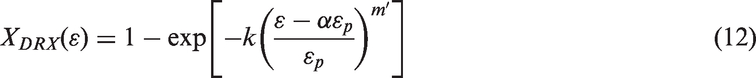

The effective flow stress is obtained by the superposition of the WH, DR (
The Beynon–Sellars DRX model is implemented in Abaqus/Standard via uhard subroutine which allows the matrix to recrystallize. The RVE simulations are isothermal and the flow stress model was fitted to the experiments for five temperatures and three strain rates using the nonlinear least-squares (lsqnonlin) optimization function in MATLAB to determine 16-material parameters. The results of fitting the Beynon–Sellars model to the experimental flow curves are shown in Figure 5. The DRX model represents the average flow stresses in the matrix while locally; the stresses due to the dislocation pile-ups and the reduction of stresses due to DRX could be higher than in the continuum approach. In the present work, a damage model is proposed that may be implemented in a macroscopic FE model, in which a macro-DRX model will be used, so that local effects are neglected in this work.
Comparison of the flow curves calculated from the Beynon–Sellars model with the experimental flow curves at strain rates of: (a) 0.1, (b) 1, and (c) 10 s−1.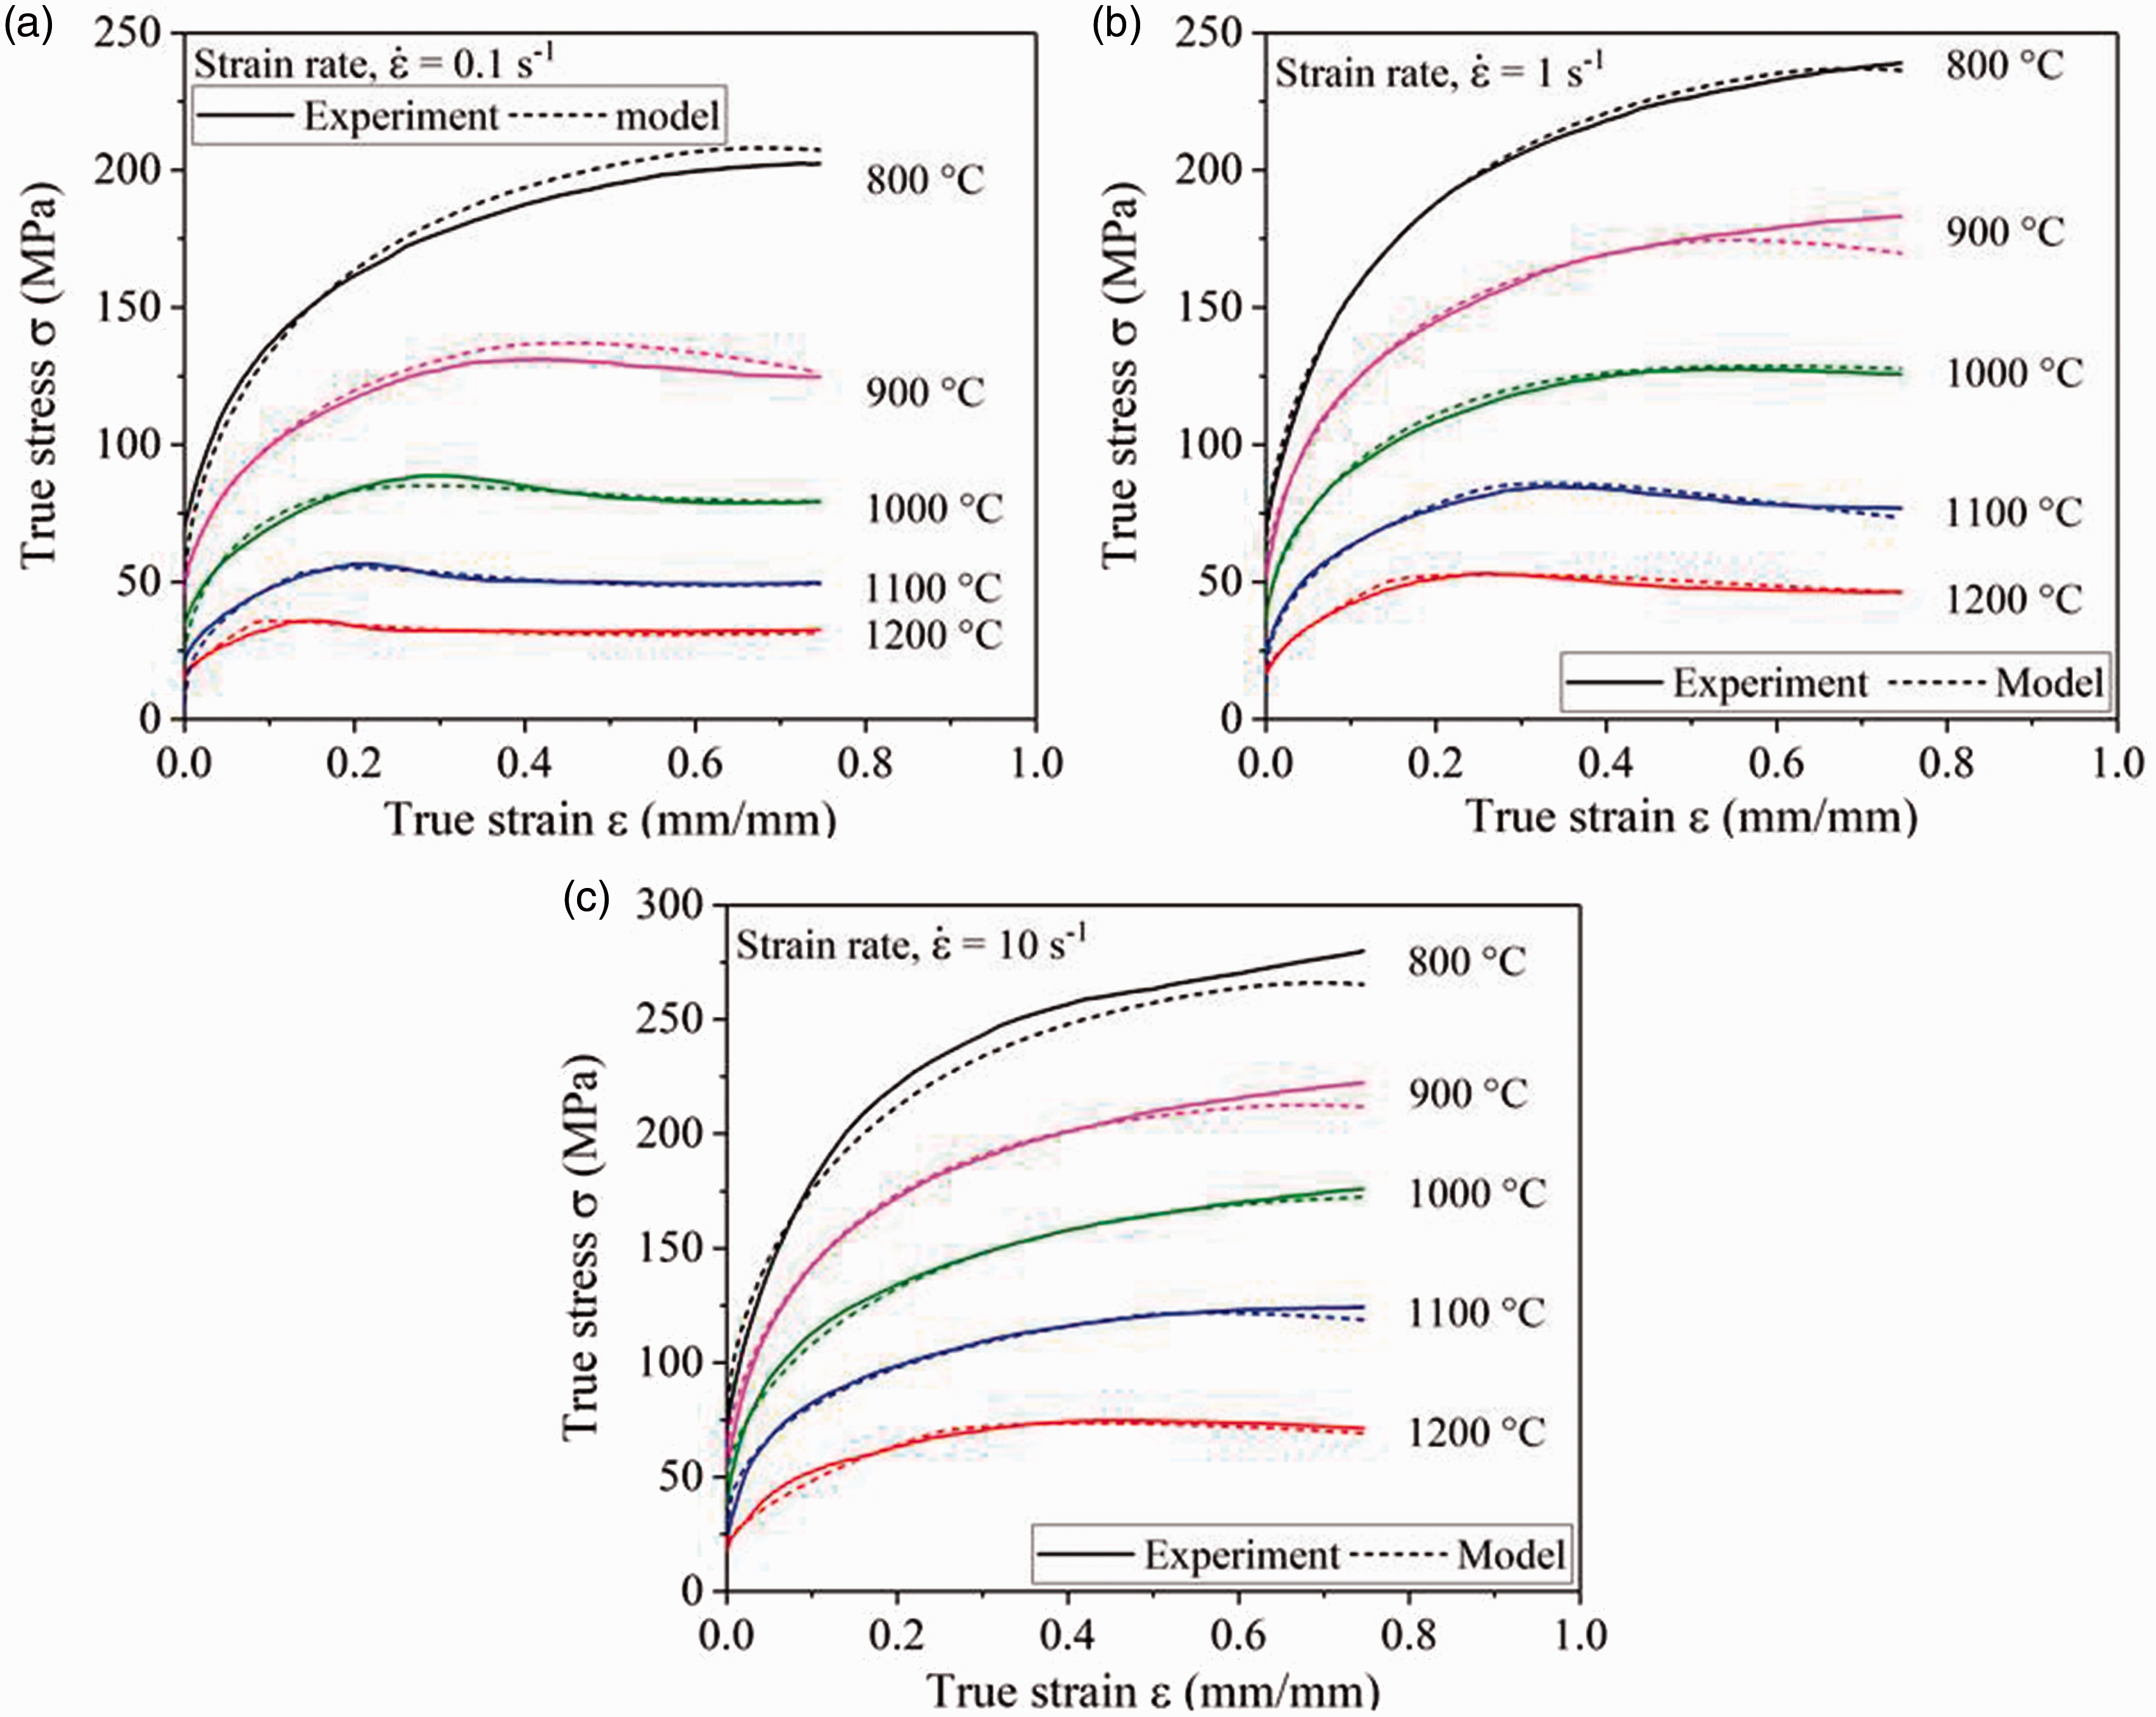
To quantify the influence of DRX on the damage initiation and growth at the matrix–inclusion interface, a continuum-based RVE model is investigated for two different states of the matrix at the same deformation conditions. In the first state of the matrix, the flow behavior shows only the WH and DR without occurrence of DRX. In the second state, the matrix is allowed to recrystallize and the flow behavior is due to WH, DR, and work softening due to DRX. The material properties for the first state are defined through extrapolated flow curves from experimental flow curves containing only WH and DR. For the second state, the matrix material properties are defined through the coupled Beynon–Sellars DRX model implemented as an uhard subroutine in Abaqus/Standard. An illustration of both conditions is plotted in Figure 4. The influence of the stress state on damage evolution is investigated under axial tension, axial compression, and axial tension and radial compression loading. The influence of deformation conditions (temperature, strain rate and total strain) and inclusion size on damage is also analyzed.
Results of the RVE computations
Influence of the dynamic recrystallization
To investigate the influence of DRX on the damage initiation and growth, two different deformation conditions were selected: (i) low temperature and fast deformation (800℃ and 10 s−1), the conditions feasible for relatively low recrystallized volume fraction (X DRX ); (ii) high temperature and slow deformation (1000℃ and 1 s−1), the conditions feasible for large X DRX .
Figure 6 shows the comparison of damage initiation and growth with and without DRX. The separation of the interface between matrix and inclusion and the magnitude of damage at the interface are shown in Figure 7. The damage contours in Figure 7 correspond to the damage evolution plots in Figure 6. The damage is calculated as the ratio of damaged area to the total area of the interface. There are two key outcomes from these results. First, the occurrence of DRX decreases the amount of total damage in the material. Second, the large X
DRX
(at 1000℃ and 1 s−1) delays the damage initiation and decreases the total damage as compared to the relatively small X
DRX
(at 800℃ and 10 s−1). At the microscopic level, the damage initiation and growth are driven by the deformation-induced local build-up of stresses at the matrix–inclusion interface. The magnitude of localized stress concentration at the matrix–inclusion interface is dependent on the extent of X
DRX
. In the case where large X
DRX
occurs as shown in Figure 8, the flow stresses (Figure 9) and strains (Figure 10) in the matrix are reduced that results in decreased local stress concentration; and hence, the total damage.
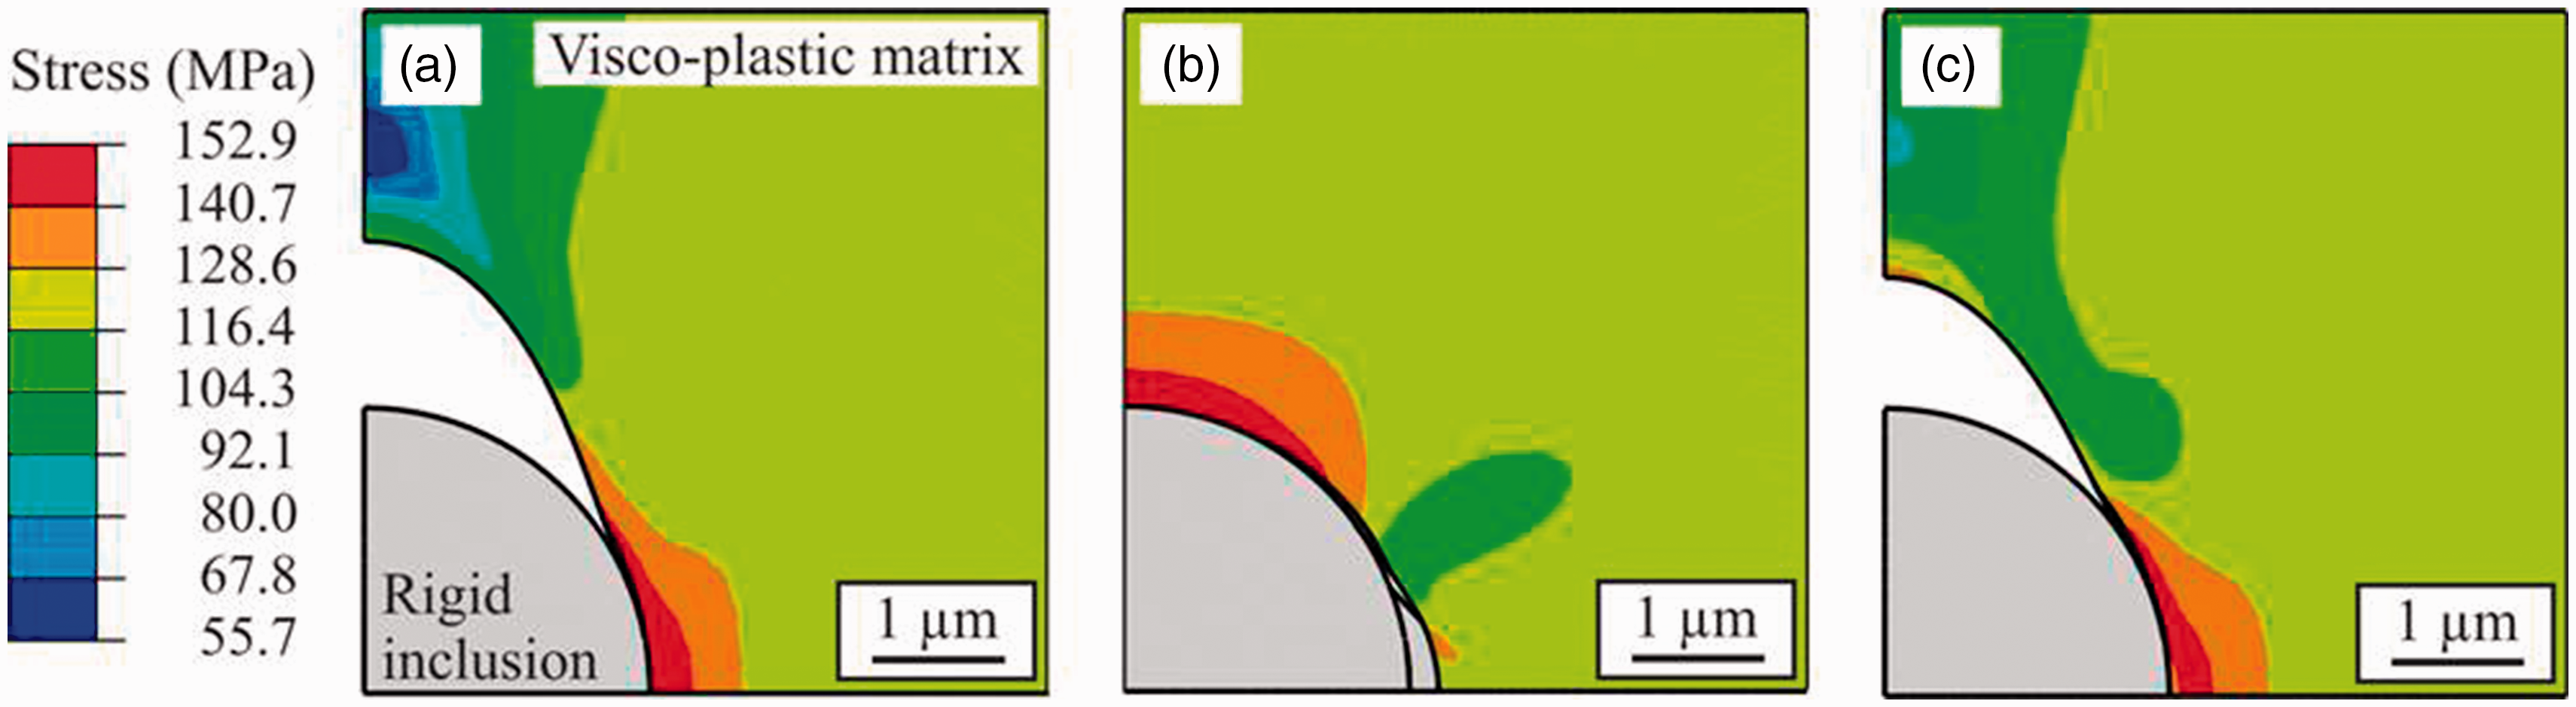
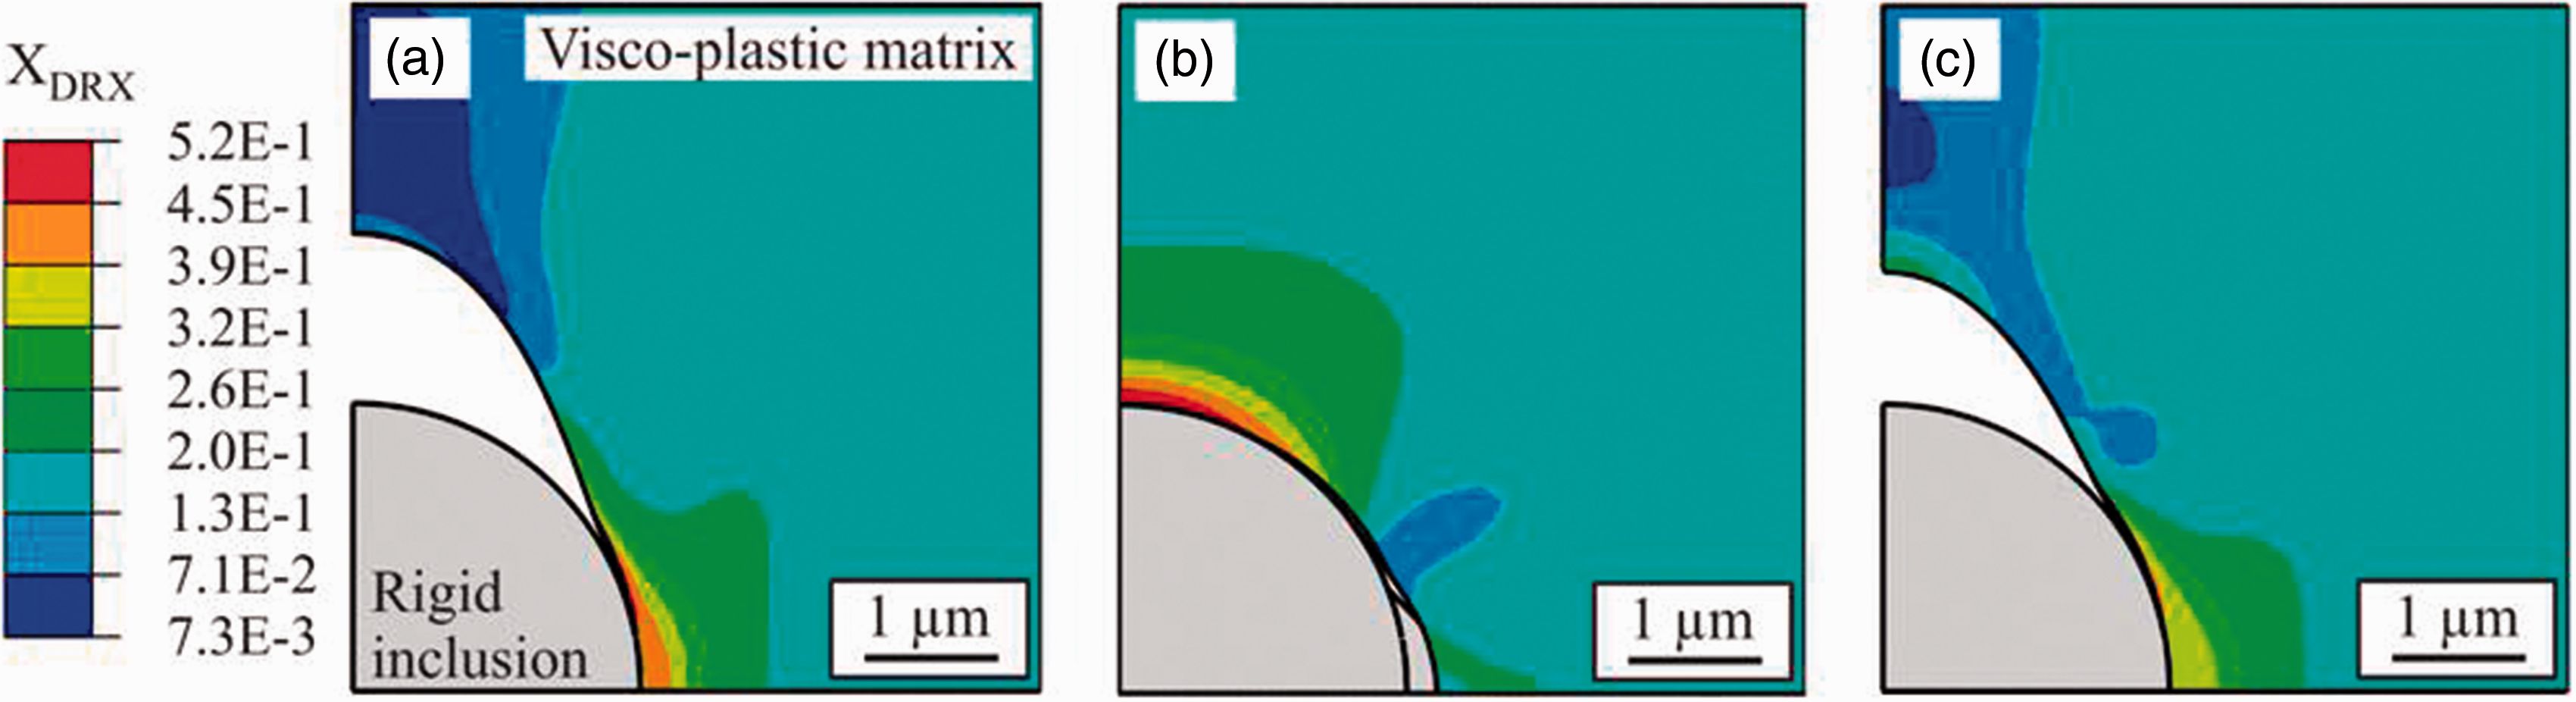
Comparison of the damage initiation and evolution with and without DRX for different deformation conditions. FE plots showing the amount of total damage with and without DRX and the corresponding size of nucleated void due to the matrix–inclusion–decohesion under tension. Recrystallized volume fraction (XDRX) distribution for deformation conditions: (a) 800℃ at 10 s−1, and (b) 1000℃ at 1 s−1. Average flow stress distribution in the matrix for deformation conditions: (a) 800℃ at 10 s−1 and (b) 1000℃ at 1 s−1. Equivalent plastic strain distribution for deformation conditions: (a) 800℃ at 10 s−1 and (b) 1000℃ at 1 s−1.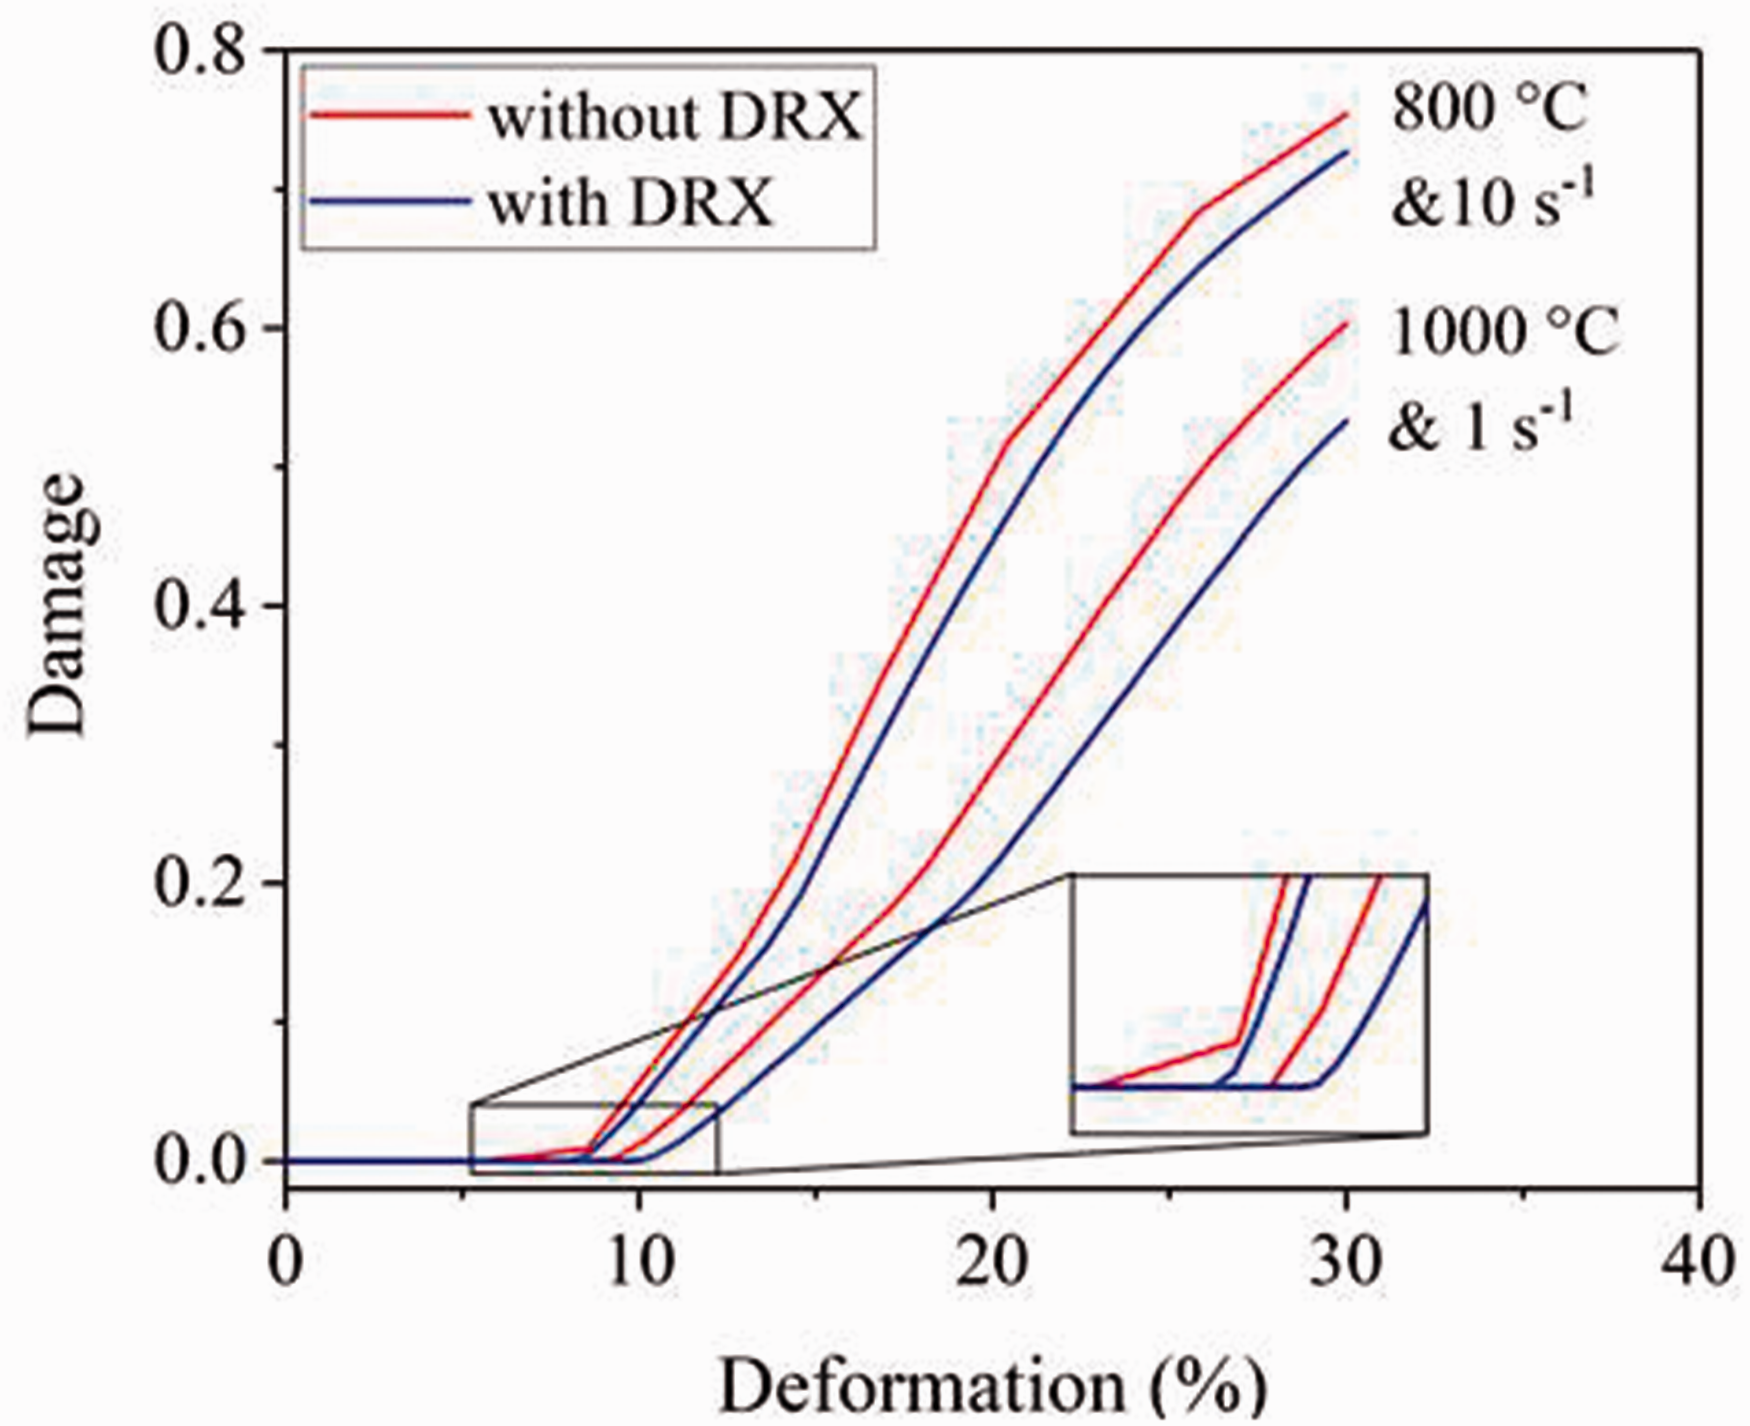
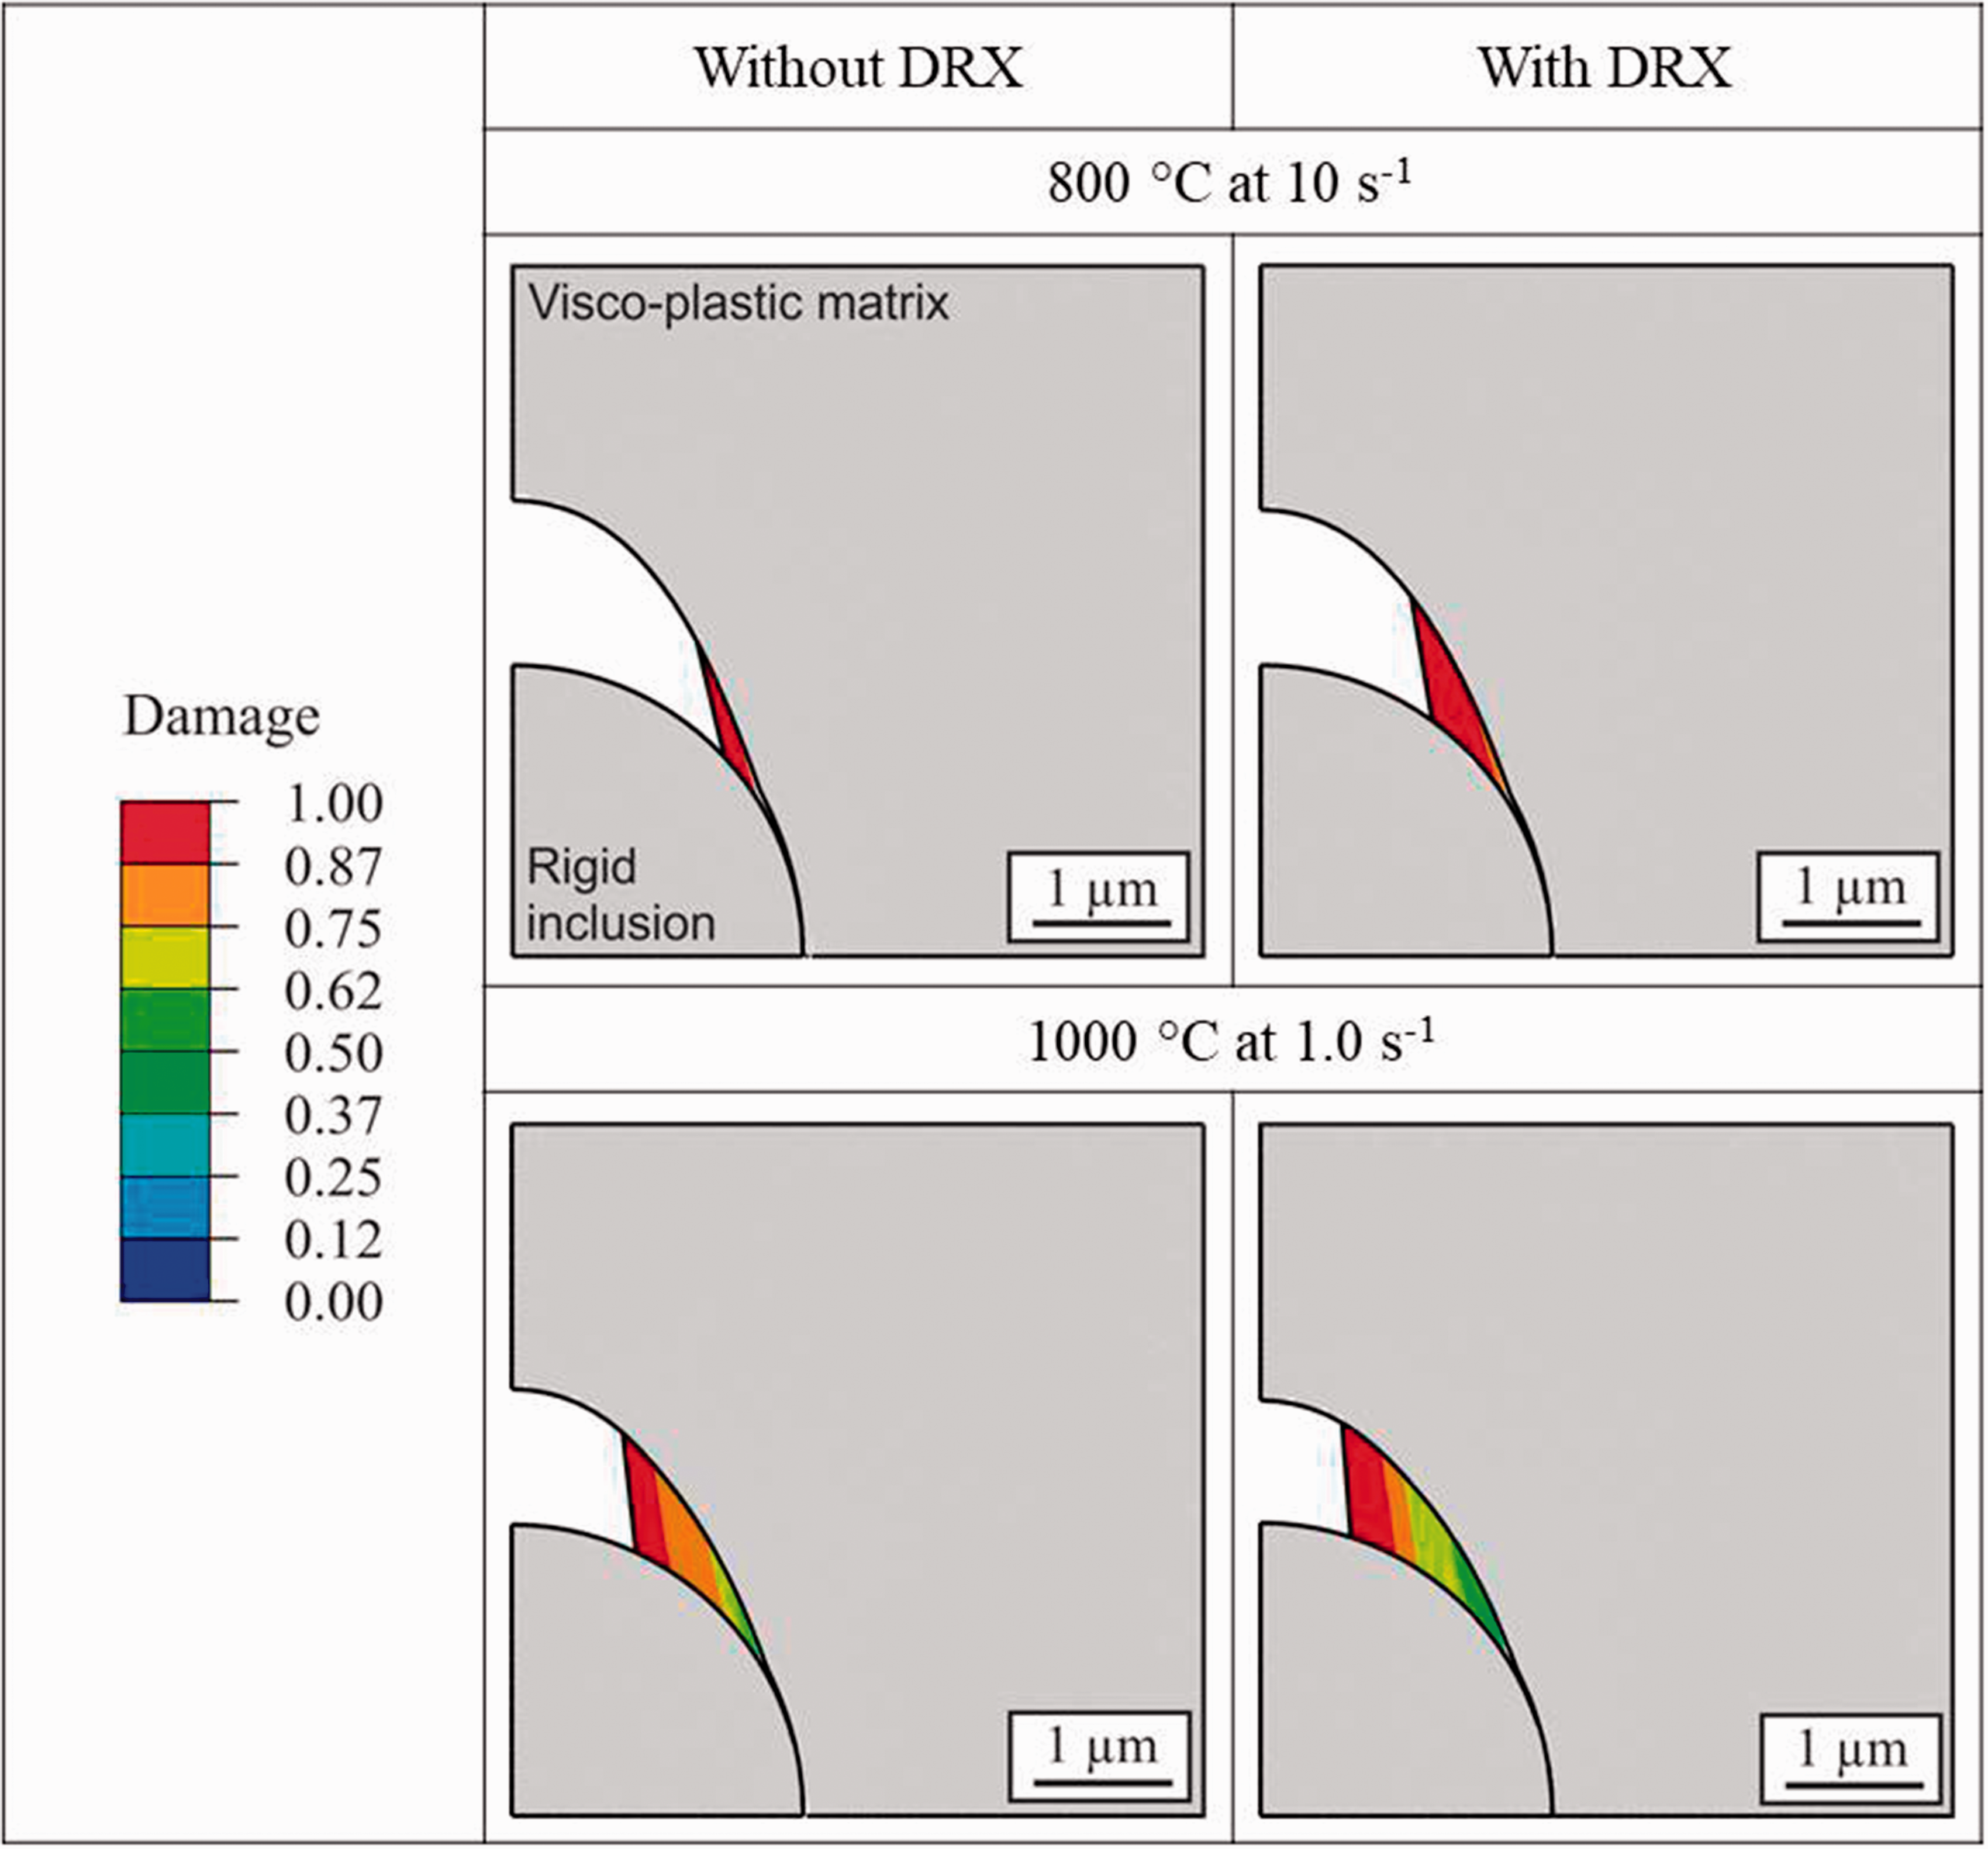
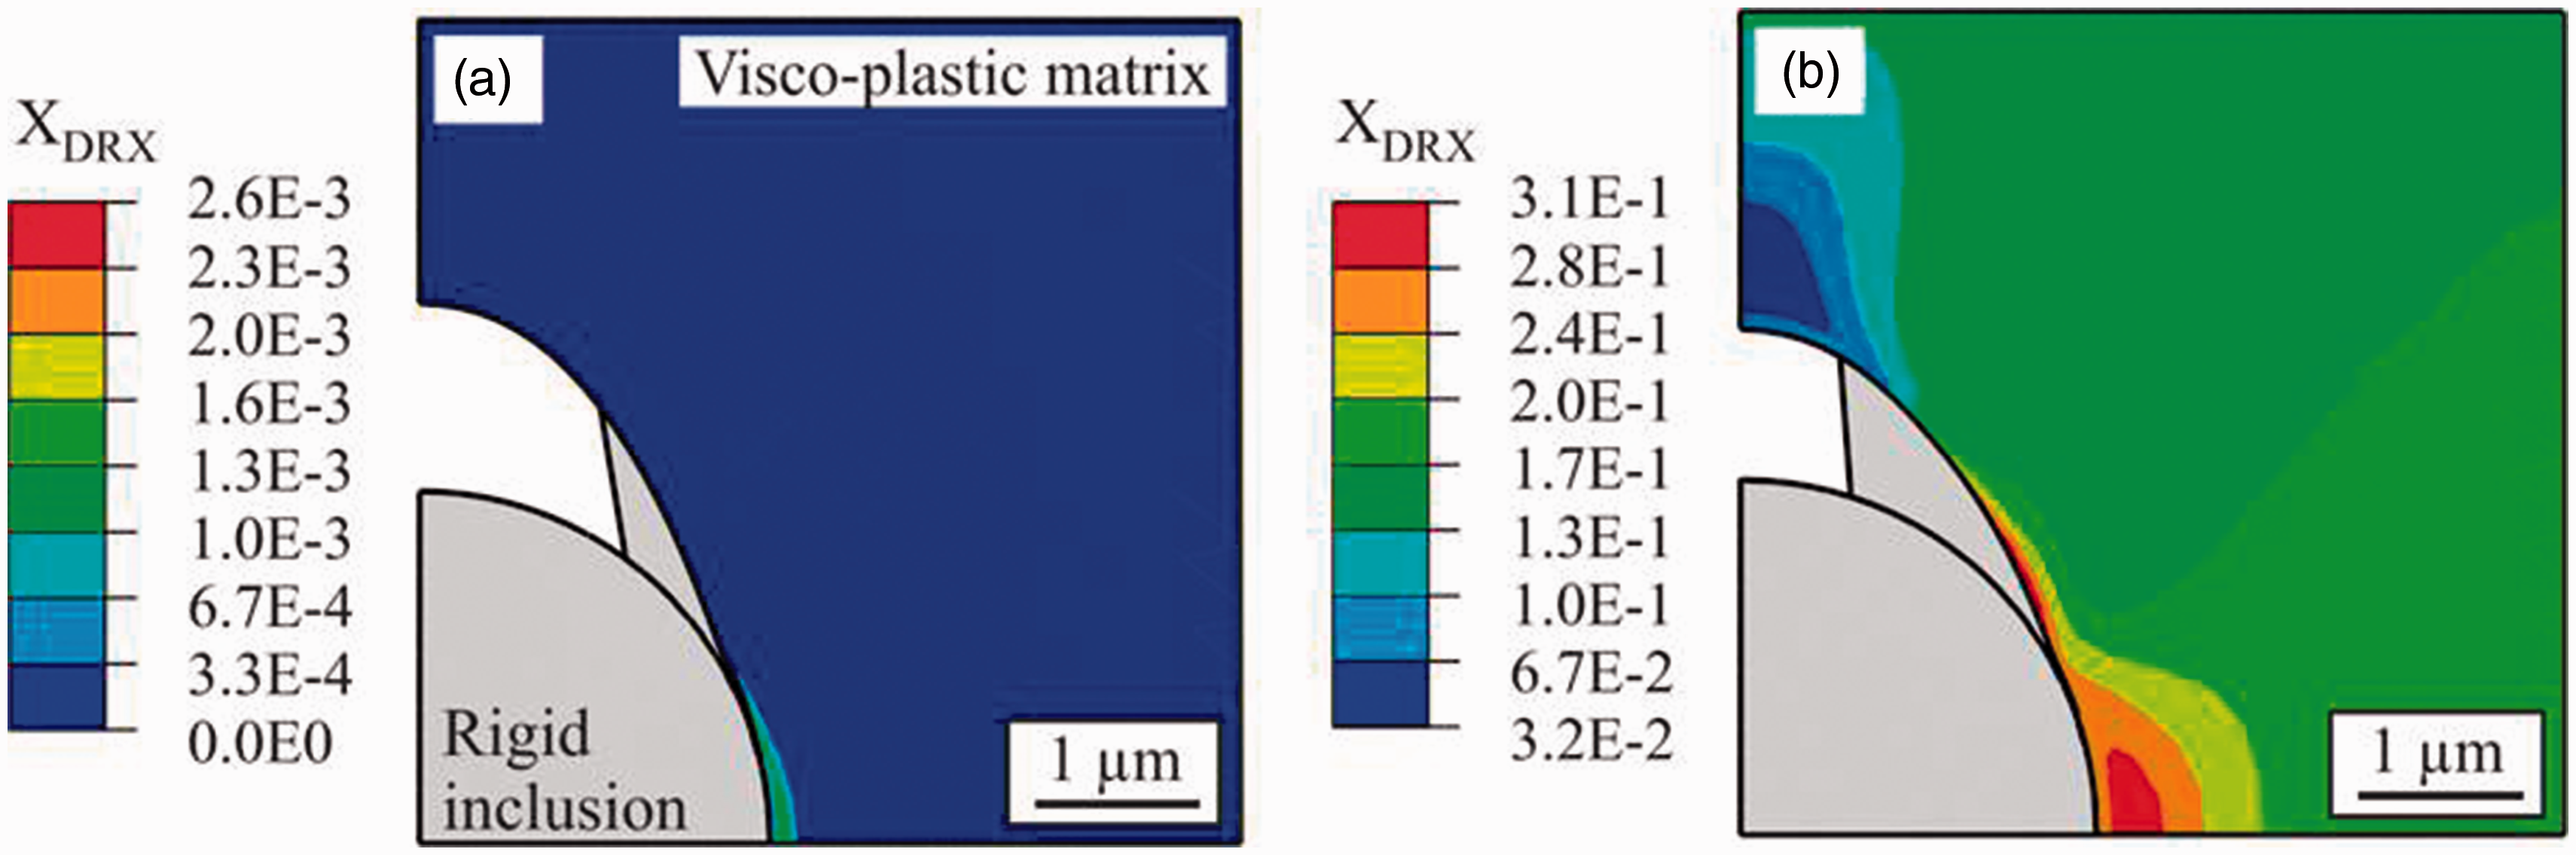
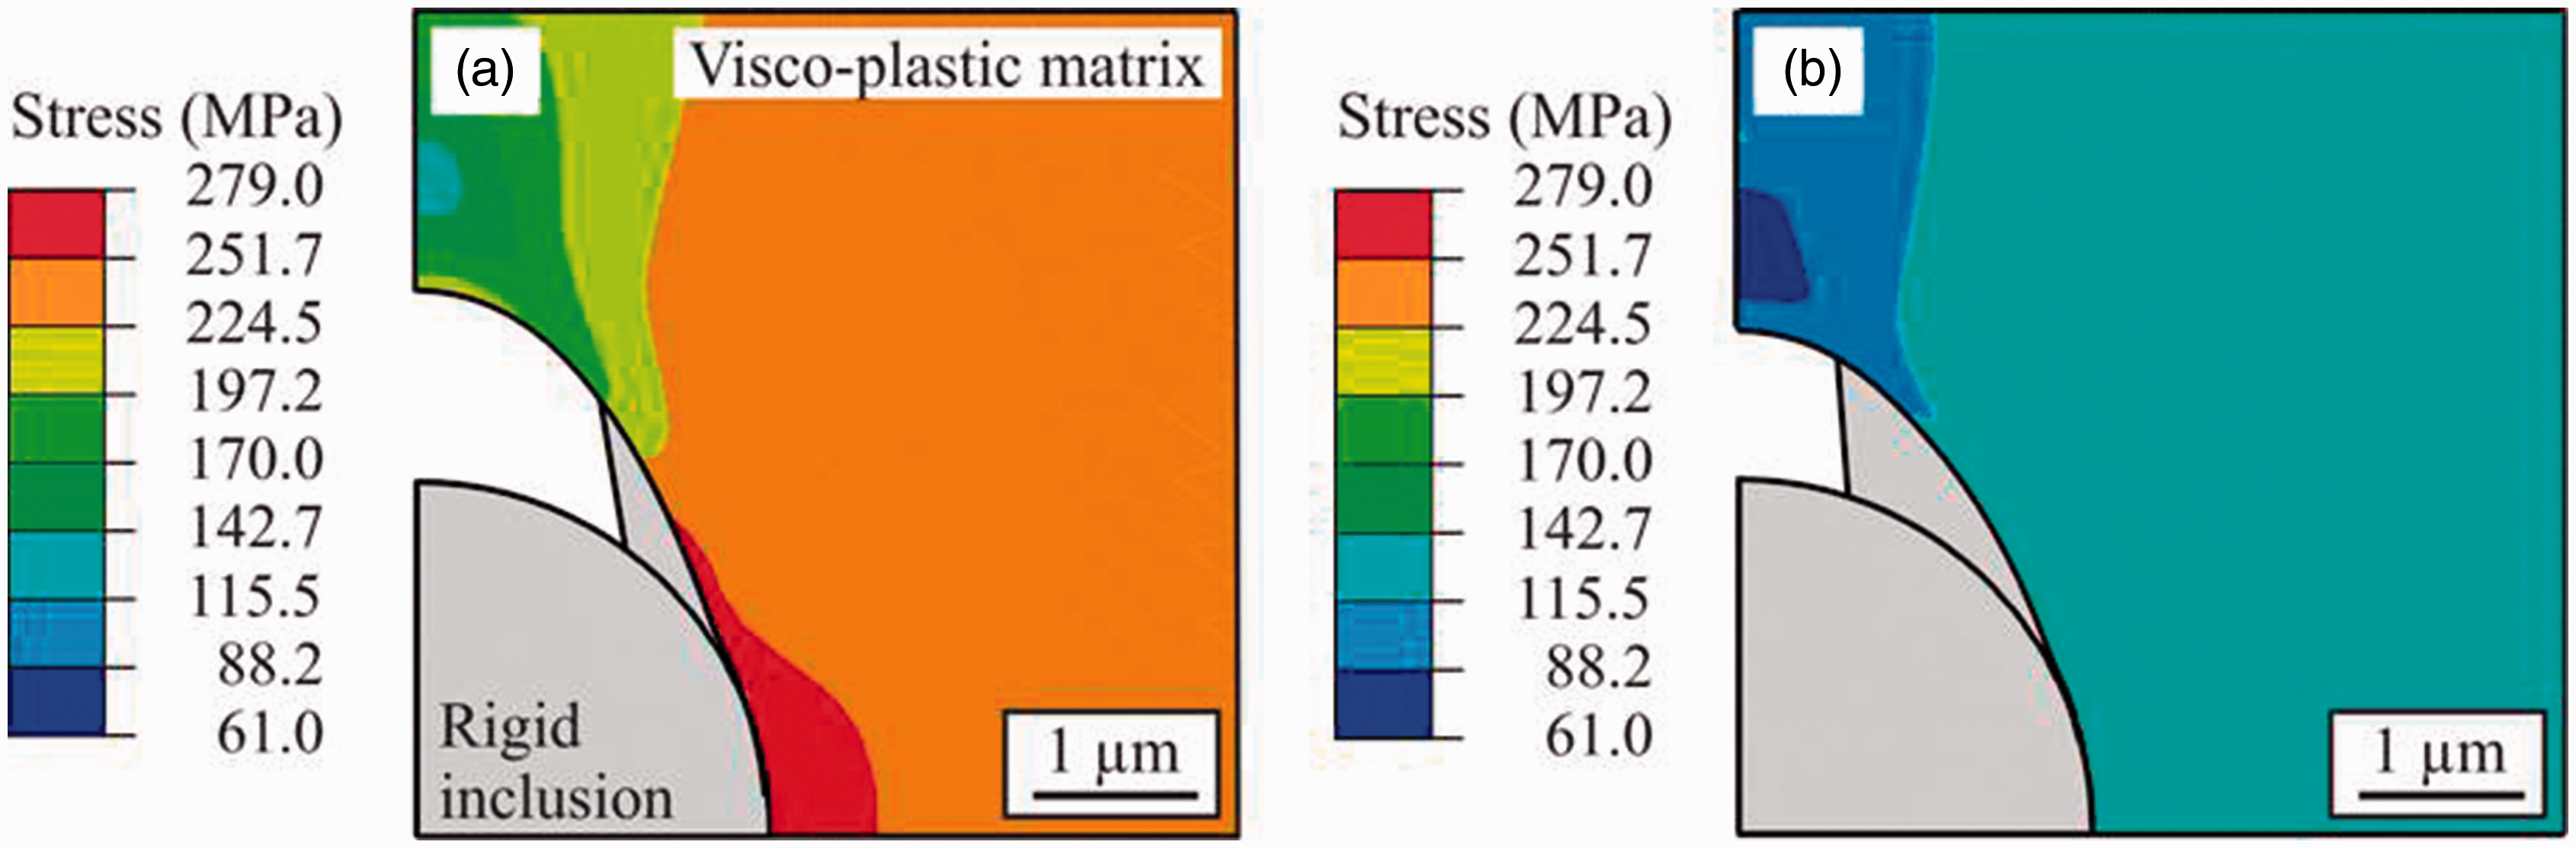
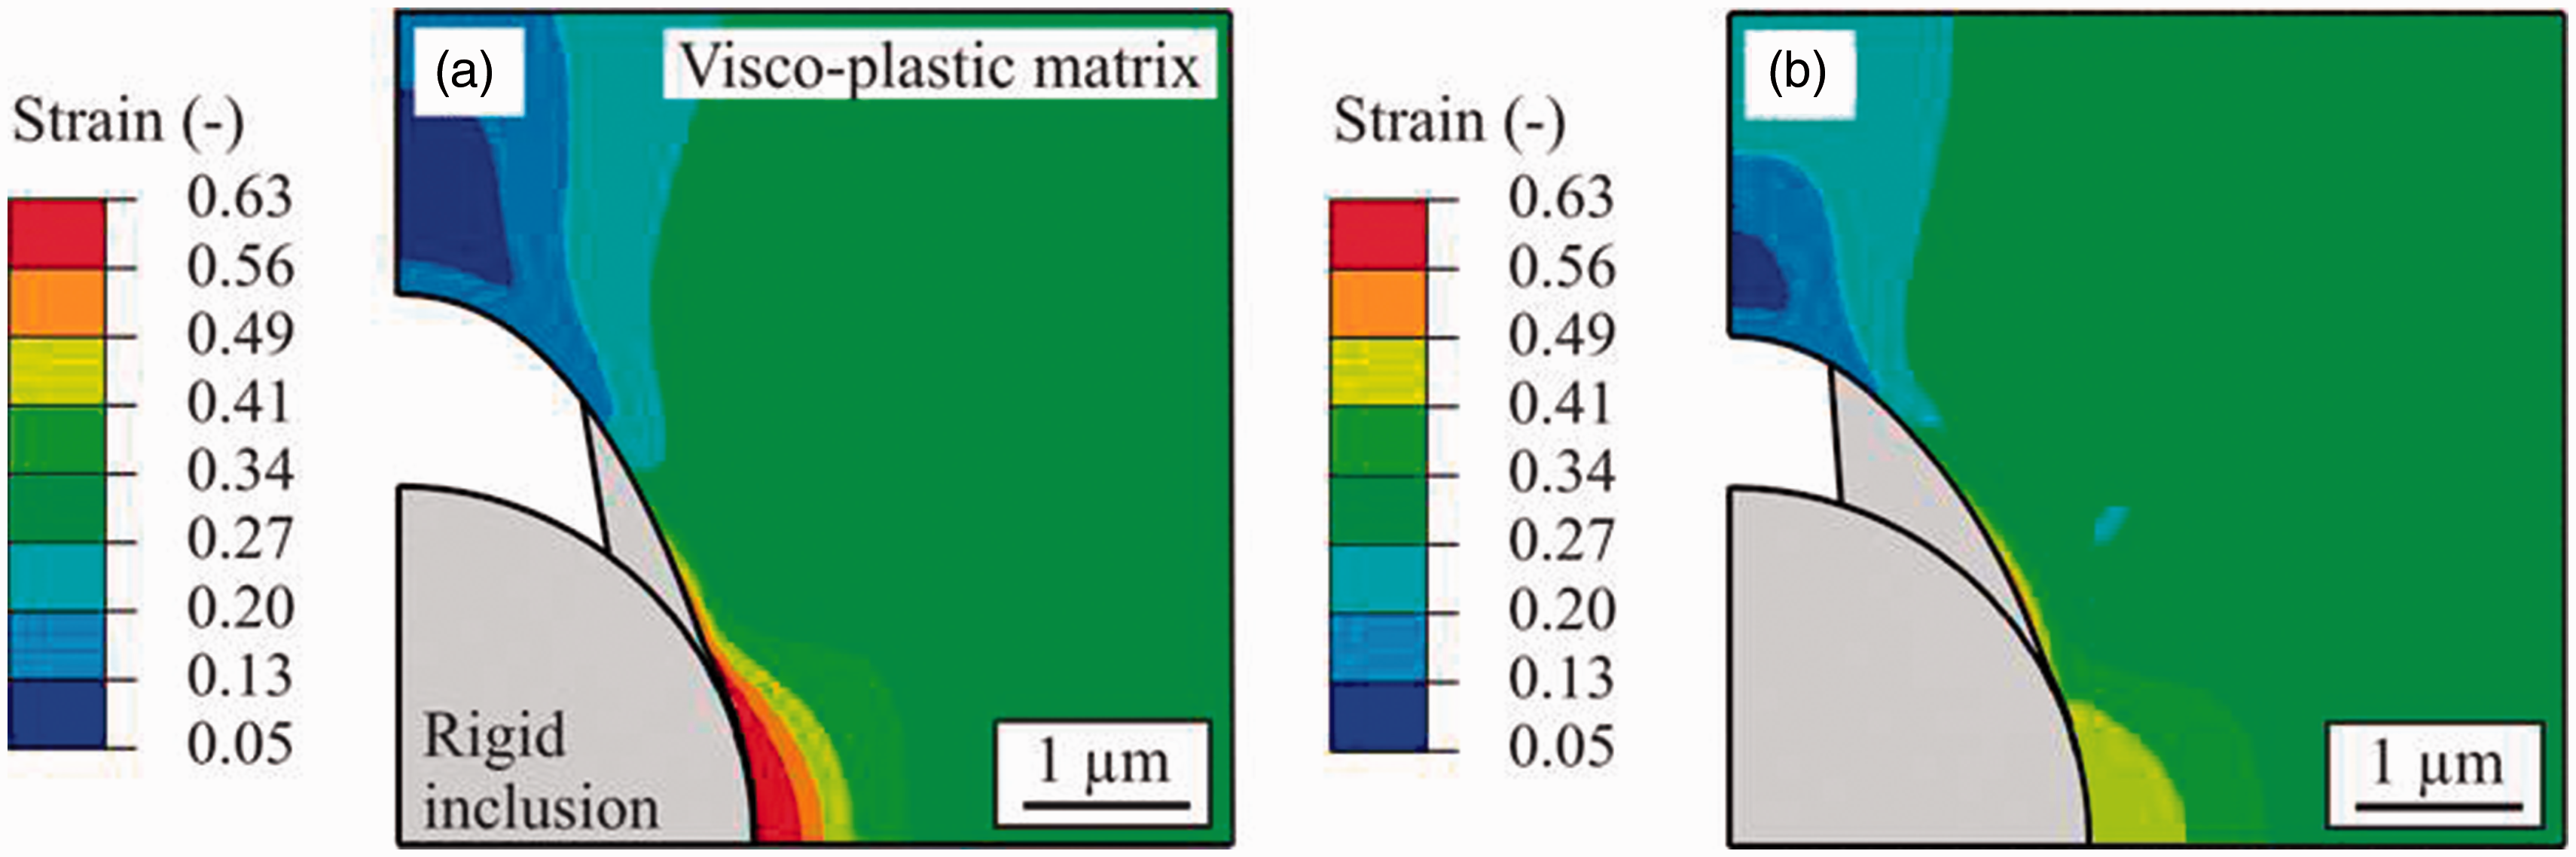
Figure 7 displays the FE contour showing the decrease in damage due to DRX as compared to the damage without DRX. The nucleated void due to the matrix–inclusion–decohesion is smaller in the case of DRX and even further decreases if X DRX is higher (at 1000℃ and 1 s−1) as shown in Figure 8.
When the element reaches the damage value of 1, it is removed from the model and does not carry any load. When the damage value is close to 1, these elements are still active but their stiffness has decreased considerably, so that they are stretched to large strains. The stretching of these elements could be limited by changing the interface behavior, but this would not change conclusions drawn from the RVE simulations.
As shown with the damage evolution curves in Figure 6 and damage contours in Figure 7, DRX lowers the total damage depending on the magnitude of X
DRX
. Along with that, it is important to know whether DRX or damage initiates first. Using the RVE approach, it is possible to figure out which phenomenon meets the critical conditions earlier. Figure 11 presents the critical stresses in the matrix at the initiation of damage and DRX as a function of the Zener–Hollomon parameter (Z) showing which critical condition is first met for different deformation conditions. For strain rates of 0.1 and 1 s−1, DRX initiates earlier than damage for temperatures above 900℃. However, at the strain rate of 10 s−1, the damage initiates before DRX for all temperatures. At the strain rate of 0.1 s−1 and 1200℃, no damage is initiated.
Critical stress in the matrix at damage initiation and DRX at the strain rate of (a) 0.1, (b) 1, and (c) 10 s−1.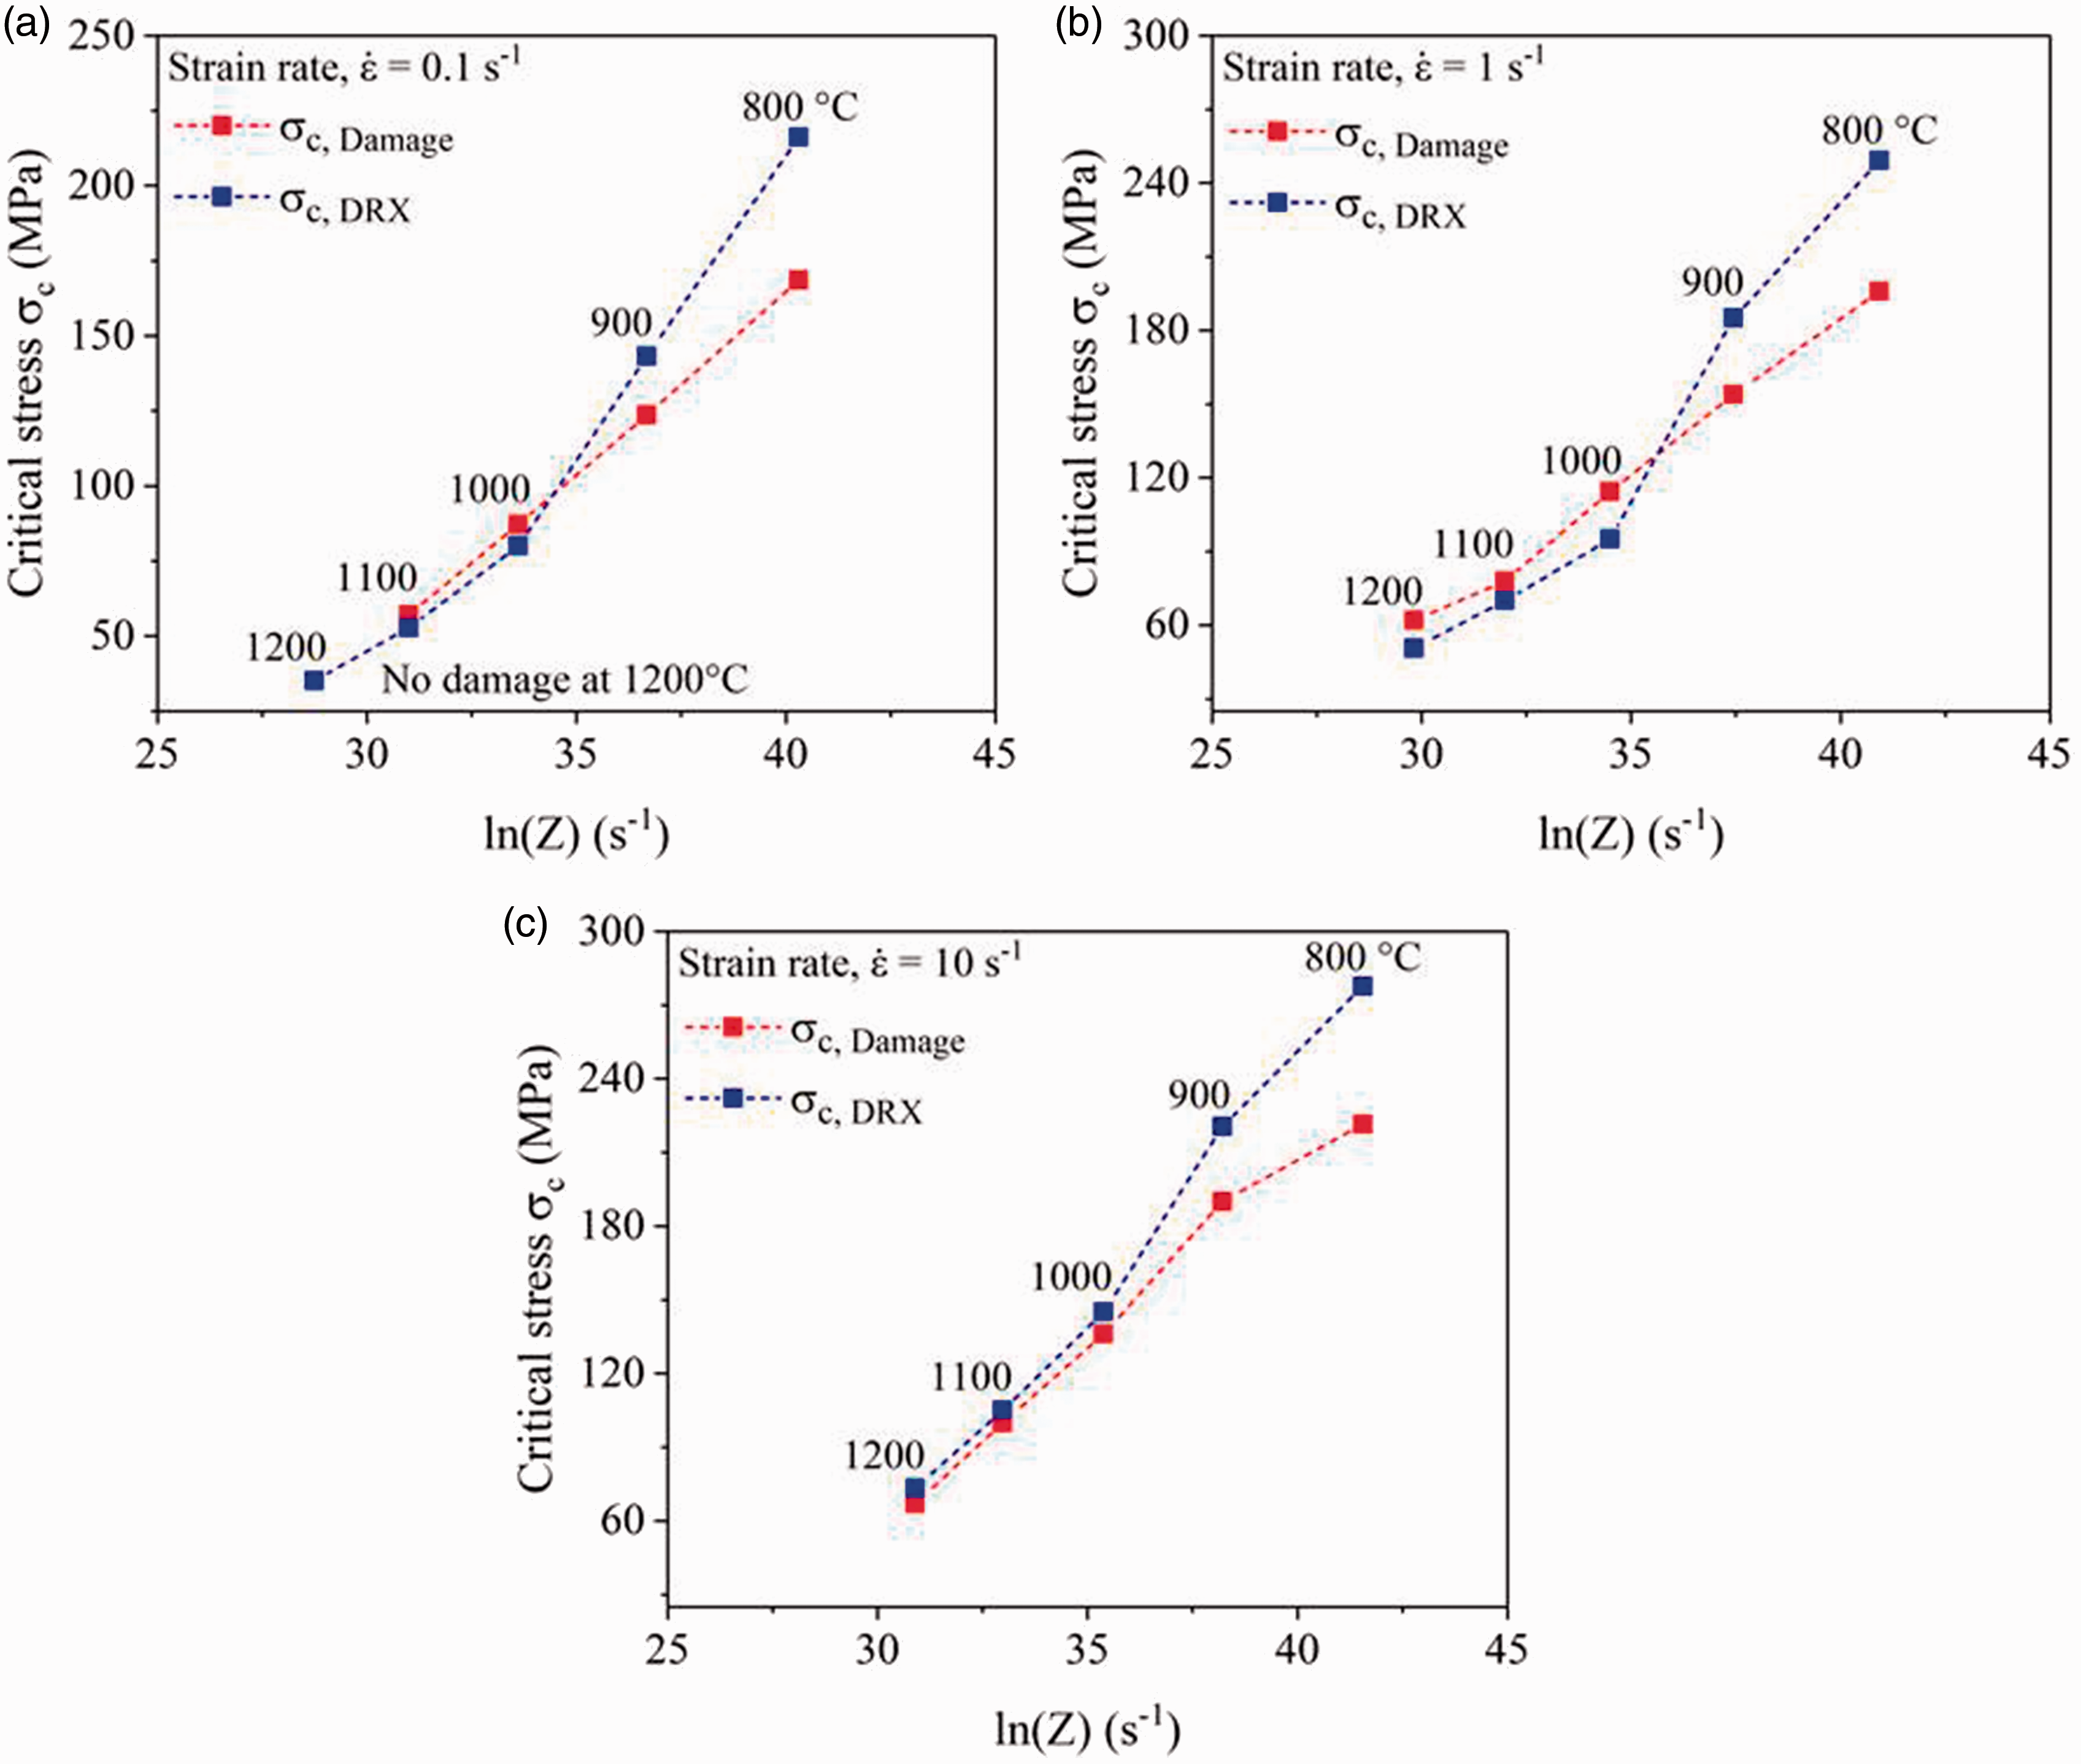
Influence of stress state
The damage development strongly depends upon the direction of loading that gives rise to different stress states in the material. In damage mechanics, the stress states are typically characterized by two non-dimensional parameters expressed in terms of the ratios of stress invariants: (i) stress triaxiality (
To explore the influence of stress states on the damage development, three different load cases were selected: (i) axial tension, (ii) axial compression, and (iii) axial tension and radial compression. Figure 12 shows the schematic overview of the load cases. The corresponding Schematic of different load cases: (a) axial tension, (b) axial compression, and (c) axial tension and radial compression. Stress invariants for different load cases.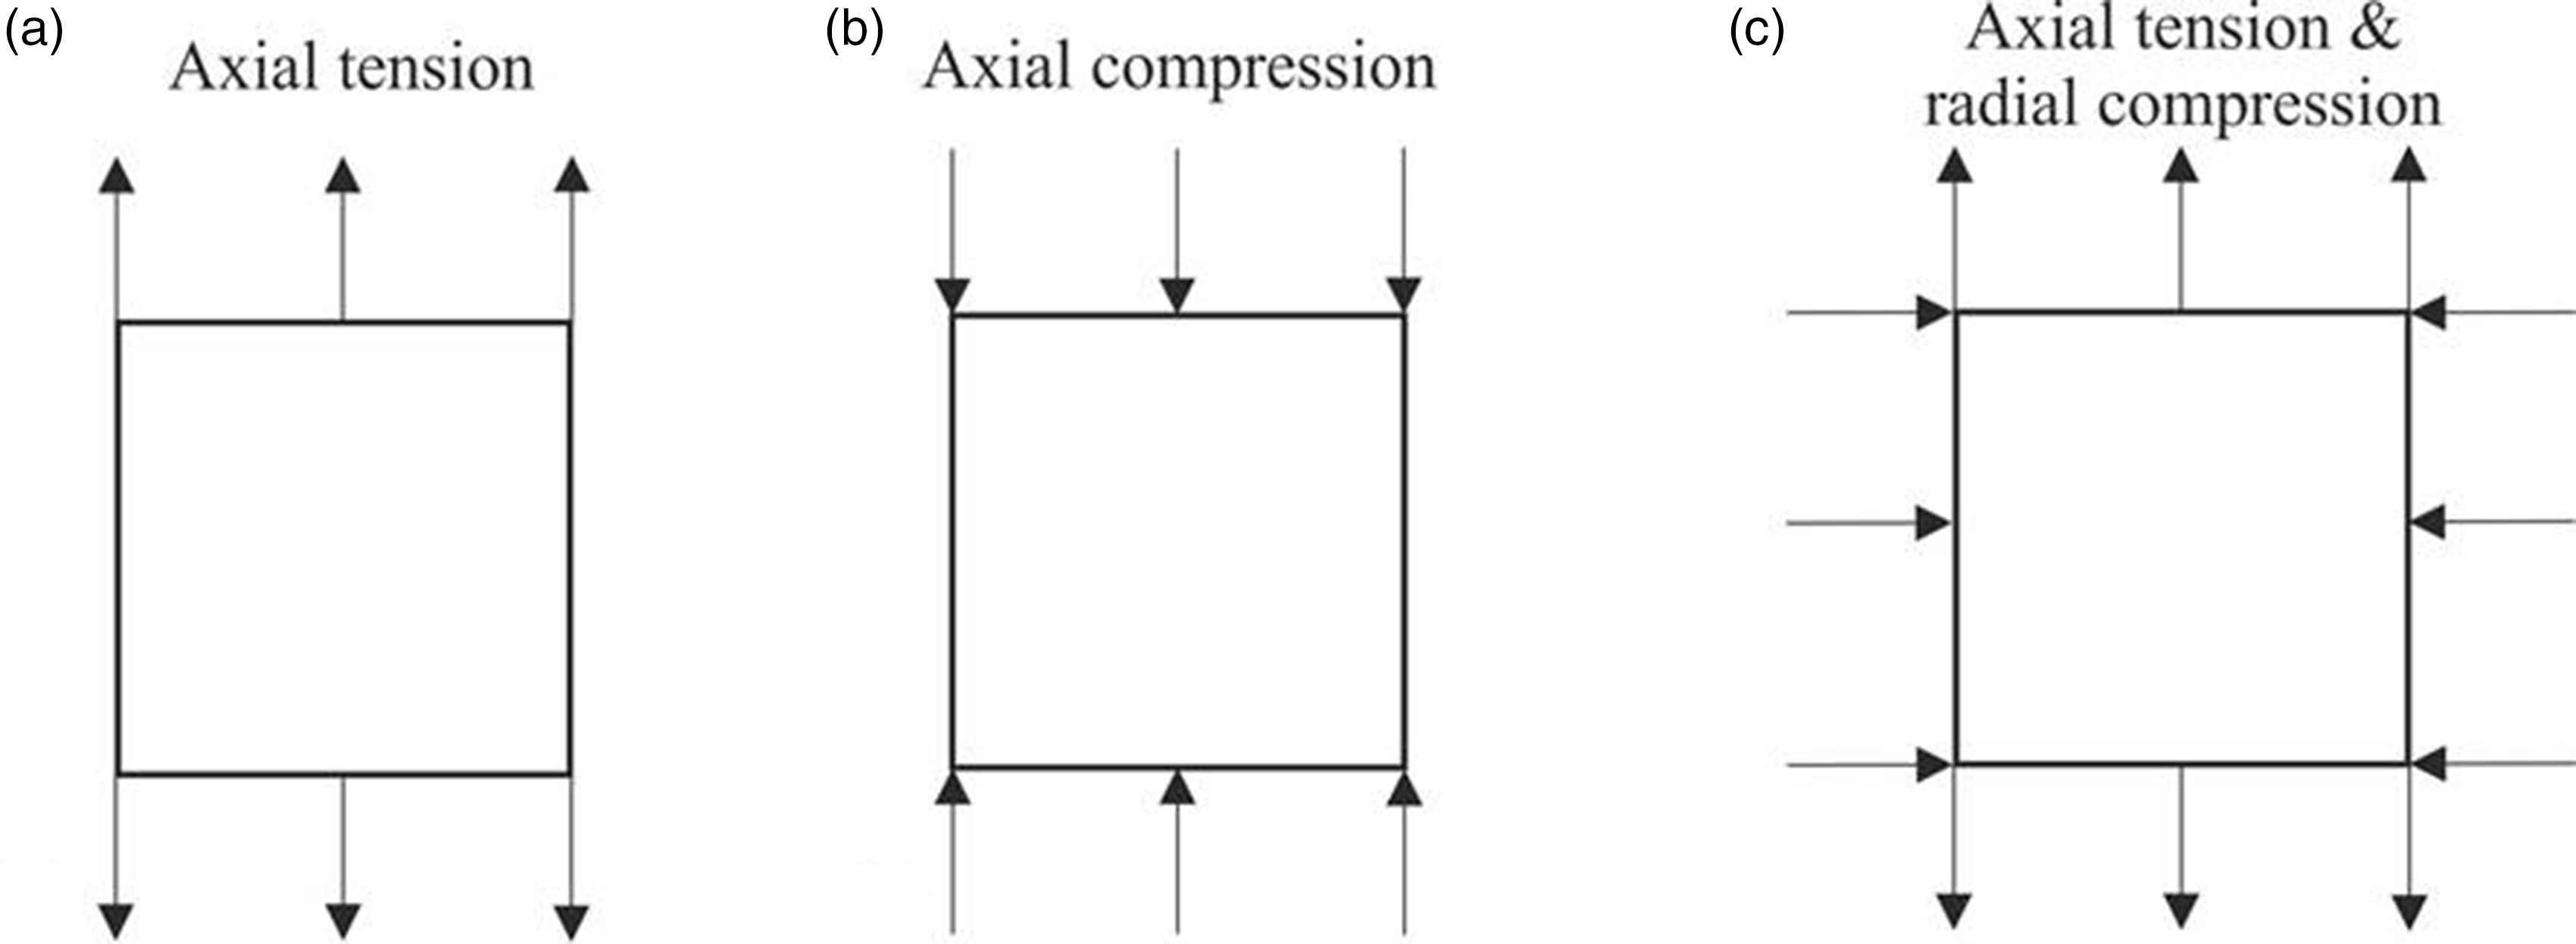
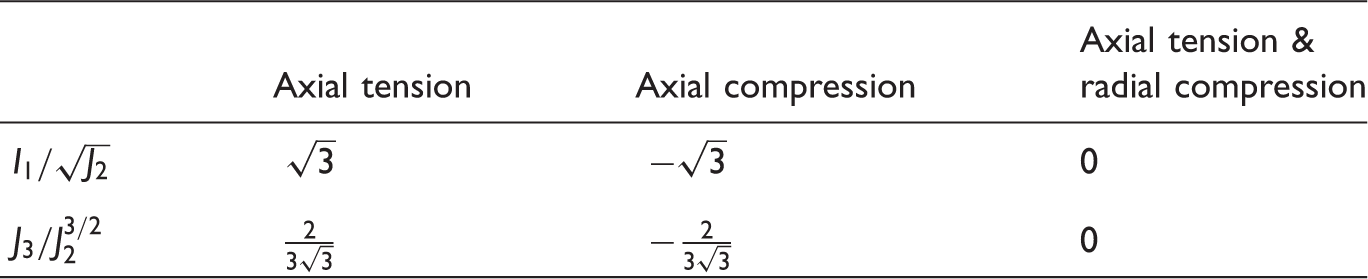
Figure 13 shows the damage evolution under different loading conditions. The results depict the fact that the damage initiation and growth depend on the loading direction. The axial tension case yields the highest damage in the material. The damage initiates much earlier in the case of axial tension as compared to two other cases. The damage growth is also quite fast under axial tension and the total damage is higher. In contrast to axial tension, axial compression delays the damage initiation and the total damage is lower. In the case of axial tension and radial compression, the damage initiation and growth seem to be controlled by the axial tension, as the damage behavior is similar to the pure axial tension case, but the radial compression delays the initiation and reduces the total damage. One possible reason for the different damage behavior under different loading conditions can be the friction at the matrix–inclusion interface. The frictional force generates in the direction of relative motion. In the case of axial tension, the frictional force decreases due to small shear forces as the matrix tends to detach from the inclusion. In axial compression case, the matrix tends to flow along the inclusion boundaries that give rise to higher shear forces and hence higher frictional force, eventually delays the damage initiation, and decreases total damage.
Comparison of the damage initiation and growth under different loading direction at same deformation conditions.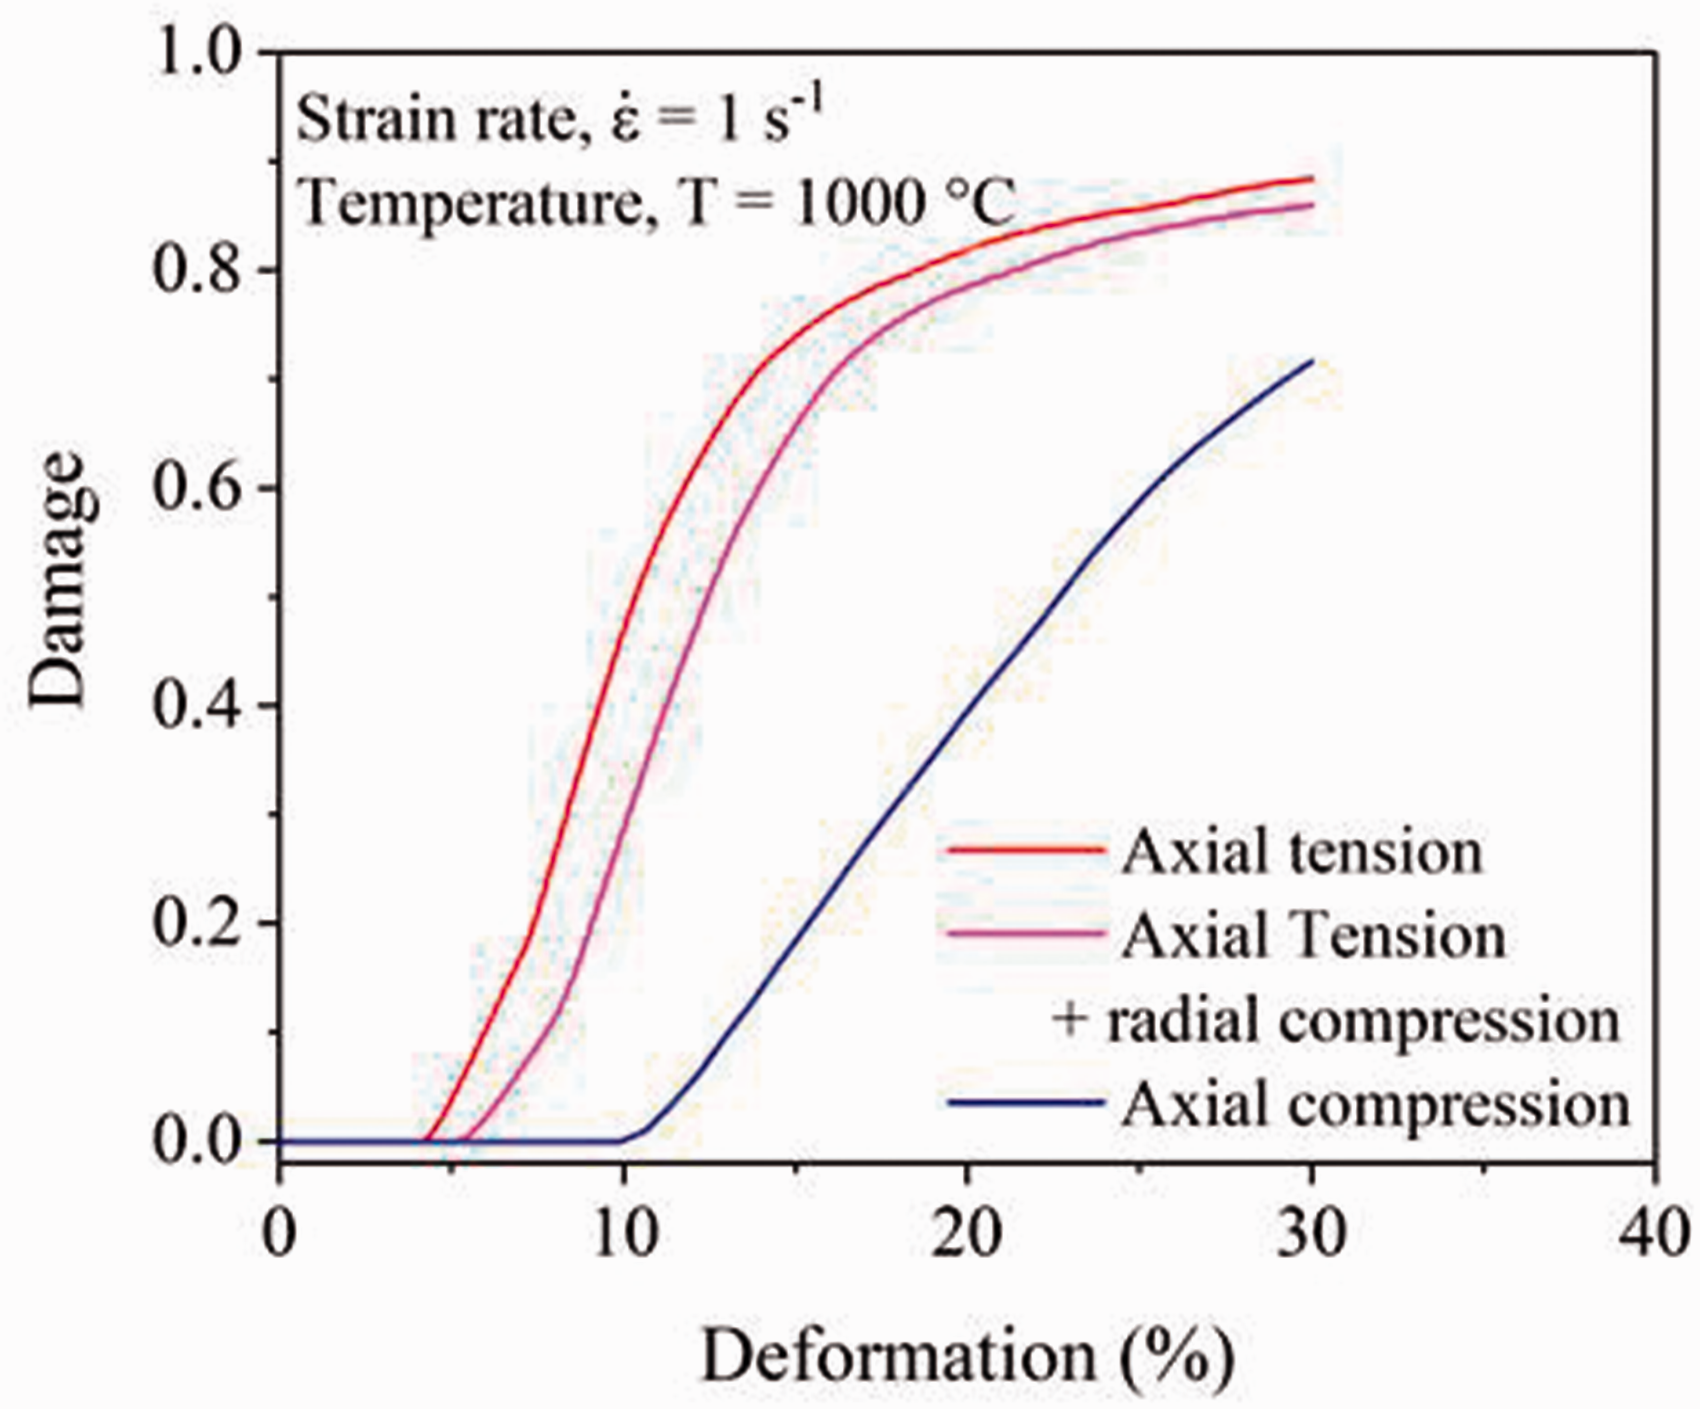
Along with the different damage evolution in the material under different stress states, the damage initiates due to different modes of stresses. Figure 14 portrays the stress components responsible for damage initiation using cohesive elements under the three load cases. The damage initiates due to normal stress under axial tension and axial tension and radial compression whereas due to shear stress under axial compression.
Critical stress components in the cohesive elements at damage initiation under different loading conditions.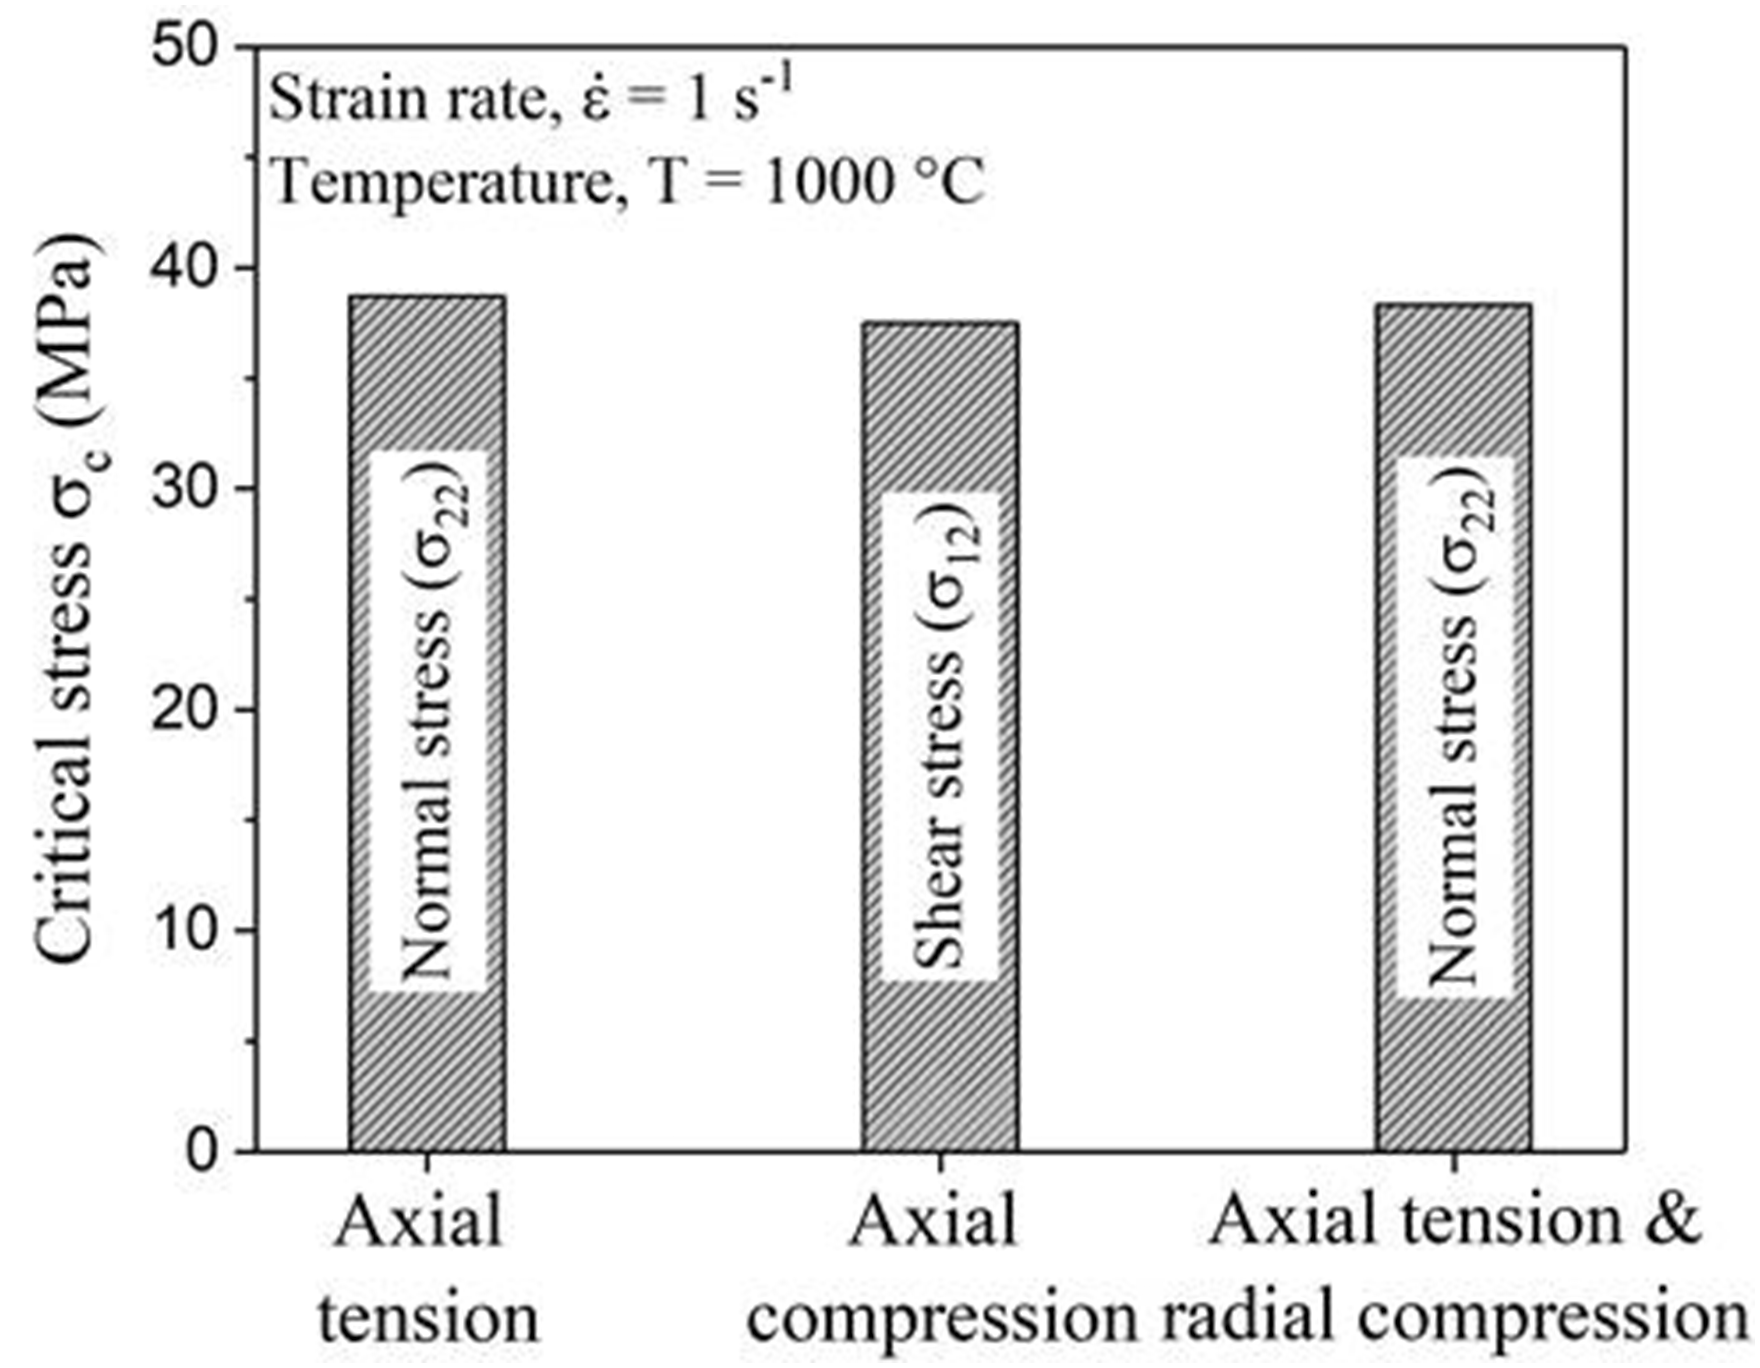
Figure 15 shows the FE contours of damage under three load cases. The matrix–inclusion–decohesion is larger under axial tension as compared to other two cases. The damage development in the case of the axial tension and axial tension and compression is due to normal separation of the matrix–inclusion interface whereas shear separation in axial compression case. The stress and X
DRX
distribution due to different loading conditions are presented in Figures 16 and 17, respectively. X
DRX
is higher in the case of axial compression as compared to two other load cases and hence, the corresponding flow stress in the matrix lowers the total damage under axial compression.
FE plots showing the amount of total damage and the corresponding size of nucleated void due to the matrix–inclusion–decohesion at 1000℃ and 1 s−1 under different loading cases: (a) axial tension, (b) axial compression, and (c) axial tension and radial compression. Average flow stress distribution in the matrix at 1000℃ and 1 s−1 under different loading cases: (a) axial tension, (b) axial compression, and (c) axial tension and radial compression. Recrystallized volume fraction (X
DRX
) distribution at 1000℃ and 1 s−1 under different loading cases: (a) axial tension, (b) axial compression, and (c) axial tension and radial compression.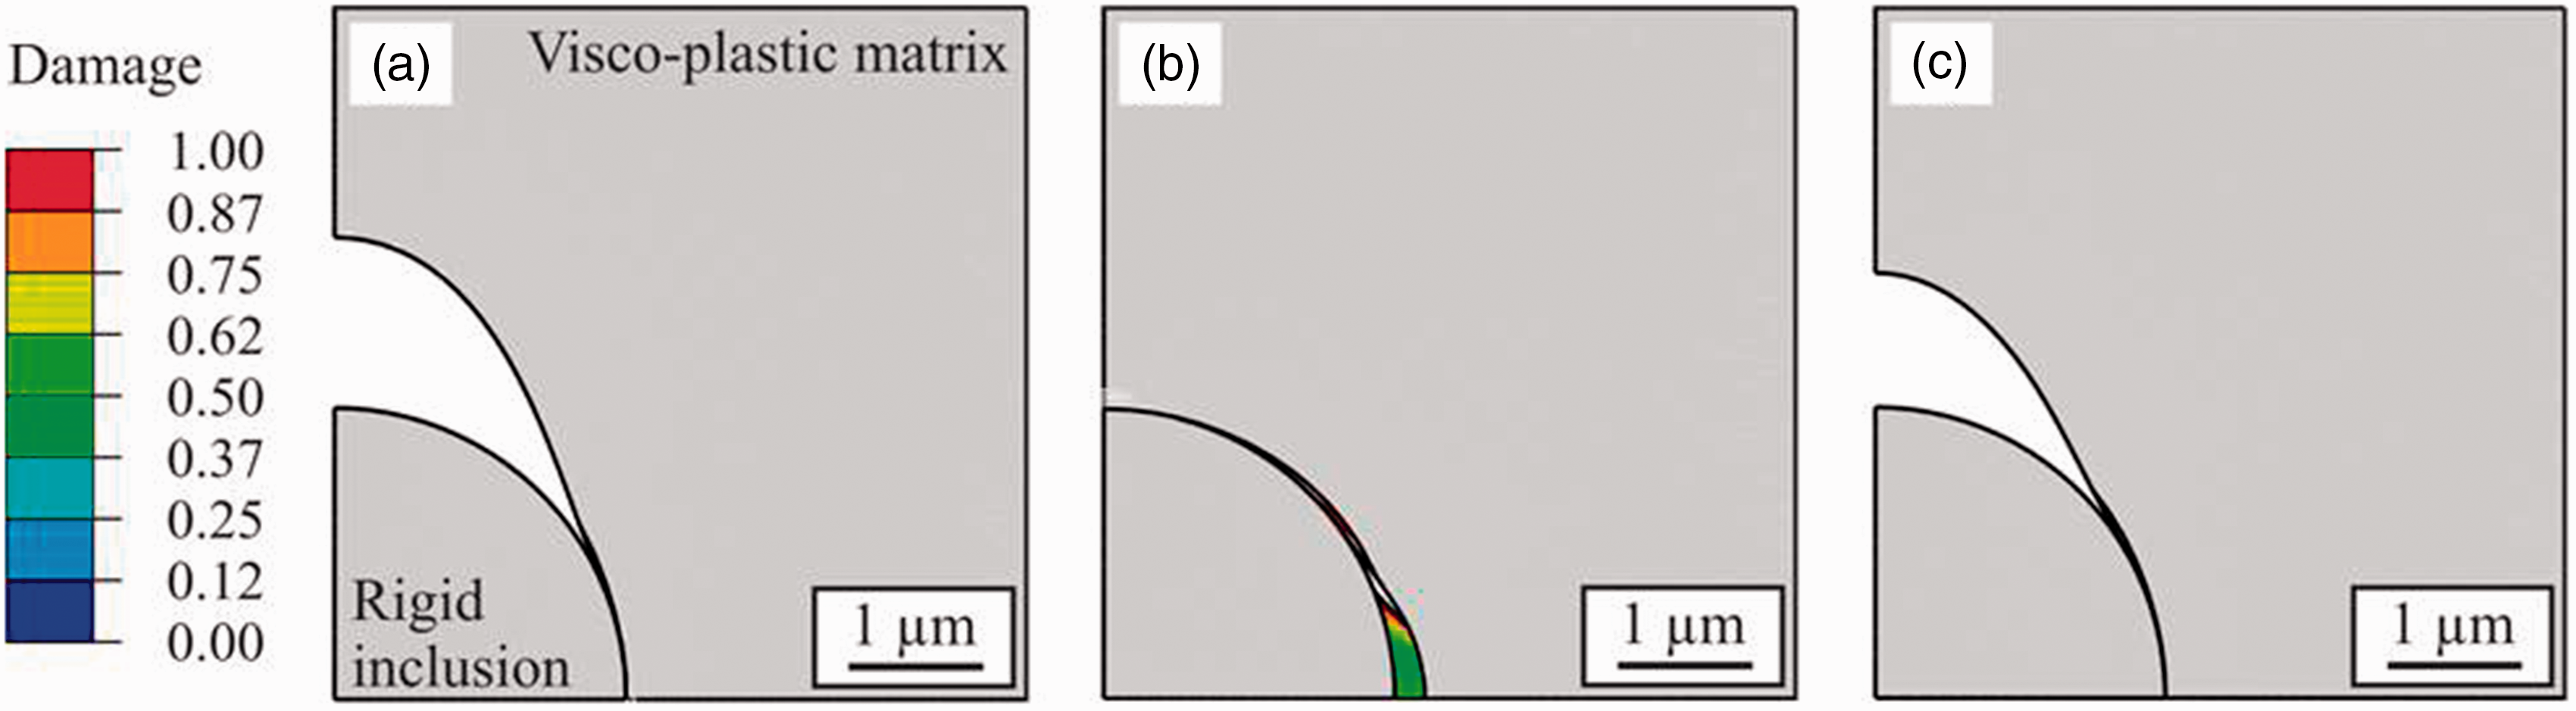
Influence of temperature and strain rate
The deformation temperature and strain rate have an influence on the plastic flow of the matrix, the properties of the inclusion and hence the magnitude of mechanical stresses at the interface. At microscopic level, high temperature increases the mobility of the dislocations that control the local stress concentration at the matrix–inclusion interface. For the development of a damage evolution law, it is required to quantify the effect of temperature and strain rate on the damage evolution. Thus, the RVE-FE simulations are conducted for different deformation temperatures and strain rates under uniaxial stress state up to 30% deformation where the matrix recrystallizes according to the Beynon–Sellars model and the interface between the matrix and the inclusion damages according to the temperature-dependent CZM.
The results obtained in terms of damage evolution curves for different temperatures at different strain rates under tension are presented in Figure 18. Based on the obtained data, three main conclusions about the temperature- and strain rate-dependent damage initiation and growth can be drawn: (i) high temperatures and low strain rates delay damage initiation, (ii) the rate of damage growth is slower at higher temperatures, and (iii) damage growth is faster at high strain rates.
Characteristic curves for the damage initiation and growth for different deformation temperatures under a uniaxial stress state up to 30% deformation at the strain rate of: (a) 0.1, (b) 1, and (c) 10 s−1.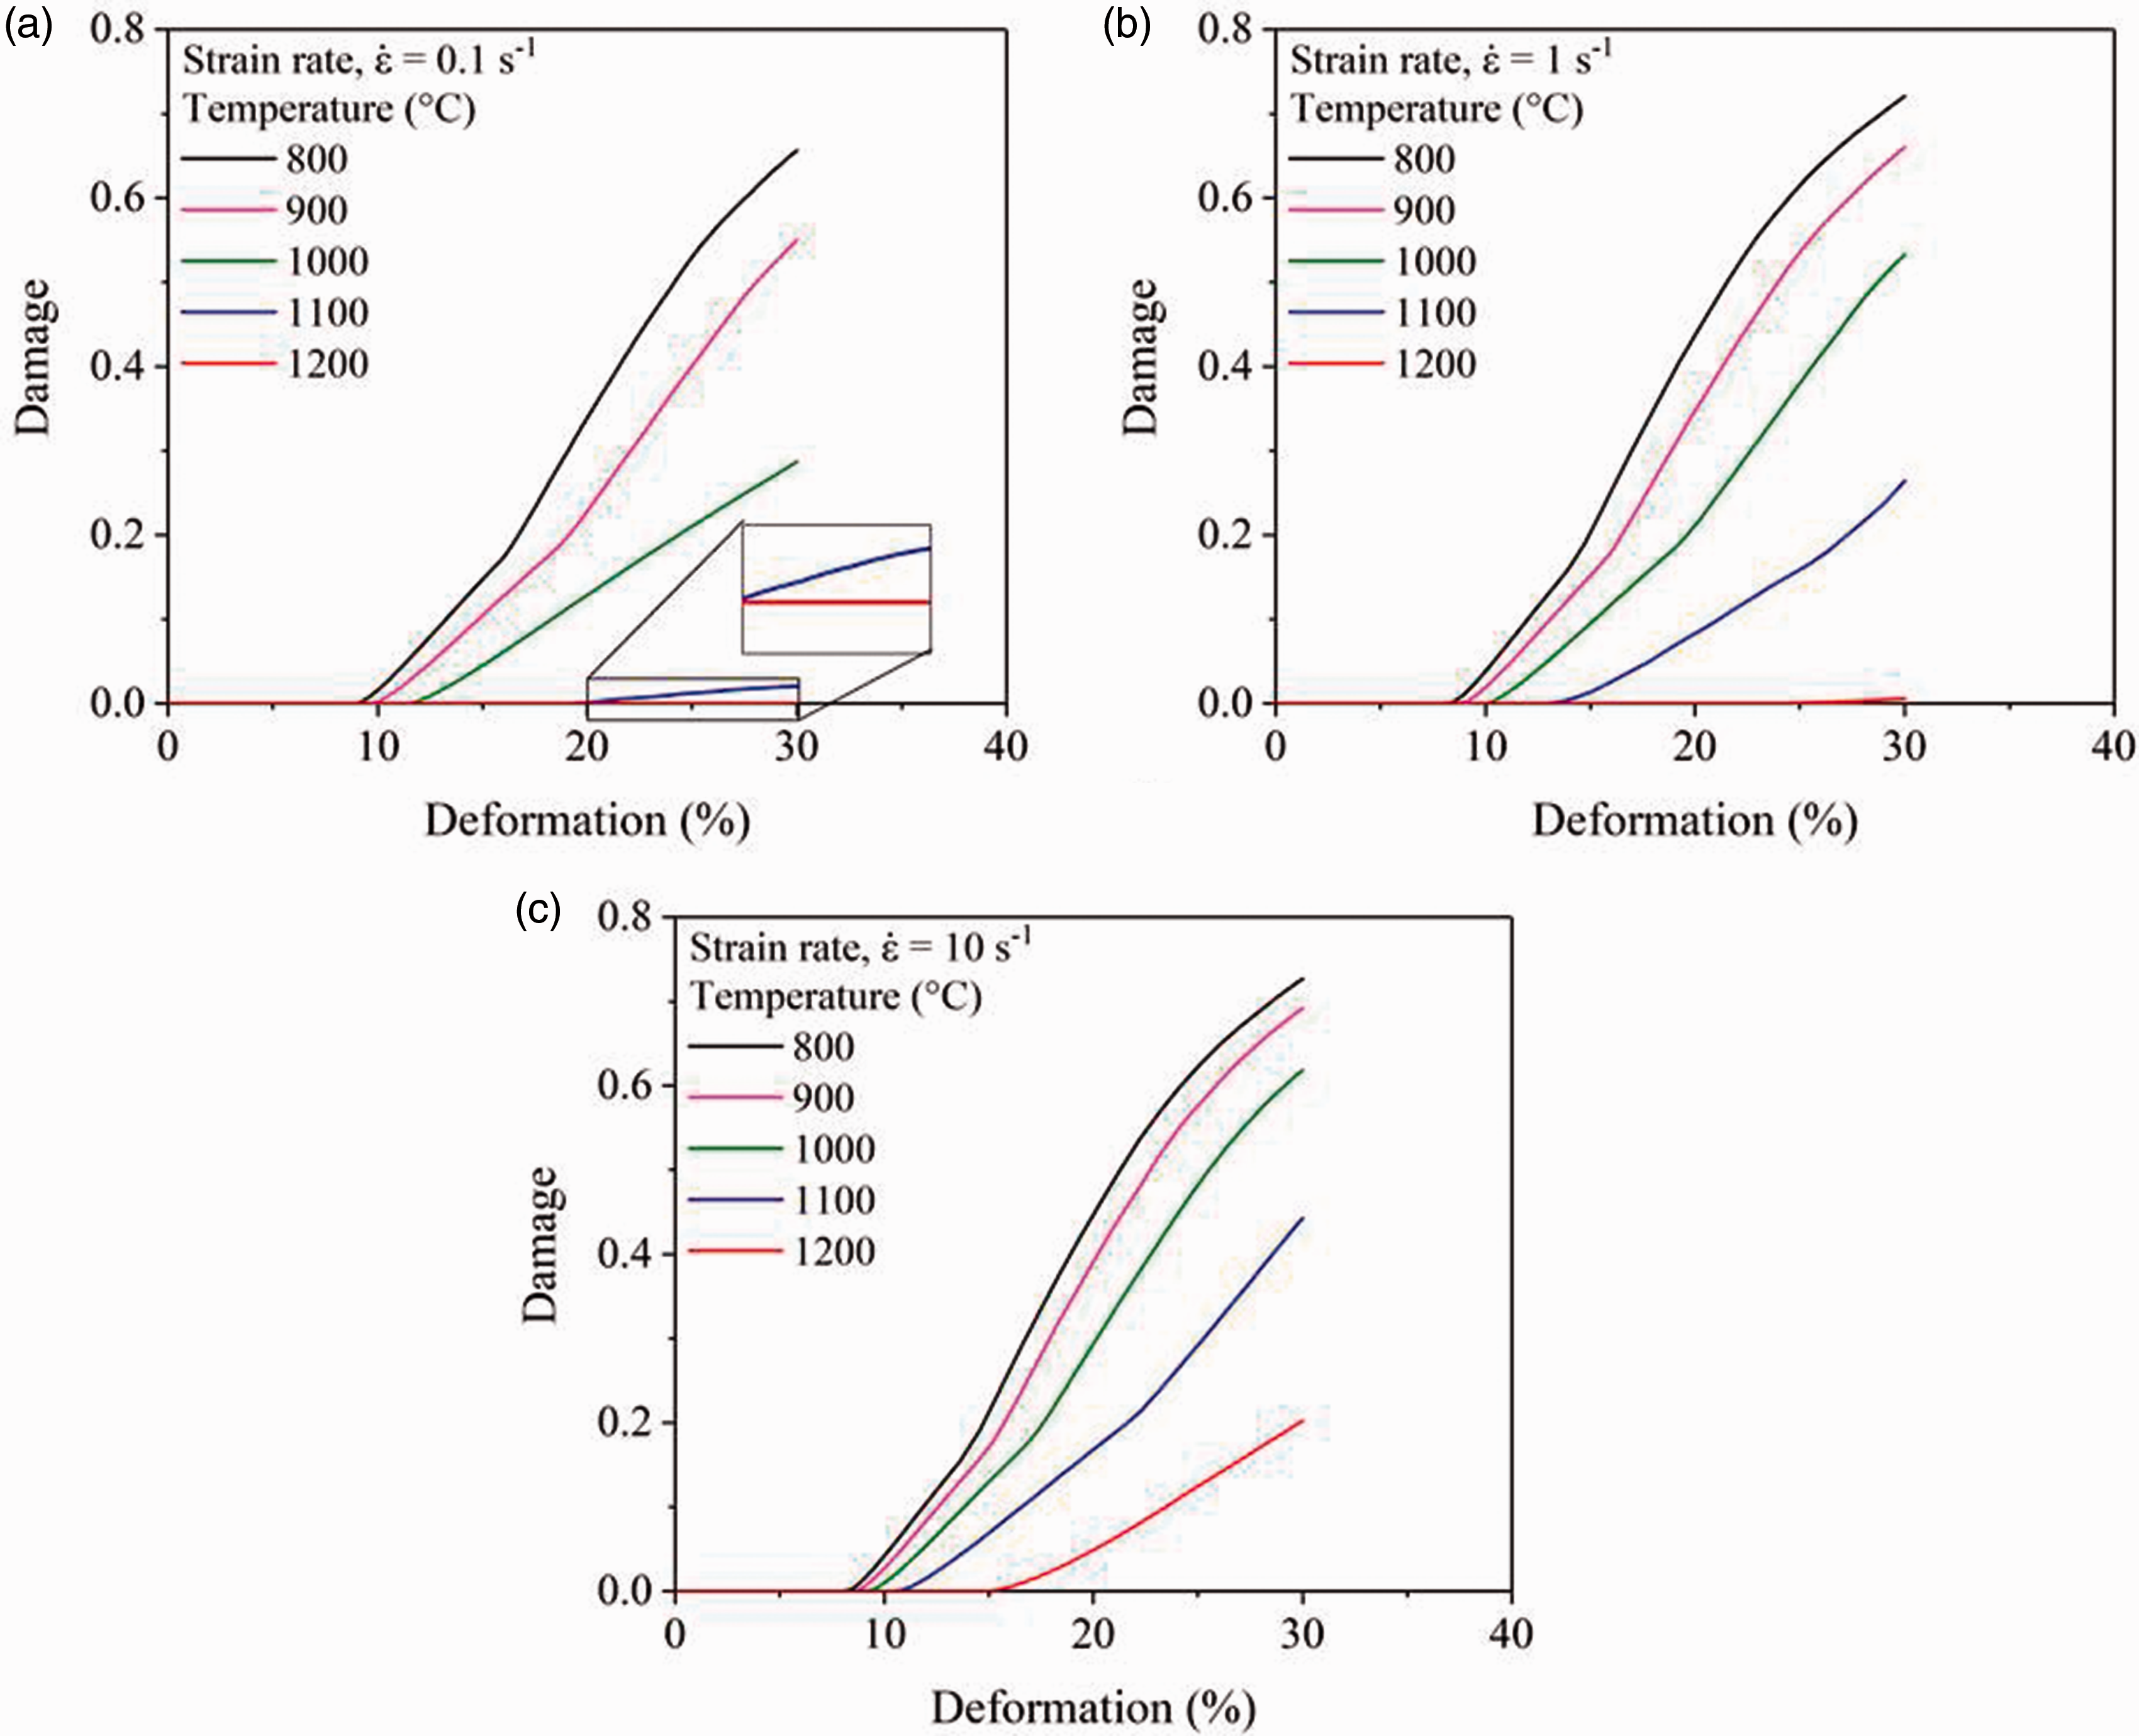
Figure 19(a) shows the overview of the influence of temperature on the total damage. The results show that for different temperatures, the amount of total damage decreases with increasing temperature at constant strain rate and the rate of damage decrease is more pronounced at lower strain rates. Figure 19(b) represents the overview of the influence of strain rates on damage evolution. The course of the damage variable shows that for different strain rates, the total damage decreases at low strain rates and the rate of increase of total damage decreases with increasing temperature. The reason for the decrease in total damage at high temperature and low strain rate is a consequence of the reduction in flow stress in the matrix material due to DRX. In Figure 20, the average flow stresses in the matrix is presented for different deformation conditions.
Comparison of the total damage curves under a uniaxial stress state up to 30% deformation for different deformation temperatures (a) and strain rates (b). Average flow stress in the matrix due to DRX for different deformation conditions under a uniaxial stress state up to 30% deformation.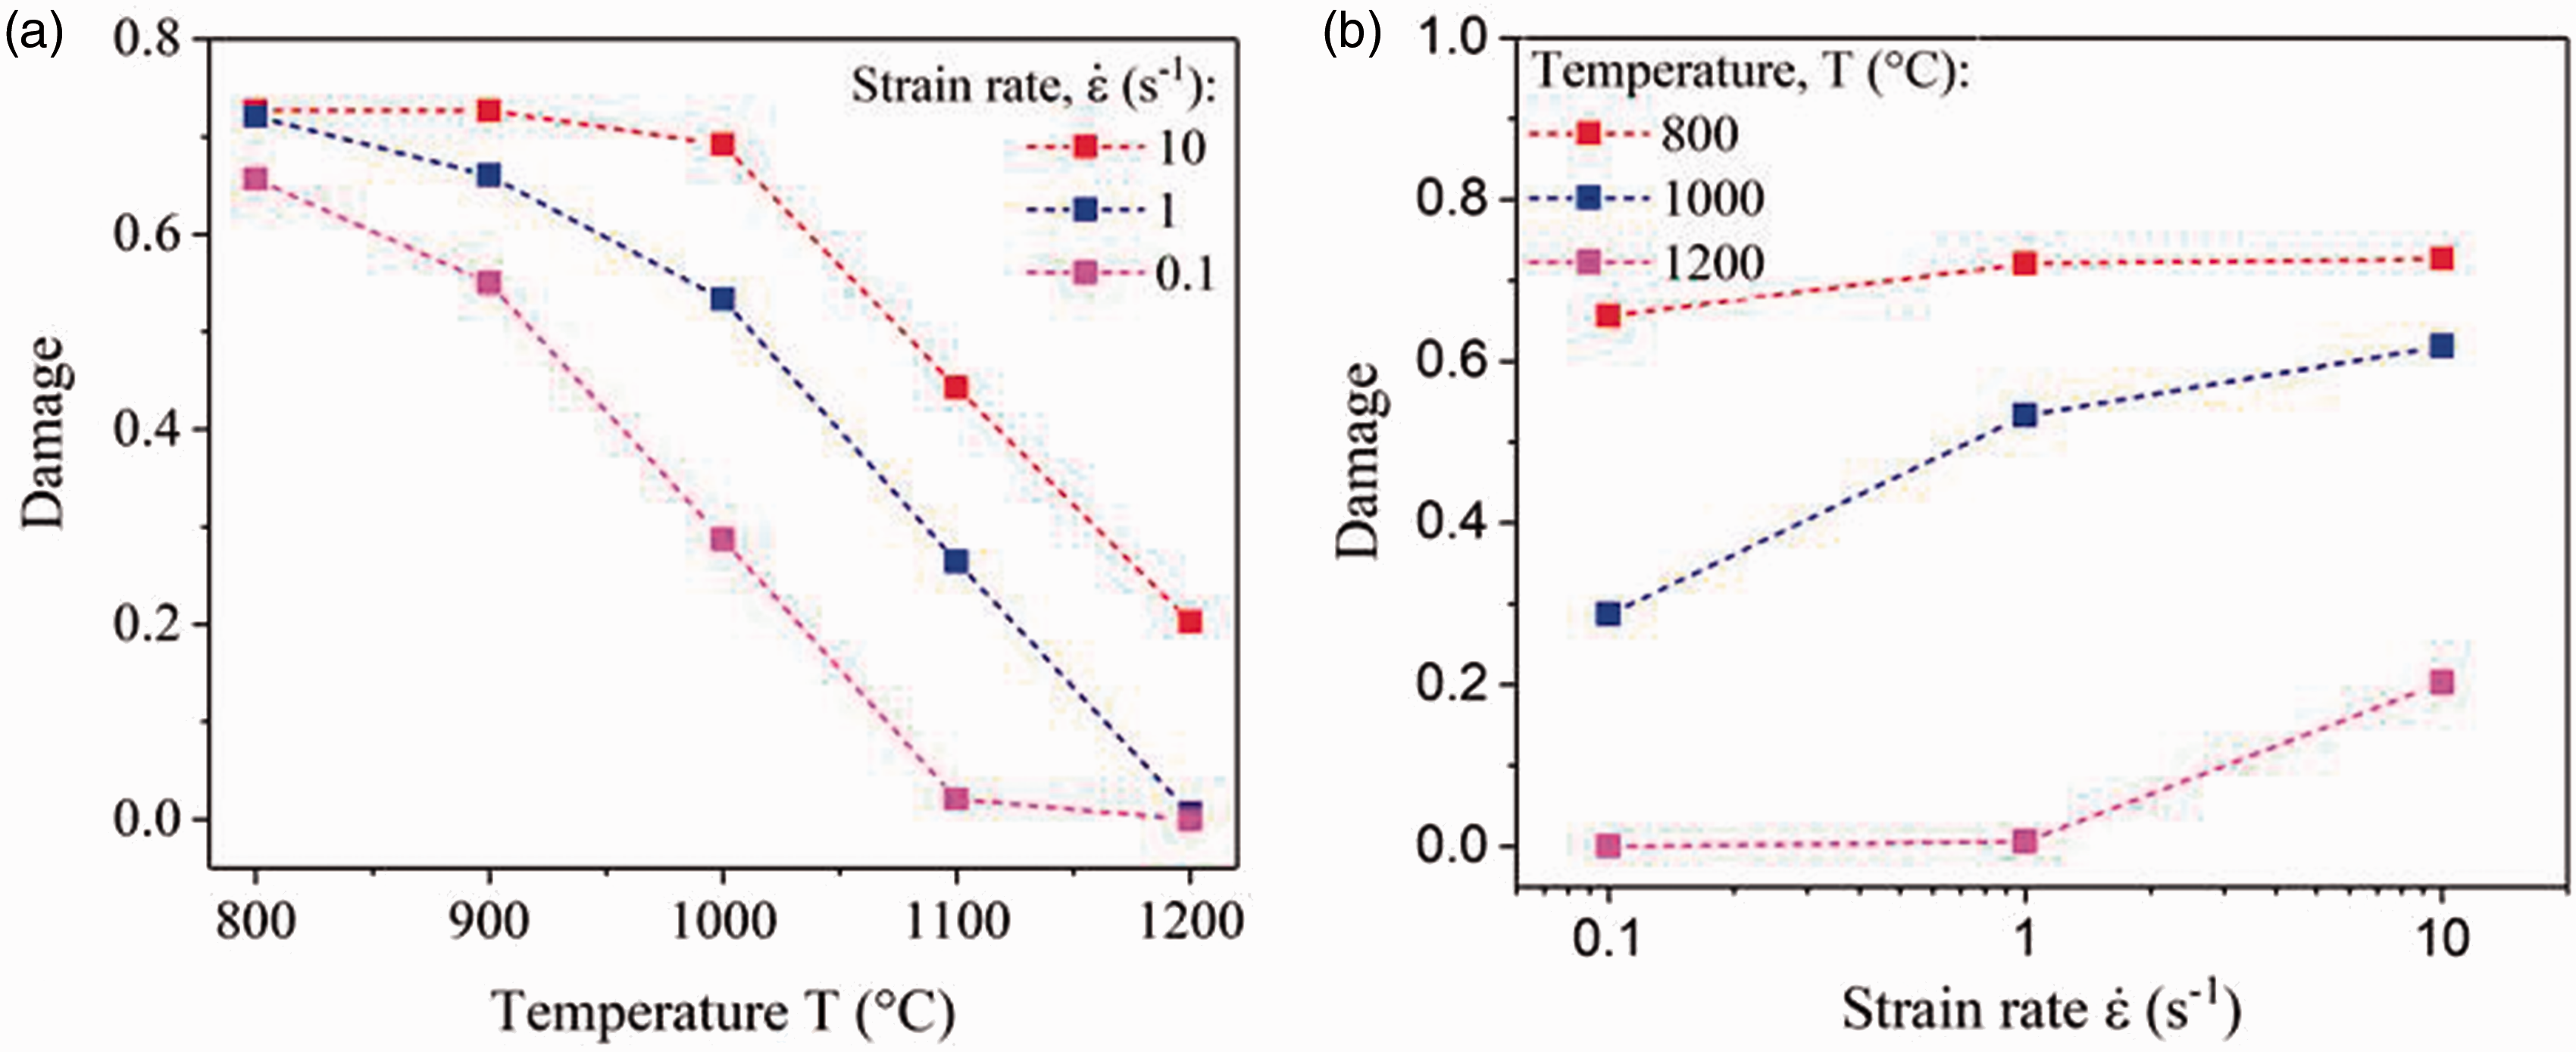
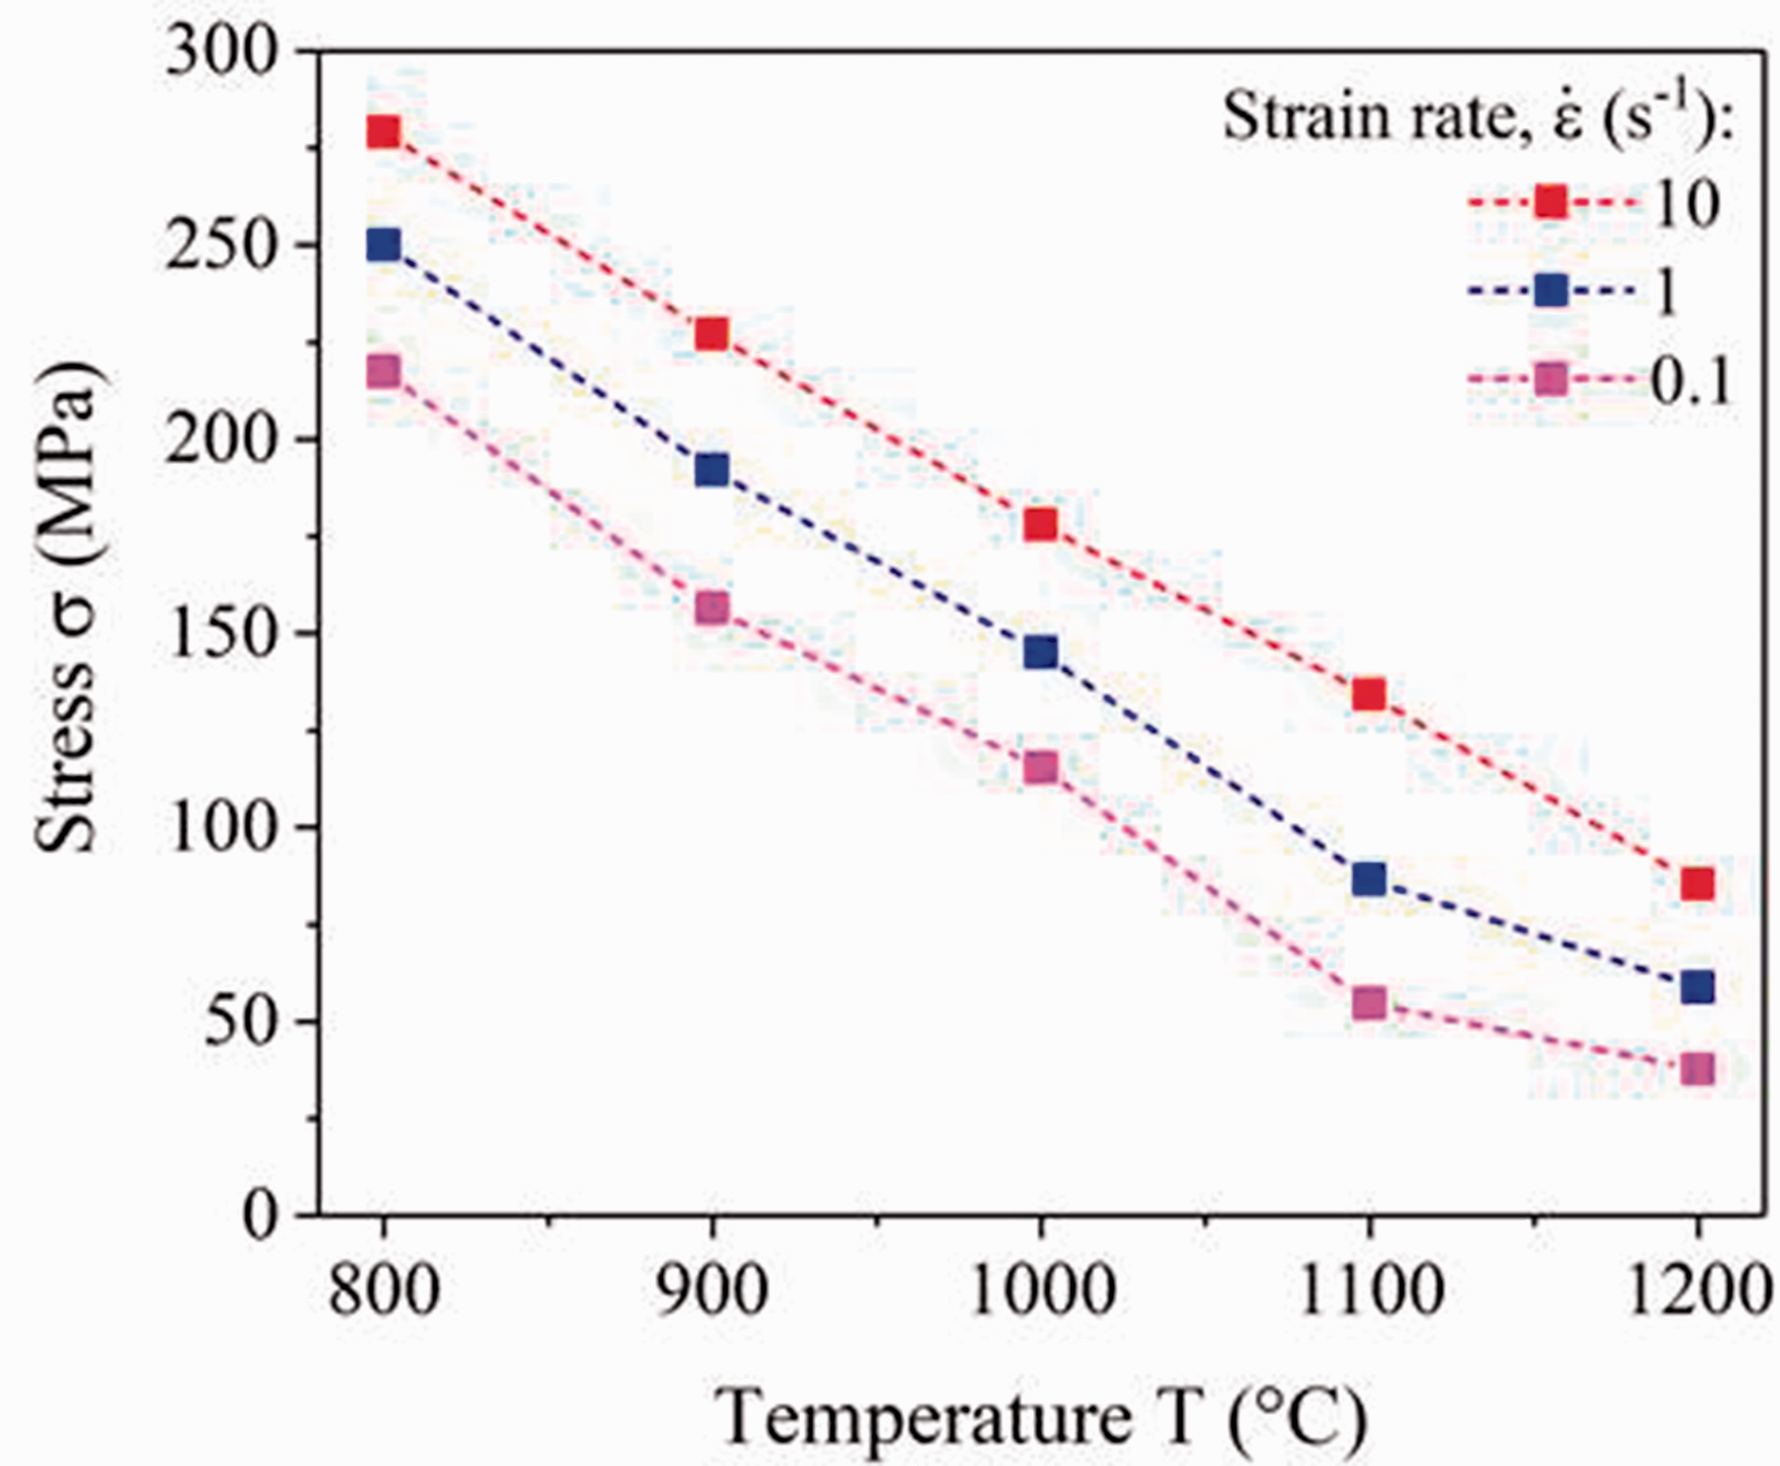
Figure 21 shows the FE contours of the interface damage for 30% reduction of the unit-cell RVE for different temperatures at a strain rate of 1 s−1. The decohesion is more pronounced at lower temperatures.
FE plots showing the amount of total damage and the corresponding opening of the nucleated void due to the matrix–inclusion–decohesion under a uniaxial stress state up to 30% deformation at the strain rate of 1 s−1 under different deformation temperatures: (a) 800, (b) 900, (c) 1000, (d) 1100, and (e) 1200℃.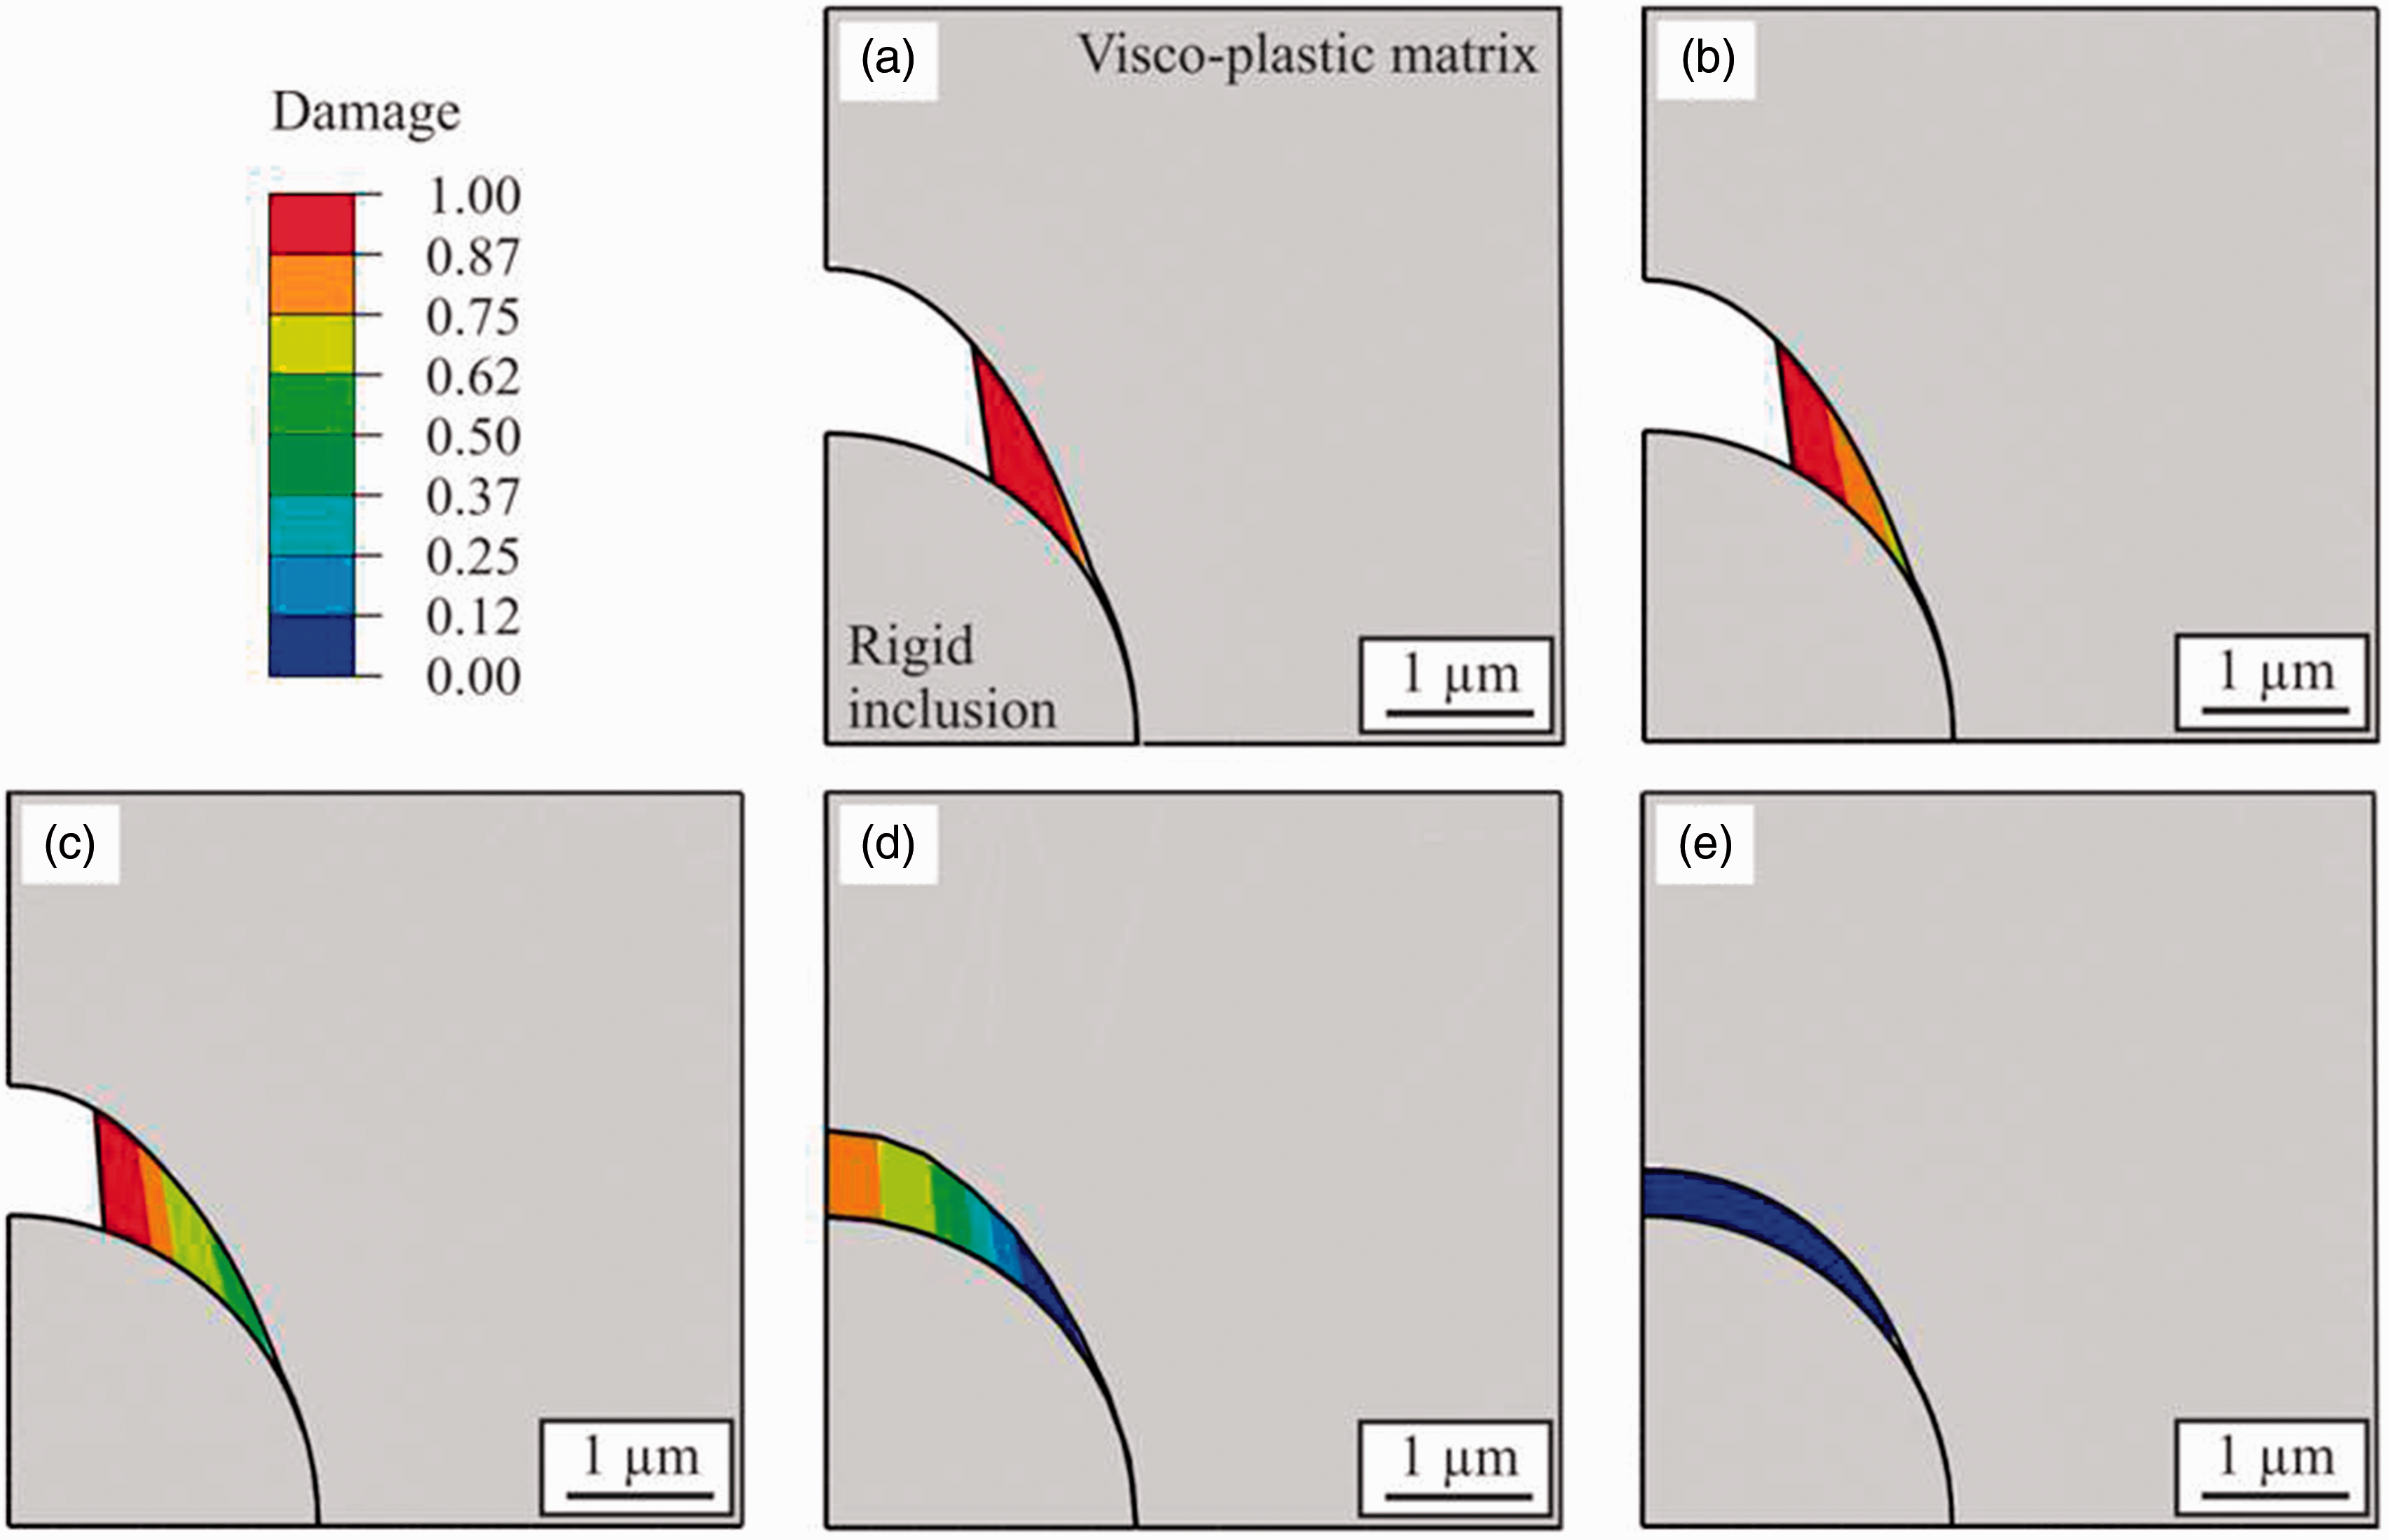
Figure 22 shows the effect of strain rate on damage for 30% reduction of the unit-cell RVE at a temperature of 1000℃. The matrix–inclusion–decohesion is more pronounced at higher strain rates.
FE plots showing the amount of total damage and the corresponding size of nucleated void due to the matrix–inclusion–decohesion under a uniaxial stress state up to 30% deformation at 1000℃ under different strain rates: (a) 0.1, (b) 1, and (c) 10 s−1.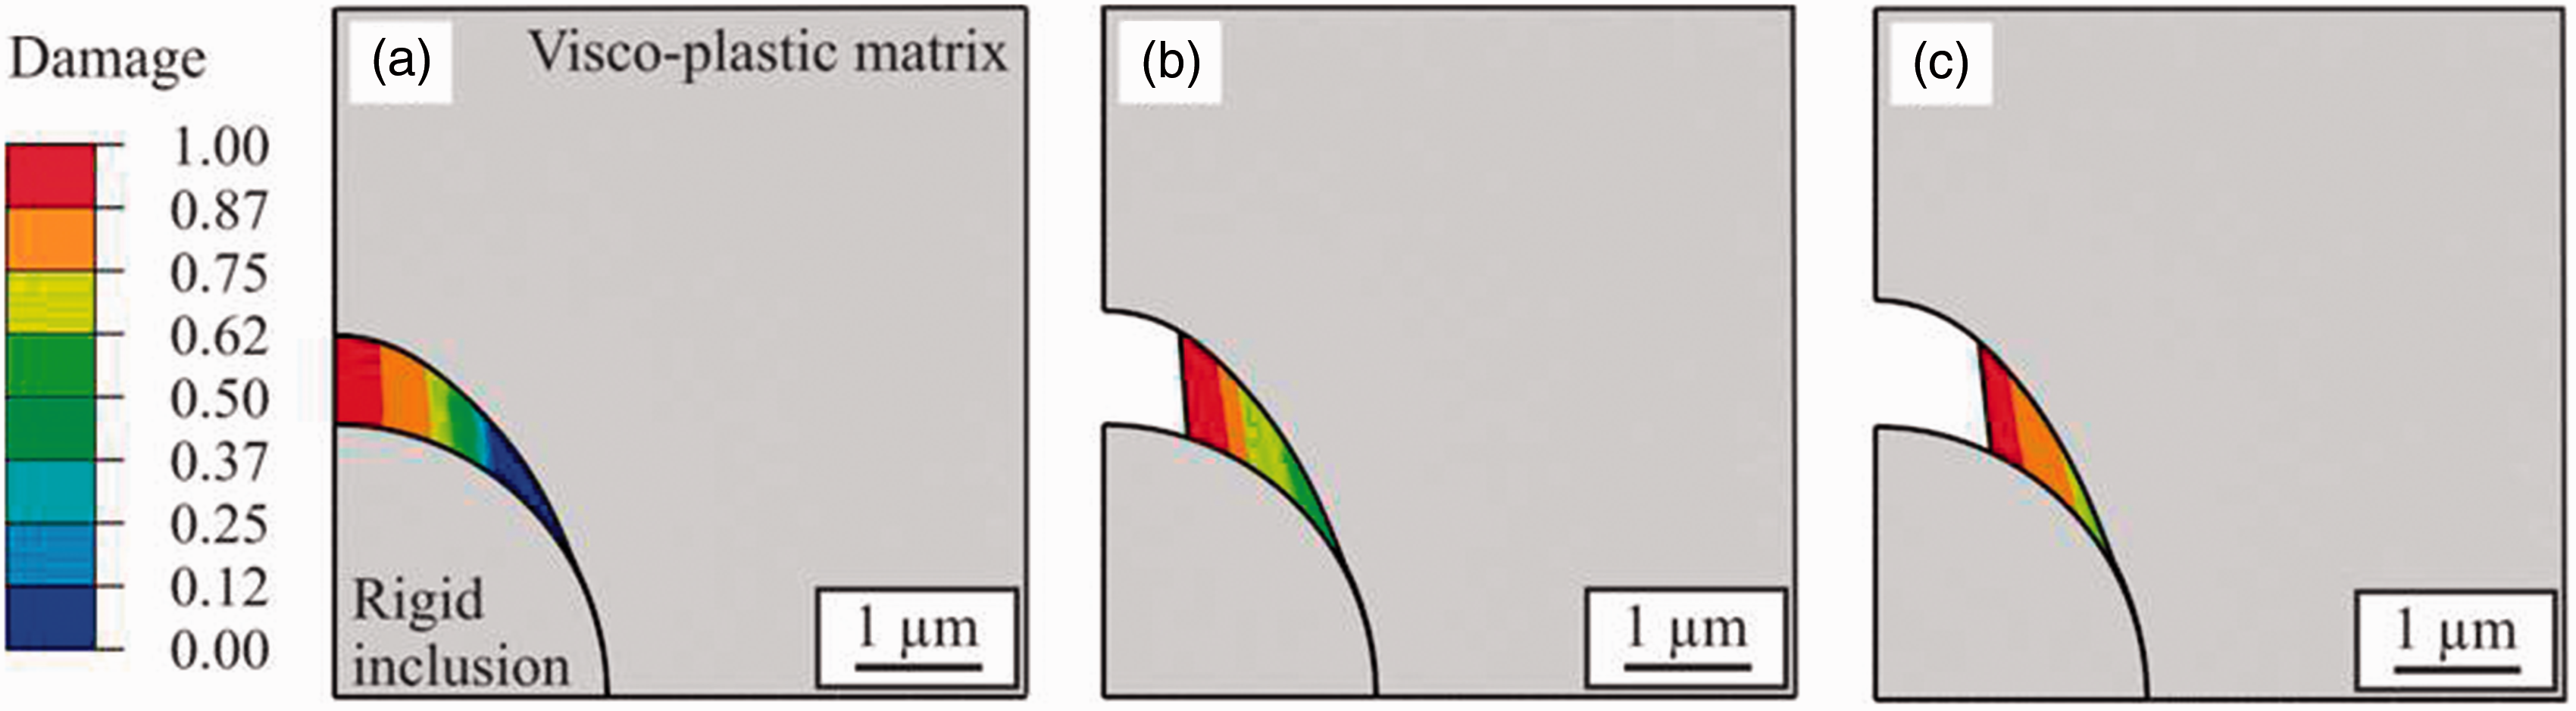
Influence of total strain
The effect of the degree of deformation on the damage development is explored by deforming the RVE under tension to different levels of total strain (15, 20, 25, 30, 45 and 60%). Additionally, the total strain-dependent damage behavior is quantified at three temperatures: 800, 1000, and 1200℃. Figure 23 shows the damage plots at different total strains for different level of temperatures. For 800 and 1000℃, the damage growth rate is quite fast up to 0.3 strain followed by a slower growth up to a strain of 0.6. At high temperature, no influence of total strain is observed.
Comparison of the total damage curves under a uniaxial stress state up to 30% deformation for different total strains.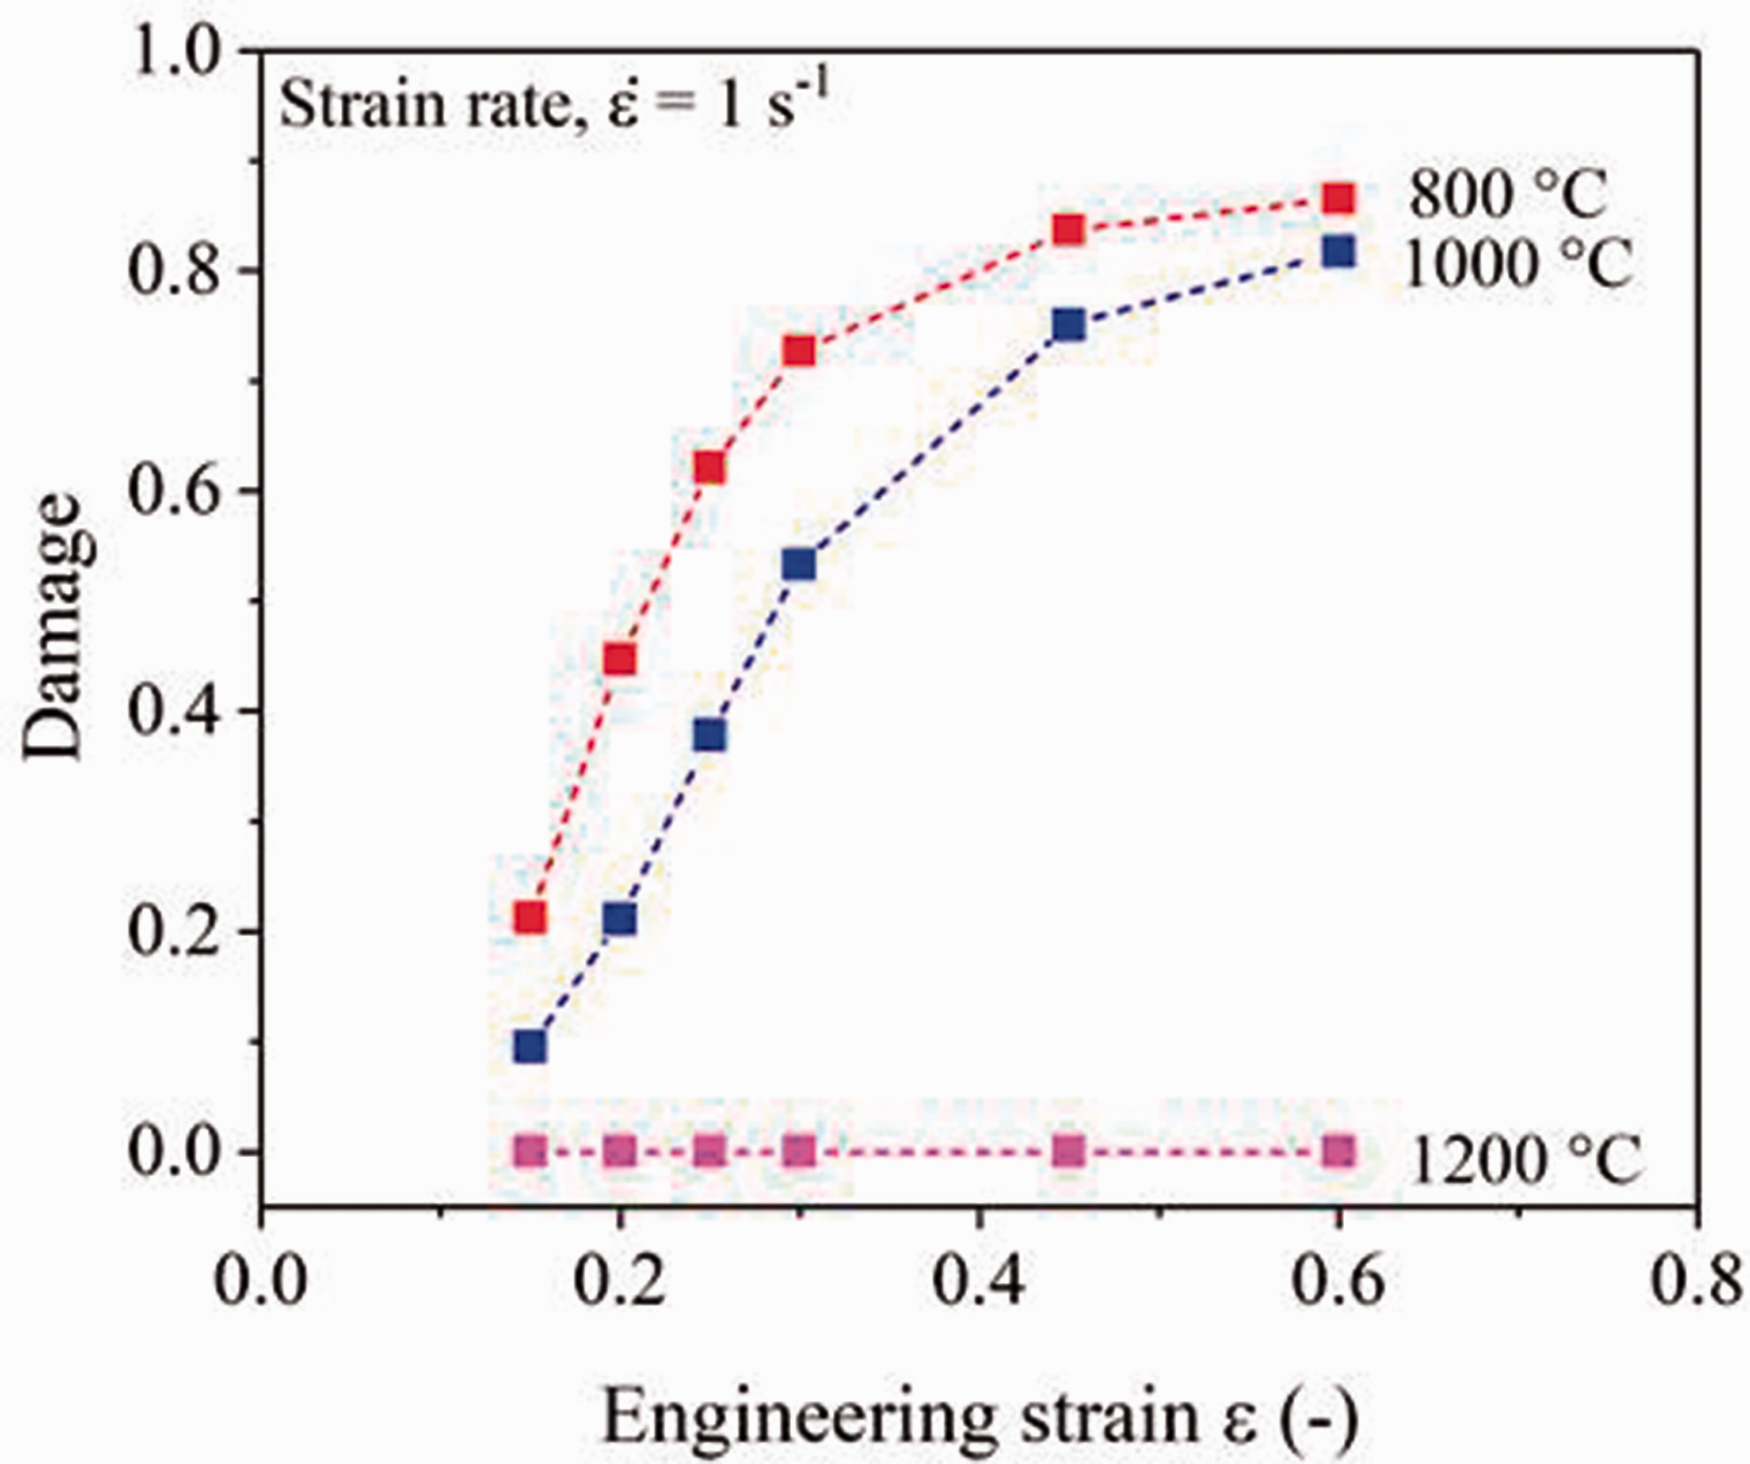
Figure 24 portrays the FE contours for different levels of strain. The damage contours show that the shape of nucleated voids changes from round to elliptical at higher total strain. The quantification results of the total strain-dependent damage showed that the influence of total strain on damage development is more pronounced at low temperatures and less effective at high temperatures. Moreover, the rate of damage development at different levels of strain increases with decreasing temperatures.
FE plots showing the amount of total damage and corresponding size of nucleated void due to the matrix–inclusion–decohesion under a uniaxial stress state up to 30% deformation at 1000℃ and strain rate of 1 s−1 at total strain of: (a) 15, (b) 30, (c) 45, and (d) 60%.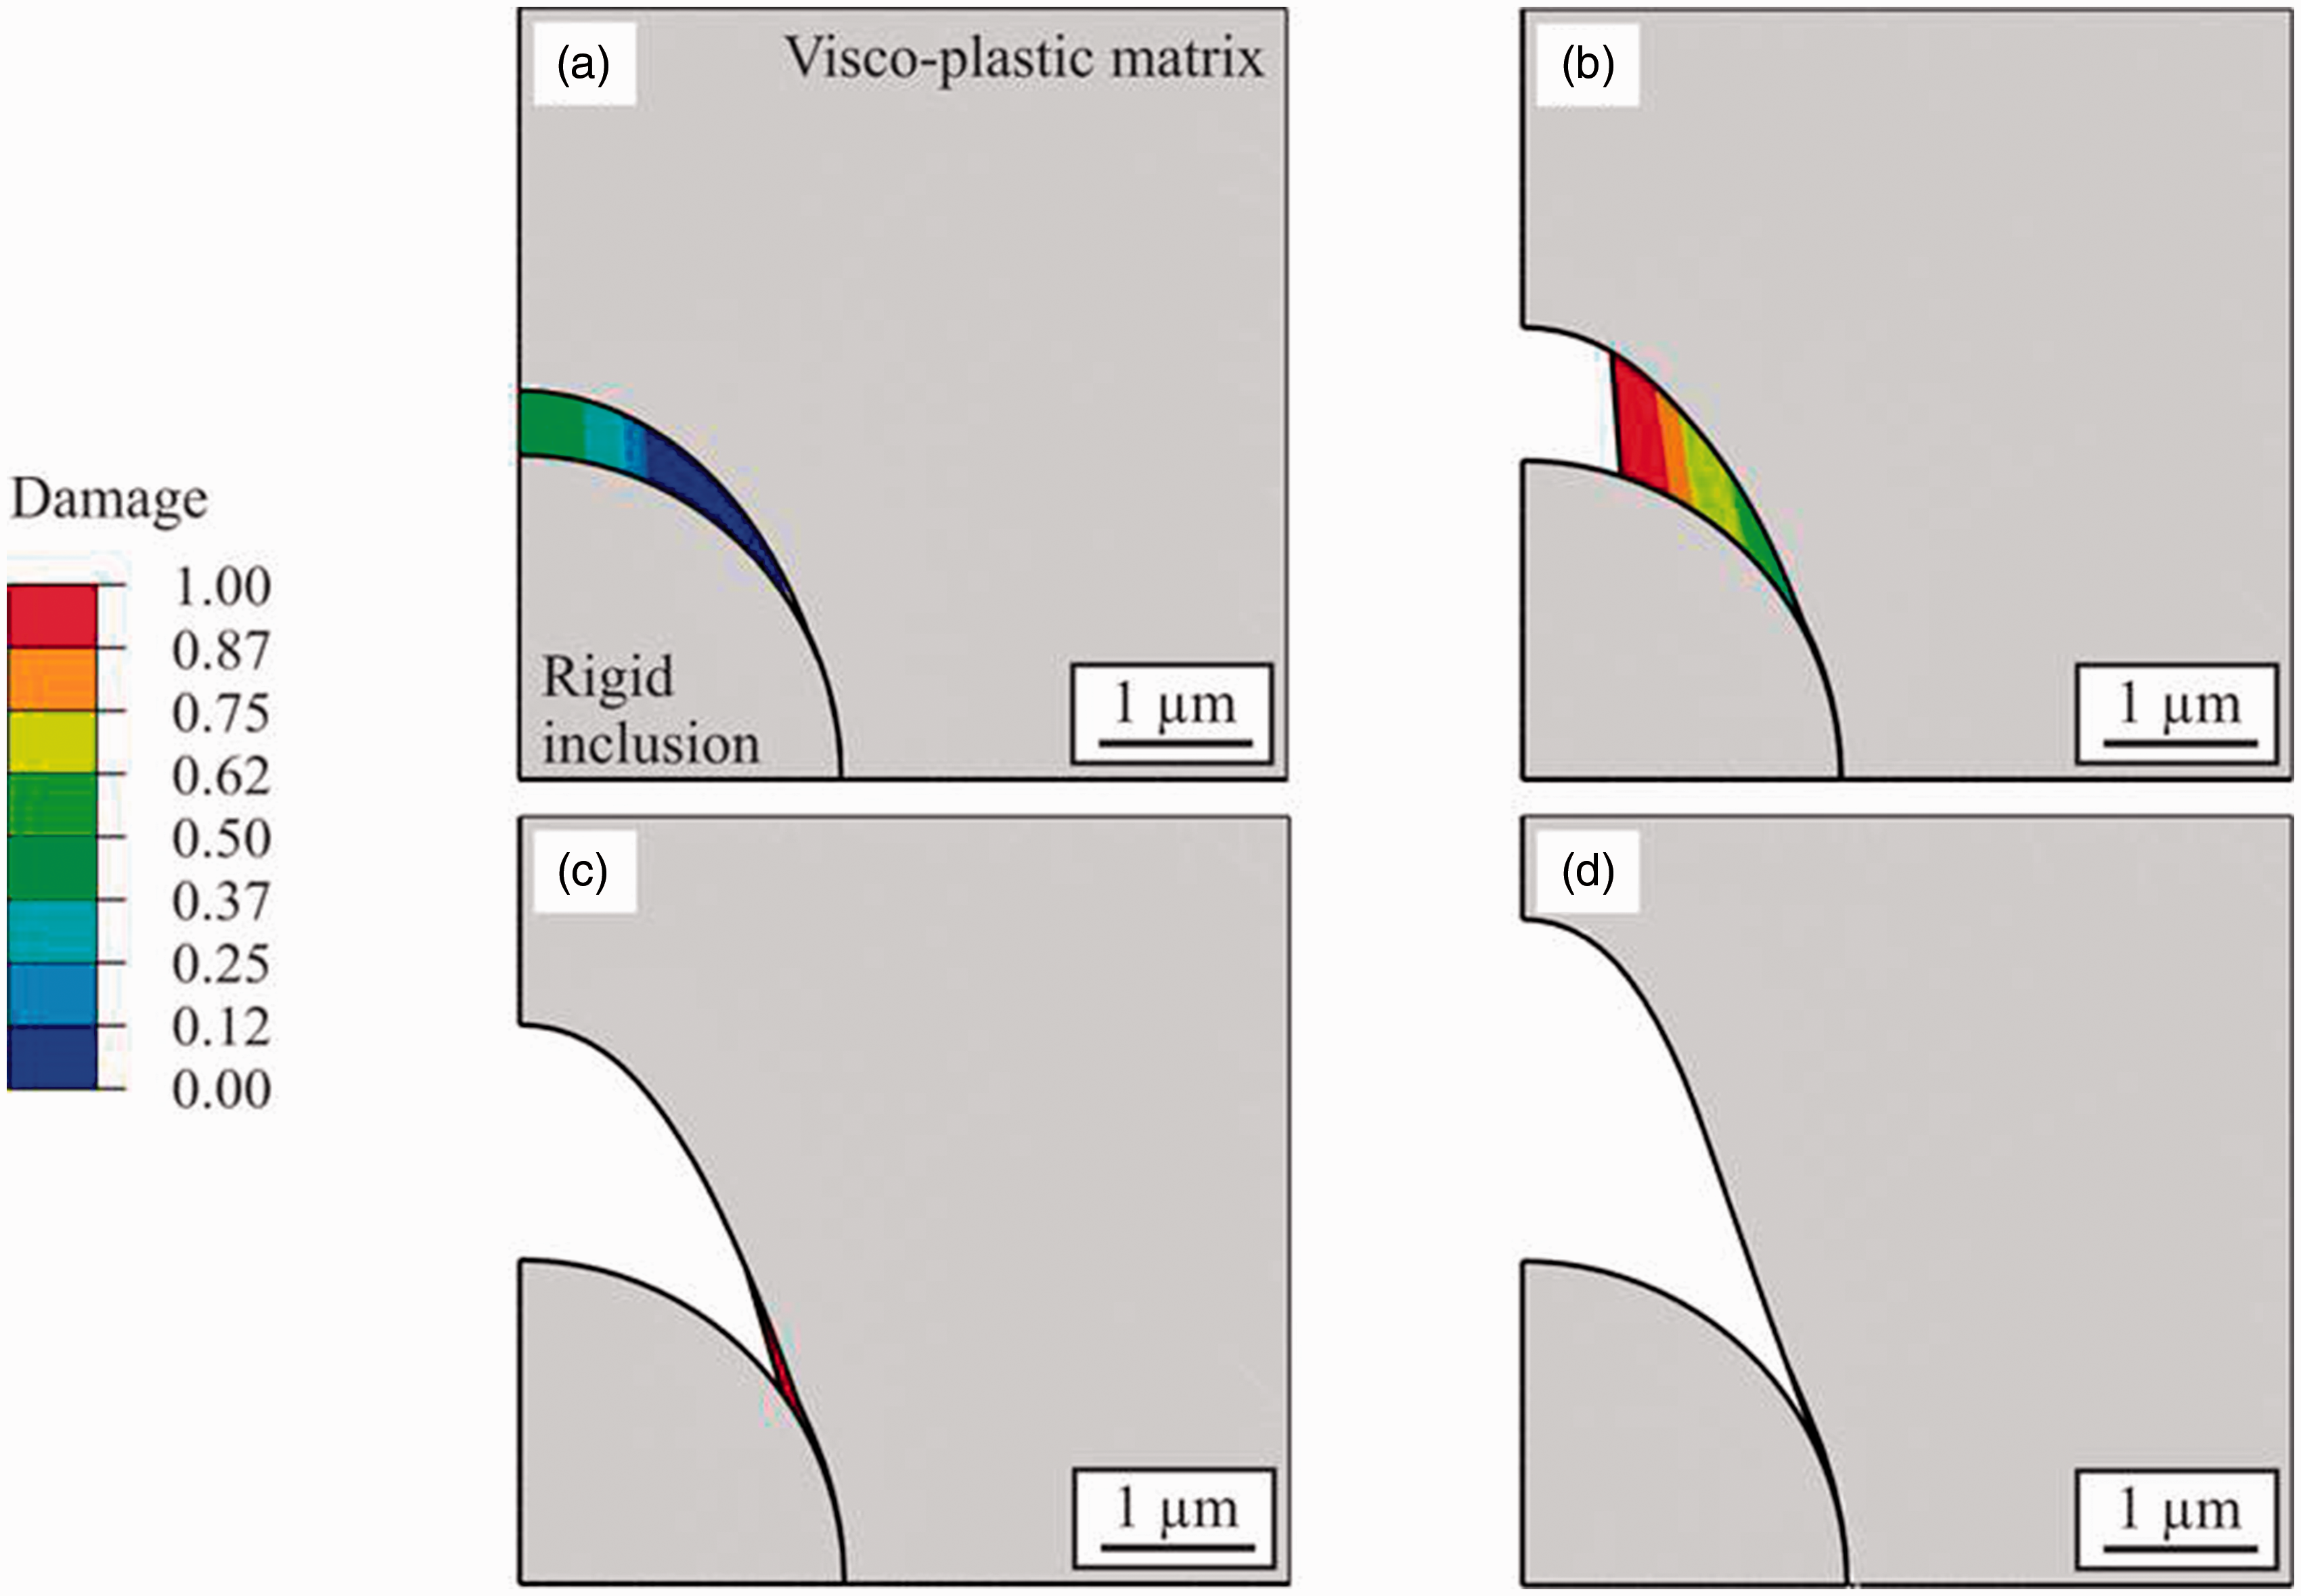
Influence of inclusion size
The presence of non-metallic spherical inclusions of different sizes can lead to different stress magnitudes. For the optimal quality of the final product, it is important to know the influence of inclusion size on the damage evolution. The effect of inclusion size on the damage development is quantified using different sizes of inclusions in the RVE for different temperatures and strain rates. In the investigated material 16MnCrS5, different sizes of inclusions exist. Figure 25 shows the size distribution and the corresponding numbers of inclusions in the investigated material. The distribution shows that the inclusion sizes smaller than 2 µm have more concentration in the material. The RVE-FE simulations were performed for four different inclusion sizes, 0.5, 2, 3, and 4.25 µm.
Distribution of different sizes of inclusion in 16MnCrS5 steel.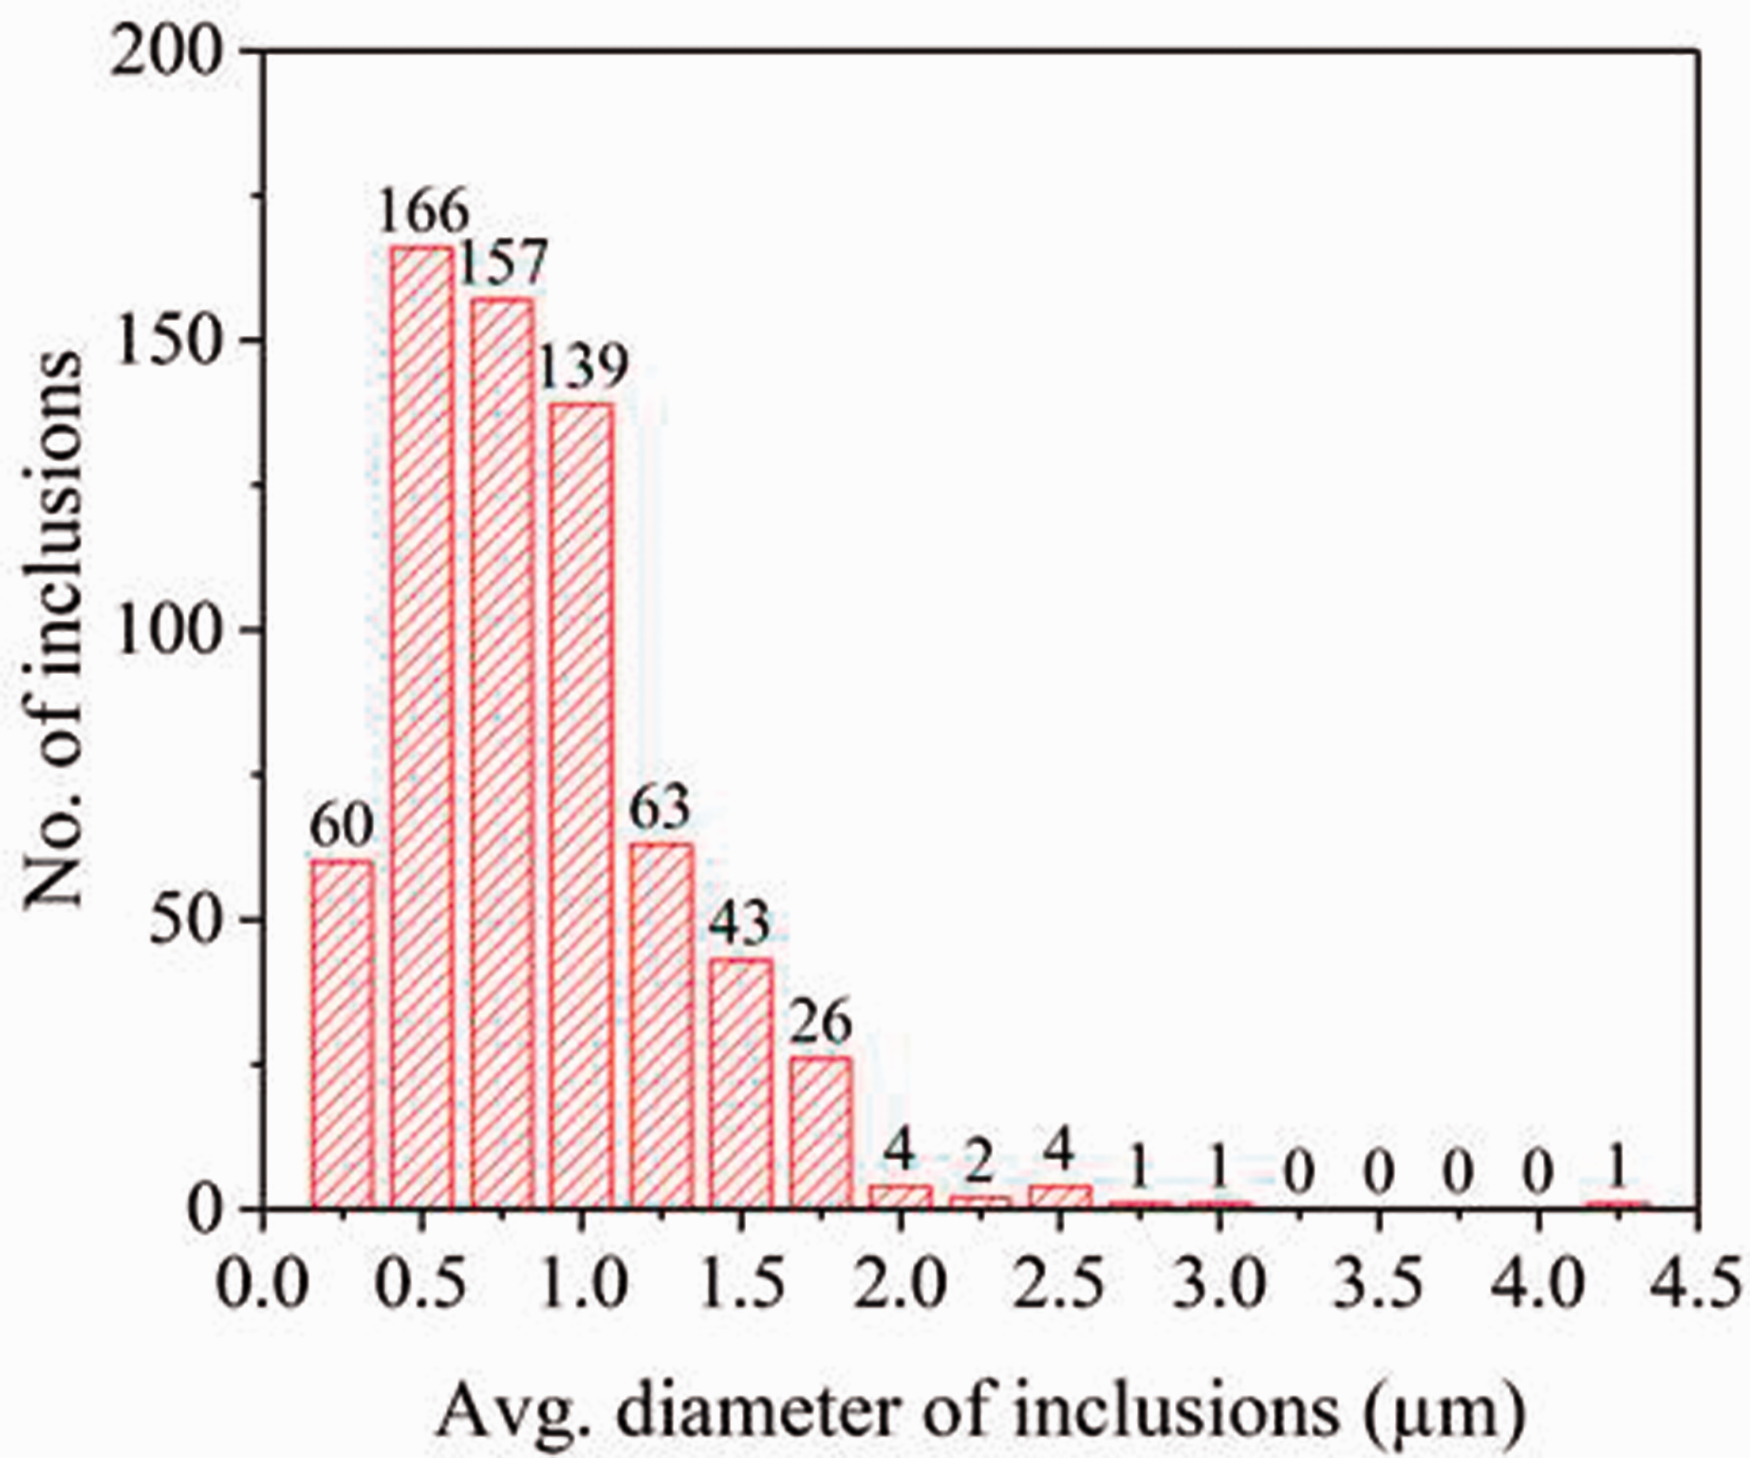
Figure 26 shows the damage plots for the influence of inclusion sizes. The results show two key outcomes: (i) the increasing inclusion size in a fixed size RVE induces higher total damage in the material, i.e. the notch effect scales with inclusion size, and (ii) the influence of DRX in comparison with no DRX decreases for small inclusions. The higher damage in the case of larger inclusion is caused by the notch effect. Figure 27 presents the recrystallized volume fraction (X
DRX
) and the stresses due to DRX in the matrix for different sizes of inclusions. X
DRX
increases with decreasing inclusion size that causes the reduction of stresses in the matrix and the corresponding damage.
Comparison of the damage initiation and growth with and without DRX under a uniaxial stress state up to 30% deformation at same deformation conditions. Recrystallized volume fraction in the matrix of the RVE under a uniaxial stress state up to 30% deformation at 1000℃ and strain rate of 1 s−1 with different sizes of inclusions: (a) 2, (b) 3, and (c) 4.25 μm; together with corresponding stresses in the matrix for inclusion size: (d) 2, (e) 3, and (f) 4.25 μm.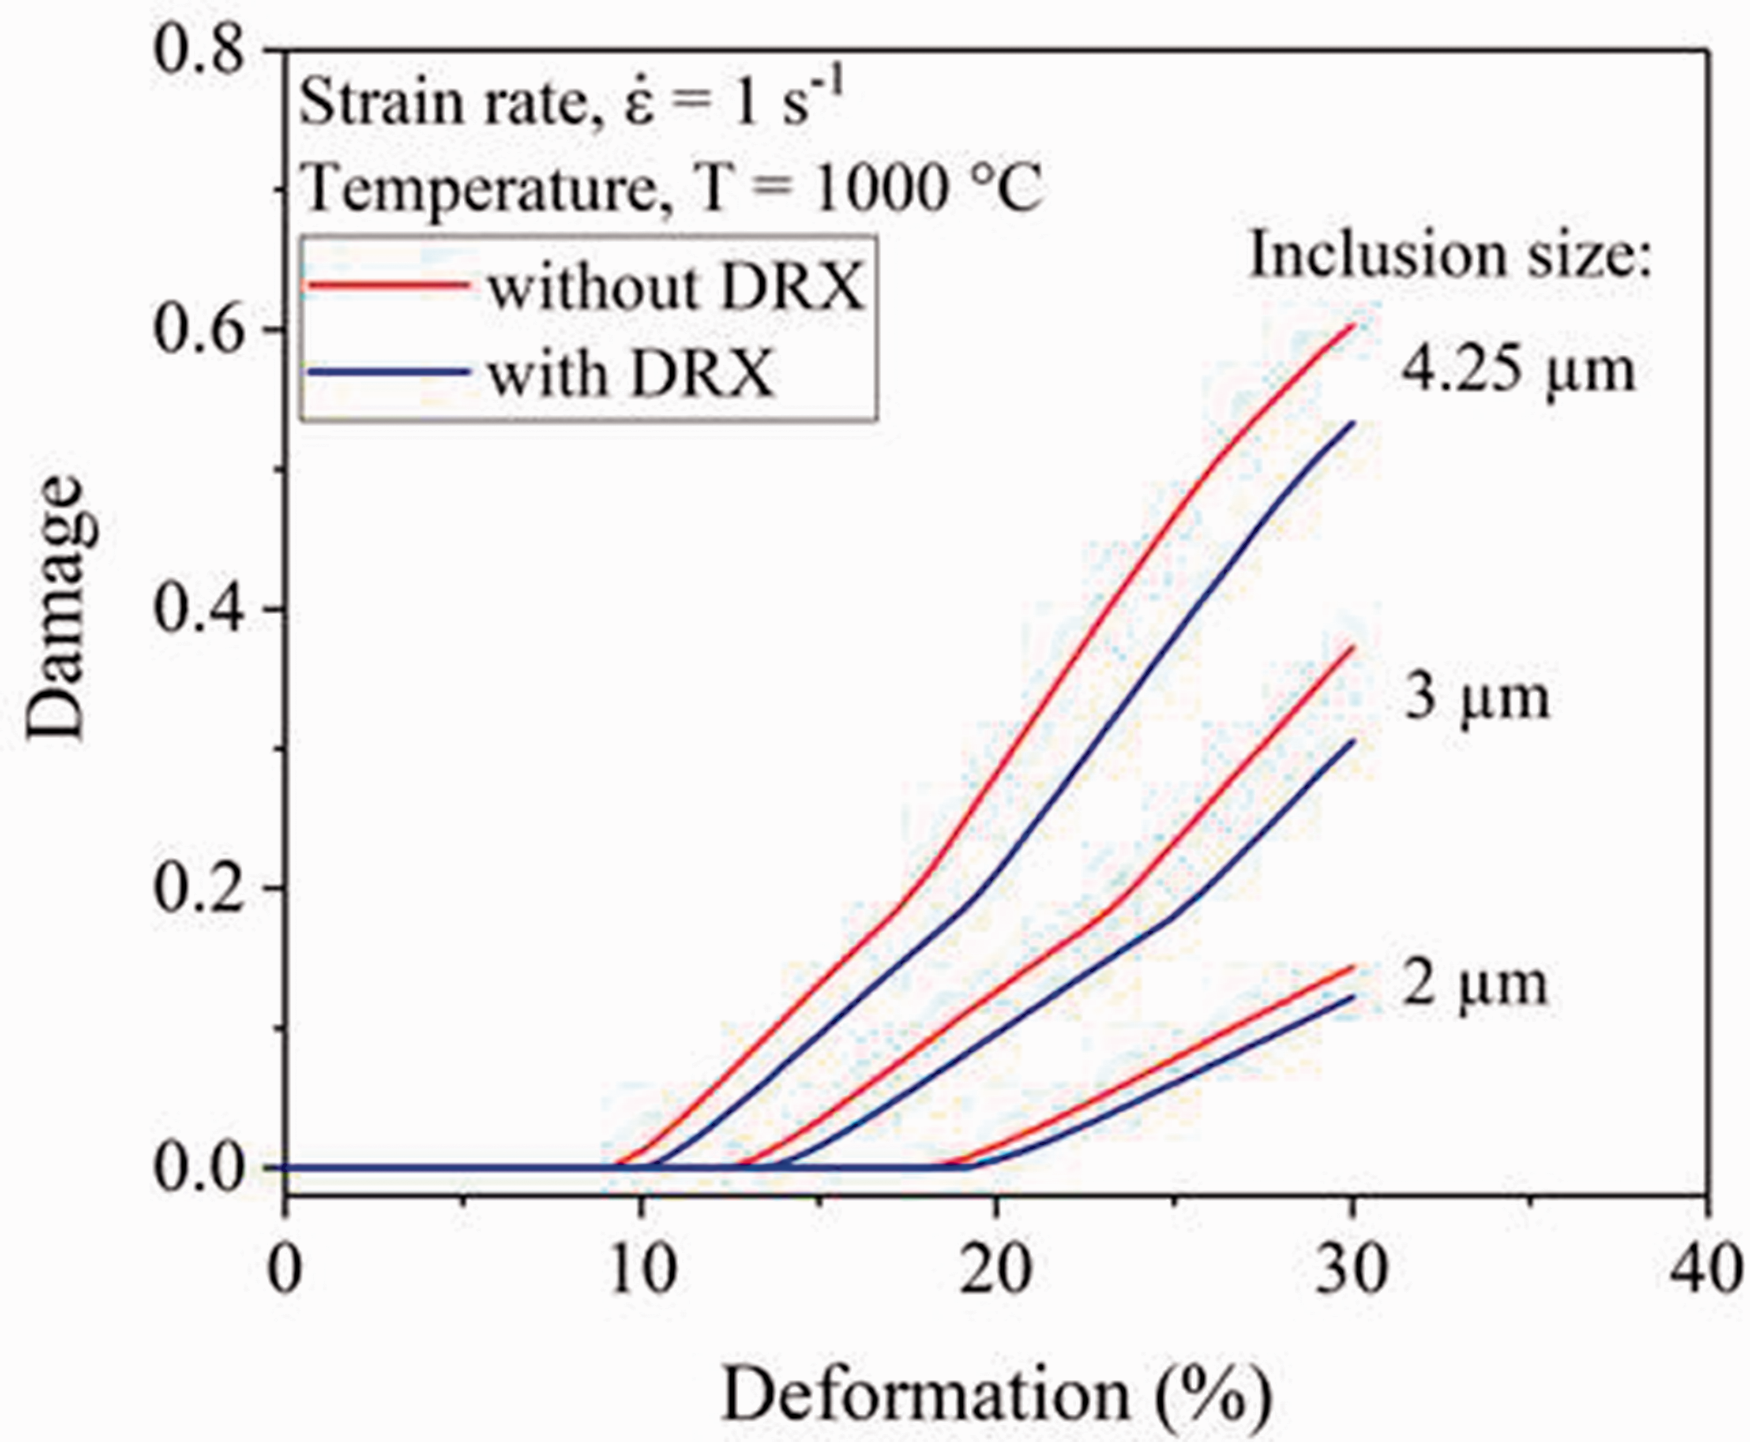
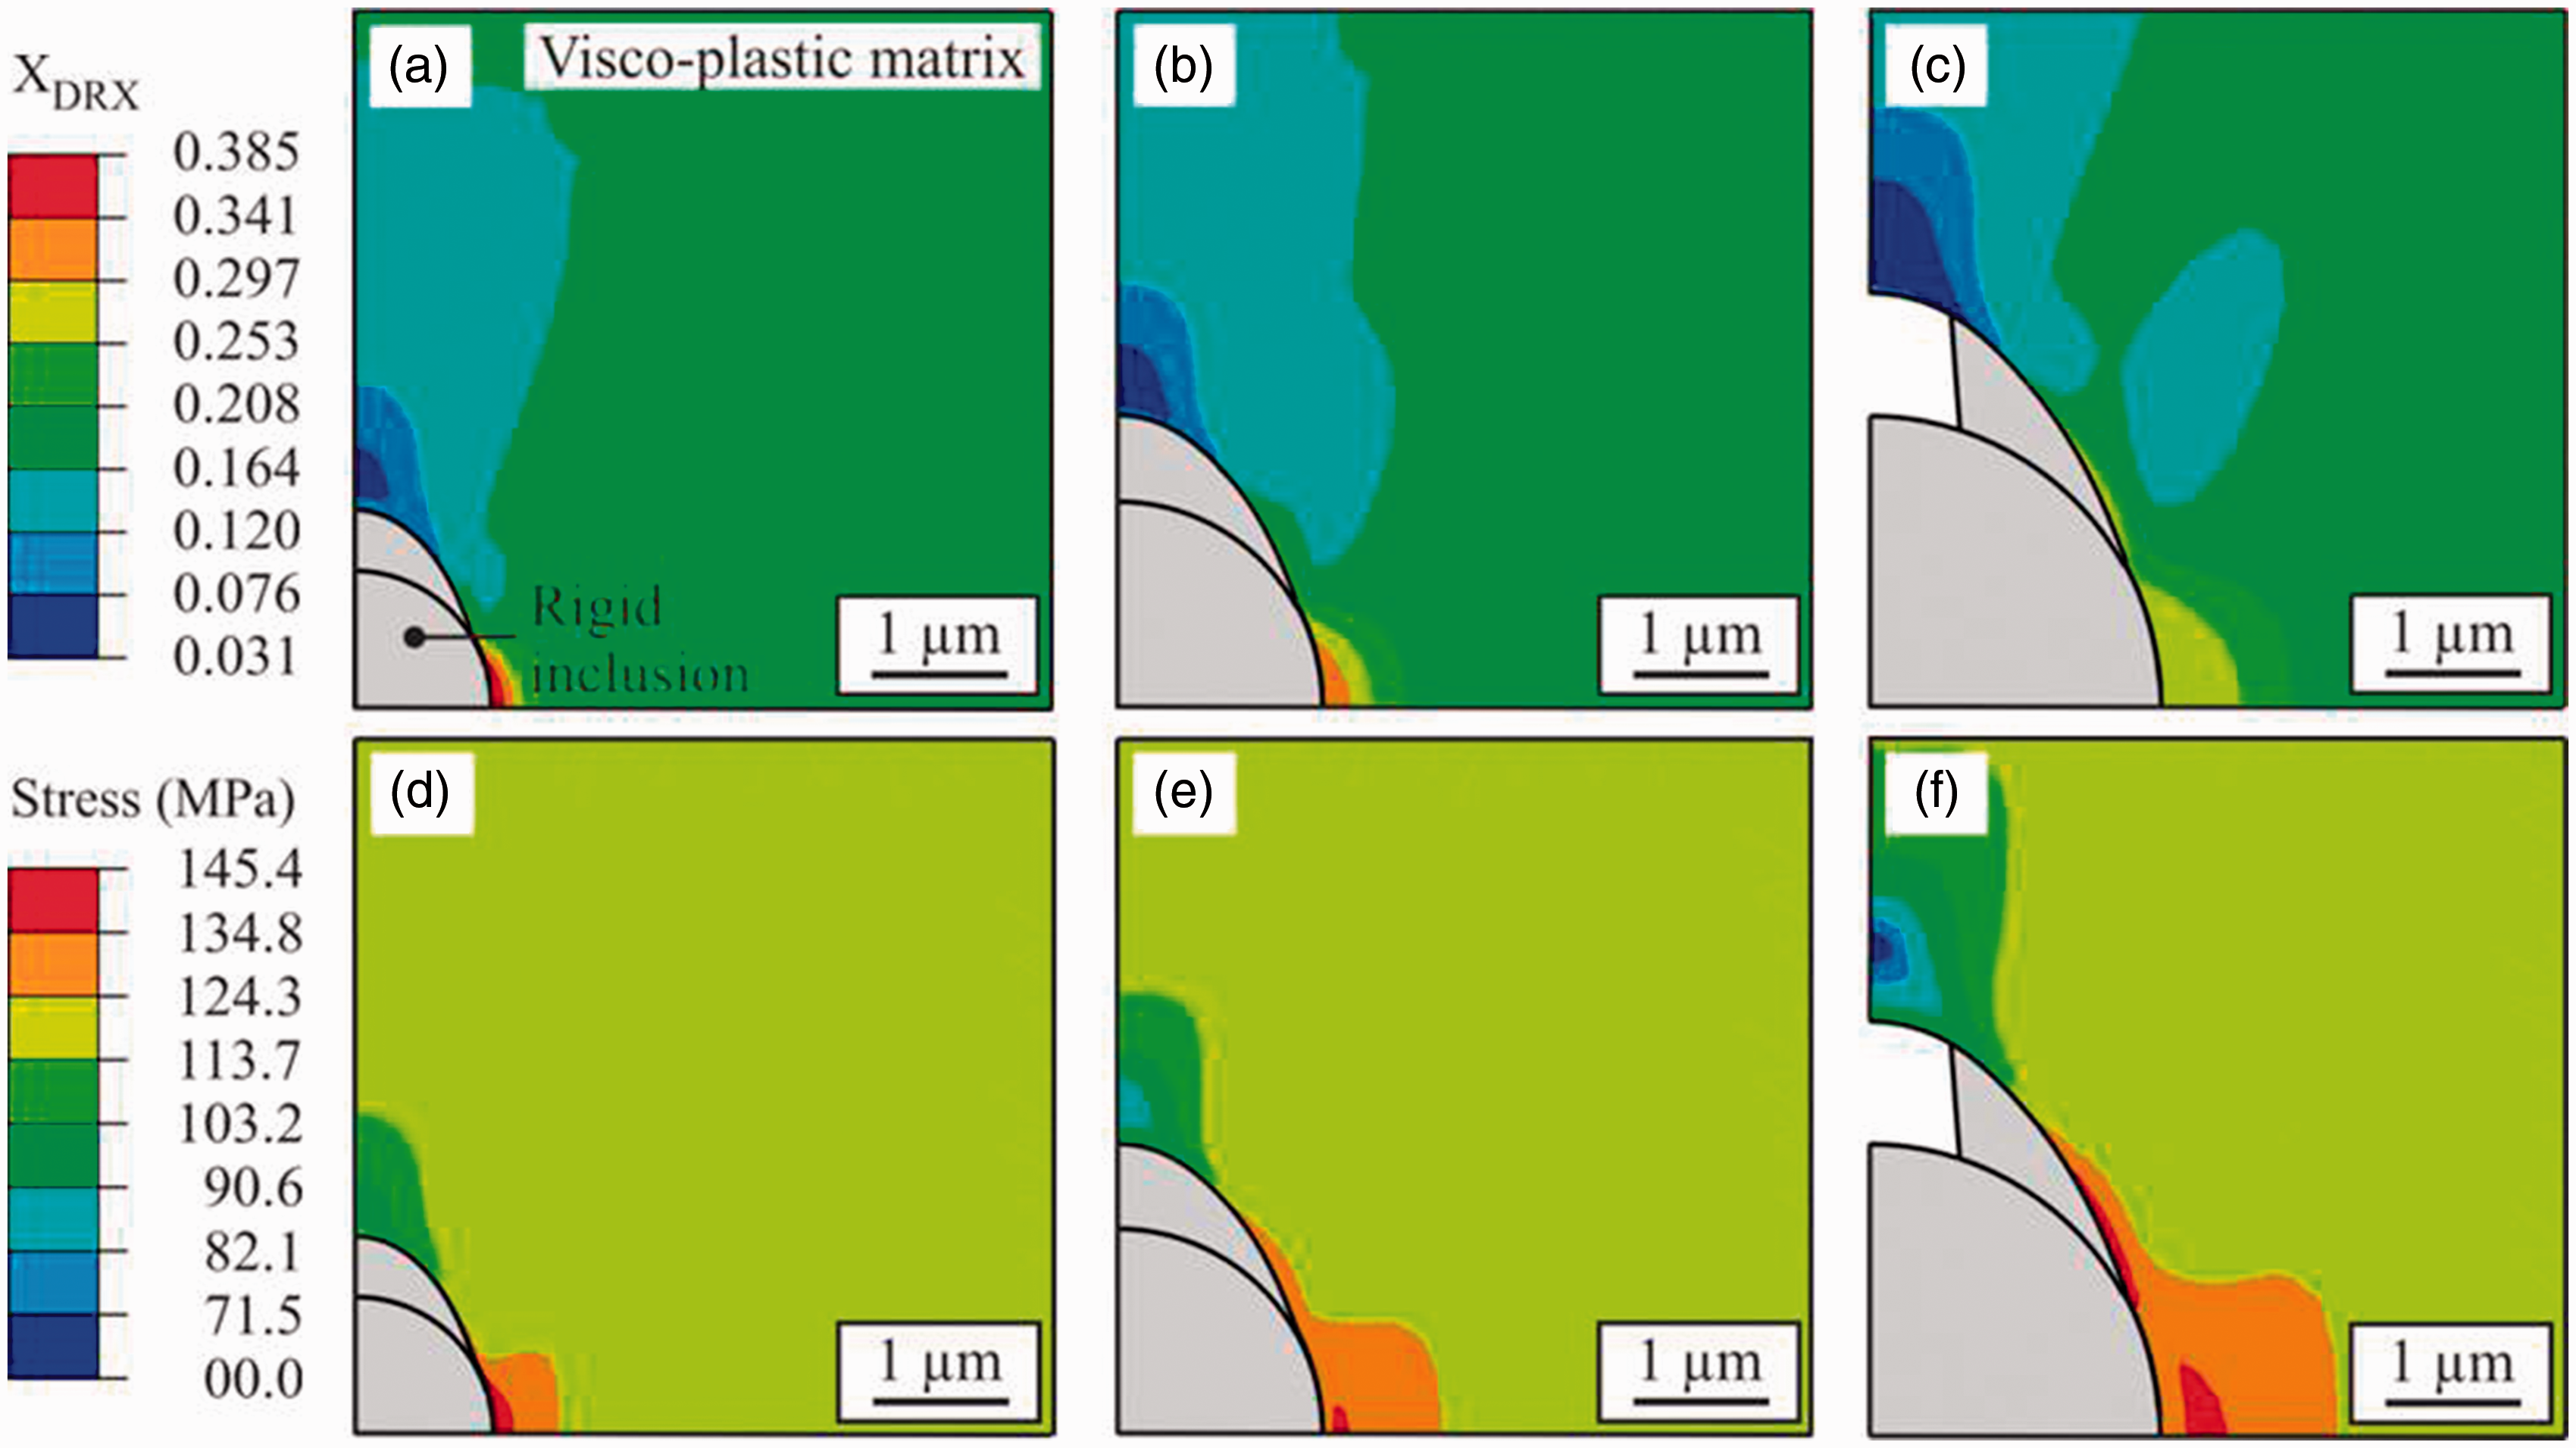
Figure 28(a) shows the combined influence of deformation temperatures and inclusion sizes. The amount of total damage increases with increasing inclusion size and decreasing temperature. Figure 28(b) shows the influence of inclusion size on damage at different strain rates. The influence of strain rates is more severe for large inclusions. In the case of the smallest inclusion size of 0.5 µm, no influence of strain rate is observed.
Comparison of the total damage under a uniaxial stress state up to 30% deformation for different inclusion sizes under different temperatures (a) and strain rates (b).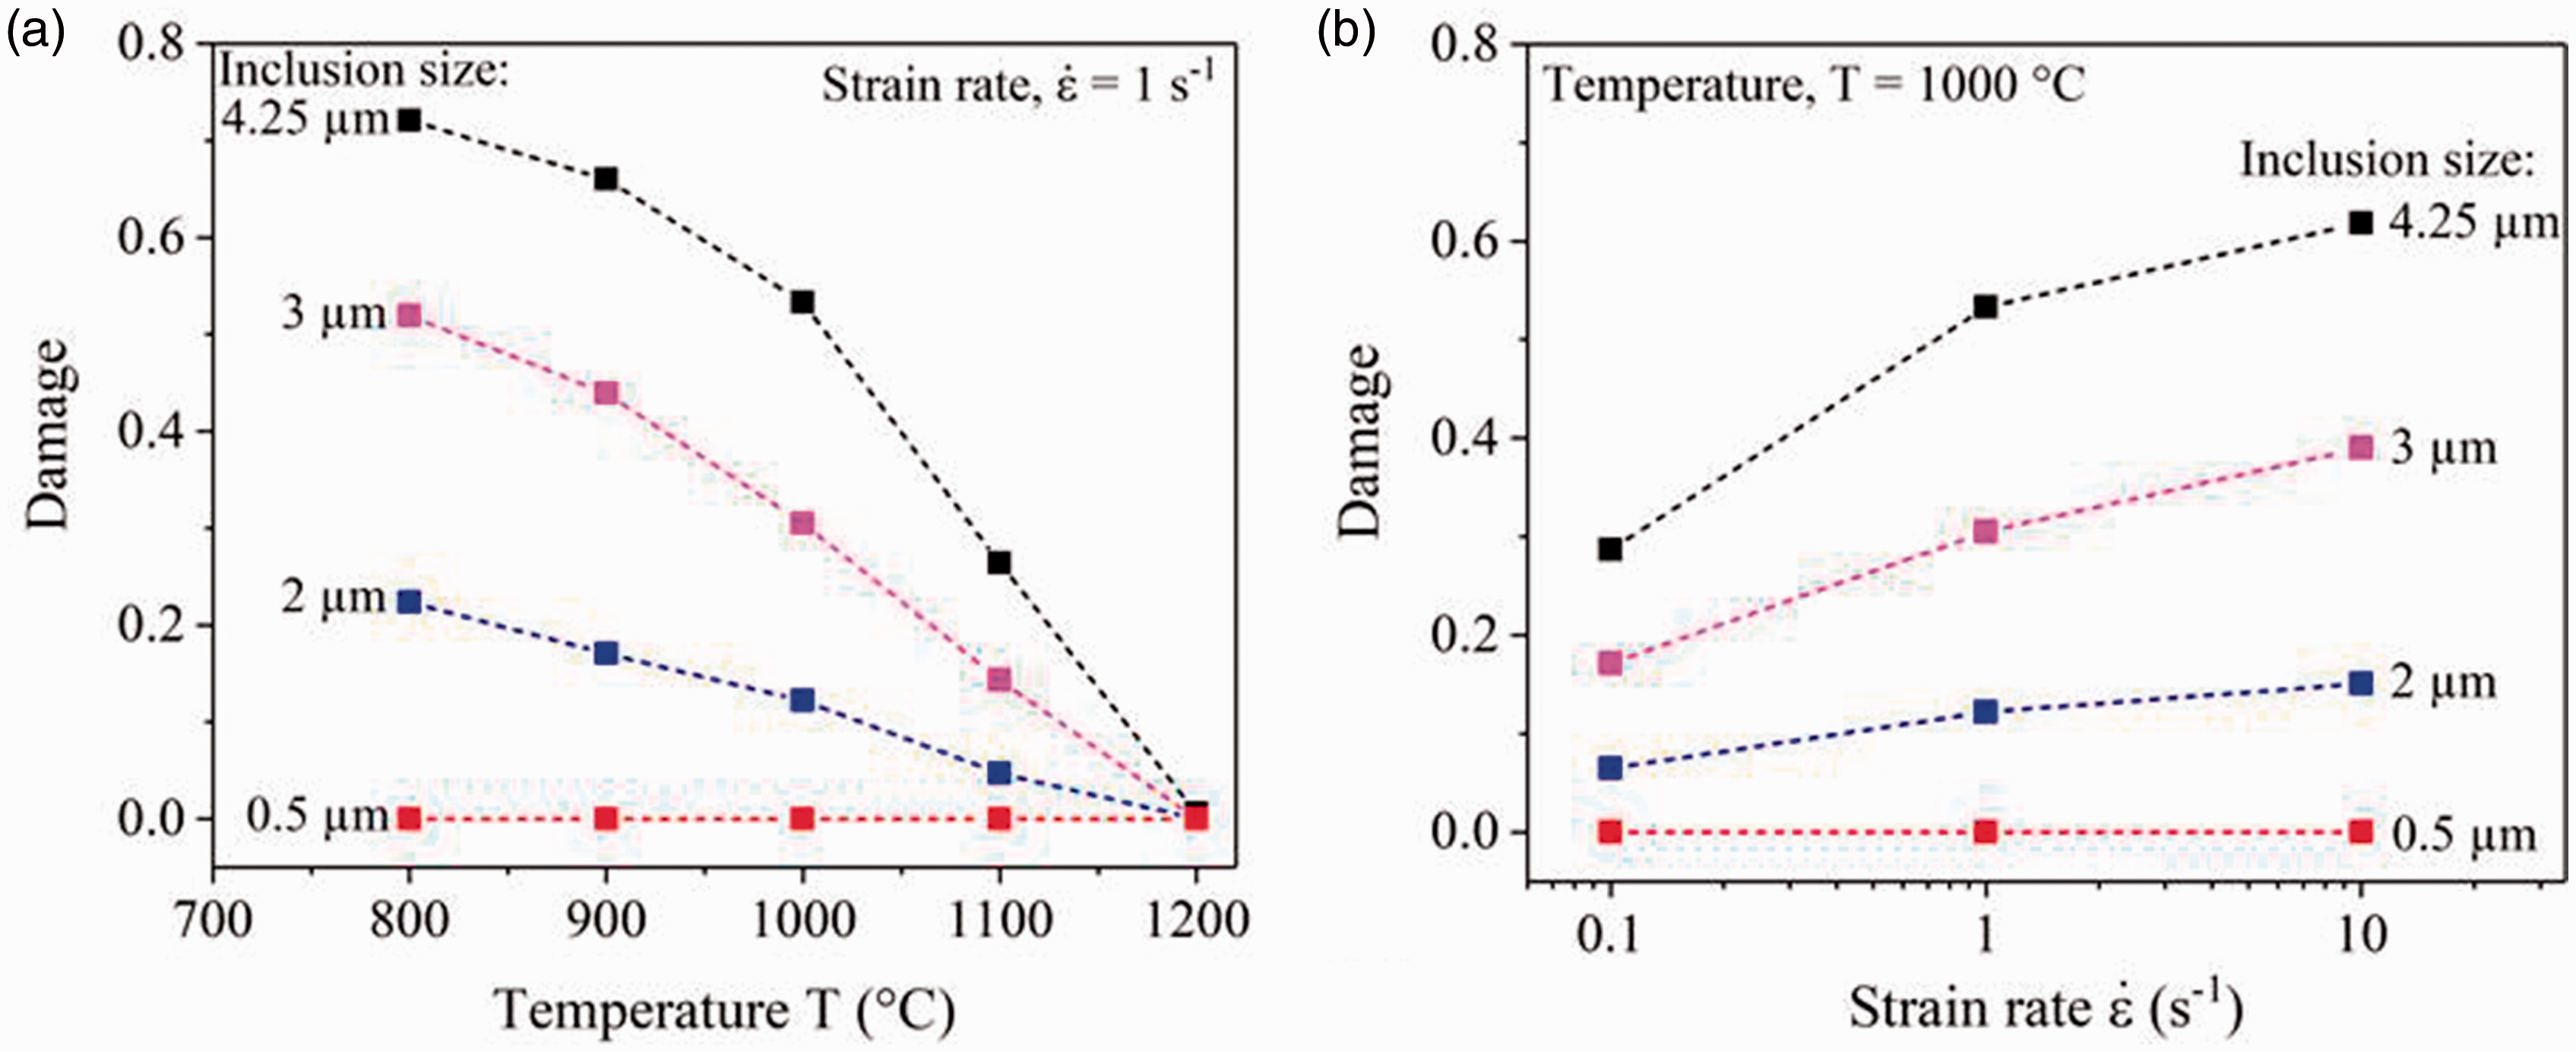
A macroscopic damage model
In the preceding section, a detailed analysis of different factors (dynamic recrystallization, loading direction, temperature, strain rate, total strain and inclusion size) influencing the damage mechanisms in the hot forming is presented. The investigations were performed using the CZM at microscopic level. However, a coupled DRX damage nucleation model for hot forming simulation is required that can be integrated into macroscopic model.
In the current section, a model that can be adapted to predict the void nucleation and damage growth at the macroscopic level is analyzed. A thermodynamically consistent damage model by Horstemeyer and Gokhale (1999) is modified for hot forming. The modified model presents a more comprehensive formulation for the damage initiation that considers DRX, the fracture toughness of the aggregate material, inclusion size, strain rate, initial volume fraction of the inclusions, and the stress states for damage. The initial model formulation is given as follows (1999)

One deficiency of the Horstemeyer damage model is that it does not consider the dependence of damage on the flow stress of the matrix. Thus, material softening due to DRX cannot be considered in the original version and the model can only be applied to cold forming problems. The material constants (a, b and c) have the units of stress and are adopted as fitting parameters in the previous studies by Horstemeyer. In the current study, these material parameters are considered as dimensionless quantities. It is assumed that (a, b, c) = σ
DRX
(a′, b′, c′), so that the void nucleation is modeled as a function of flow stress of the matrix due to DRX (
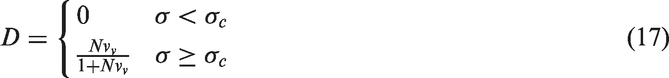
The modified Horstemeyer void nucleation model dependent on DRX is calibrated using the results of the RVE simulations. Using the modified Horstemeyer damage nucleation model, the damage evolution can be calculated from the ratio of the volume of nucleated voids to the total volume of the material in the current state. The damage is only initiated once the volume of the nucleated voids reaches certain critical values corresponding to the critical stress of damage initiation
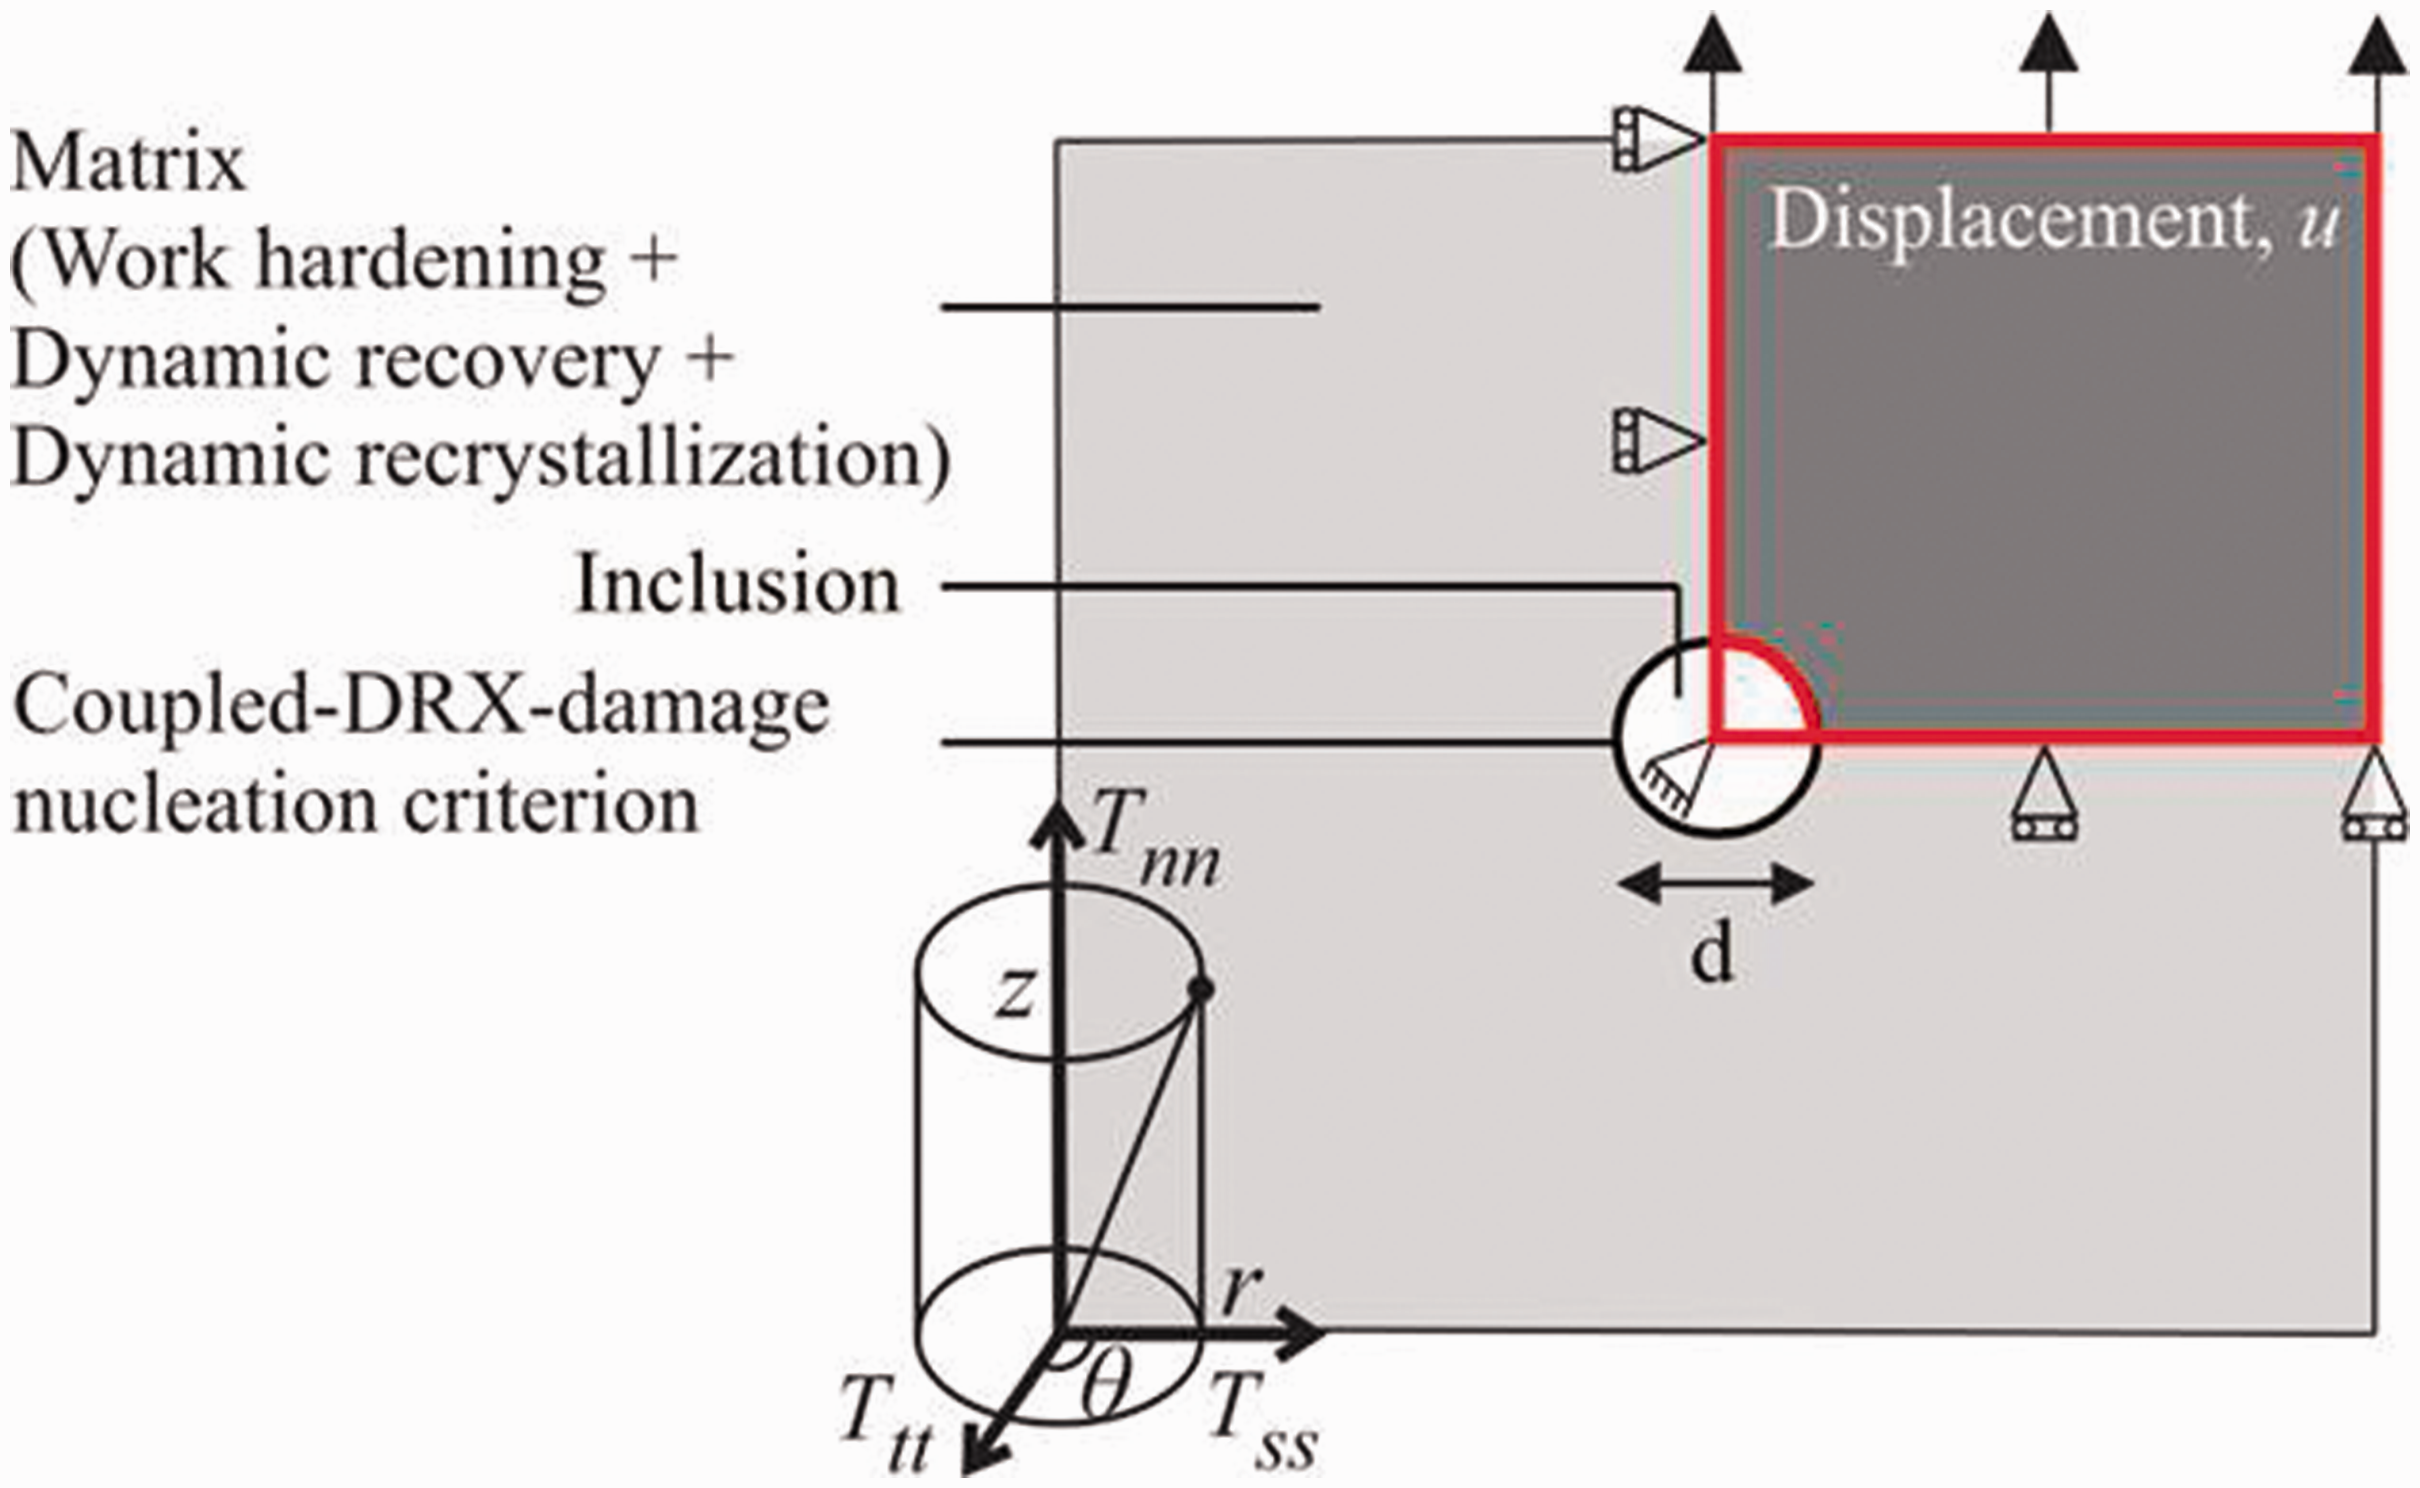
Schematic representation of the RVE for damage nucleation and growth calculation using modified Horstemeyer model.
The model parameters d, f, and K
IC
are selected according to the largest diameter of the inclusion, the volume fraction of inclusions present in the material and fracture toughness of the material, respectively. Parameters a′, b′, and c′ are determined by fitting the model output to the RVE computations. Table 3 lists the values of parameters used in this study and the parameter c′ is plotted in Figure 30 for different deformation conditions—it is not constant but a function of temperature.
Variation of the parameter c′ for different deformation conditions. Nucleation model parameter used for different deformation conditions.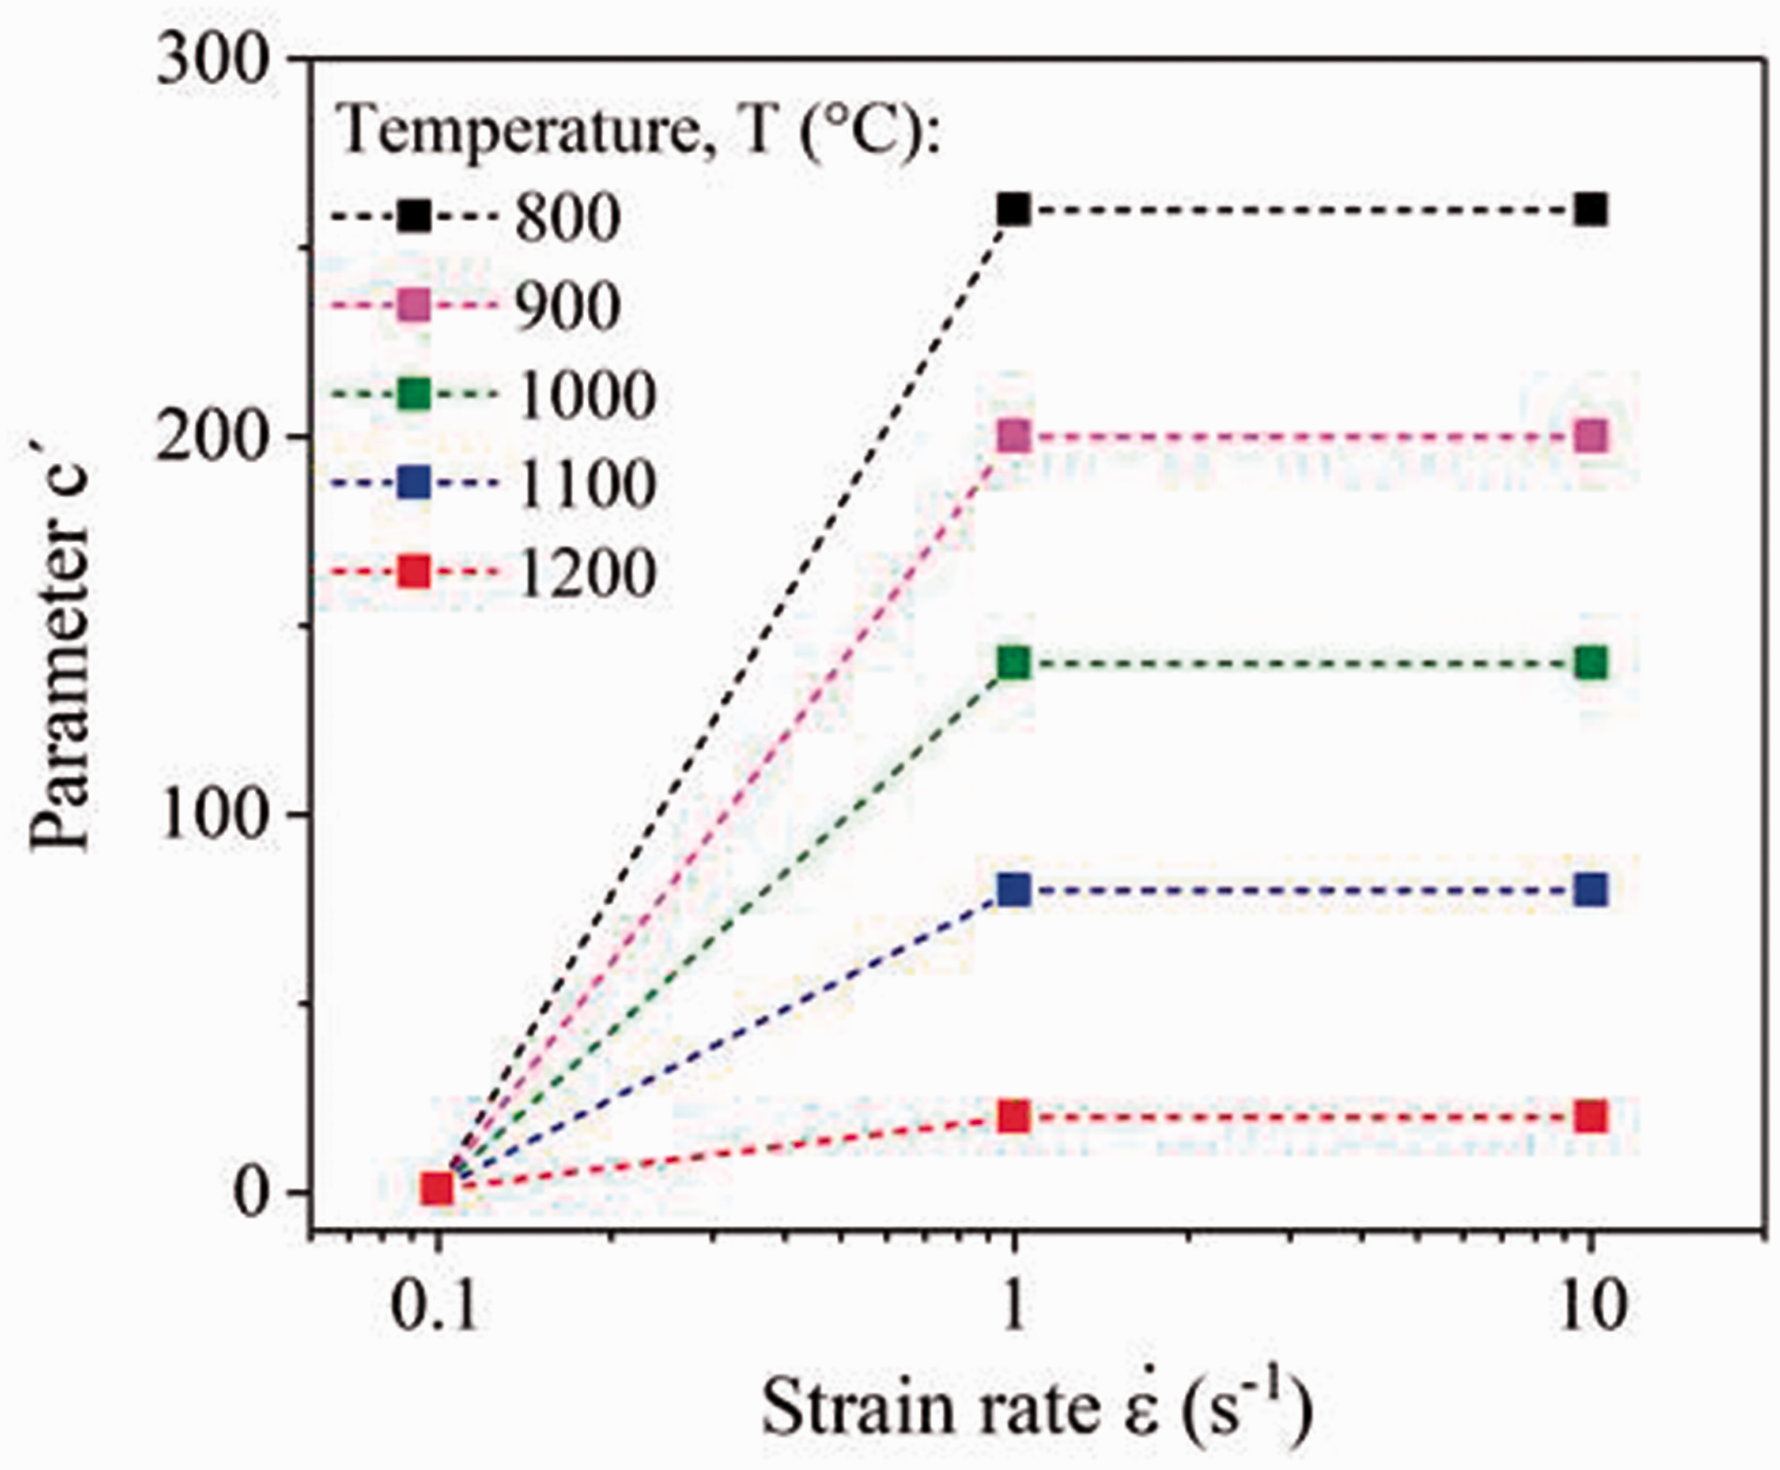
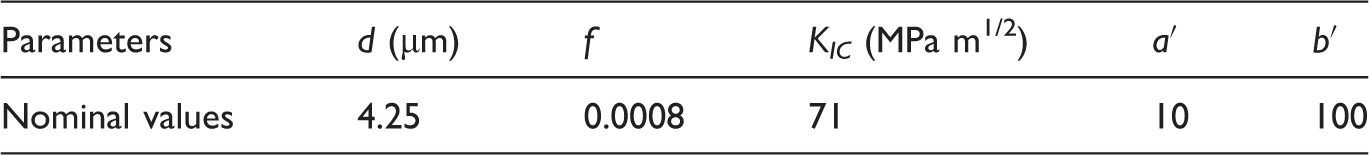
Figure 31 shows the damage evolution curves determined from the modified damage model and the RVE simulations. The model results show a reasonable fit to the damage curves from CZM simulations apart from some exception for 1200℃ at strain rate of 1 and 10 s−1.
Comparison of characteristic damage curves calculated from the RVE-FE simulations and modified Horstemeyer damage model for different temperatures at strain rates of: (a) 0.1, (b) 1, and (c) 10 s−1.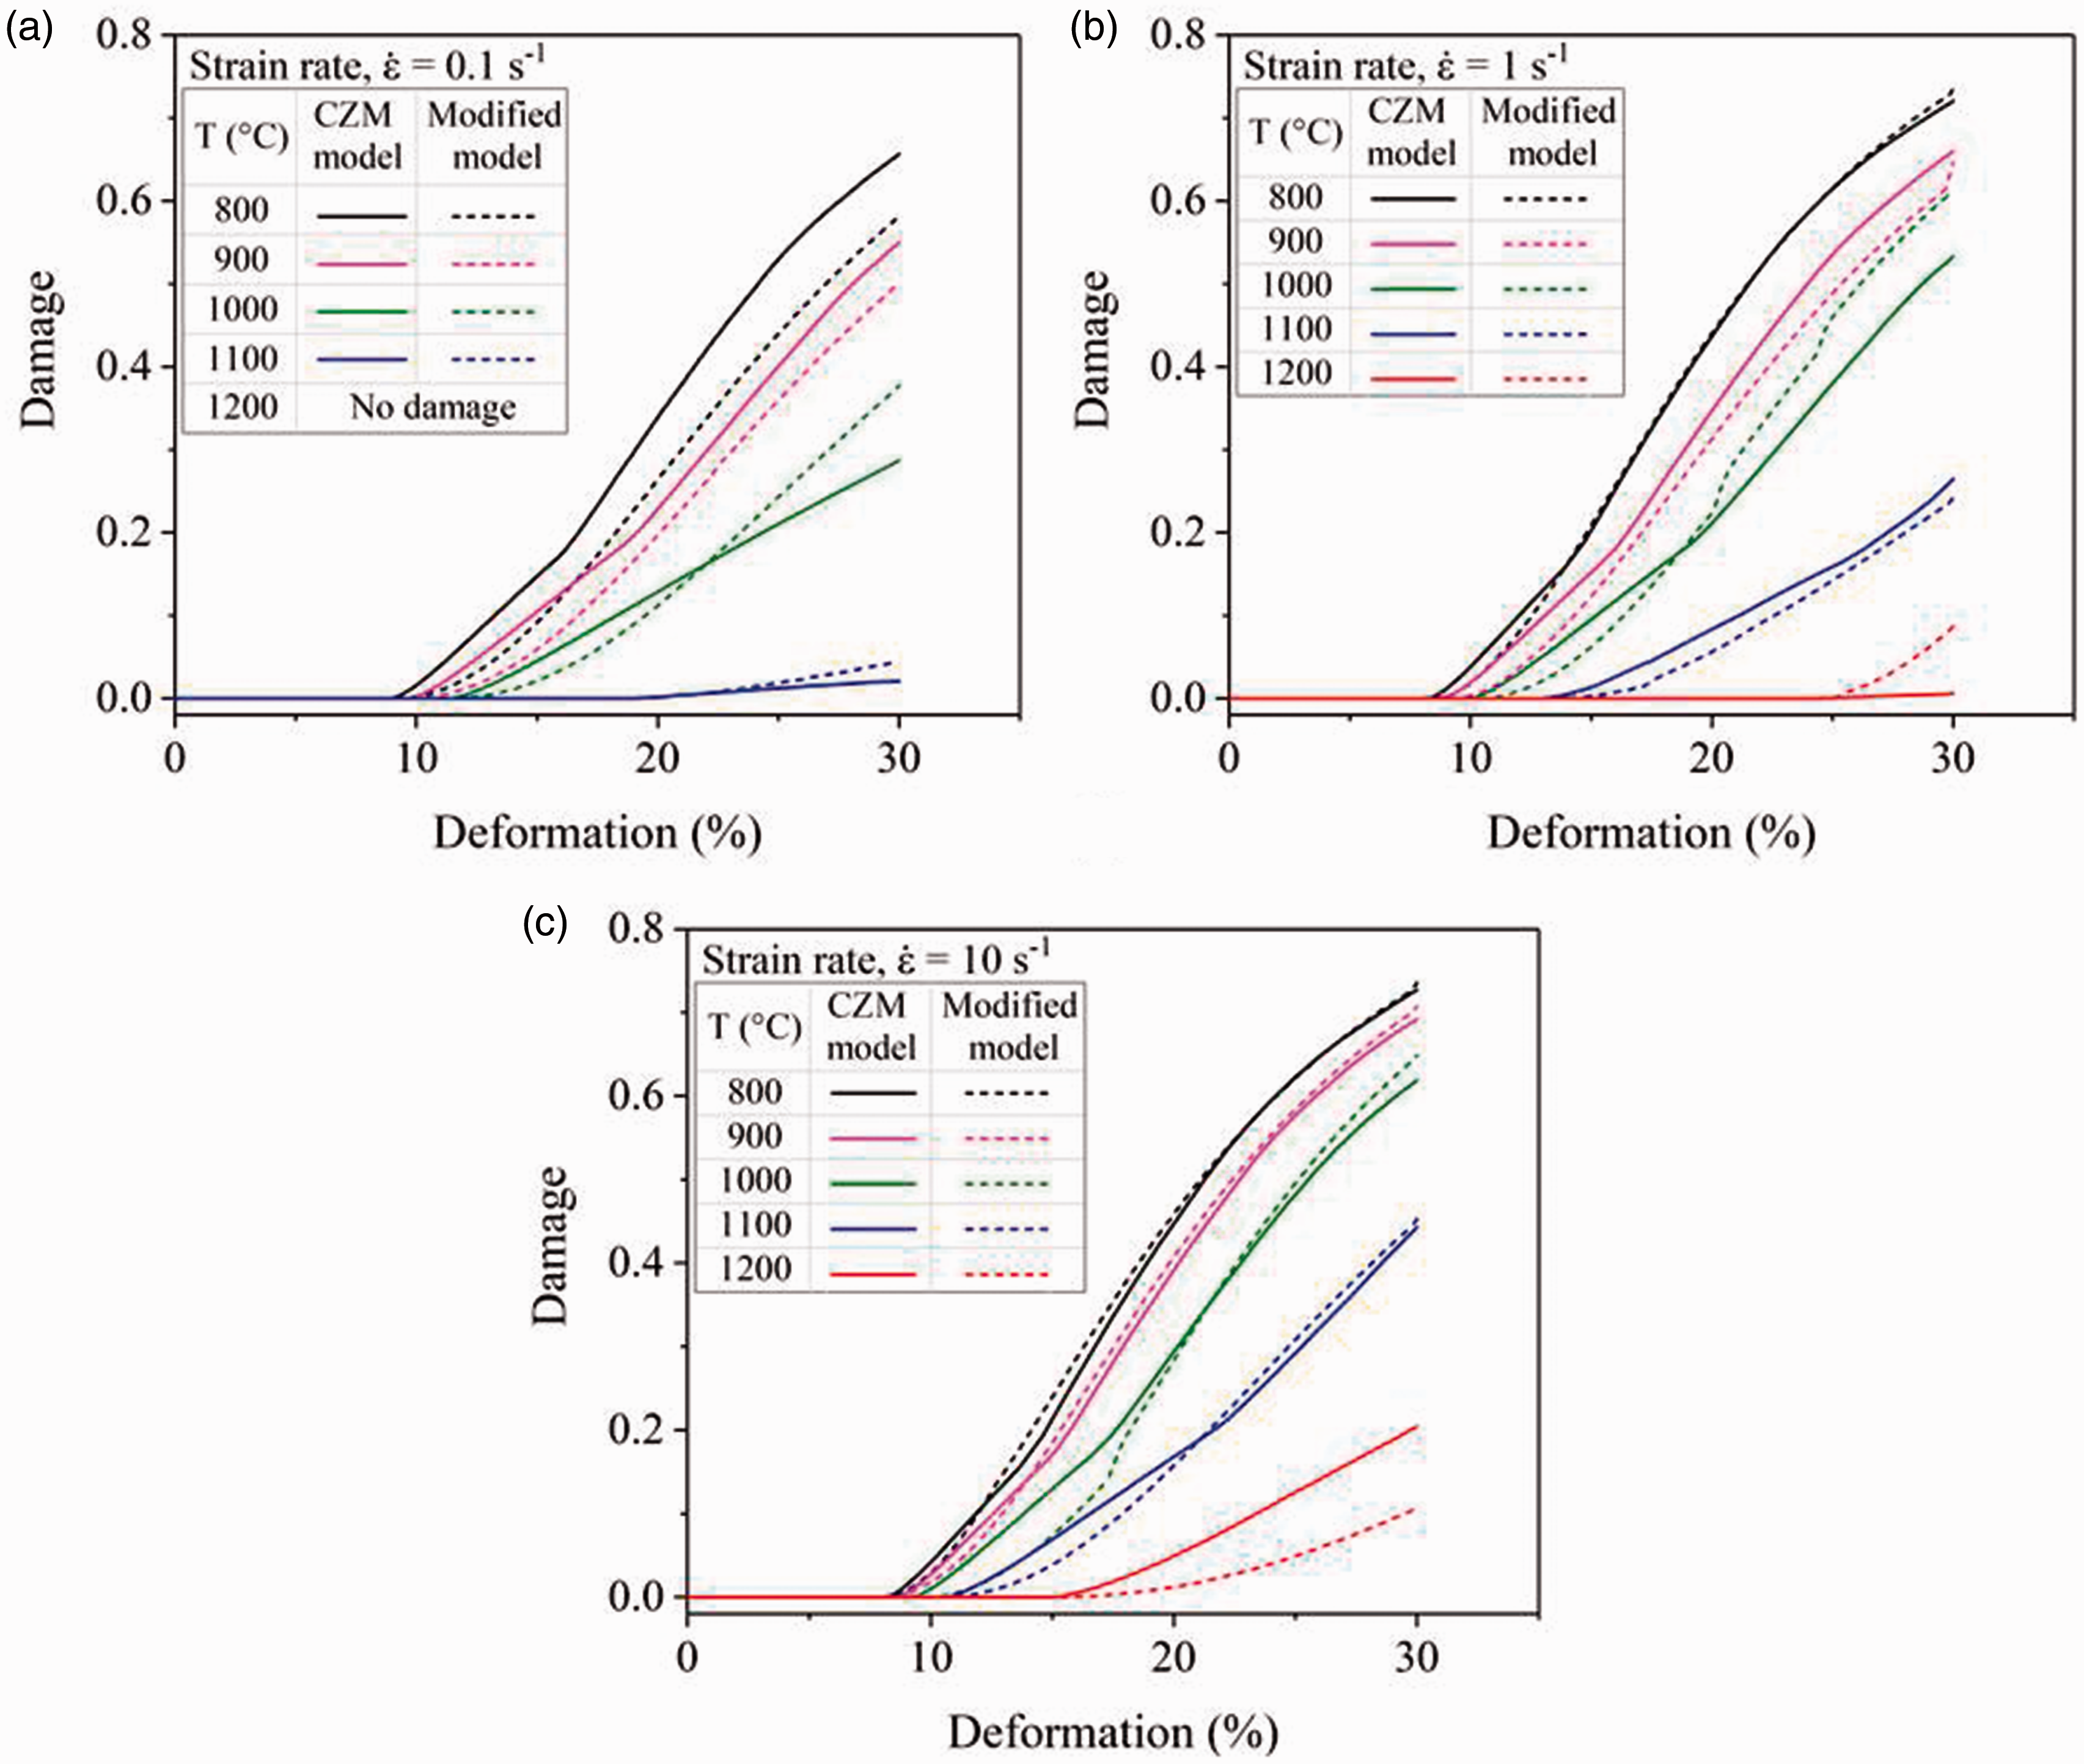
Equation (16) is analytically solved for different deformation conditions. Figure 32 shows the number of voids per unit volume for different temperatures and strain rates. No result is presented for the strain rate of 0.1 s−1 and the temperature of 1200℃ as no damage is initiated under these deformation conditions.
Evolution of the void volume nucleated at the interface of the matrix and inclusions at different temperatures at the strain rate of: (a) 0.1, (b) 1, and (c) 10 s−1.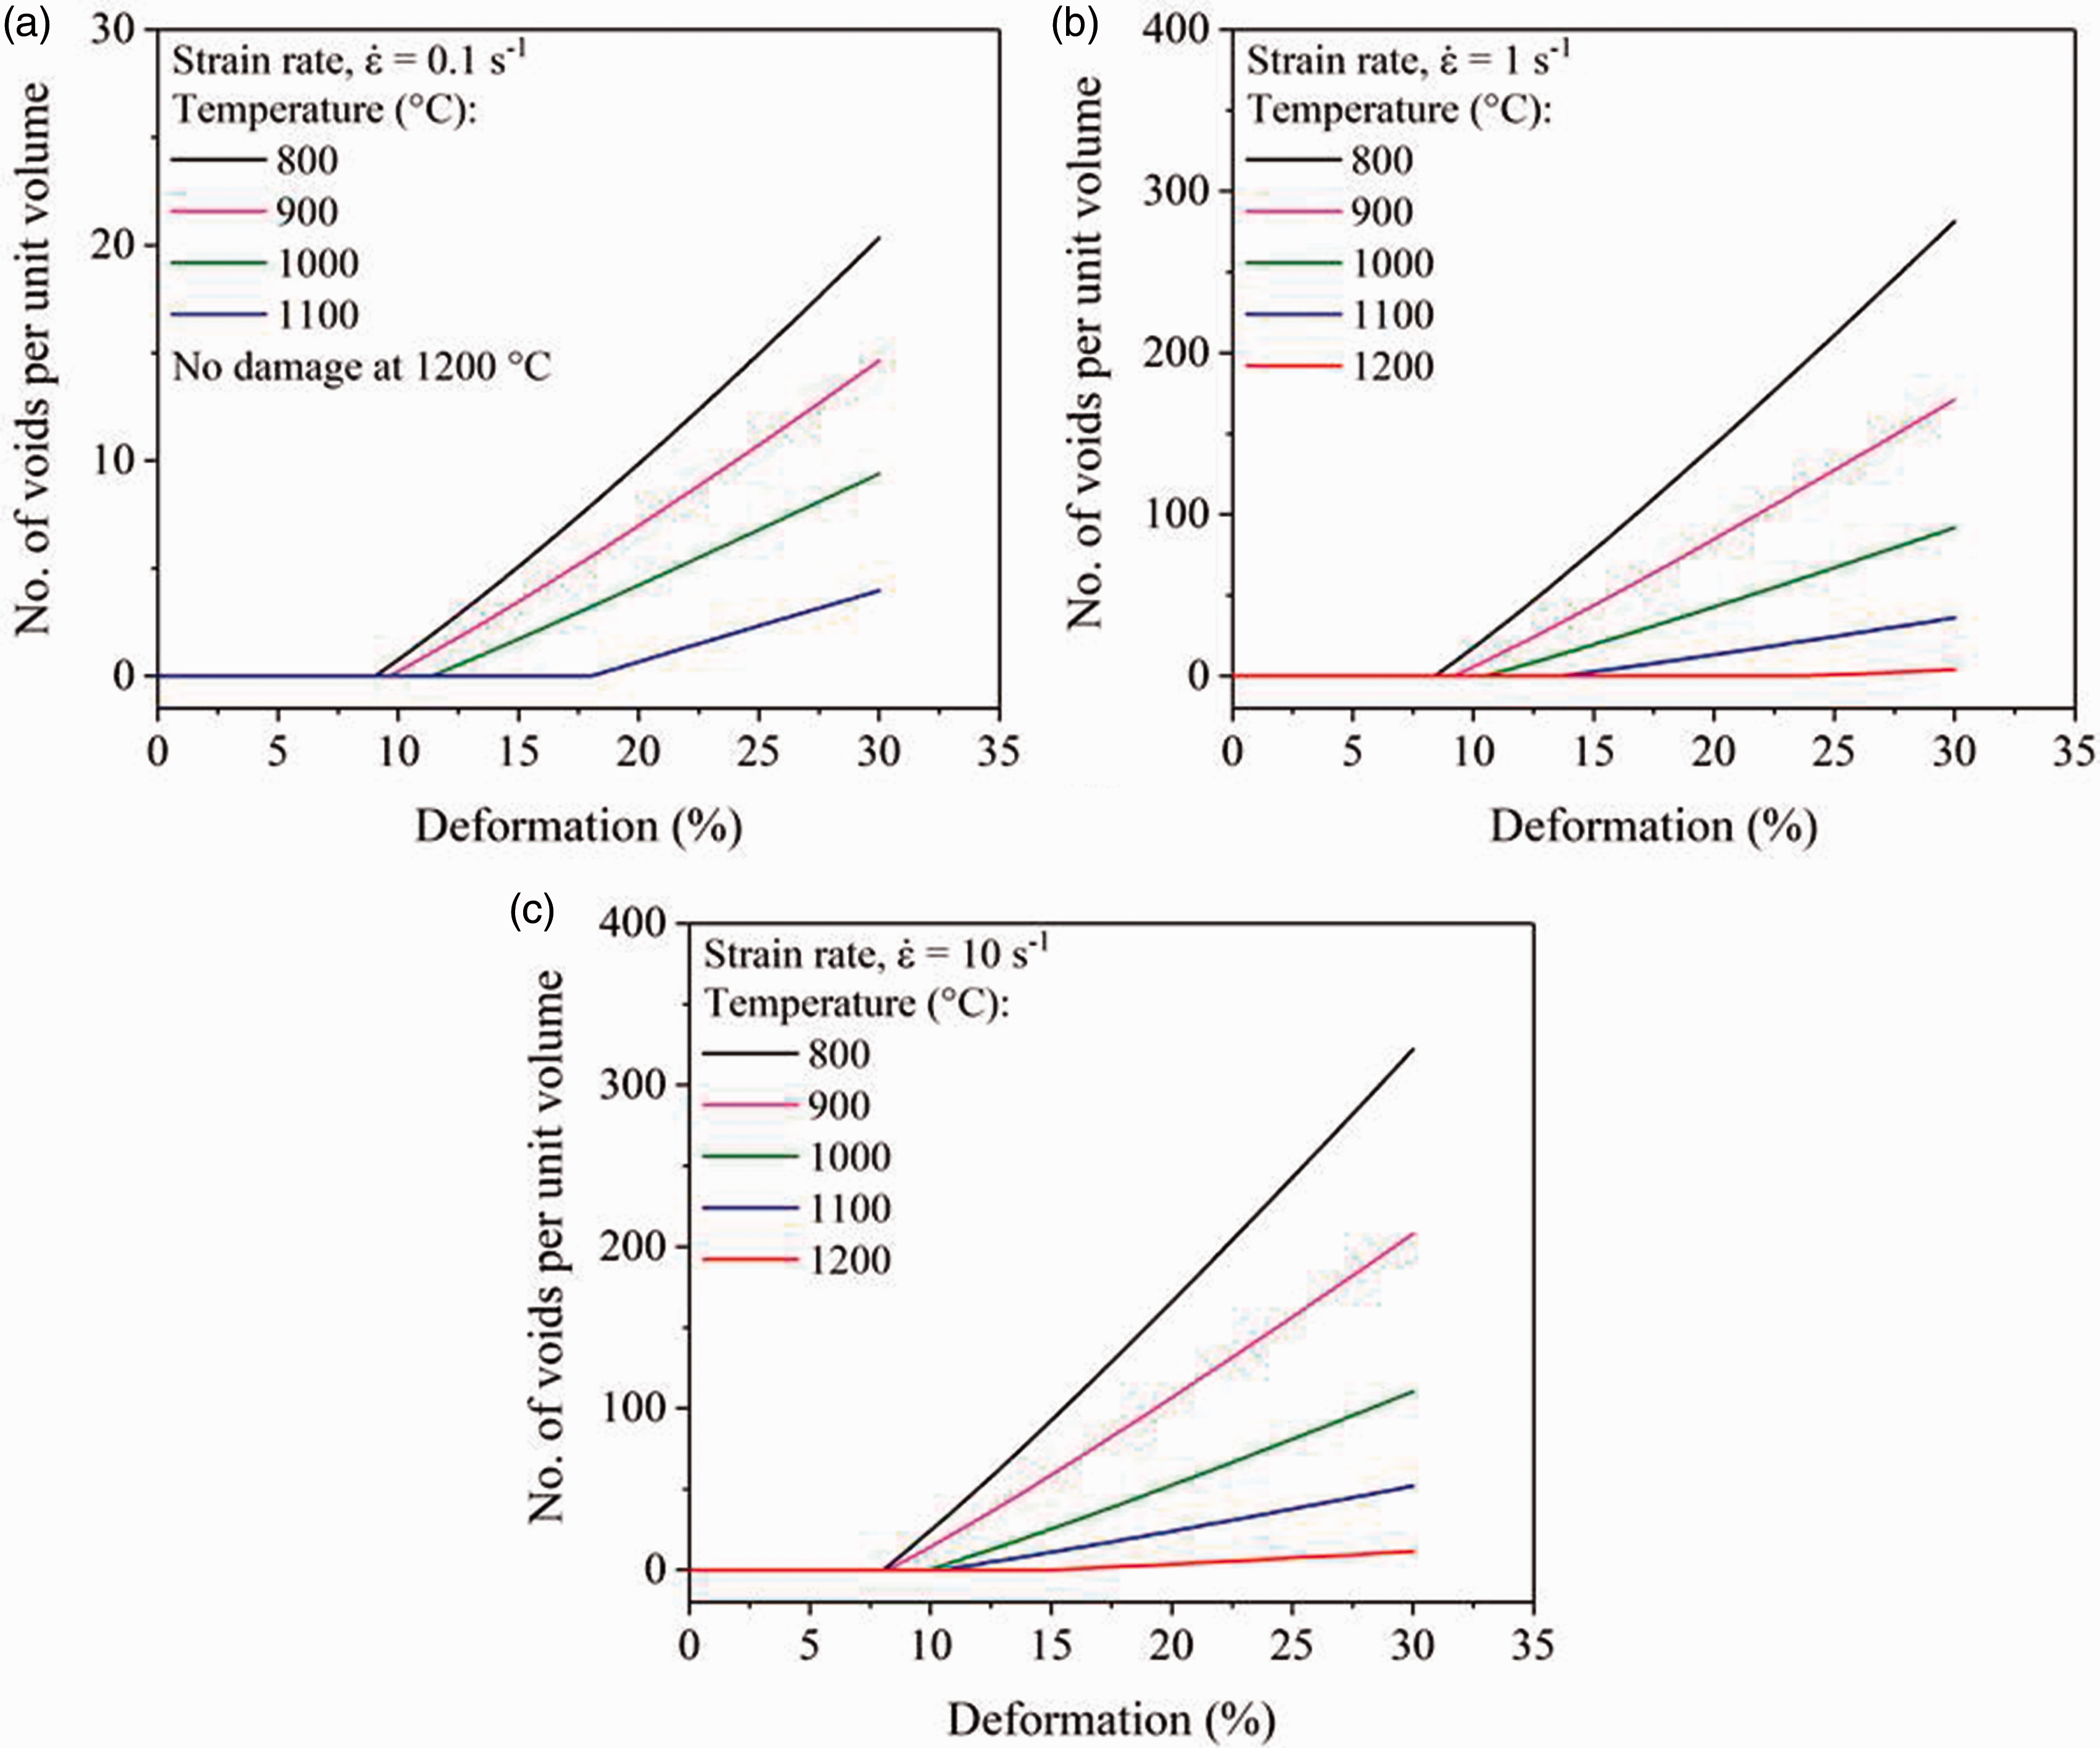
The modified Horstemeyer damage could be used to predict the damage initiation and evolution in hot forming due to the model's dependence on
The new coupled-DRX-damage nucleation criterion is based on the macroscopic flow stress and fracture toughness. The new criterion is intended to predict the damage in macroscopic simulations. The comparison with the RVE model showed the new model can potentially predict the damage during hot forming, i.e. it is able to represent the influence of DRX and the influence of stress state. Homogenizing the RVE simulations to integrate them into a macroscopic model in the strict sense of homogenization theory requires detailed knowledge of the interface behavior, which is not available at present. The damage initiation criterion, equation (16), must hence be considered as motivated from the RVE simulations. For its practical use, however, it cannot be calibrated from RVE simulations but must rely on experimental data, e.g., hot compression, tensile or shear tests.
For model calibration, it needs to be integrated, e.g., into the GTN model, to obtain a model coupling the macroscopic flow stress, DRX and damage. In the past, one attempt of such a coupling was made (Shang et al., 2017) where X DRX delays the nucleation rate by scaling the nucleation strain. However, as DRX occurs, the void nucleation rate increases rather than to slow down, which is not observed experimentally. In future work, the new nucleation criterion will be integrated into the GTN model and validated. The Beynon–Sellars DRX model used in this study has a strong relation to the Kocks–Mecking model and hence could also be interpreted in terms of dislocation densities. A direction for further improvement is to replace the continuum model with at least a model of gradient dislocation plasticity.
Conclusions
Damage initiation and growth at the matrix–inclusion interface is investigated under hot forming conditions. A continuum-based unit-cell RVE approach is used to quantify the damage development when the matrix recrystallizes dynamically according to the Beynon–Sellars model and the decohesion of the interface follows a temperature-dependent cohesive zone damage law. The influence of various factors like DRX, loading direction, temperature, strain rate, total strain, and inclusion size on the damage is analyzed. The key conclusions of the investigations are as follow:
The occurrence of DRX reduces the amount of total damage in the material. The extent of DRX depends on the deformation conditions and controls the average flow stress in the matrix. The deformation conditions also control the initiation of DRX and the damage. For the case where DRX initiates earlier than damage, the damage initiation is delayed and damage growth rate is reduced. However, in the case where damage initiates first, only the damage growth rate is lowered. The direction of loading, i.e. the stress state, promotes different magnitudes of damage. Pure axial tension leads to more severe damage whereas axial compression results in lower damage. In the case of combined loading, axial tension and radial compression, the damage behavior is mainly controlled by the axial tension, but can be reduced by superimposed compression. Moreover, the damage initiates due to normal stress under axial tension, and axial tension and radial compression whereas due to shear stress under axial compression. Increasing the deformation temperature delays the damage initiation and reduces the amount of damage evolution around the inclusion. The temperature-dependent reduction in damage evolution is due to DRX and the corresponding reduction of flow stress. Increasing the strain rate increases the damage accumulation around the inclusion, however, the rate of damage accumulation decreases at lower temperatures. Increasing the total strain increases the total damage accumulation. The shape of the nucleated voids changes from the round to elliptical to higher total strain. The analysis of the inclusion size on the damage showed that the large inclusion induces higher total damage and the role of DRX in reducing damage is more influential on damage for large inclusions. Extending the thermodynamically consistent Horstemeyer damage model for hot forming makes it possible to reproduce the results of the RVE simulations over a range of temperatures and strain rates. This model provides the advantage of explicitly considering the influencing factors on damage in a mean-field approach and allows for the numerical prediction of the void volume, while being motivated from the interface behavior between matrix and inclusion.
Footnotes
Acknowledgements
The authors gratefully acknowledge the “Central Facility for Electron Microscopy, Aachen” for providing the quantitative data of inclusions and “Institute of Metal Forming, Aachen” for performing hot compression tests.
Declaration of conflicting interests
The author(s) declared no potential conflicts of interest with respect to the research, authorship, and/or publication of this article.
Funding
The author(s) disclosed receipt of the following financial support for the research, authorship, and/or publication of this article: Deutsche Forschungsgemeinschaft (DFG, German Research Foundation) for financially supporting this research work through project C03 of the Transregional Collaborative Research (Projekt Nummer 278868966 - TRR 188) on “Damage Controlled Forming Processes”.