
Abstract
The cleanness of steel is significantly influenced by the casting conditions during continuous slab casting. Unsteady casting conditions, such as those occurring during a ladle change, may deteriorate the cleanness of the cast product but are process-wise unavoidable. This study investigates the impact of ladle change operation on meso- and macroscopic cleanness levels and seeks to uncover the origin of these non-metallic inclusions (NMIs). To facilitate the identification of the particles’ source, slag tracers were employed to mark ladle and tundish slag. Hot-rolled coils produced from slabs cast during the ladle change were sampled along their entire length and characterised for meso- and macro-NMIs. The inclusions’ positions were then projected to the corresponding positions within the initial strand. The ladle change event significantly deteriorated the strand's meso- and macro-cleanness over a total casting length of approximately 19 m. During the period, as the tundish weight decreased, the largest inclusions were detected. The highest concentration of meso- and macro-NMIs was observed shortly before the start of casting of the subsequent heat. The following sources for meso- and macroscopic NMIs were determined during the ladle change: ladle slag, mould slag and eroded refractory material.
Introduction
To meet increasing quality requirements for steel in recent decades, the content of non-metallic inclusions (NMIs) in steel has become a significant parameter of the material's performance.1,2 For this reason, it has been the focus of numerous investigations and improvements in both industry and research.
In principle, the characterisation of NMIs can be achieved through either indirect or direct measurement methods, which are selected based on the specific application and required quality.3,4 Indirect measurements, such as determining the total oxygen content, offer a rapid and cost-efficient estimation of the prevailing steel cleanness. However, these methods are only reliable as relative indicators. 5 On the other hand, direct measurement techniques are capable of measuring the inclusions’ size, amount, shape or chemical composition, which are important characteristics for evaluating their behaviour during steel processing or their influence on the final mechanical properties of the steel product. 6 Two conventional direct methods for evaluating the steel's cleanness are the optical light microscope4,7,8 and the scanning electron microscope coupled with an energy-dispersive X-ray detector (SEM-EDS).9–11 These methods are based on the examination of two-dimensional cross-sections of polished steel samples and have been found to be particularly useful in characterising microscopic inclusions (1–15 µm). 12 As the distribution of NMI in steel follows a log-normal pattern,13,14 larger inclusions are statistically less common. Thus, Franceschini et al. 15 argue that conventional two-dimensional analysis may not be appropriate for characterising meso- (15–100 µm) or macroscopic inclusions (>100 µm) due to the need to consider a more significant volume for accurate characterisation. Consequently, volumetric techniques such as inclusion extraction,16–19 ultrasonic testing,20–22 and X-ray computed tomography23–25 have become crucial. These methods are chosen according to the specific needs of the task and available resources and can be effectively paired with other methods, such as SEM-EDS. This combination broadens the scope of the measurable inclusion size and enriches the data with details regarding the chemical composition of the inclusions, thus providing a more comprehensive understanding of steel cleanness.
During ladle change and the associated temporary reduction of the tundish fill level, the altered flow conditions and reoxidation can decrease the steel cleanness. 4 These unsteady casting conditions not only affect the separation efficiency of existing NMIs but can also be the source of large exogenous inclusions. 26 These include, for example, the carry-over ladle slag from the draining steel ladle, slide gate sand, tundish and mould slag. The effects of a ladle change on the micro-cleanness level have been extensively studied in the past using conventional methods such as SEM-EDS and total oxygen measurements.27–30 However, only a few publications are currently available on the impact on meso- and macro-cleanness levels. Among these are the studies by Leão et al., 31 which specifically look at the number of sliver defects – an indirect measure of the presence of macro inclusions, as these defects can later be rolled out as line defects. Additionally, the work of Ren et al. 32 explored the impact of ladle change on the content of large-size inclusions using electrolytic extraction on slab samples. Lastly, the research by Song et al. 33 utilises physical modelling and computational fluid dynamics, coupled with evaluations of micro- to macro-cleanness in tundish samples, to study the mechanism of slag entrapment during the ladle change.
Despite these insights, a significant challenge in the field: the difficulty of precisely pinpointing the origin of these inclusions. This challenge is further elucidated in the review by Costa e Silva, 34 who discusses the dynamic and complex interactions between NMIs and their surrounding environment – steel, slag and refractory material. Costa e Silva highlights that these chemical interactions can alter the inclusions’ composition and morphology to such an extent that determining their original source becomes an increasingly difficult task.
From this background, different tracer methods have been developed and successfully implemented on an industrial scale.4,35 In general, tracing techniques can be categorised into two types: indirect and direct methods. In indirect tracing, no external tracing agents are added. Instead, this approach involves comparing specific characteristics of used materials (e.g., slags, alloys, refractory) and NMIs, such as the natural isotope ratio36,37 or the rare earth element (REE) content.38–40 These unique isotope ratios or REE patterns serve as distinctive fingerprints that facilitate the identification of the inclusion's source. Conversely, direct tracing methods require the addition of certain tracing agents. In addition to analysing the natural REE concentration within the particle or auxiliary substances, there is also the option to utilise REEs like La or Ce as active tracers. These elements are intentionally alloyed in metallic form to the steel at a specific stage of the process with the assumption that the entire existing inclusion population is modified and marked by these REEs. This approach has been successfully used in industry, for example, to trace deoxidation products.5,38,40,41 Regarding the tracking of slag (ladle, tundish or mould) as an exogenous source of inclusions, the employment of BaO or SrO has become established.42–45 Liu et al. 46 highlight in their review that these oxides are well suited for such applications due to their high thermodynamic stability, the low solubility of their cations in liquid steel at the prevailing temperatures, and the minimal impact on the physical properties of the slag, provided the quantity of these oxides used is kept within suitable limits.
This paper discusses the impact of ladle change operations on the meso- and macroscopic cleanness levels during continuous slab casting and seeks to uncover the origins of exogenous defects that may occur during this event. Slag tracers were utilised in this industrial experiment to facilitate the subsequent identification of inclusion sources. This methodology aims to determine whether ladle or tundish slags contribute to these defects, providing insights to enhance defect control strategies in steel production.
Materials and methods
Experimental procedure
The industrial experiments were conducted at the integrated steel plant of voestalpine Stahl GmbH in Linz, Austria. The tracer experiment was carried out during a casting sequence of micro-alloyed steel heats. This steel grade was selected because these hot strips are later cut into sheet metal, enabling sampling along the coils’ length without generating significant amounts of scrap. Table 1 shows a representative chemical composition of a quenched tundish sample of this Nb-alloyed steel grade.
Chemical composition of a lollipop sample obtained from a micro-alloyed steel provided by the steel plant of voestalpine Stahl GmbH.
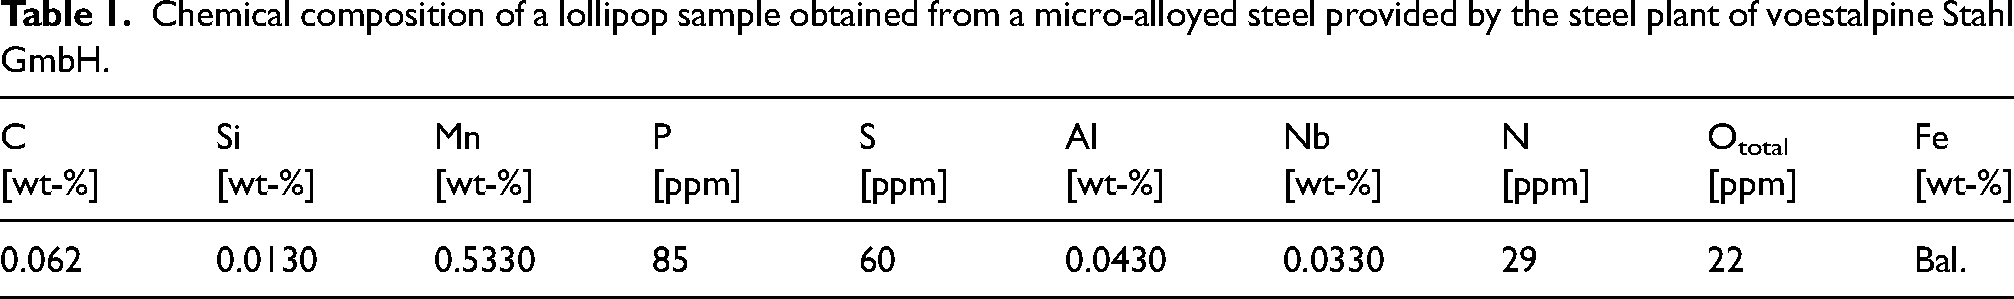
This steel grade is usually produced via the route: basic oxygen converter (BOF) → ladle furnace (LF) → continuous caster (CC). Typically, 180 tonnes of steel are tapped into a steel ladle. During the tapping procedure, the steel is fully killed with Al. Slag formers and the main part of the alloying elements are added during tapping. The final adjustments regarding temperature and chemical composition are achieved at the ladle furnace. Finally, the heat is cast at a continuous slab caster.
In the case of the tracer experiment, additions of BaCO3 and SrCO3 were performed to mark the ladle and tundish slag. However, these carbonates are not thermodynamically stable at the given steelmaking temperatures and, therefore, decompose into their respective oxides.44,47 The Ba-tracer was added at the end of the BOF tapping procedure. During LF treatment, effective Ar-stirring was implemented to ensure uniform distribution of the Ba-tracer within the ladle slag. Meanwhile, SrCO3 was manually distributed in buckets on top of the calcium aluminate-based slag formers in the empty tundish, followed by the addition of rice hull ash during the tundish filling phase. As depicted in Figure 1, this study's primary focus is the detailed analysis of the ladle change between the second and third heat, as the Ba-tracer was uniquely introduced in the second heat of the casting sequence.
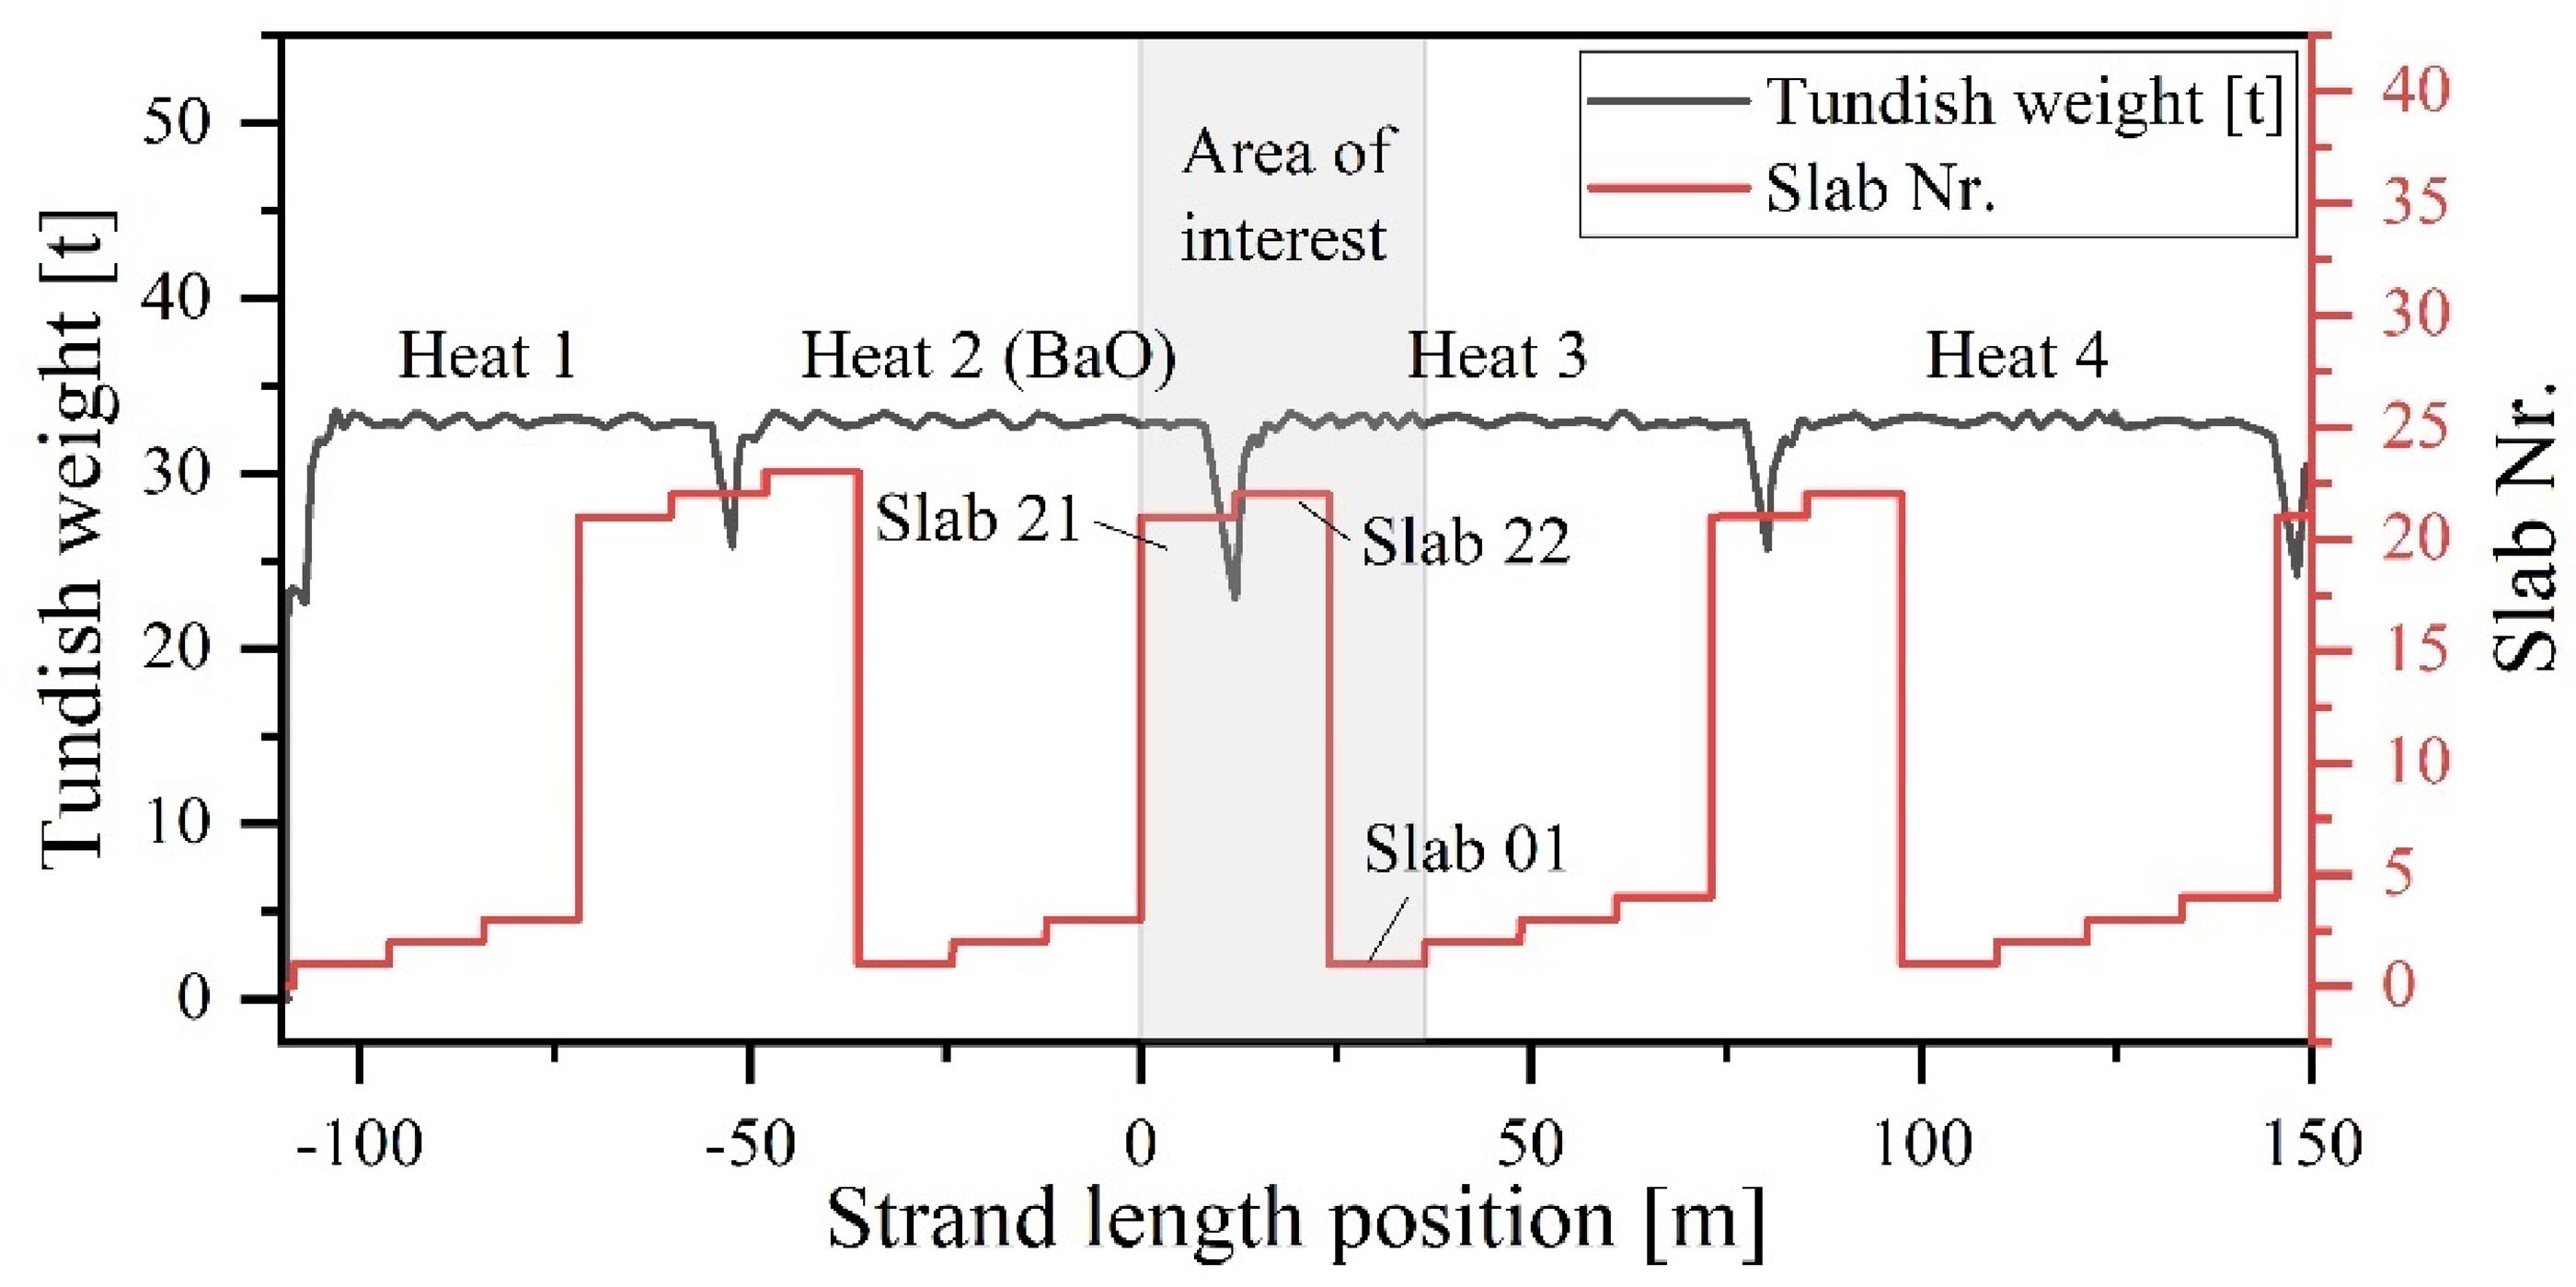
Visualisation of the ladle change operation between Heat 2 and Heat 3.
The heats of this experiment were cast using the CC6 single-strand casting machine, which has a tundish capacity of 32 tonnes. The casting speed remained constant at 1.3 m/min, including the period of the ladle change. The strand dimensions were 220 mm in thickness and 1558 mm in width. The tundish covering slag consisted of two layers: a layer of calcium aluminate (marked with SrO) and a top layer of rice husk ash for thermal insulation.
To correlate defects in the sheet metal to certain events during the ladle change, a back-projection is performed from the hot-rolled coils to the corresponding strand position, considering scrap losses throughout the production chain. The position of the strand's length indicates the exact part of the strand located at the meniscus at any specific time, which allows all time-dependent measurement signals (e.g., opening the ladle slide gate) to be correlated with this section. This enables accurate tracking of the strand's physical location throughout the casting process without making assumptions about the uncertain flow conditions inside the tundish or mould during the unsteady casting conditions.
Four standard lollipop samples were collected from Heat 2 to investigate the cleanness of steel during the refining and casting process. Table 2 displays the time of collection and the period during which they were taken.
Time of collection and nomenclature of steel samples.
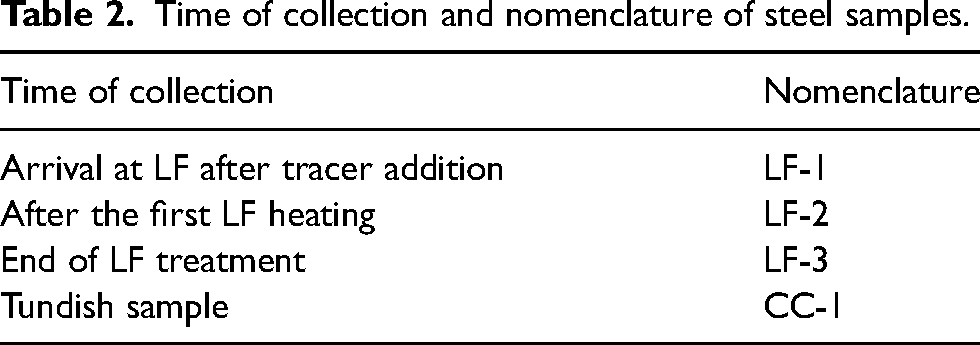
These samples are analysed to ensure that the existing inclusion population originating from the Al deoxidation is not modified by the Ba- and Sr-tracer, as this could potentially lead to erroneous source identification. In addition to collecting steel samples, process slags were also sampled throughout the experiment. At the end of the LF treatment of the second heat, a slag sample was taken. Tundish slag samples were taken approximately every 10 min after each ladle change operation. Mould slag sampling primarily focused on the 20th and 40th minutes of casting from each respective heat. The chemical analysis of these slag samples is intended to confirm successful marking with the respective tracer of both the ladle and tundish slag. Additionally, by analysing the BaO content in the tundish slag, it is possible to detect the potential carryover of ladle slag into the tundish during the ladle change.
Three slabs are examined in detail to identify the section of the strand that has been impacted by the ladle change. After hot-rolling, the material is further cut to sheet metal with a length of 3 m. As depicted in Figure 2(a), a sample is collected every two sheets, from which two adjacent samples are taken (position 1 and 2), each measuring 300 × 200 mm. Each sample is finally polished on the top and bottom surfaces for the X-ray inspection using a surface grinding machine (Perfect PFG-D4080AH) with a 180-grit wheel, removing less than 0.1 mm from each side. This step is applied to remove surface impurities that come from the sampling procedure, storage and transport.
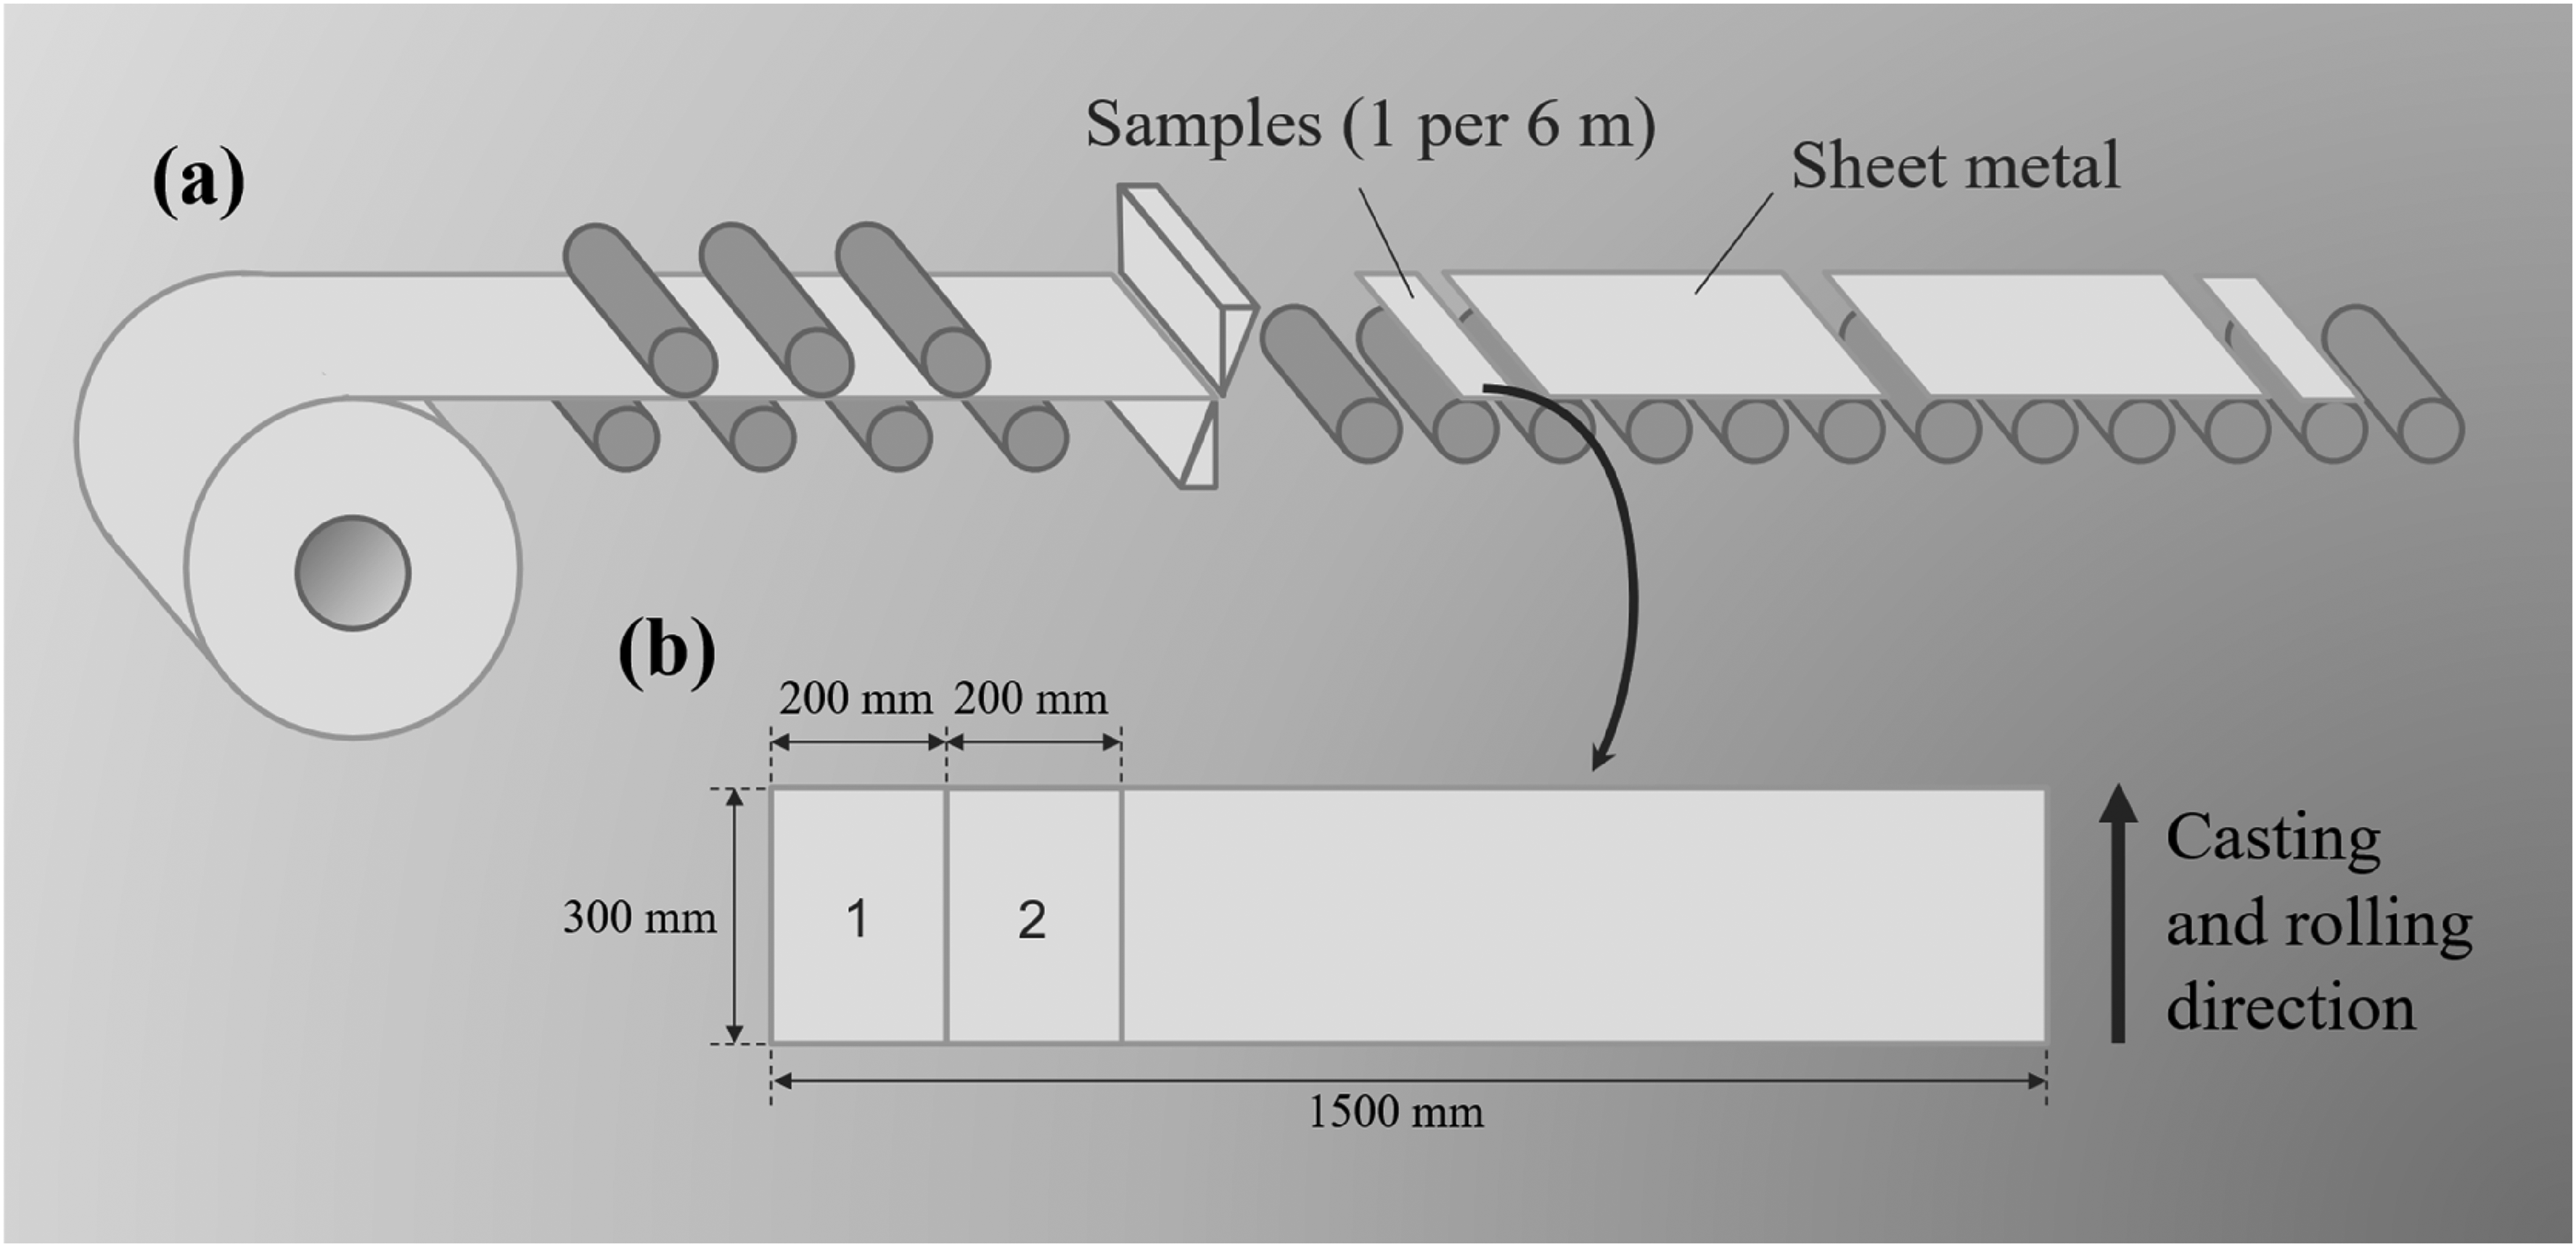
Schematic representation of the sampling strategy: (a) collection of sheet metal samples from hot-rolled coils and (b) final cutting of the samples to 300 × 200 mm (positions 1 and 2).
Methods of analysis
During the industrial experiment, standard lollipop samples were taken and analysed to determine their bulk chemistry using spark optical emission spectroscopy (Spark-OES) with the ARL iSpark 8880 instrument (Thermo Fisher Scientific, Waltham, USA). The composition of the different slag samples obtained from the ladle, tundish and mould was determined using X-ray fluorescence (XRF) spectroscopy (ARL 9900, Thermo Fisher Scientific, Waltham, USA).
For the characterisation of microscopic NMIs, a Zeiss Ultra-55 field emission SEM (Carl Zeiss AG, Oberkochen, Germany) equipped with a 50 mm2 SDD EDS detector (Oxford Instruments X-MaxN 50; Oxford Instruments GmbH NanoAnalysis, Wiesbaden, Germany) was used. Only particles with an equivalent circle diameter (ECD) greater than 1 µm were detected at the automated measurement. The duration of EDS analysis for each particle was set to 3 s.
For the characterisation of meso- and macroscopic inclusions, a 2D X-ray inspection system was utilised, featuring a 180-kV nano focus tube and a detector with a pixel size of 200 µm. Figure 3(a) illustrates the principle of radiographic characterisation. As depicted in Figure 3(b), the radiographic examination process involves a comprehensive scan at 468 distinct positions across each polished sheet metal sample, following a grid-like pattern. At each position, an image with a resolution of 1000 × 1000 pixels is generated, covering a sample area of 10 × 10 mm. This setup leads to a pixel size of 10 µm, allowing for detailed examination and analysis of NMIs within these samples. A compromise was made between the measurement time per image and achieving a minimal inclusion size detection of 80 µm to accommodate the examination of a high quantity of samples with the specified magnification.
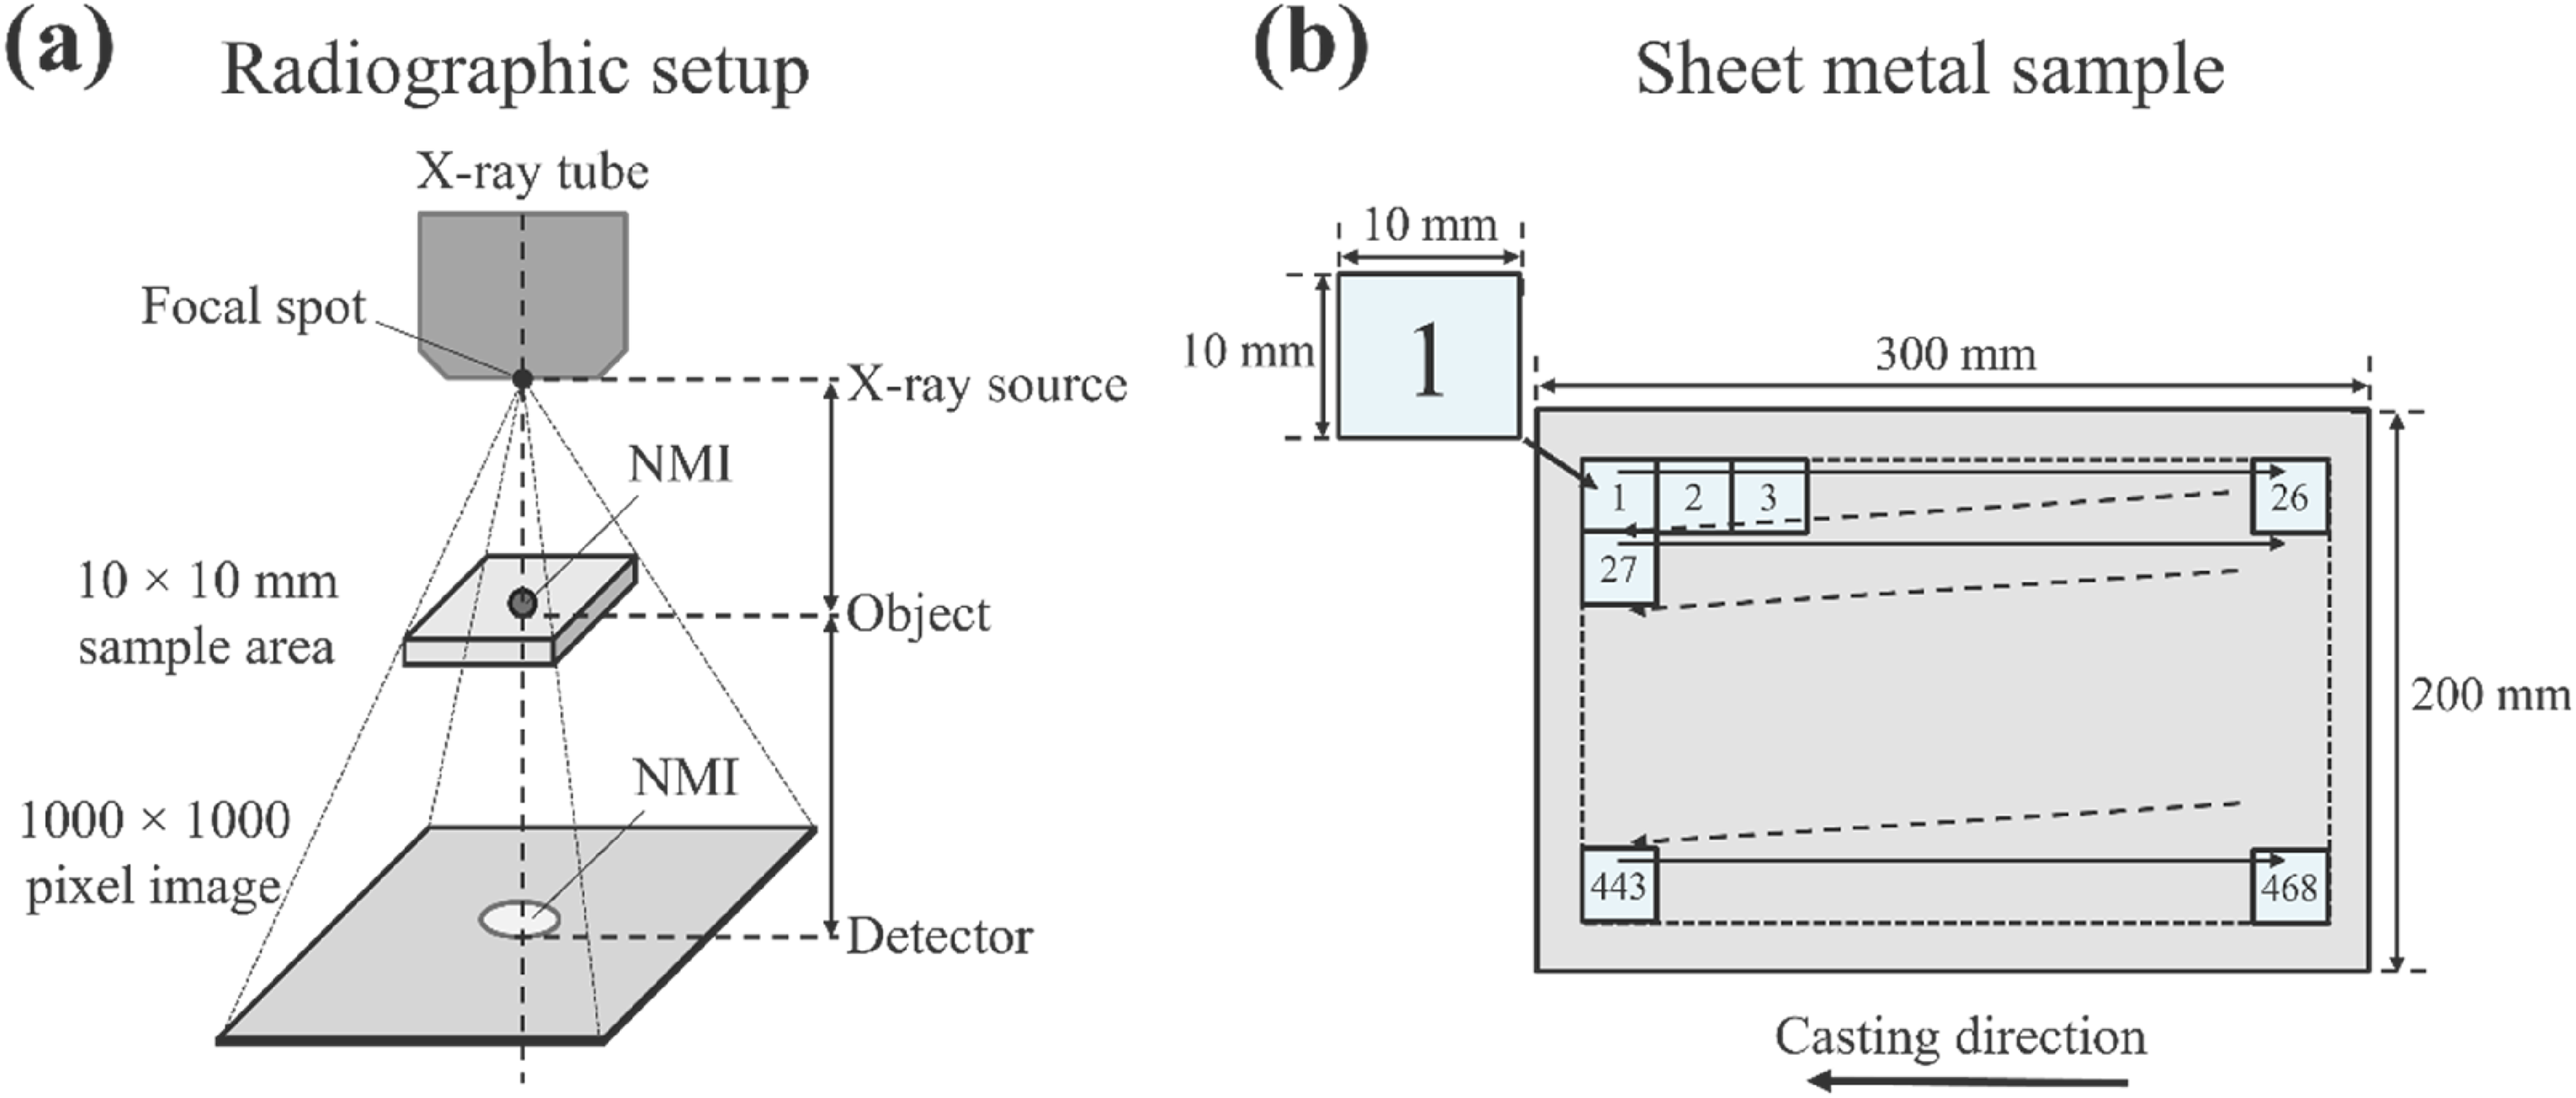
Principle of radiographic imaging: (a) illustration of the positioning of the X-ray source, sample and detector and (b) raster scanning of the sheet metal samples.
These generated images are subsequently analysed for NMIs using custom image recognition software. Due to the differing X-ray linear attenuation coefficients between the Fe-based matrix and the oxidic NMIs (Al2O3, CaO–Al2O3, etc.), a greyscale contrast is established.24,25,48 To increase the contrast between NMI/steel and reduce noise within the X-ray images, a median and a Laplacian of Gaussian filter are applied. Afterwards, thresholding is performed based on a reference image free of NMIs, and regions exceeding this threshold are segmented using a region-growing algorithm and binarised. The relevant NMI parameters, such as position, size, quantity and shape, are then extracted and verified by the operator. An example of a macroscopic inclusion, identified via X-ray radiography, is illustrated in Figure 4.
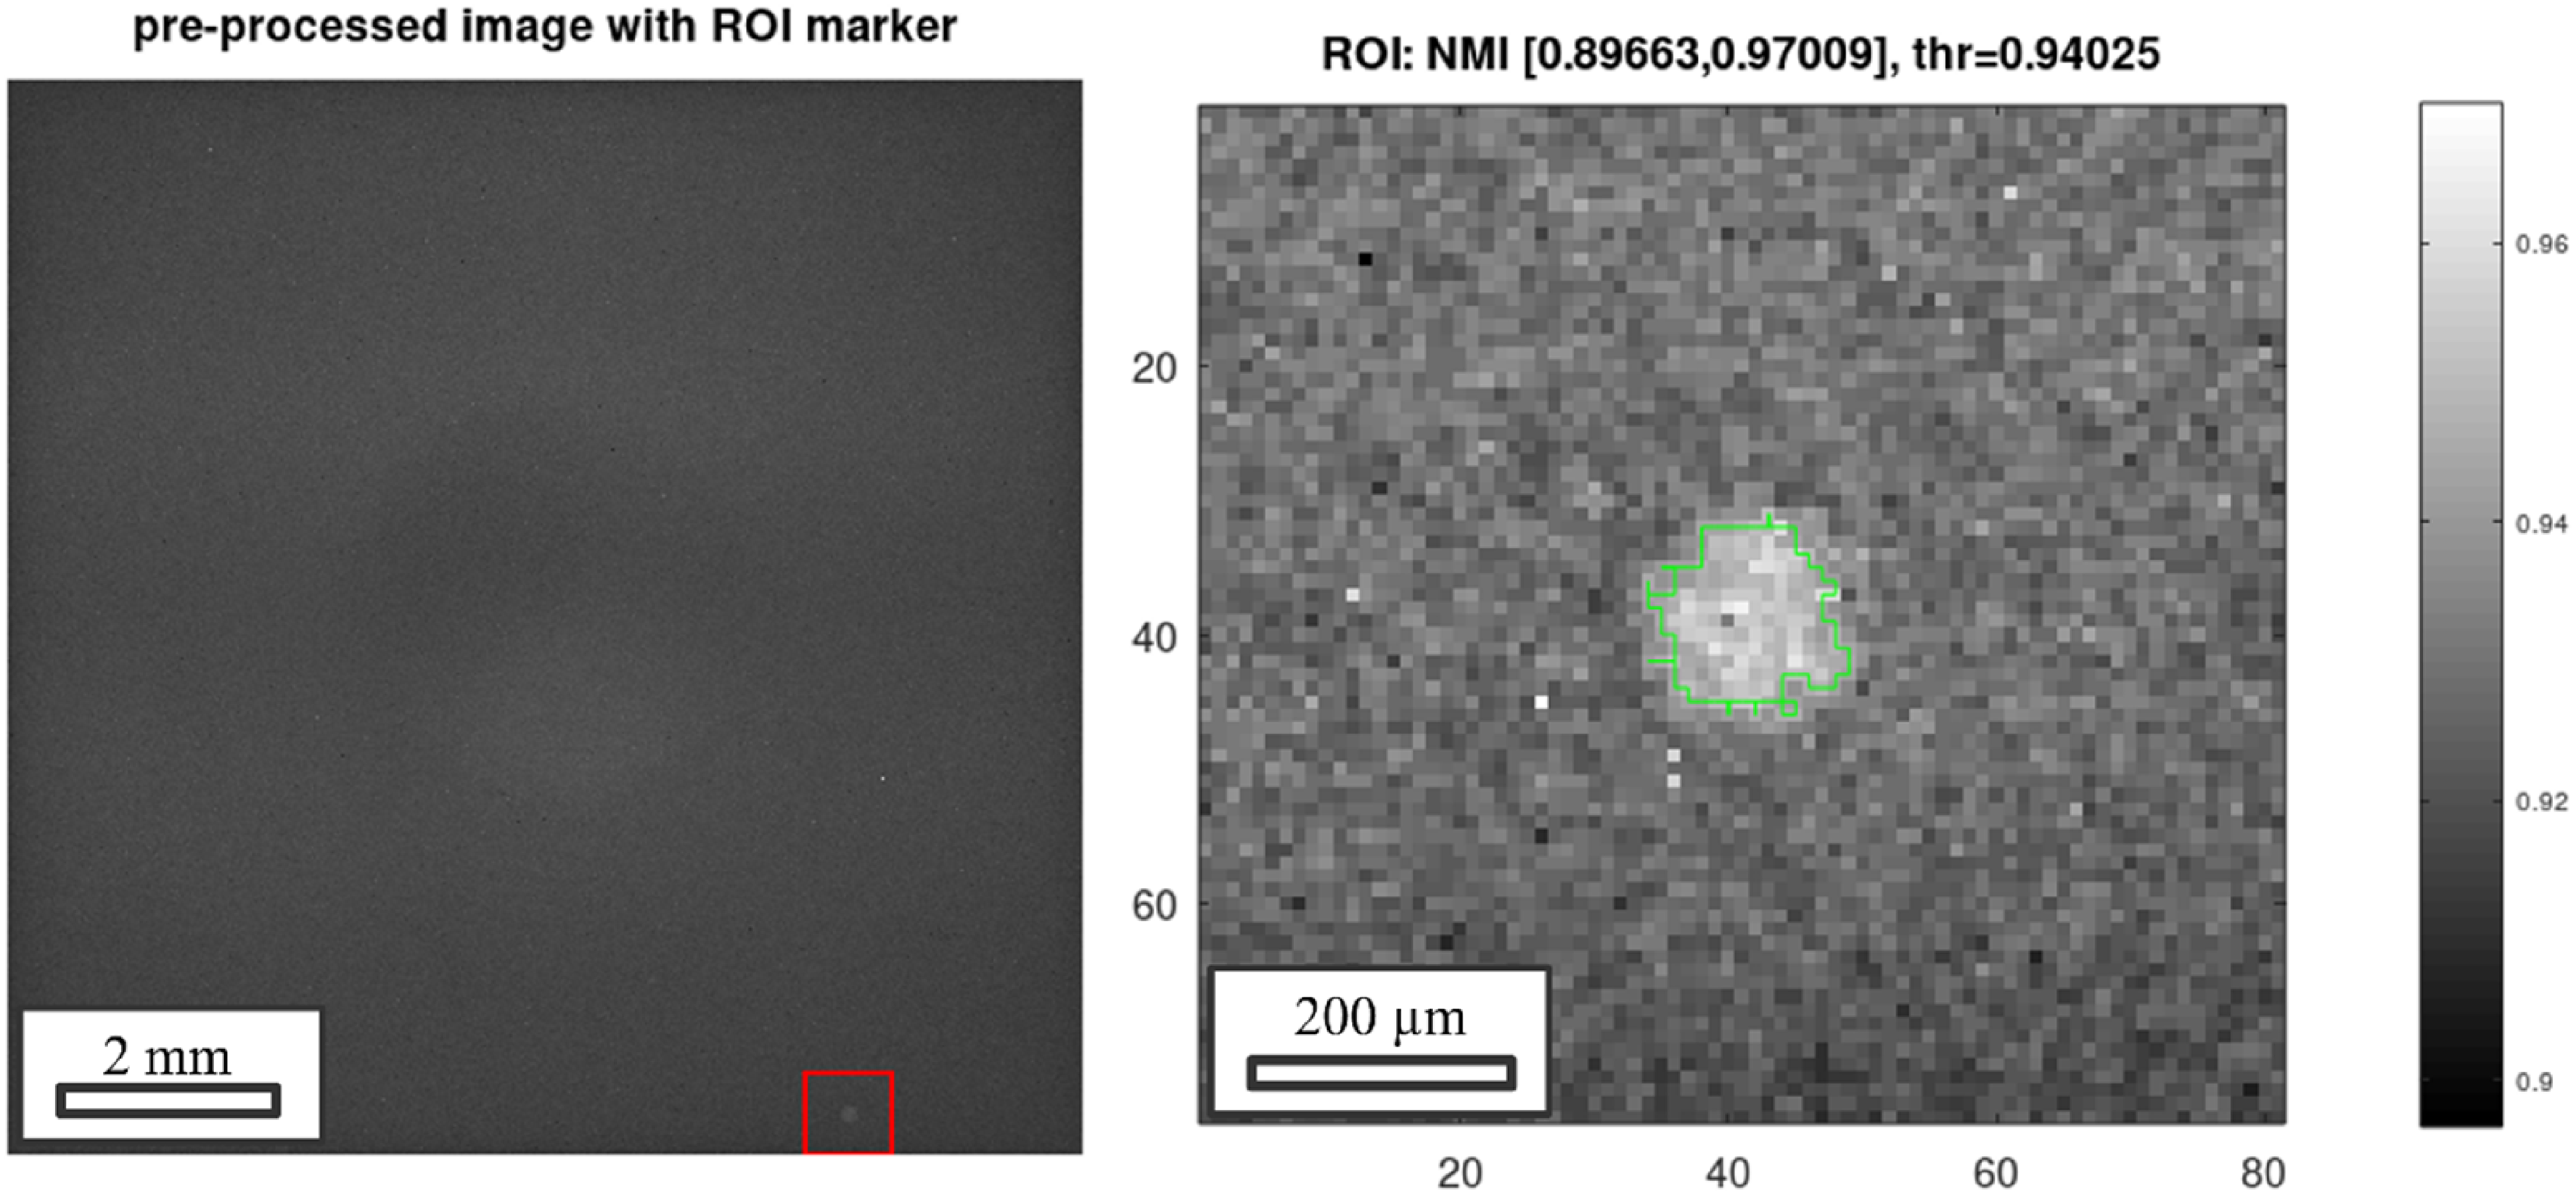
Pre-processed X-ray image of a representative NMI with an ECD of 152 µm (left). Detailed visualisation of the inclusion's shape and size (right).
Further SEM-EDS analysis is conducted for selected inclusions to determine their chemical composition. Therefore, a small sample is cut around the inclusion, which is then embedded and manually polished until the inclusion is exposed. For the analysis, a TESCAN CLARA field emission SEM (TESCAN GmbH, Dortmund, Germany) with an additional 80 mm2 SDD EDS detector (Oxford Instruments X-MaxN 80, Oxford Instruments GmbH NanoAnalysis, Wiesbaden, Germany) was applied.
Thermodynamic considerations
Slag tracing
Regarding the suitable amount of tracers in the slags, Fuhr et al. 49 described that the content of BaO and SrO should be sufficient to be detected in the inclusions but not so excessive as to alter the slag's properties significantly. In previous practical experiments,42–44, 49 an alkaline-earth oxide content of 3–20 wt-% was used for tracing calcium-aluminate slags. Further calculations were conducted using FactSage 8.3 to determine the maximum allowable content of BaO and SrO in the respective slag, ensuring the presence of a liquid slag phase during steel refining and casting. Therefore, the steelmaking consortium database CON4 50 was used. In Figure 5, the underlying calculations for the addition of the BaO tracer to the lime-saturated CaO–Al2O3–SiO2 ladle slag are illustrated.
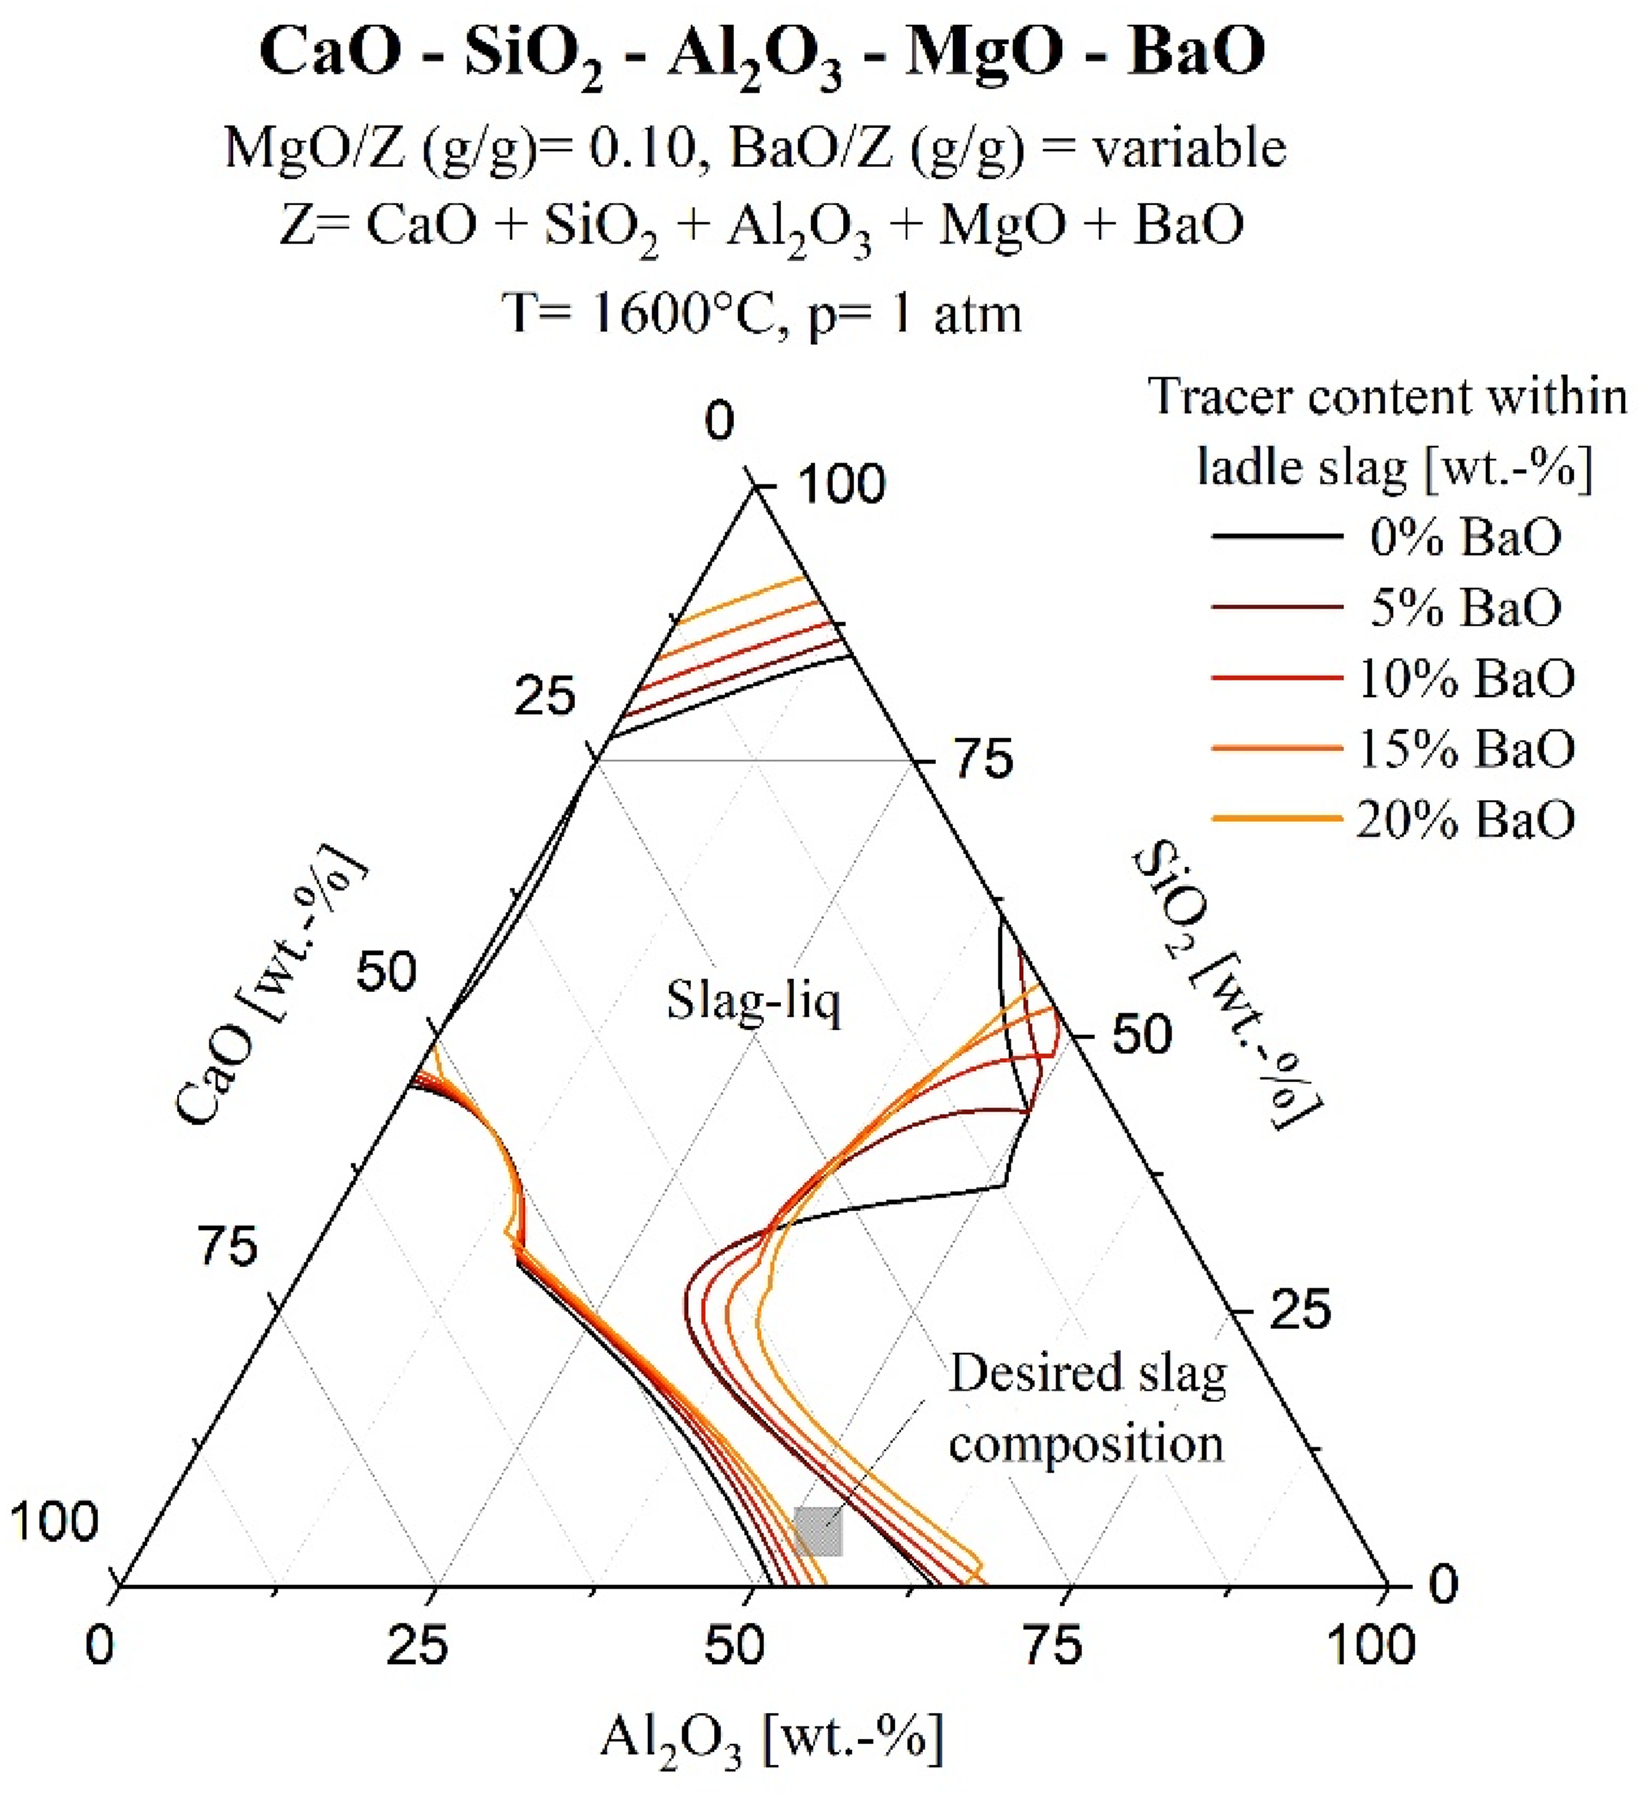
Liquidus projection (isothermal: 1600°C) of the system CaO–Al2O3–SiO2–MgO–BaO with 10 wt-% MgO and variable BaO content (0 to 20 wt-%); CaO + Al2O3 + SiO2 normalised to 100%; calculated using Factsage 8.3 and CON4 database.
This figure also demonstrates the variation of liquidus lines as a function of a variable tracer content and the region of the desired slag composition to achieve a sufficient sulphur capacity. Similar calculations were performed regarding the SrO content within the (calcium aluminate-based) tundish covering slag. After conducting calculations and reviewing the literature, it was determined that the BaO and SrO content in the ladle or tundish slag should not exceed 10 wt-%, which is a compromise between maximising the tracer content without leading to solid precipitates within the slag phase.
Reaction zone model
Building on the work of Piva et al. 51 and Webler et al., 52 a reaction zone model was used to investigate how the composition of a single type (or species) of exogenous meso- and macro-inclusions changes as they interact with liquid steel. This calculation focuses on the reaction between soluble Al in the steel and the liquid inclusion phase (entrapped mould slag), modelled using PyProSim 53 with FactSage databases CON4, FELQ and FactPS. The calculation process, illustrated in Figure 6, involves iterating until equilibrium is reached for specific masses of the inclusion and steel.
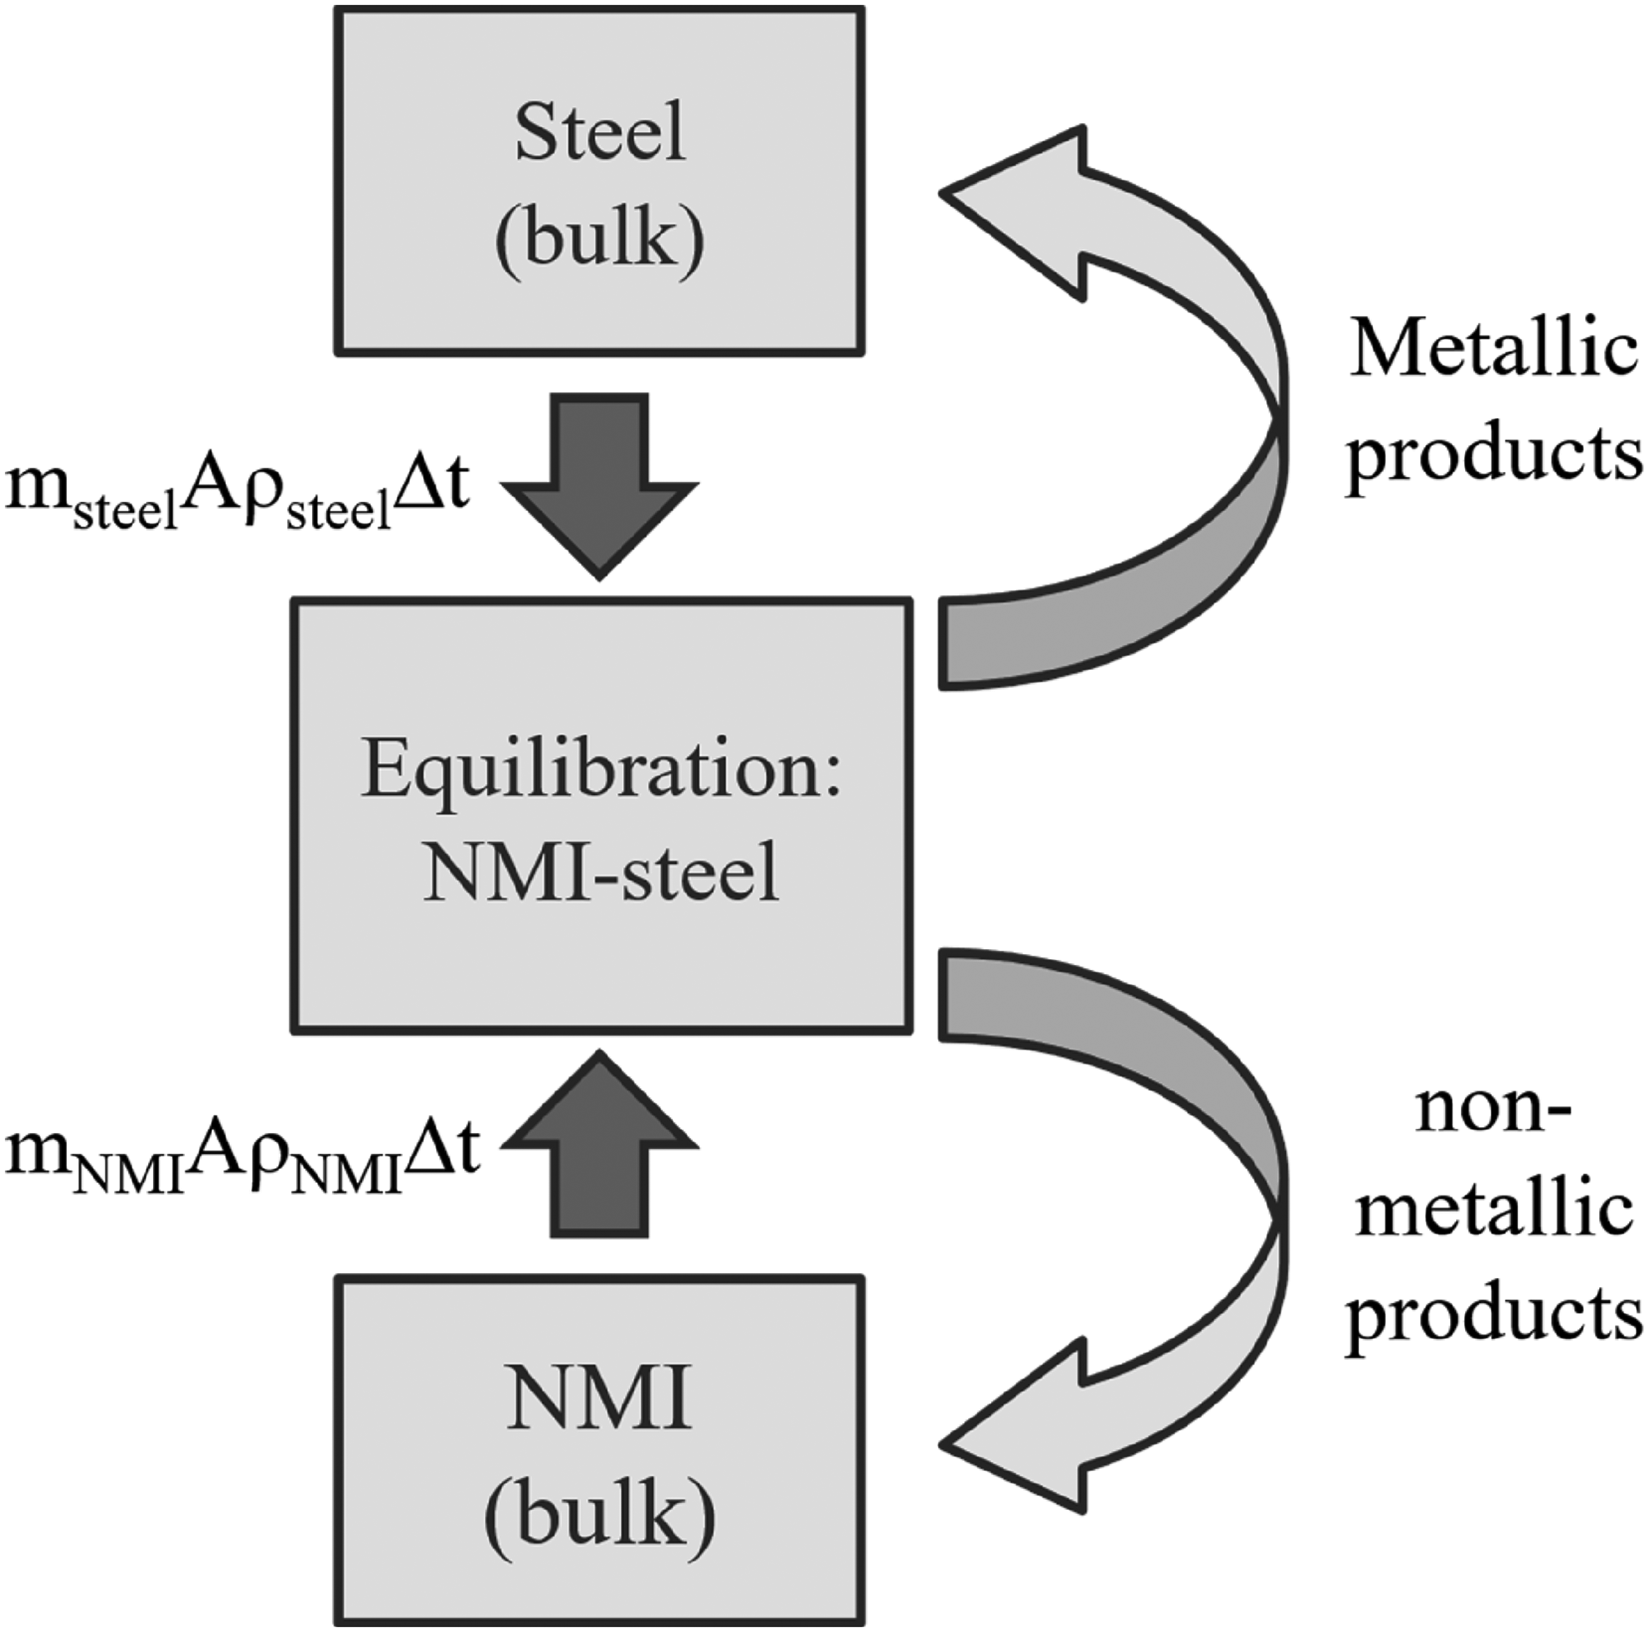
Schematic of the reaction zone model for the NMI-steel reaction for one iteration.
These masses are determined proportionally to the corresponding mass transfer coefficient (mi), the reaction interface area (A), the density of the phase (ρi), and the duration of the timestep (Δt). Subsequently, the non-metallic reaction products are balanced with the bulk composition of the NMI, and the metallic products are equilibrated with the bulk composition of the steel. Based on the findings of Podder et al., 54 the mass transfer coefficient of the inclusion phase was set: mNMI = msteel/5 and the compositional changes are calculated by a time step Δt of 0.05 s. However, the literature values for mass transfer coefficients of the steel phase describing the interfacial reaction between Al and the liquid inclusion are significantly variable, as they are reported to vary between 8 × 10⁻⁶ and 1.2 × 10⁻⁴ m/s.31,5154–57 For that reason, the calculations are performed for both extreme values and checked for plausibility. The entrapped slag particle's size was assumed to be 484 µm, resulting in an area of reaction interface between the spherical NMI and liquid steel of 5.03 × 10⁻⁷ m2. The 484 µm represents the maximum inclusion size observed in this study. The steel's density was defined as 7000 kg/m3, and the inclusion's density was assumed to be 2600 kg/m3.
As noted by Kang et al., 57 ‘fresh’ molten steel is always supplied into the continuous casting mould with a constant Al concentration. Consequently, the bulk steel mass for the model calculation was set to a comparatively high value of 180 tonnes. Although the metallic reaction products are reintroduced into the bulk steel following equilibrium calculations, they are diluted to a quasi-infinite extent due to their relatively small quantity. This ensures that the initial Al concentration within the bulk steel remains constant for subsequent iterations.
Results
Chemical composition of steel and slag samples
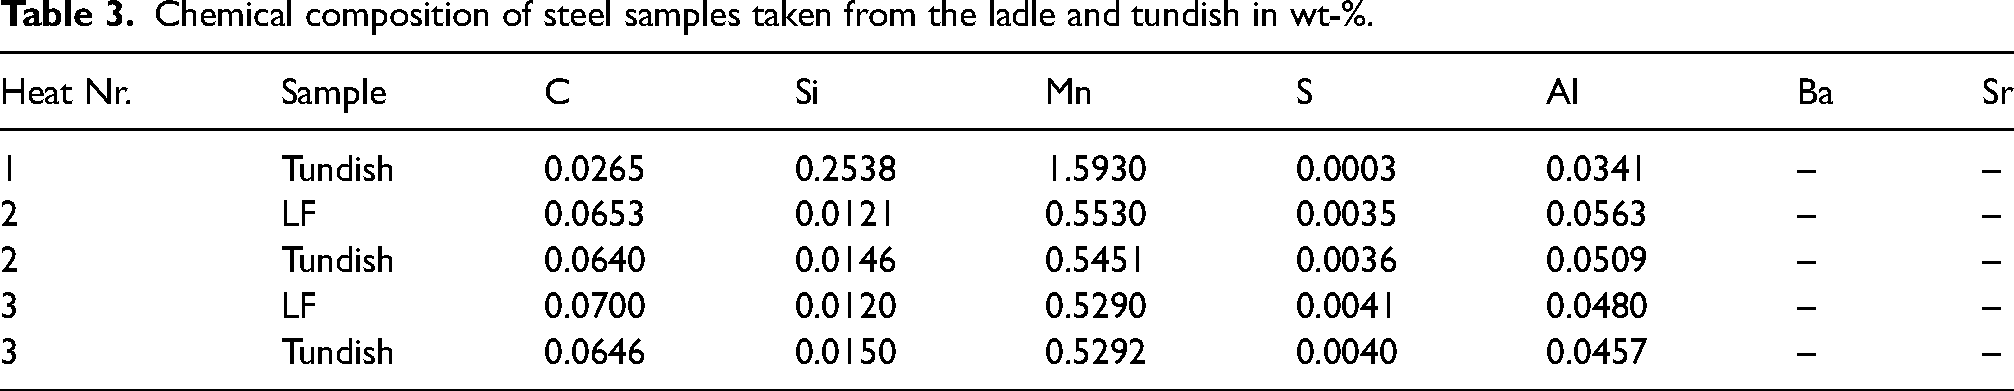
In Table 3, the chemical composition of lollipop samples obtained after the LF treatment and from the tundish (Heat 2 and Heat 3) are presented. The elemental concentrations, including C, Si, Mn, S and Al, within the steel were quantified using spark-OES. Conversely, the levels of Ba and Sr were measured utilising XRF. As mentioned in the last chapter, the slag of the second heat was traced with BaO and a Sr-tracer was added to the tundish slag formers prior to the first heat being cast into the tundish. For completeness, the analysis of the tundish sample of the first heat of the casting sequence is also provided. The first heat is a different steel grade, hence the discrepancy in the analysis. As shown in Table 3, the concentration levels of Ba and Sr in the steel samples are below the detection limit of the XRF, which is less than 10 ppm.
Chemical composition of steel samples taken from the ladle and tundish in wt-%.
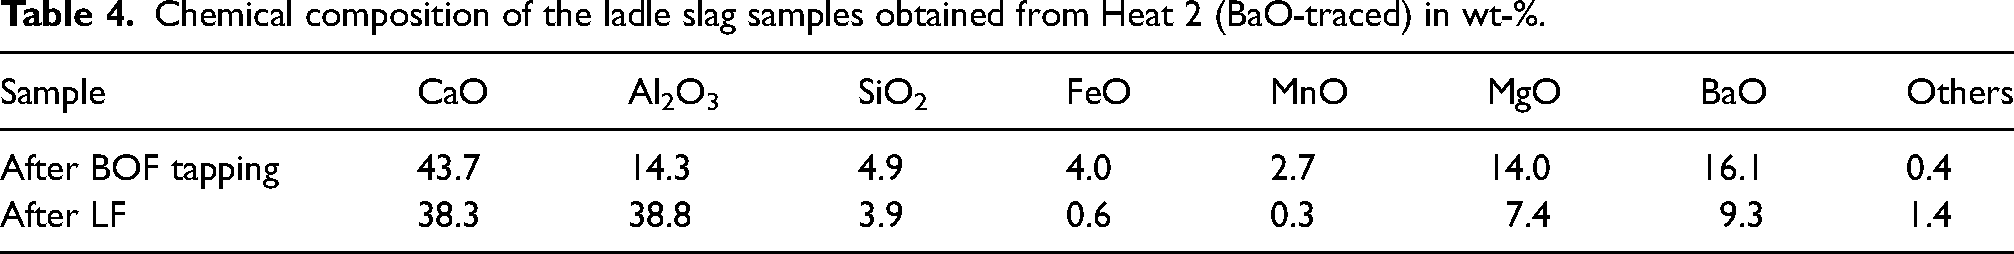
In addition to the steel samples, ladle slag samples were analysed using XRF. The focus was on samples originating from Heat 2. The first sampling took place after the addition of the Ba-tracer at the end of the BOF tapping procedure and the initial melting of the slag mixture at the LF. After the LF treatment, a sample was collected to confirm the successful marking of the ladle slag and to ensure that the BaO content was within the expected range. The target value for BaO content was 10 wt-%.
Table 4 displays the chemical composition of these ladle slag samples. The first sample, taken immediately after the initial heating period, showed a BaO content of 16.1 wt-%. The final content was measured at 9.3 wt-%. Several samples of ladle slag, tundish slag and mould slag were collected and analysed using XRF. The first tundish slag sample was taken during the casting of the first heat, as the Sr-tracer was added before the casting operation started.
Chemical composition of the ladle slag samples obtained from Heat 2 (BaO-traced) in wt-%.
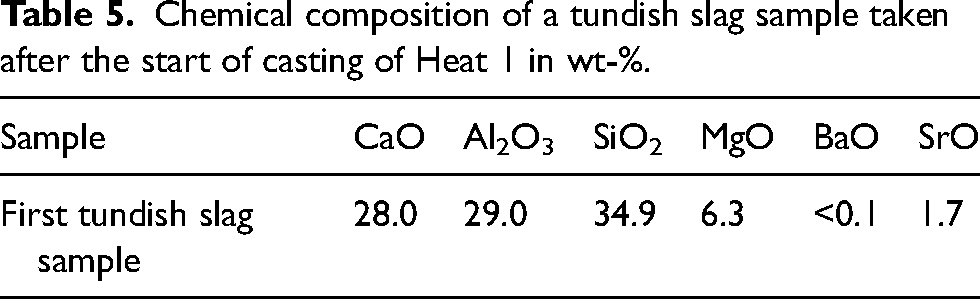
According to Figure 7, the highest SrO content was measured at the beginning of the cast, which was found to be 1.7 wt-%. Samples taken during the casting of Heat 2 and 3 displayed a highly variable SrO concentration, fluctuating between 0.4 and 1.4 wt-%. The BaO content within the tundish slag for the initial samples (Heat 1 and Heat 2) was below the detection limit (<0.1 wt-%). BaO was detected first immediately after closing the ladle slide gate of the second heat. The value obtained was 12.5 wt-%, which was the highest level among all tundish slag samples. Subsequent samples showed a decreasing amount with a certain degree of variability. Furthermore, as shown in Table 5, a significant amount of SiO₂ and MgO was identified in the tundish slag sample taken after the start of casting (Heat 1). These oxides were consistently detected in all subsequent tundish slag samples (SiO2: 20.7–49.6 wt-%; MgO: 3.6–7.8 wt-%).
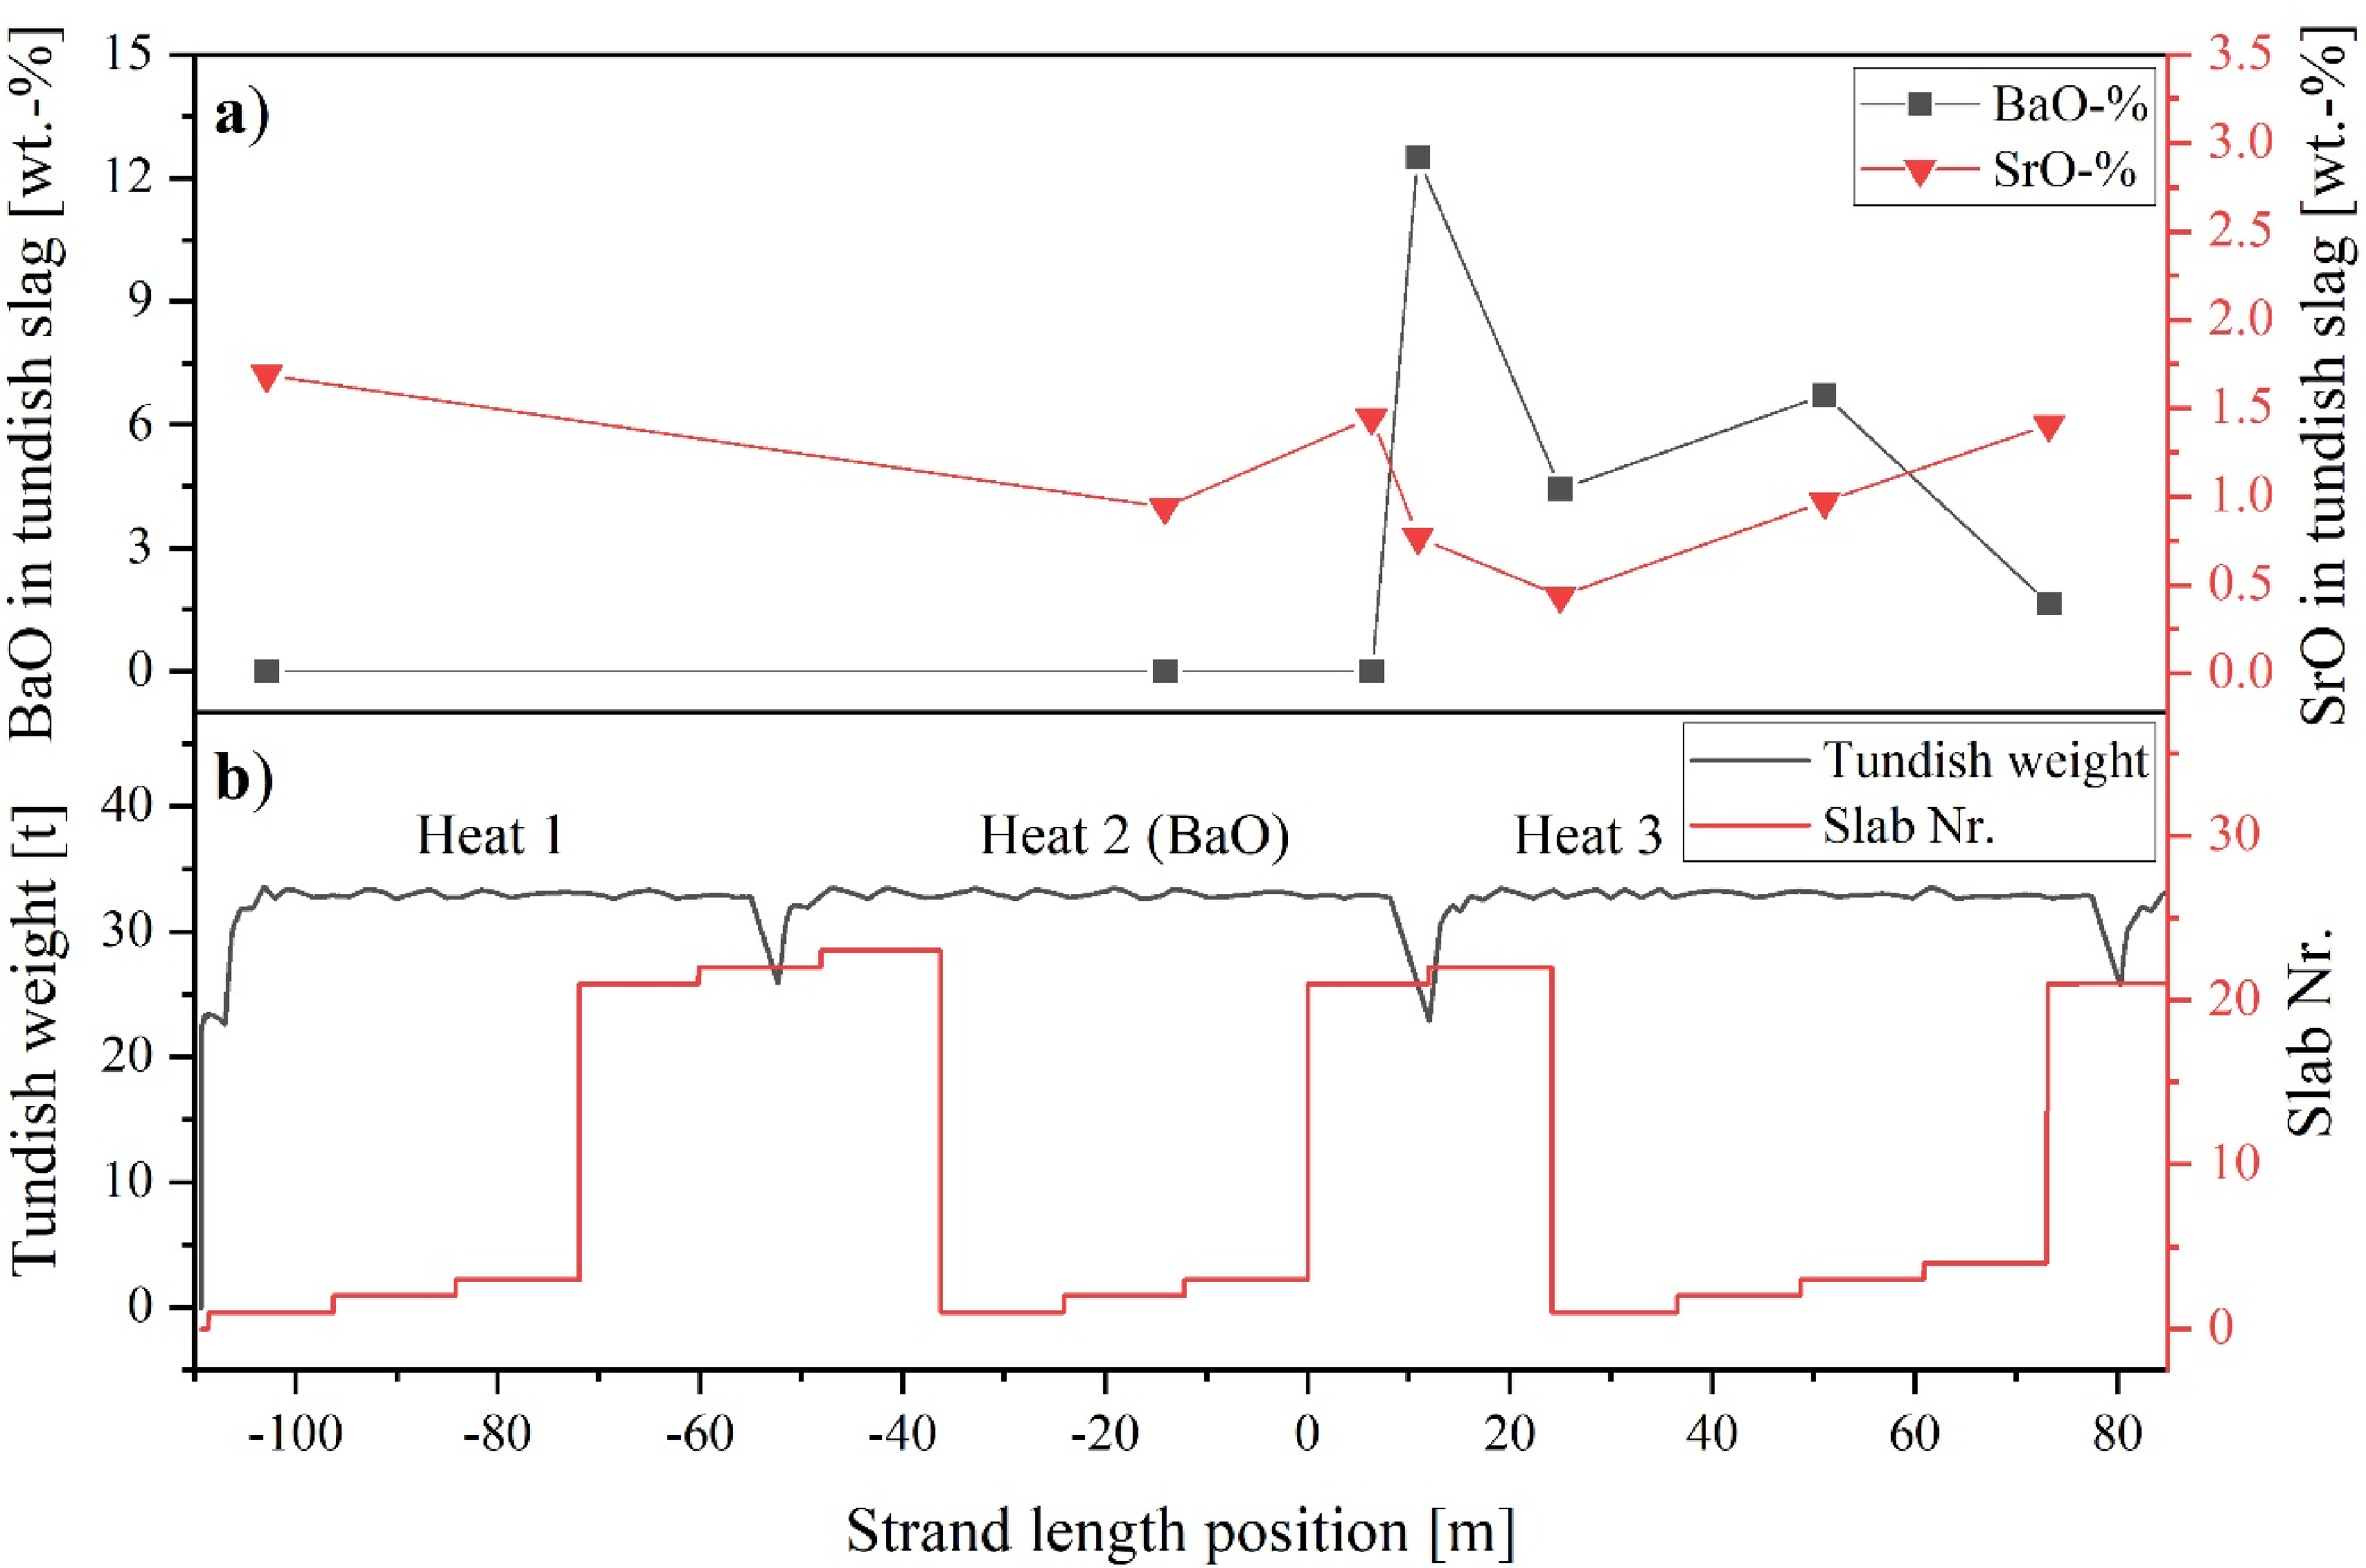
(a) Change of BaO and SrO content within the tundish slag during the casting process; (b) Corresponding trend of the tundish weight and strand position.
Chemical composition of a tundish slag sample taken after the start of casting of Heat 1 in wt-%.
In addition to the ladle and tundish slag, the mould slag was also sampled in the 20th and 40th minutes of casting from each respective heat. BaO and SrO were also below the detection limit (<0.1 wt-%) within these mould slag samples.
Cleanness evaluation of lollipop samples
The results of the automated SEM-EDS particle analysis of the steel samples of Heat 2 are displayed in Figure 8. The inclusion number per unit area shows a general downward trend between the first steel sample obtained after converter tapping (LF-1) and the tundish (CC-1). In all samples, the most dominant inclusion class (classified depending on their non-metallic bonding partner: O, S and N) was oxide–sulphides, followed by pure oxides and sulphides. In the oxide–sulphide class, the most common types are MA-spinel or Al2O3 combined with MnS. In oxides, the primary phases are MA-spinel or Al2O3, whereas in sulphide, it is mainly MnS.
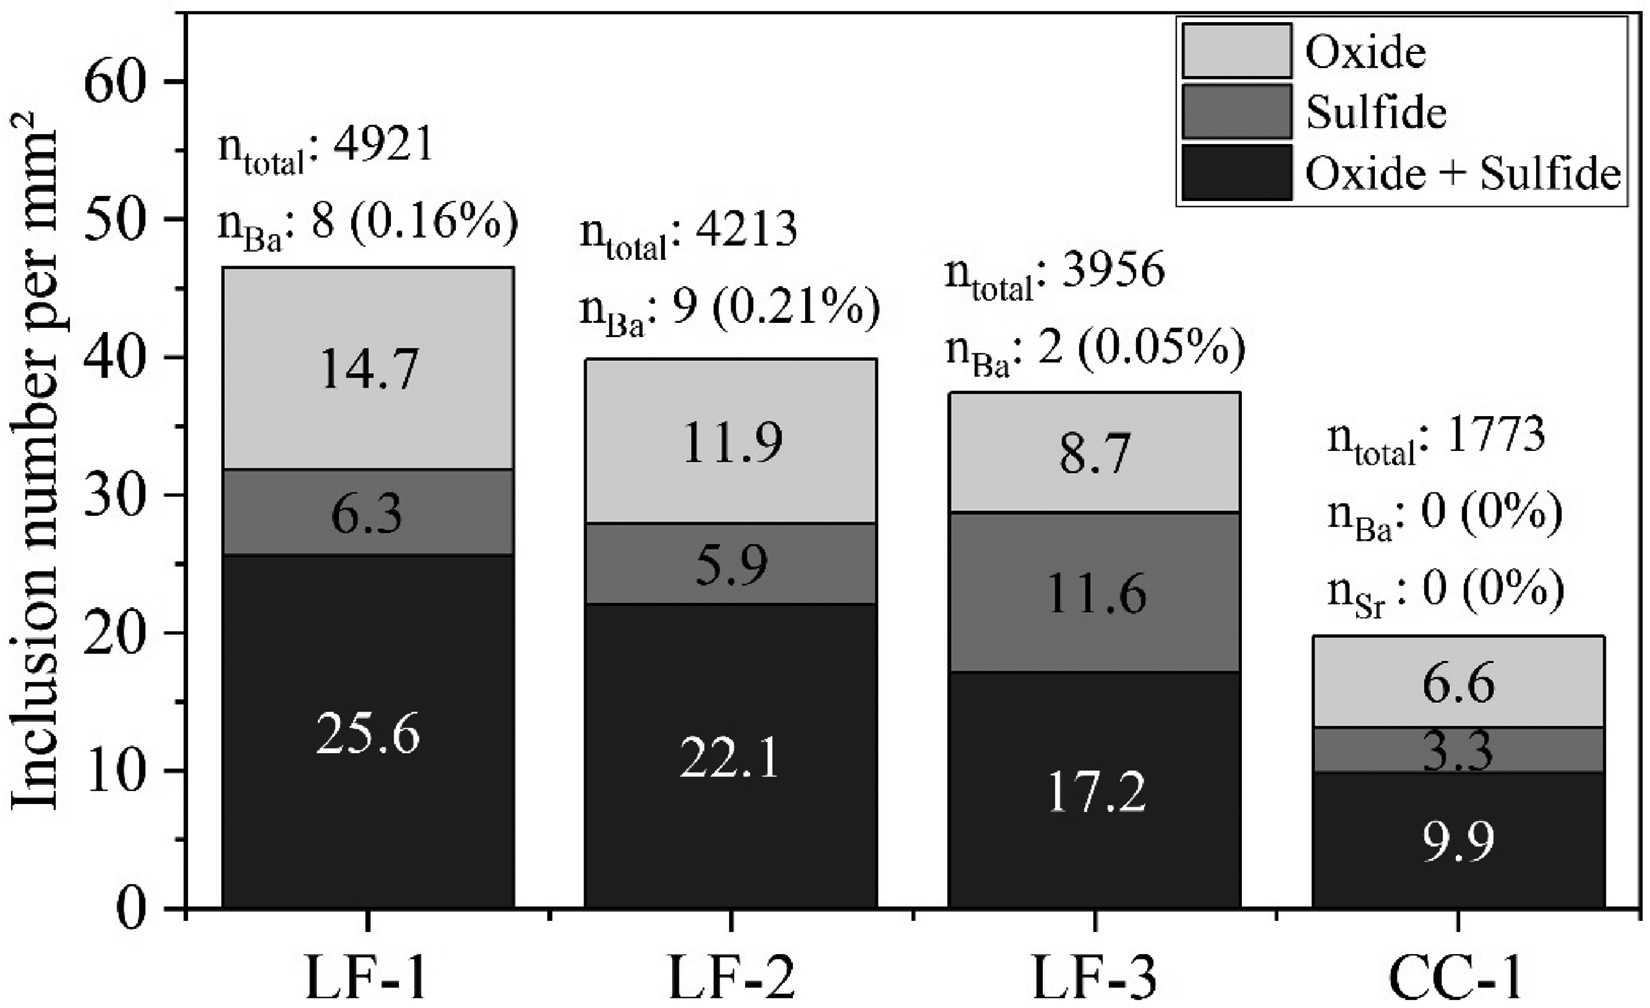
Automated SEM-EDS micro-cleanness evaluation of steel samples taken during LF treatment and from the tundish (Heat 2). The bar chart illustrates the number of NMIs per measured area (n/mm2). The total number of NMIs (ntotal) and Ba-/Sr-traced inclusions (nBa, nSr), along with their relative share (%), are annotated above each bar. Analysed area: 105.7 mm2 per sample.
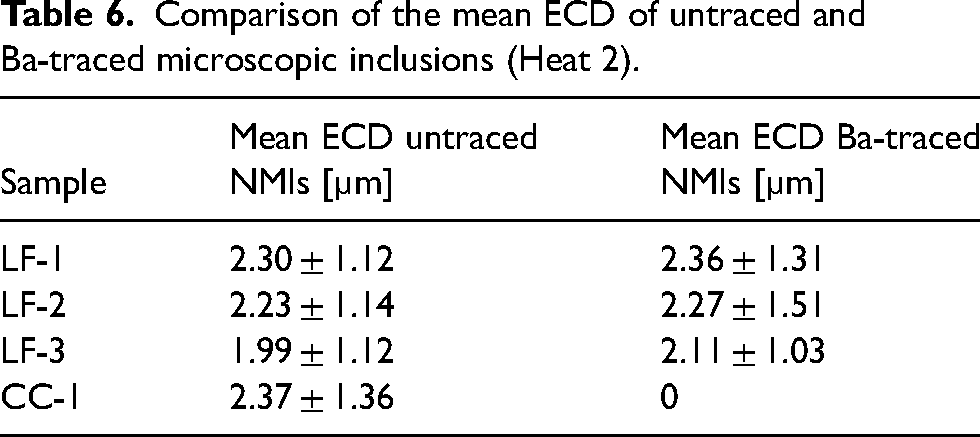
Ba and Sr were considered during particle analysis, as their oxides were used as slag tracers. The analysis of steel samples LF-1 to LF-3 showed that microscopic Ba-marked inclusions occurred only sporadically. Between 0.05% to 0.21% of the total inclusion population was marked with Ba during this stage of the process. In contrast, neither Ba nor Sr could be detected within the NMIs of the tundish sample. As shown in Table 6, the mean ECD of both untraced and Ba-traced inclusion populations are within a similar size range. Similarly to the untraced NMIs, the amount of traced particles decreased over process time.
Comparison of the mean ECD of untraced and Ba-traced microscopic inclusions (Heat 2).
The chemical composition of the Ba-marked micro-inclusions is located within the BaO-CaO-Al2O3–MgO system. Alongside the automated micro-cleanness evaluation, manual inspection via SEM-EDS was also performed. This inspection revealed single Ba-traced mesoscopic inclusions in samples LF-1 to LF-3, which exhibited a chemical composition similar to the traced micro-inclusions. An exemplary meso-NMI is also displayed in Figure 9.
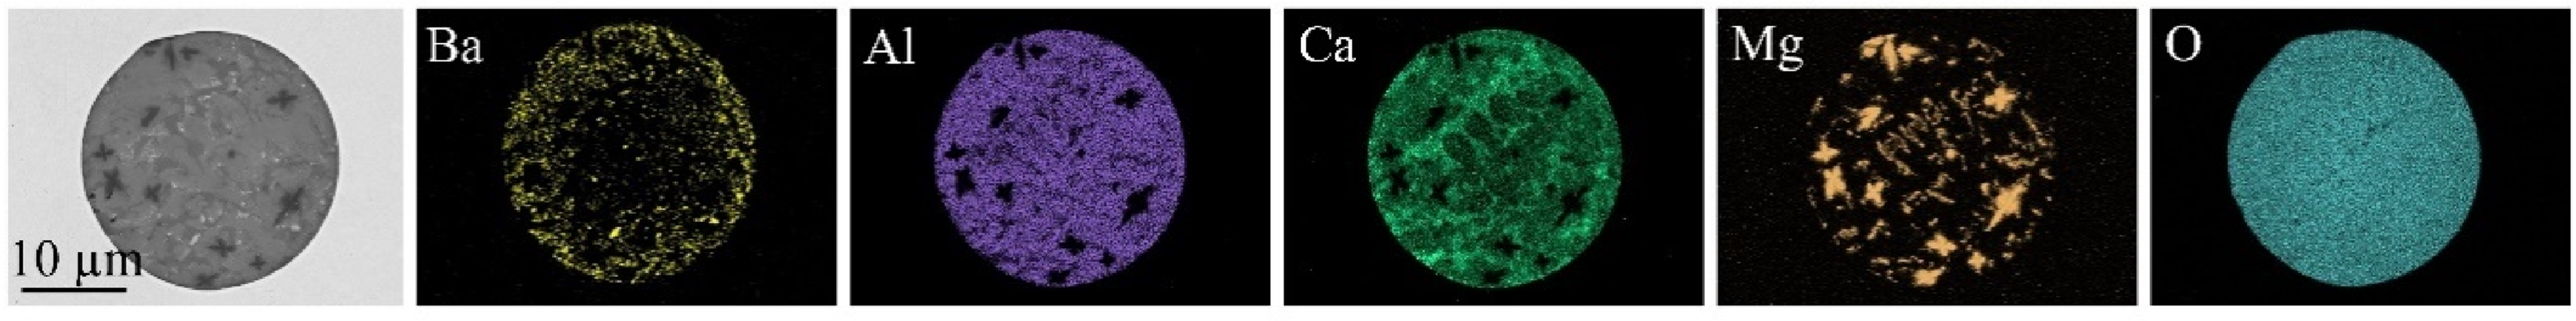
Exemplary Ba-traced NMI within lollipop sample (LF-2).
Meso- and macro-cleanness evaluation of sheet metal samples
The results of the X-ray radiographic examination of the sheet metal samples are presented in Figure 10. These samples were obtained from hot-rolled strips produced from material (slabs 21, 22 and 01) cast during the ladle change. The first vertical dotted line indicates the moment when the ladle slide gate of the second heat was closed, followed by a brief period when the tundish level was decreased (Figure 10(a)). The second dotted line marks the time when the steel weight within the tundish reached its minimum, and the slide gate of the third heat was opened. Thereafter, the tundish level was increased again to its designated value of approximately 32.5 tonnes.
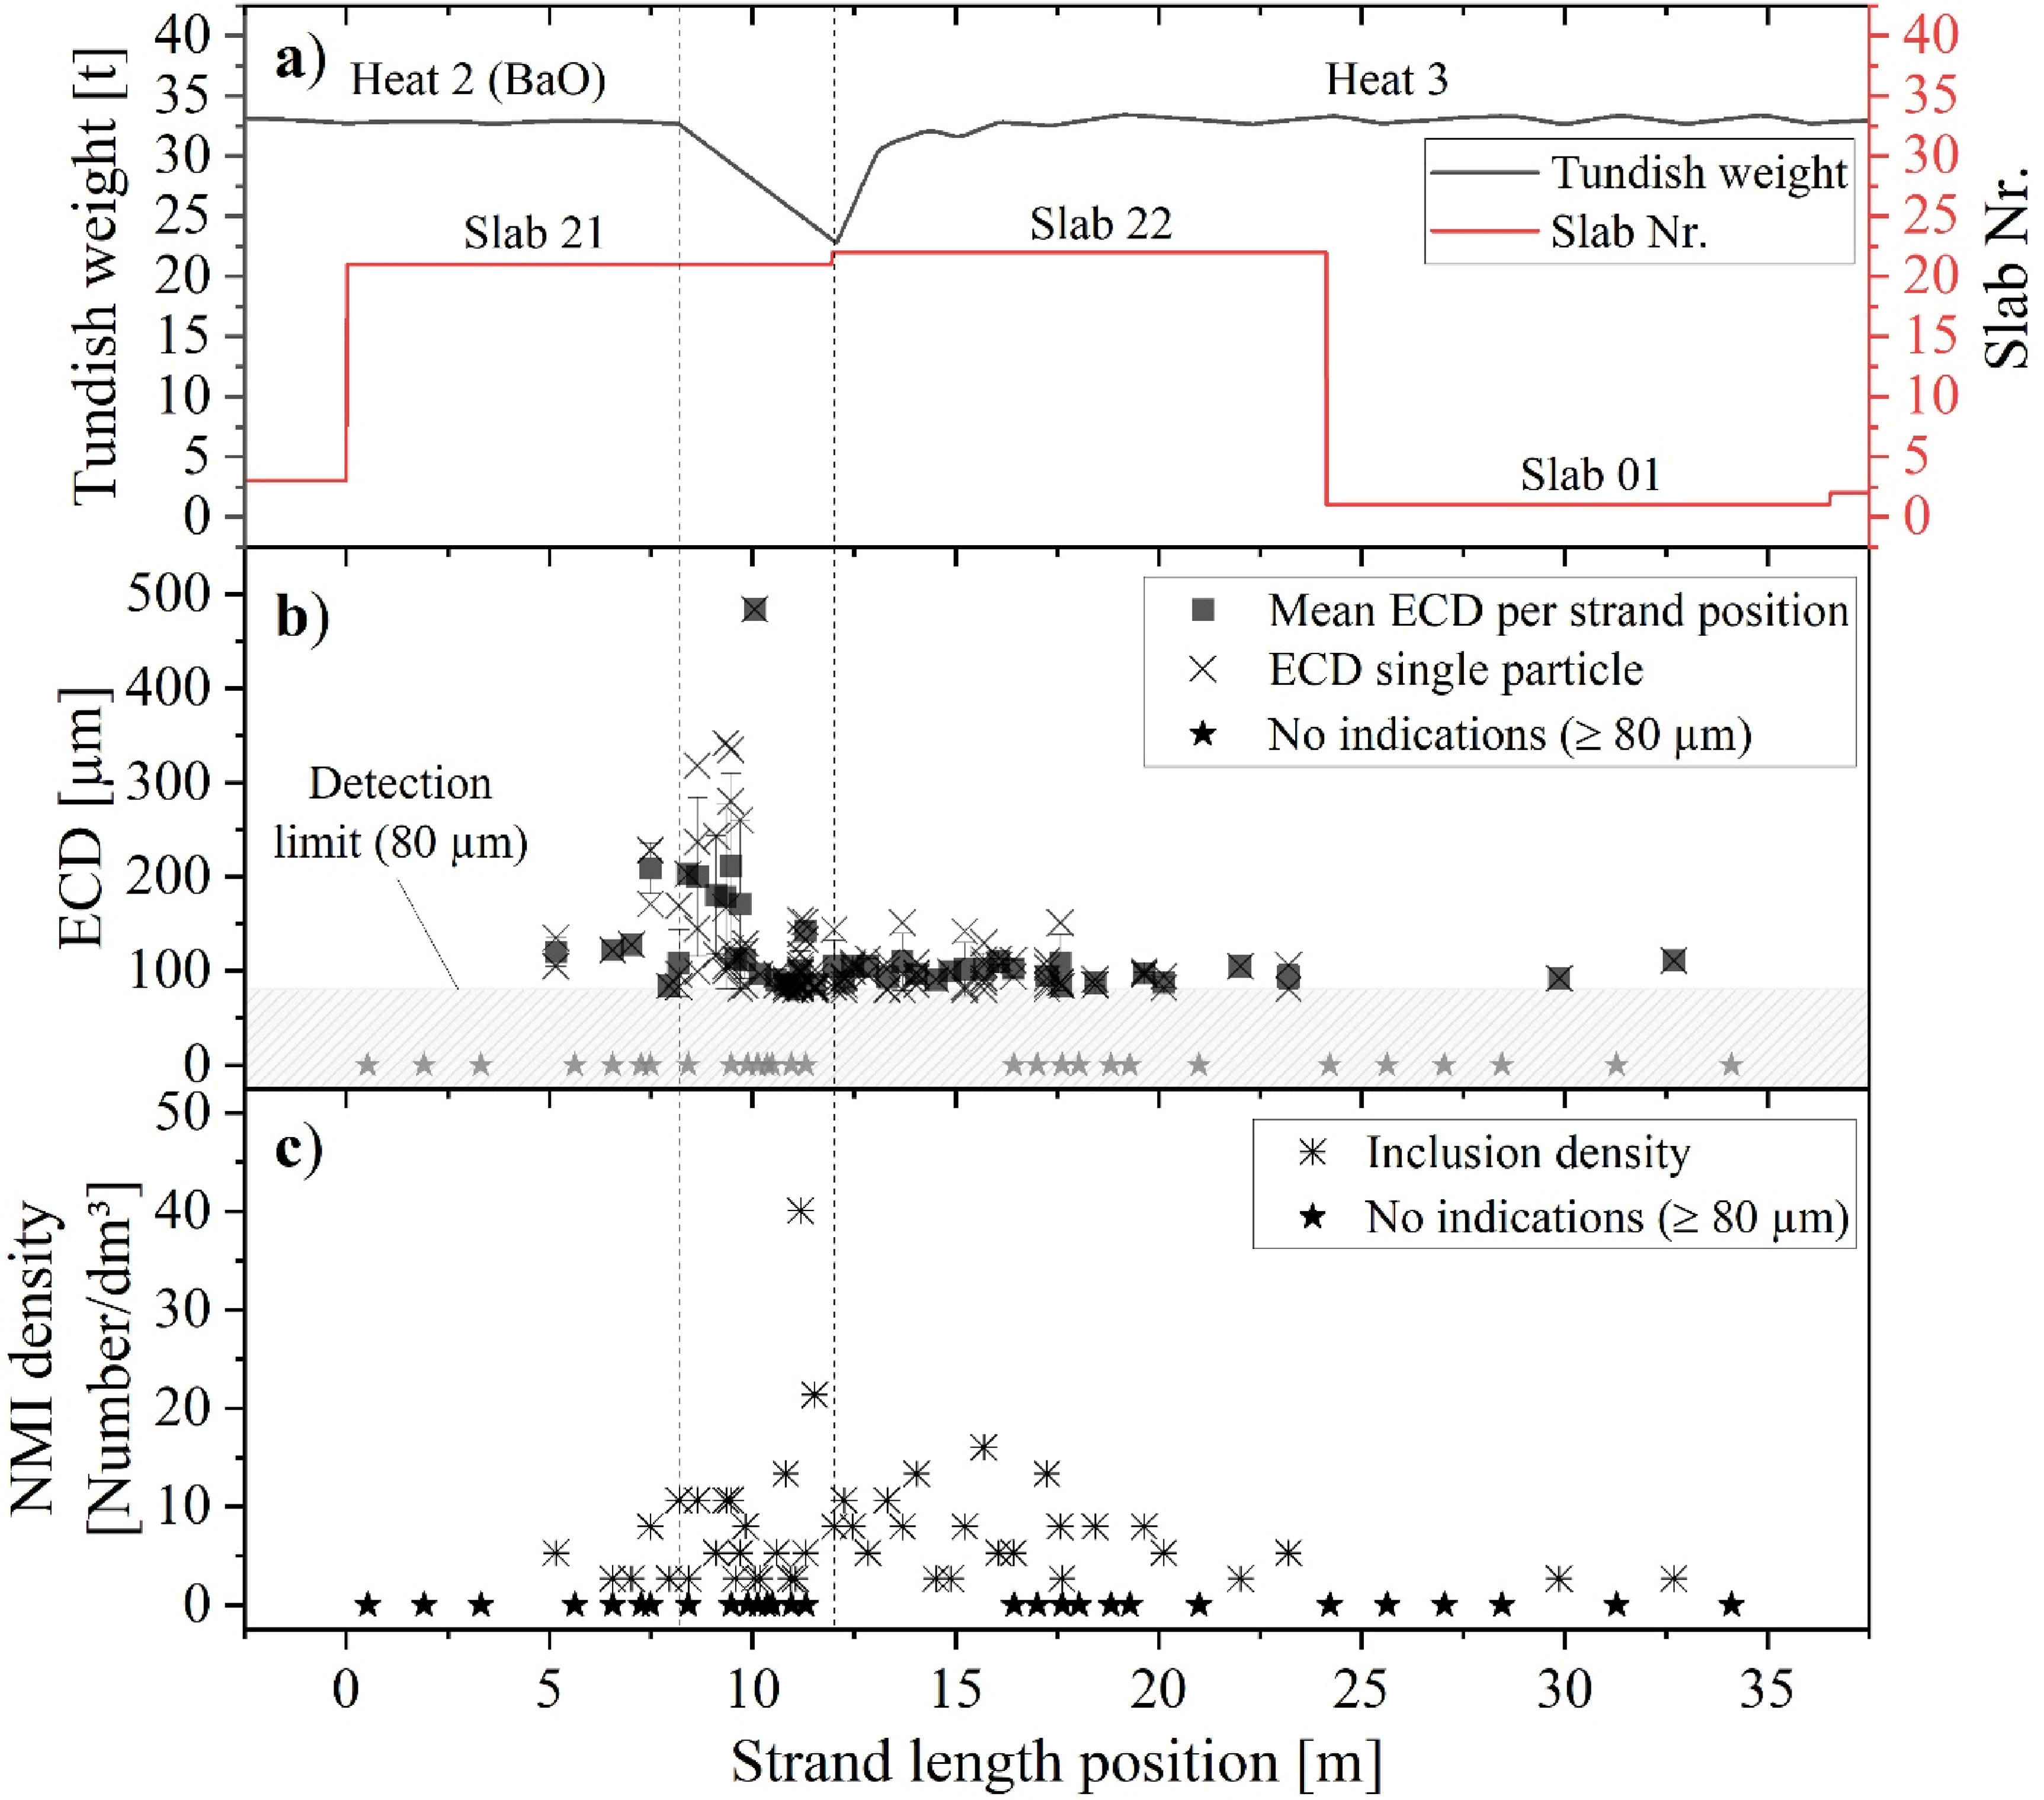
Evaluation of meso- and macro-cleanness in material cast during ladle change as a function of the strand length: (a) trend of the tundish weight; (b) NMI size distribution (≥80 µm); (c) distribution of NMI number per dm3.
During the initial series of measurements, sheet metal samples were examined at intervals of roughly one sample per 1.4 m of strand length. This was done to locate the section of the strand that had become contaminated due to the ladle change. In the second step, the measurement interval between the strand positions 5 to 25 m was adjusted to approximately one sample per 0.45 m. Finally, the interval between the strand position of 9.3 to 11.3 m was increased to one sample per 0.225 m. According to Figure 10(b), no NMIs with a minimum ECD of 80 µm were found in the samples taken from the strand position 0 to 5 m. The first particles were observed at position 5.16 m with a mean ECD of 120 µm. Over the next few metres, including the position where the slide gate of the second heat's ladle was closed (position: 8.22 m), the size and number of inclusions steadily increased (Figure 10(c)). The maximum ECD was recorded at 10.06 m with a value of 484 µm. Thereafter, the mean size decreased rapidly to a value of 90 µm (position 10.56 m) before increasing again to a local maximum of 143 µm at the strand position of 11.30 m. Concurrently, the number of inclusions increased to a maximum and reached a value of 40.1 indications per dm3 at 11.18 m. Between the strand position where the ladle slide gate was opened (12.03 m) and the position at 23.2 m, the mean ECD remained relatively constant at approximately 98 ± 17 µm. Two single inclusions with a size of 92 and 111 µm were found in sheet metal samples originating from slab 01 at an equivalent strand position of 29.87 and 32.69 m. After conducting radiography tests, 30 NMIs were selected for further investigation. Subsequent procedures involved extracting small samples from the locations within the sheet metal where the NMIs were identified by radiography. These samples were then cut and polished at the precise locations of the particles. The cross-section area of the NMIs exposed by this process was characterised by SEM-EDS to study their morphology and chemical compositions. The preparations were carried out on particles of various sizes and positions to ensure a comprehensive analysis.
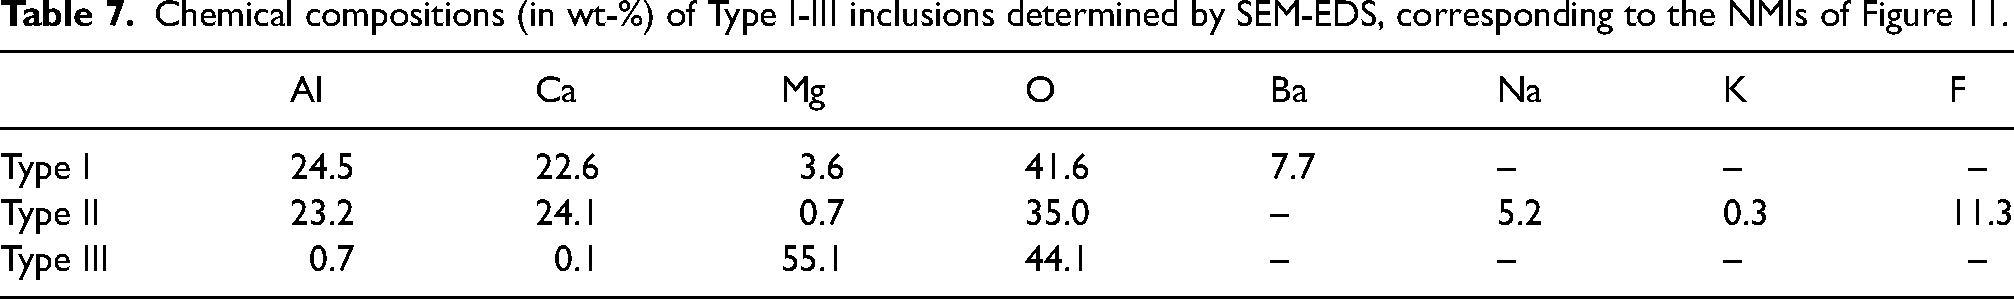
These 30 inclusions could be classified into three main types: Type I, II and III. Figure 11 illustrates a representative NMI for each type, with the corresponding chemical compositions of these NMIs described in Table 7. Type I inclusions mainly consist of calcium-aluminate and MgO with 3–8 wt-% Ba. Type II inclusions are composed of CaO-Al2O3 along with small quantities of MgO, Na, traces of K and F. Type III is composed of pure MgO. However, agglomerated microscopic alumina-based NMIs are visible on the left side of the MgO particle in Figure 11.
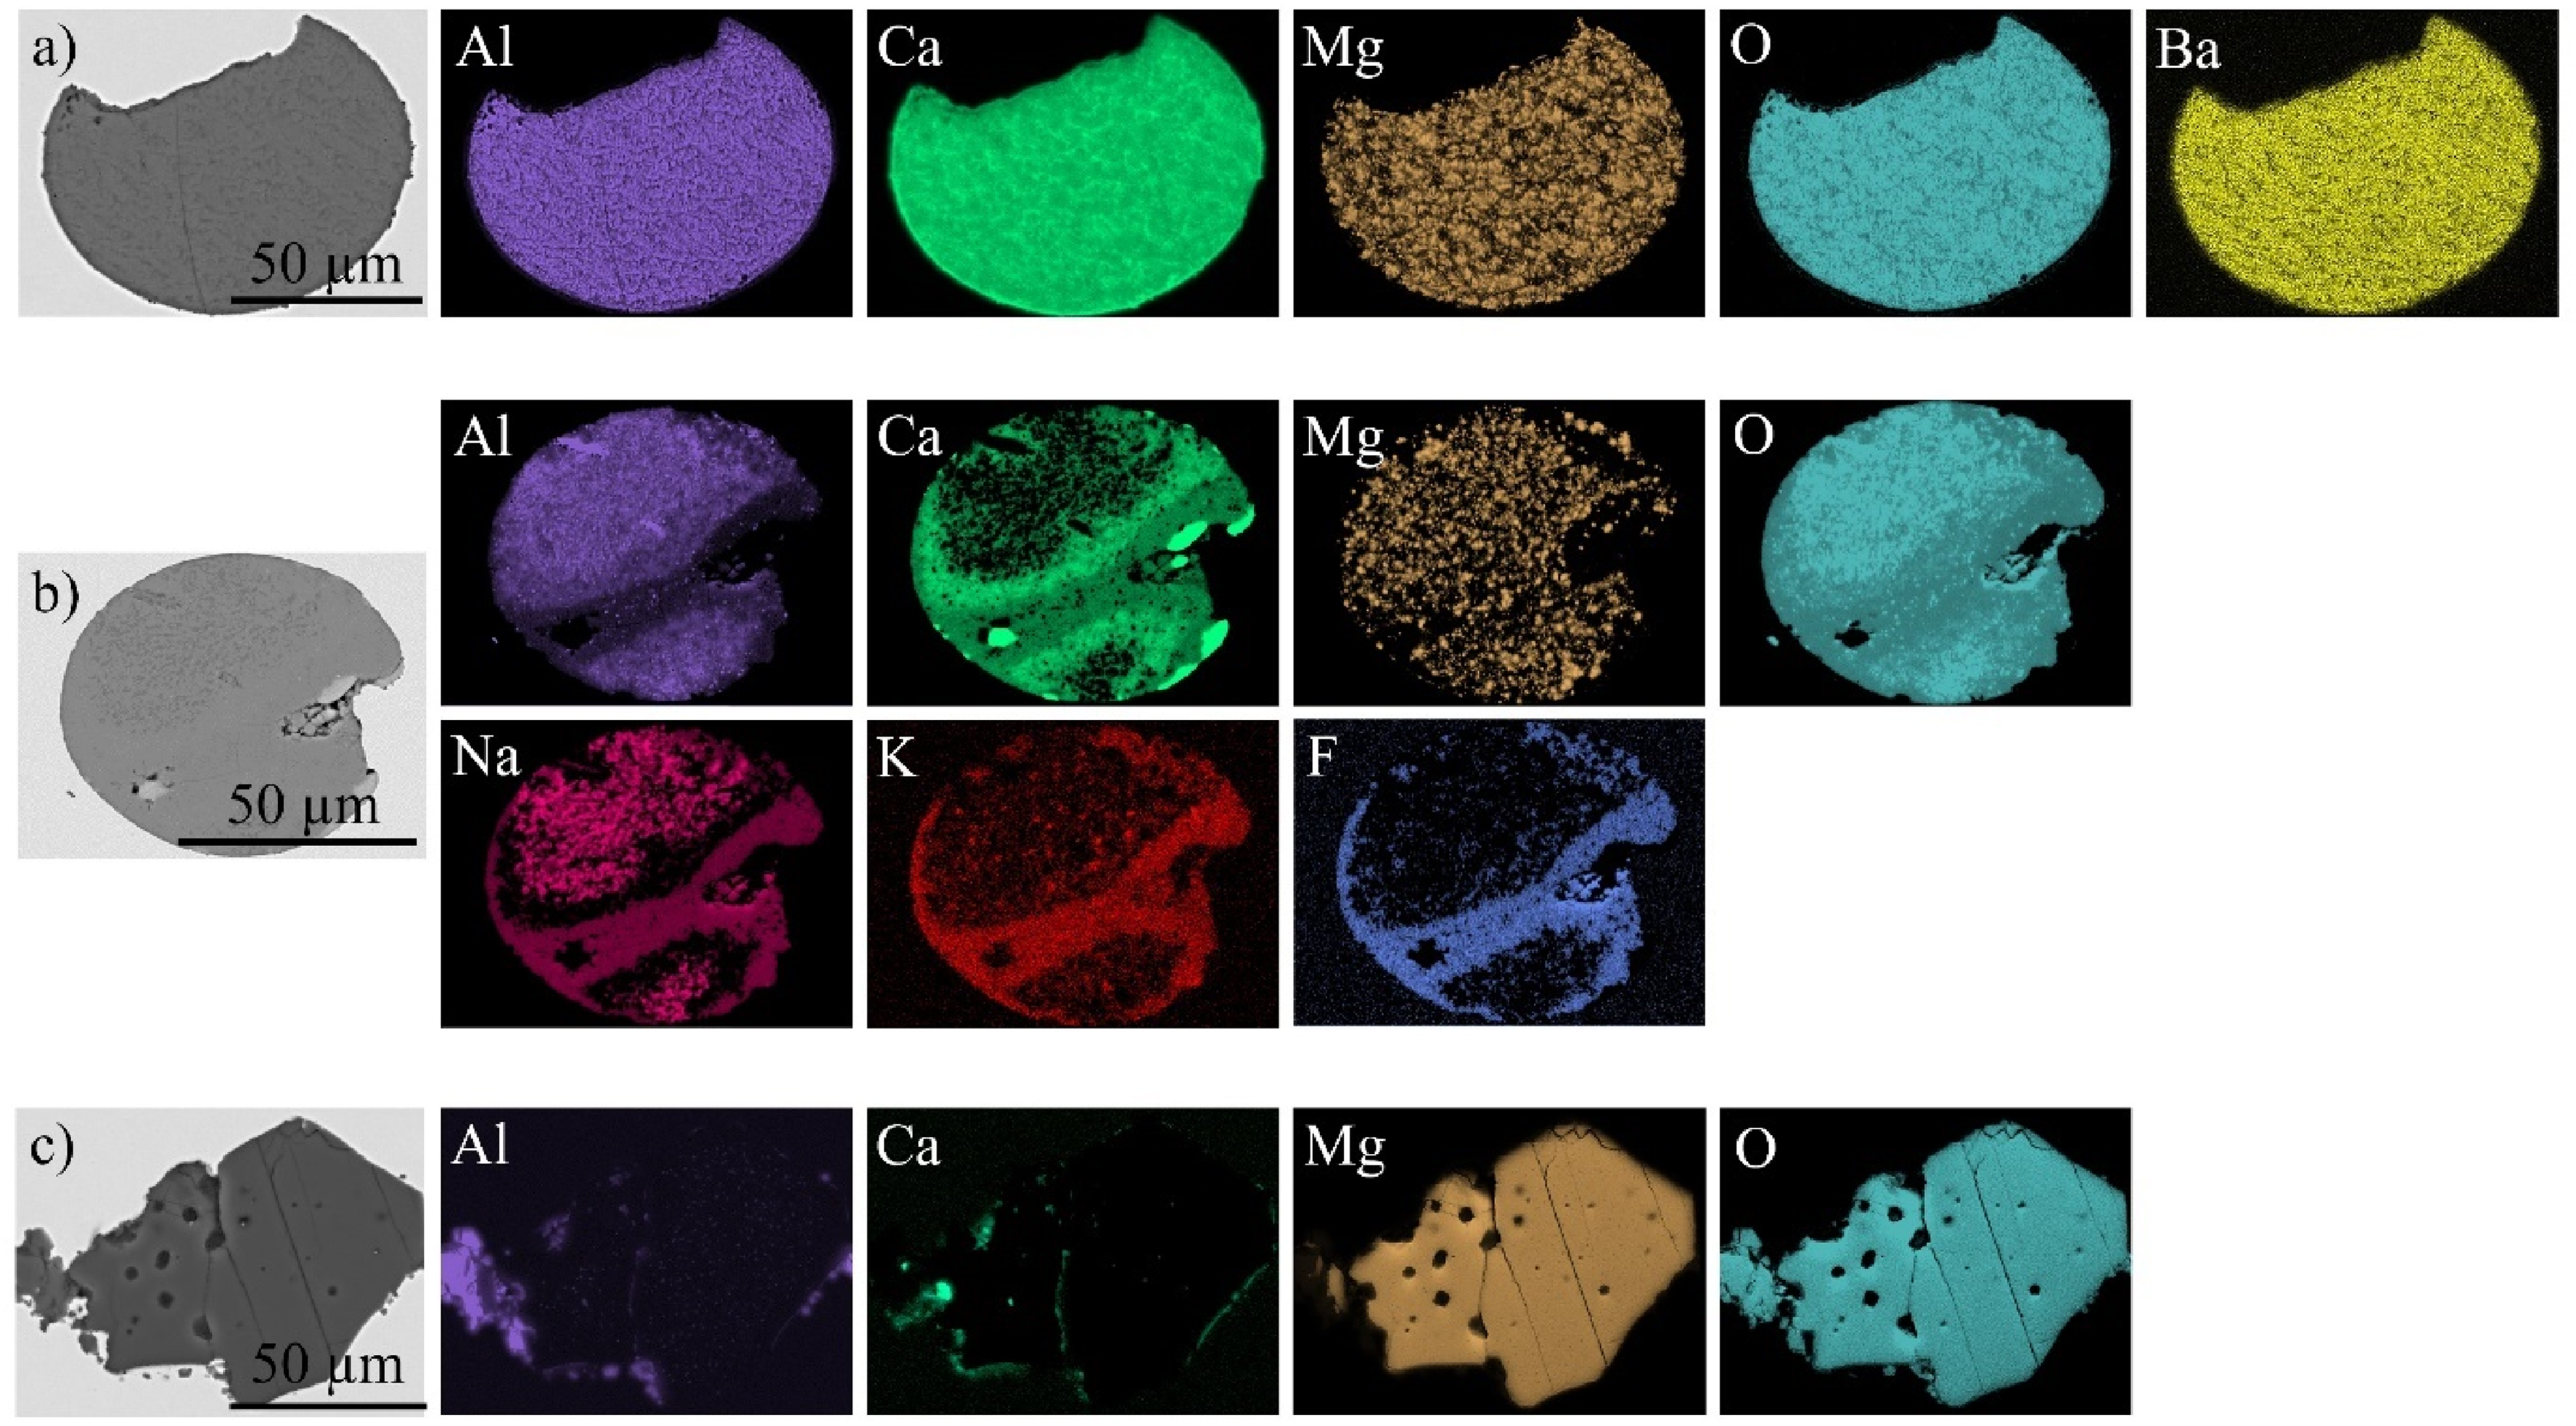
BSE-images and elemental mappings of representative NMIs for each main type, identified by radiography: (a) Type I: calcium-aluminate, MgO and Ba; (b) Type II: CaO-Al2O3 with MgO, Na, K and F; and (c) Type III: Pure MgO.
Chemical compositions (in wt-%) of Type I-III inclusions determined by SEM-EDS, corresponding to the NMIs of Figure 11.
Out of the 30 inclusions that were investigated, 13 are NMIs of Type I, 13 are of Type II and 4 are of Type III. Figure 12 provides a visual representation of the distribution of these three types of NMIs along the casted strand. Type I NMIs were found between the strand length position of 5.16 to 11.54 m, with their size varying from 80 to 335 µm. Their occurrence within the strand is highlighted in red for easy identification. Type II NMIs, which have the largest size variation among the inclusion types, were identified between 6.56 and 32.69 m, with sizes ranging from 84 to 484 µm. This type includes the largest inclusion identified in this study and occurs across the majority of the examined strand section (highlighted in blue). NMIs of Type III were exclusively found in the strand section from 12.01 to 13.31 m, with sizes between 80 and 144 µm. The occurrence of these particles is marked in green. During SEM-EDS investigation, the position of NMIs across the thickness of the sheet metal sample was also determined. This position was independent of the inclusion type and was determined to be 0.71 ± 0.09 mm, measured from the top surface (inner arc surface from the slab) of the sheet metal.
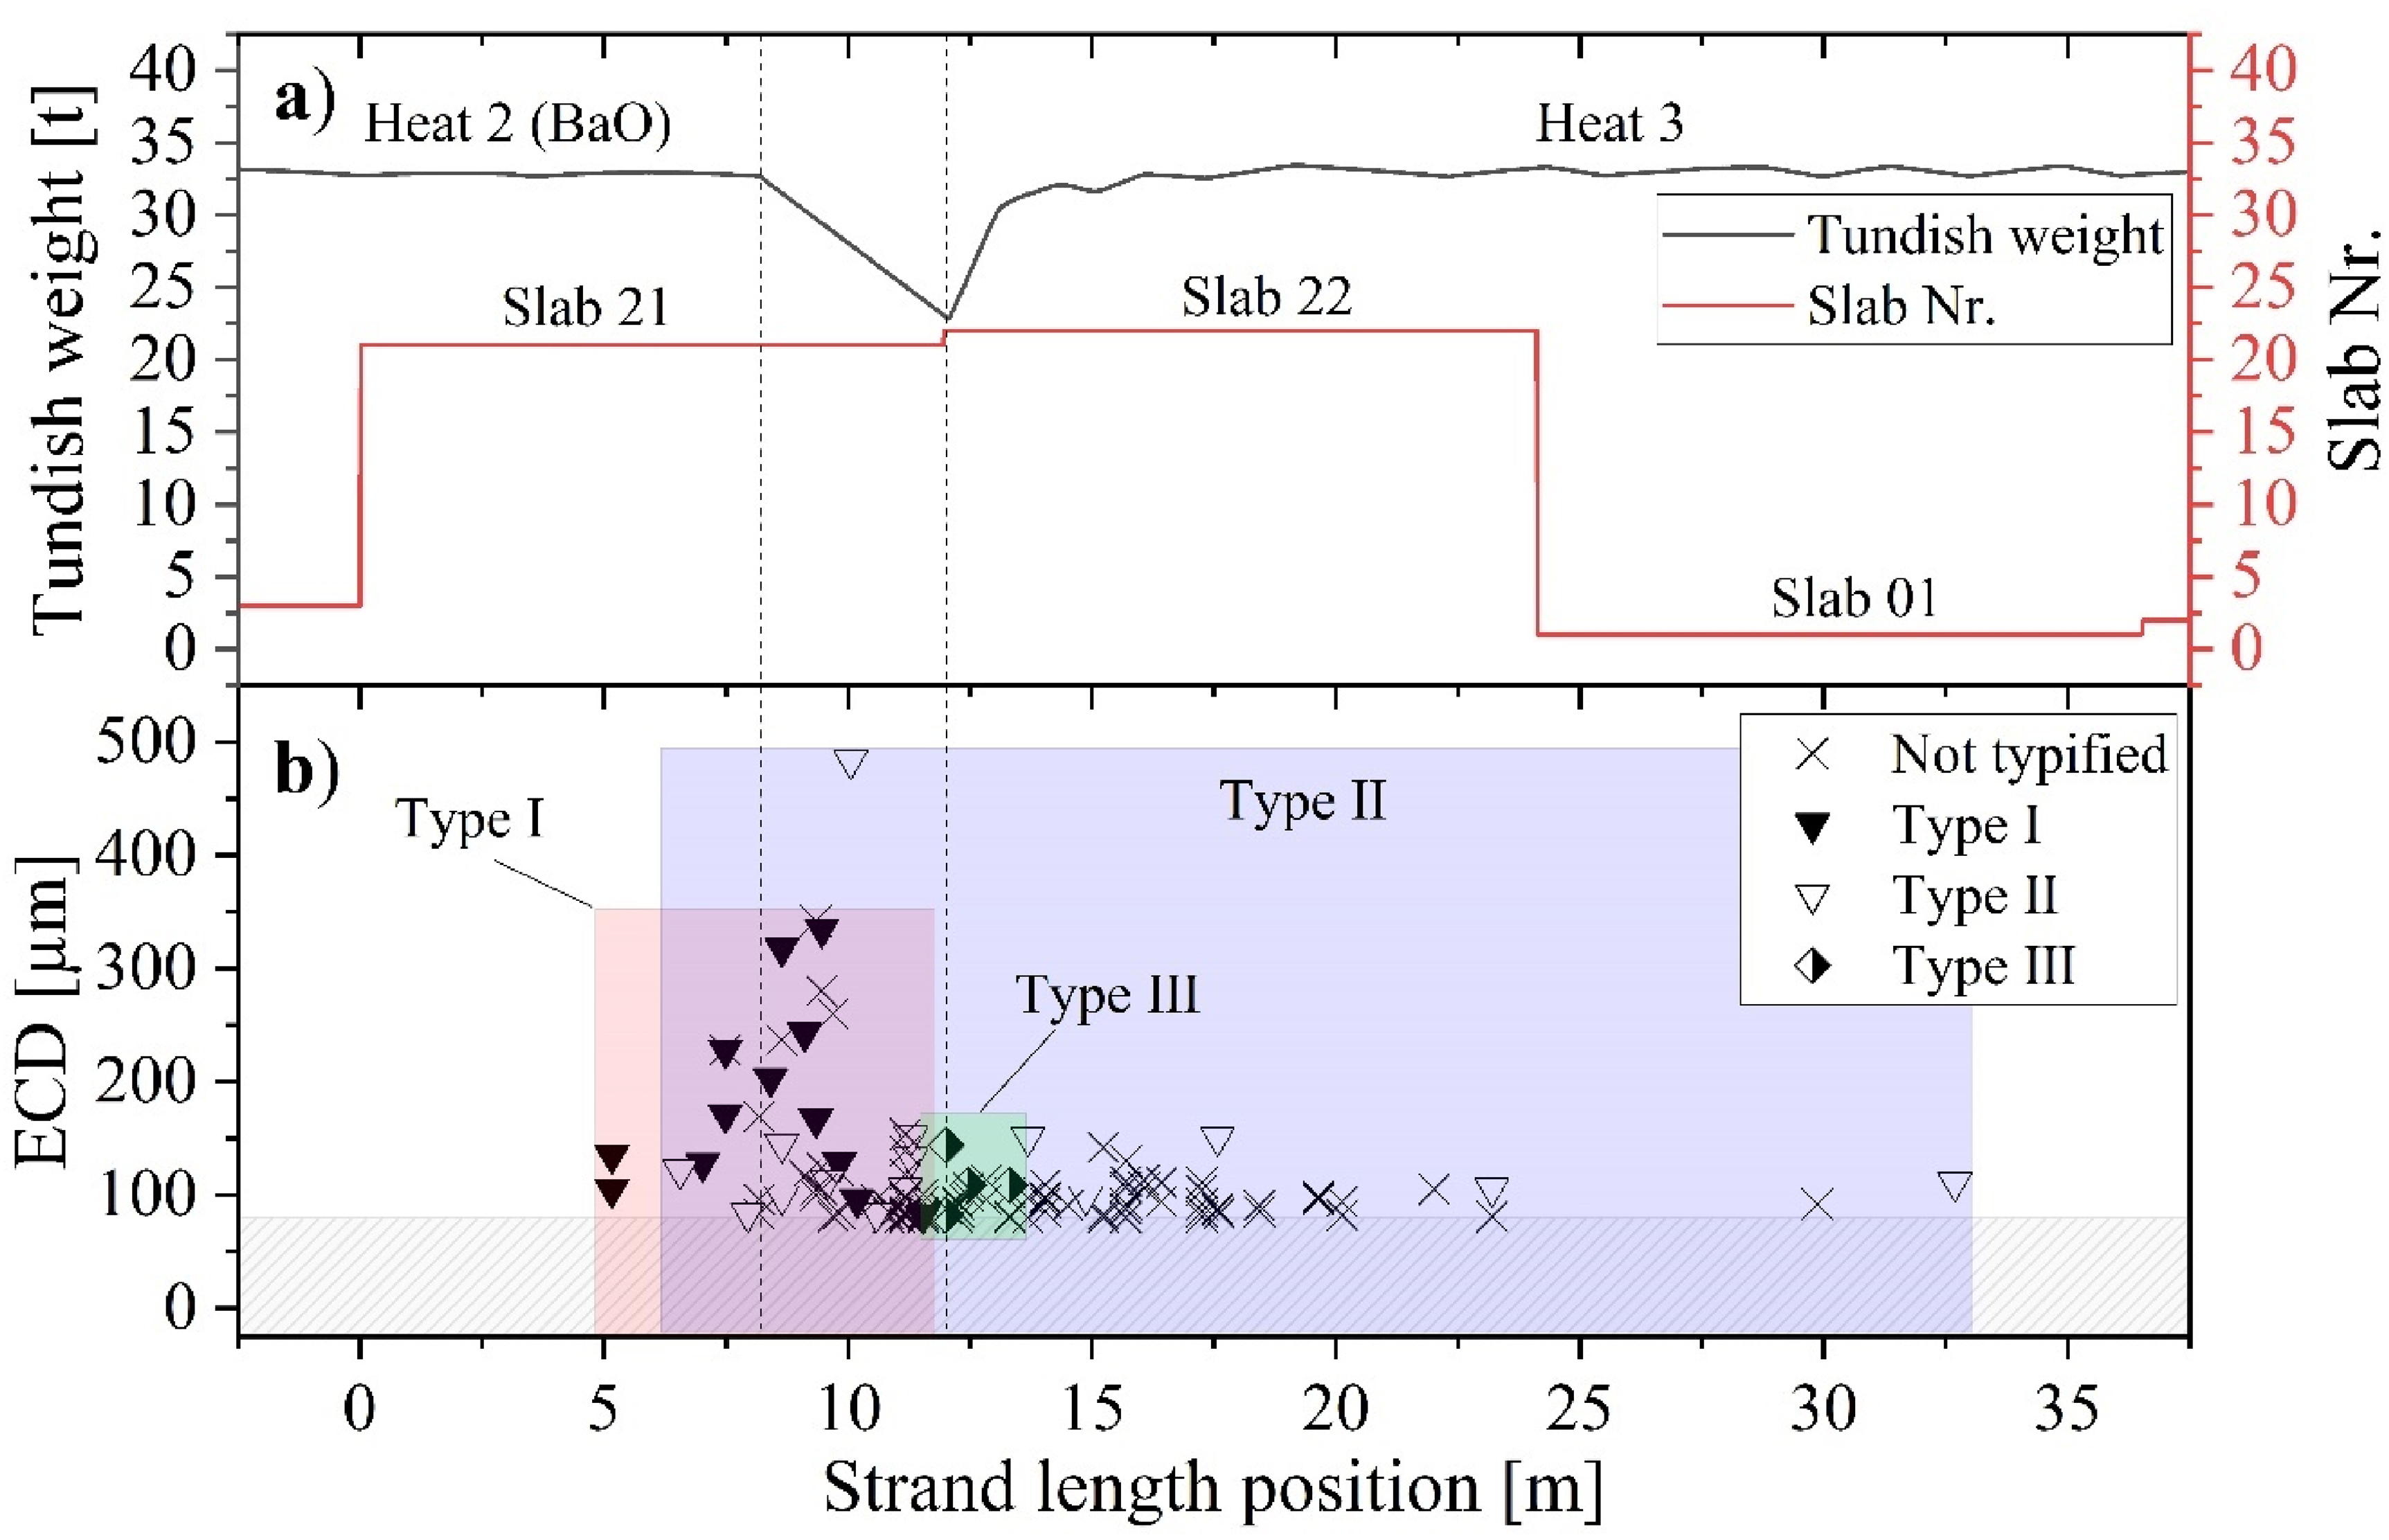
Distribution of Type I–III inclusions as a function of the investigated strand length: (a) trend of tundish weight during casting; (b) size distribution of inclusions ≥ 80 μm, categorised by inclusion type.
Discussion
Steel and slag samples
To ensure that the marking of the process slags with alkaline earth oxides was successful, they were analysed for their composition. Two samples are available for evaluating the BaO-marking of the ladle slag. The first sampling occurred after the initial melting of the slag mixture at the LF, where a BaO content of 16.1 wt-% was detected. The second ladle slag sample was taken at the end of the LF treatment, thus representing the final slag composition for this tracer experiment, showing a BaO content of 9.3 wt-%. The final composition, with a slight deviation, matches the targeted content. To verify the successful marking of the tundish slag with SrO, the tundish slag was also sampled over process time. At the beginning of the casting operation, the SrO content in the tundish slag was measured to be a maximum of 1.7 wt-%, as shown in Figure 7. Thereafter, the SrO content fluctuates between 0.4 and 1.4 wt-% (mean value approx. 1 wt-%). Furthermore, a significant amount of SiO2 and MgO was measured in the tundish slag, indicating a dilution of the initial Sr-traced calcium aluminate slag layer by a SiO2, originating from the upper slag layer (rice hull ash), but also by MgO supplied by the tundish refractory. This pick-up of SiO2/MgO in calcium aluminate-based tundish slags is described in the work of Kim et al.. 58 who reported similar phenomena in the context of increased reoxidation potential caused by the SiO2/MgO-enriched tundish slags.
Additionally, a proportion of this silica may have been introduced during the manual sampling procedure, as efforts were made to collect only the liquid slag film at the steel-slag interface, which could have been contaminated by the overlying rice hull ash when extracting the molten sample. This is further supported by the high variation in the SiO2 content, ranging between 20.7 wt-% and 49.6 wt-%, indicating that the sampling process impacted the observed fluctuations. Another factor contributing to the SrO variation may be the tracer addition in the empty tundish itself. Since SrCO₃ was manually distributed in buckets on top of the tundish slag formers, the turbulence at the beginning of casting might not have been enough for complete homogenisation. Nevertheless, tracing the slag layer in contact with the steel was successful, as SrO was consistently detectable in all tundish slag samples.
During the period when the tundish level was decreased due to the ladle change operation between the second to the third heat, a significant increase in BaO content within the tundish slag was observed. This rise can be attributed to the carry-over of ladle slag into the tundish, which had been marked with BaO. An inductive slag detection system was employed to minimise yield loss of steel due to premature closure of the ladle slide gate. This intervention plays a crucial role in preventing steel contamination by inhibiting entrapment of ladle slag, which can occur through both vortexing and non-vortexing funnel formations within the draining ladle. 59 Nevertheless, the system is activated only if the secondary coil detects voltage changes exceeding a specific, predefined threshold, indicating the presence of slag. Consequently, this leads to the entrainment of some slag before the slide gate automatically closes.
Steel samples taken from both the ladle and tundish were also investigated for their chemical composition. These samples were analysed by OES and additionally by XRF to determine the concentration of alkaline earth metals. Both Ba and Sr were found to be below the detection limit of the XRF analysis, which is less than 10 ppm. This finding suggests that the transfer of Ba or Sr from the slag into the steel was negligible. A similar conclusion was drawn by Song et al., 44 who also utilised Ba as a tracer in an industrial experiment. They attributed the minimal metal transfer to the low solubility of alkaline earth metals in steel. This is a crucial requirement for this tracer study, as soluble Ba or Sr may modify pre-existing deoxidation products and create an additional source of Ba- or Sr-containing inclusions aside from exogenous particles originating from the process slags.
Cleanness evaluation of lollipop samples
Selected lollipop steel samples from the Ba-traced second heat were analysed using automated SEM-EDS followed by manual inspection to verify that slag tracers did not alter pre-existing deoxidation products. A downward trend in total inclusion number per area was observed from secondary treatment to the tundish sample, indicating effective inclusion separation.
Ba-containing micro-inclusions (0.05–0.21% of total NMIs) and single meso- and macro-inclusions were detected in LF samples, all indicating a ladle slag origin. These NMIs were absent in tundish samples. This contrast is attributed to the different sampling techniques: slag entrainment is more likely with metal-cap samplers used at the LF, while Ar-protected tundish sampling significantly reduces such contamination. This aligns well with the investigation of Ericsson et al., 60 who studied the influence of these sampling techniques on slag entrapment in detail. Based on these findings, it is evident that using BaO and SrO as slag tracers did not change the pre-existing inclusion population.
Meso- and macro-cleanness evaluation of sheet metal samples
X-ray radiography was used to characterise meso- and macro-inclusions within sheet metal samples. The position of these particles within the sheet sample was back-projected to their initial location within the casting strand. This examination focused on detecting NMIs with a minimum size of 80 µm and above.
As depicted in Figures 10 and 12, no NMIs exceeding that size threshold were detected within the first 5 m of the strand. However, after the strand position of 5.16 m a significant increase in the average number and size of NMIs is measured. This marks the initial section where cleanness is deteriorated by the ladle change event. Following this, when the liquid steel level in the tundish decreases during casting, the size and quantity of inclusions reach their maximum. Once the slide gate of the new ladle was opened at 12.03 m, the cleanness level returned to its standard level after approximately 12.18 m (correlates to a strand position at 24.21 m). Therefore, it can be concluded that the ladle change event significantly impacts the meso- and macro-cleanness levels of the strand over a casting length of 19.05 m. The first inclusions in that size range were located in a corresponding strand section cast during the final stage of ladle draining approximately 2.4 min before the ladle slide gate of Heat 2 was closed.
The main inclusion type found in the first period of the ladle change was Type I, followed by Type II inclusions. Type I are calcium-aluminate-based inclusions traced by BaO, which indicates that these particles originate from the carry-over ladle slag.
Several indications confirm an entrapment of the BaO-traced ladle slag into the tundish, even though a ladle slag detection system was in use. Firstly, a significant increase in BaO content was observed at that time period within the tundish slag. Furthermore, the cleanness evaluations revealed that these particles may have been emitted from the draining ladle much earlier than expected. Since the first BaO-traced particles were found at a strand position of 5.16 m, and the electromagnetic slag sensor only recorded a localised signal peak at 8.22 m, premature slag entrainment likely occurred. As discussed by Sankaranarayanan et al. 59 and Zhou et al., 61 vortex formation can occur during the ladle's draining, potentially drawing ladle slag into the ladle nozzle. This slag may break apart into fine droplets as it travels through the nozzle and into the ladle shroud. Sensors may not reliably detect these droplets, as these devices often cannot identify slag flows that constitute less than 10–20% of the total flow. Consequently, these ladle slag particles can be carried over into the tundish before the threshold value for automated gate closure is reached. Various studies also highlight ladle slag as a significant source of exogenous inclusions, such as the work by Sahei. 62 Another study on this topic was conducted by Srivastava and Chattopadhyay, 63 focusing on whether and how these entrapped ladle slag particles can be separated into the tundish slag phase after being entrapped during the ladle draining procedure.
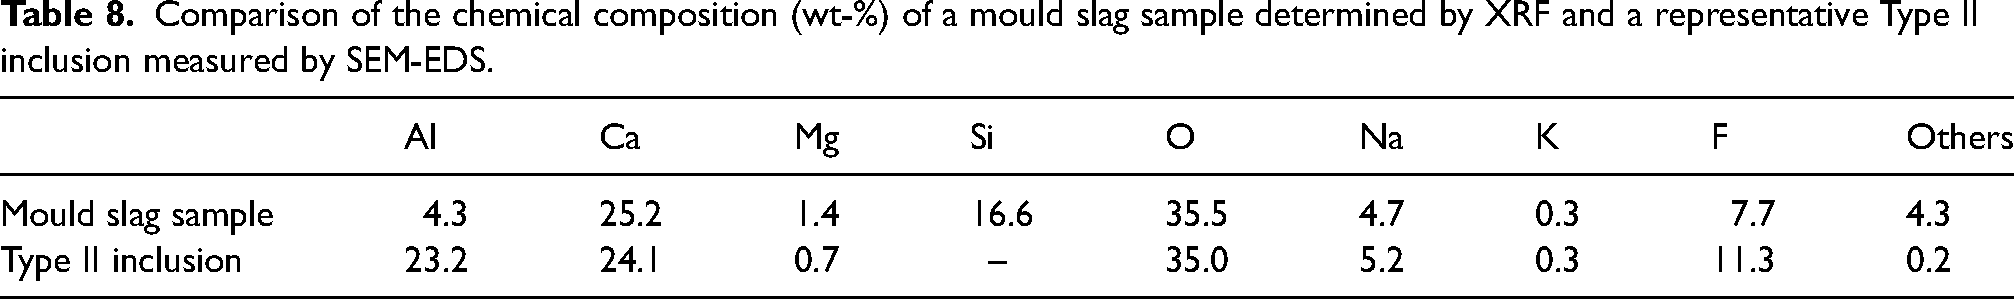
Another inclusion type located within the strand section cast during both the unsteady and steady casting conditions was Type II. These macroscopic particles are mainly composed of calcium aluminate and Na2O, K2O and CaF2. As described in the literature,31,64,65 the presence of the elements Na, K and F is strong evidence that these particles originate from the mould slag. The position of the mould slag particles across the thickness of the sheet metal sample varied between 0.70 ± 0.06 mm, measured from the top surface (initially the inner arc surface of the slab) of the sheet metal, which indicates that these NMIs originate from the inclusion band region of the casting product.
The chemical composition of a mould slag sample and a Type II inclusion are displayed in Table 8. When comparing the chemical composition of these two, it is noticeable that the slag has approximately 16.6 wt-% Si, while the Si content in the Type II inclusions is below the detection limit of the SEM-EDS measurement. Furthermore, the particles have a higher concentration of Al than the slag sample.
Comparison of the chemical composition (wt-%) of a mould slag sample determined by XRF and a representative Type II inclusion measured by SEM-EDS.
This observation suggests a significant chemical interaction between the entrapped mould slag and the liquid steel phase. The reduction of silica within the slag by Al in the molten steel is a well-known phenomenon. Studies on this topic are particularly prevalent in applying silica-containing casting powders in high-Al steels (like TRIP steels), where a decrease in SiO2 and an increase in Al2O3 is associated with undesirable changes in the properties of the molten flux. Notable investigations include those by Harmuth and Xia
66
and Wu et al.,
67
who attributed the increase in alumina and the decrease in silica within the mould slag mainly to the interfacial reaction shown in Equation 1: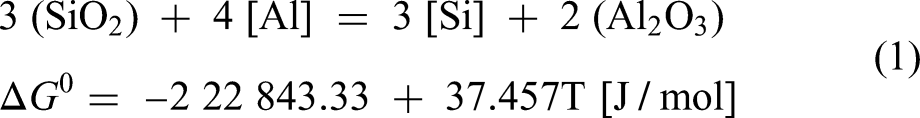
Calculations were performed using a simplified kinetic model to simulate the ongoing modification of an entrapped mould slag particle as it continuously reacts with the surrounding liquid steel phase. Two different mass transfer coefficients of the metal components were tested, representing the minimum and maximum values found in the literature. The study aimed to compare the chemical composition of the found Type II inclusion with the model predictions upon reaching equilibrium. Additionally, it assessed whether the reaction time required for the complete reduction of Si-containing phases like SiO2 is feasible, as this reaction between an entrapped slag particle and the liquid steel can only proceed for a maximum of a few minutes before the particle is captured by the solidification front.
For the calculations, the steel composition from the tundish lollipop sample of Heat 2 (Table 3) and the mould slag composition presented in Table 8 are used. The temperature is defined as 1823 K (1550°C). Figure 13 shows the results of the calculations using the literature values from the review by Park and Zhang, 56 where msteel was assumed to be 8 × 10⁻⁶ m/s, representing the lowest mass transfer coefficient found in the literature for a similar application.
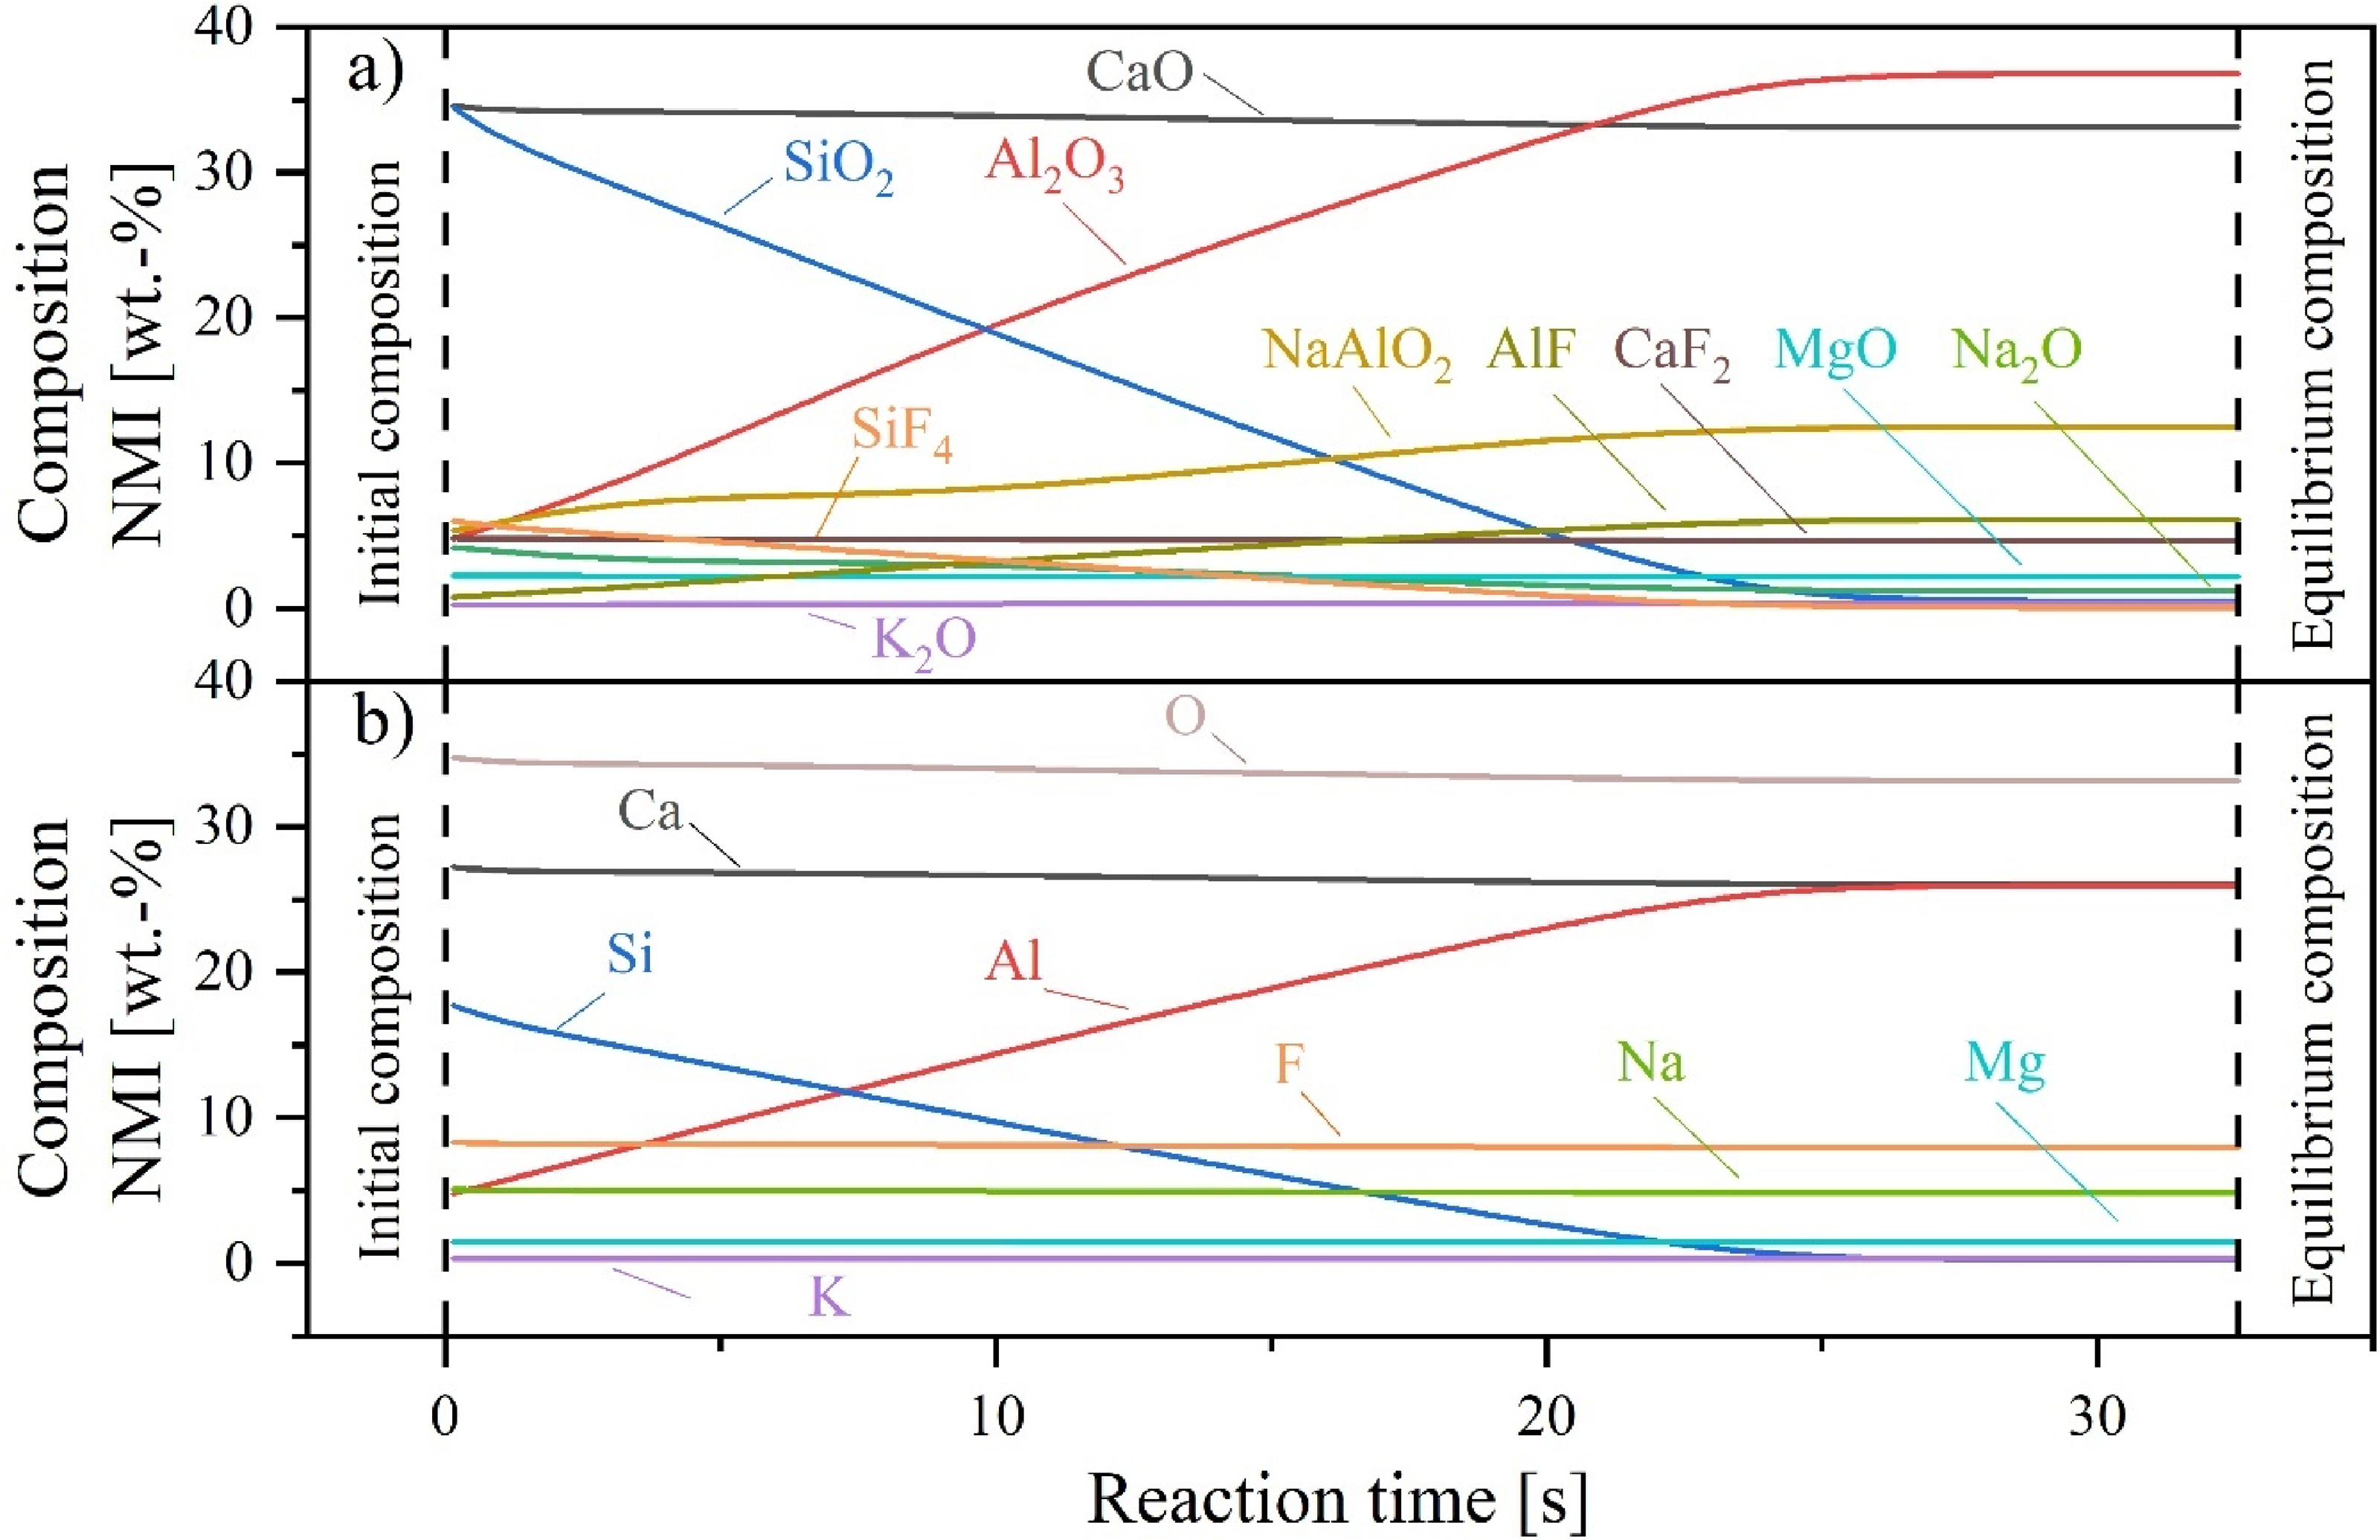
Transformation in the composition of an entrapped mould slag particle reacting with the Al-killed steel at 1500°C: (a) phase composition; (b) elemental composition; calculated using PyProSim.
As depicted in Figure 13(a), the model also predicts a pronounced reaction between Si-containing phases (SiO2 and SiF4) and the constantly supplied Al, leading to an increase in Al2O3 and AlF within the inclusion phase. An equilibrium composition is reached after approximately 30 s using these model parameters, with the Si content within the liquid inclusion phase being reduced from 16.6 wt-% to approximately 0.2 wt-% (Figure 13(b)). In contrast, when applying the literature values from Kang et al., 57 which represent the highest msteel in this context (1.2 × 10⁻⁴ m/s), the reaction equilibrium is achieved in approximately 20 s.
Nevertheless, as these inclusions were not trapped by the solidification shell near the meniscus but were most likely trapped in the inclusion band, the contact time with liquid steel is in the range of a few minutes. Therefore, the required reaction time for the reduction of Si-containing phases predicted by the simplified model is in the same order of magnitude as the possible contact time of these two phases in the liquid state.
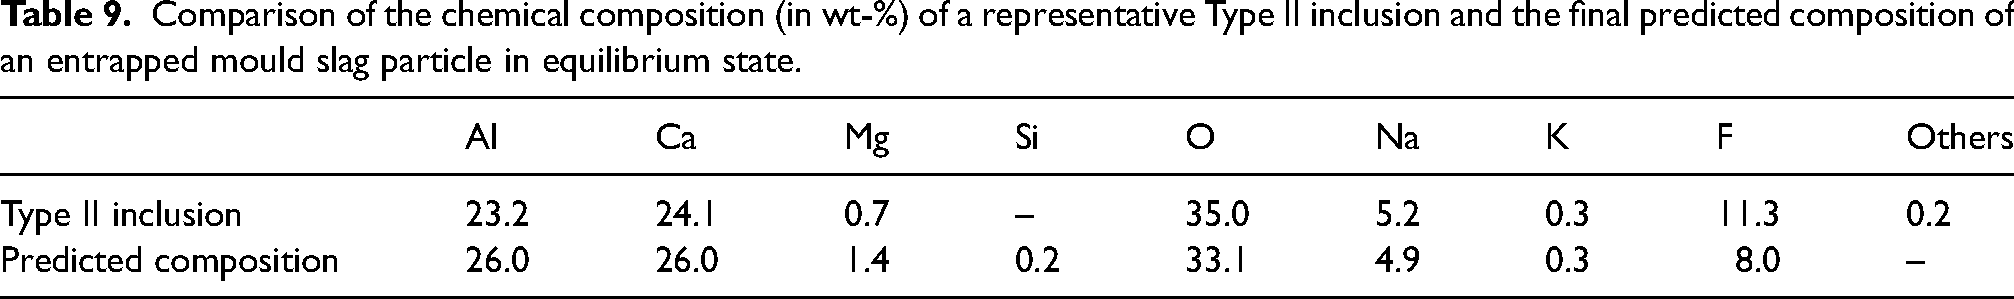
Additionally, the chemical composition of these Type II inclusions determined by SEM-EDS closely matches the calculated equilibrium composition of an entrapped mould slag particle (Table 9). This further supports the conclusion that these inclusions are indeed entrapped mould slag.
Comparison of the chemical composition (in wt-%) of a representative Type II inclusion and the final predicted composition of an entrapped mould slag particle in equilibrium state.
To investigate the factors contributing to mould slag entrapment, the process data were examined in detail. This includes the stopper rod position as an indicator for clogging (Figure 14(a)), casting speed and width (Figure 14(b)), and mould level fluctuations of the meniscus (Figure 14(c)). The relevant strand section, which was cast during the ladle change between Heat 2 and Heat 3, is shaded in grey (strand length position between 0 and 35 m). Recent publications that investigated the influence of ladle change on the macroscopic cleanness level on an industrial scale31,32,68 also identified mould slag as a significant source of inclusions. Deng et al. 68 found that these particles were entrapped during periods of severe fluctuations in mould level, likely due to the sudden detachment of clogging material from the stopper or within the submerged entry nozzle (SEN).
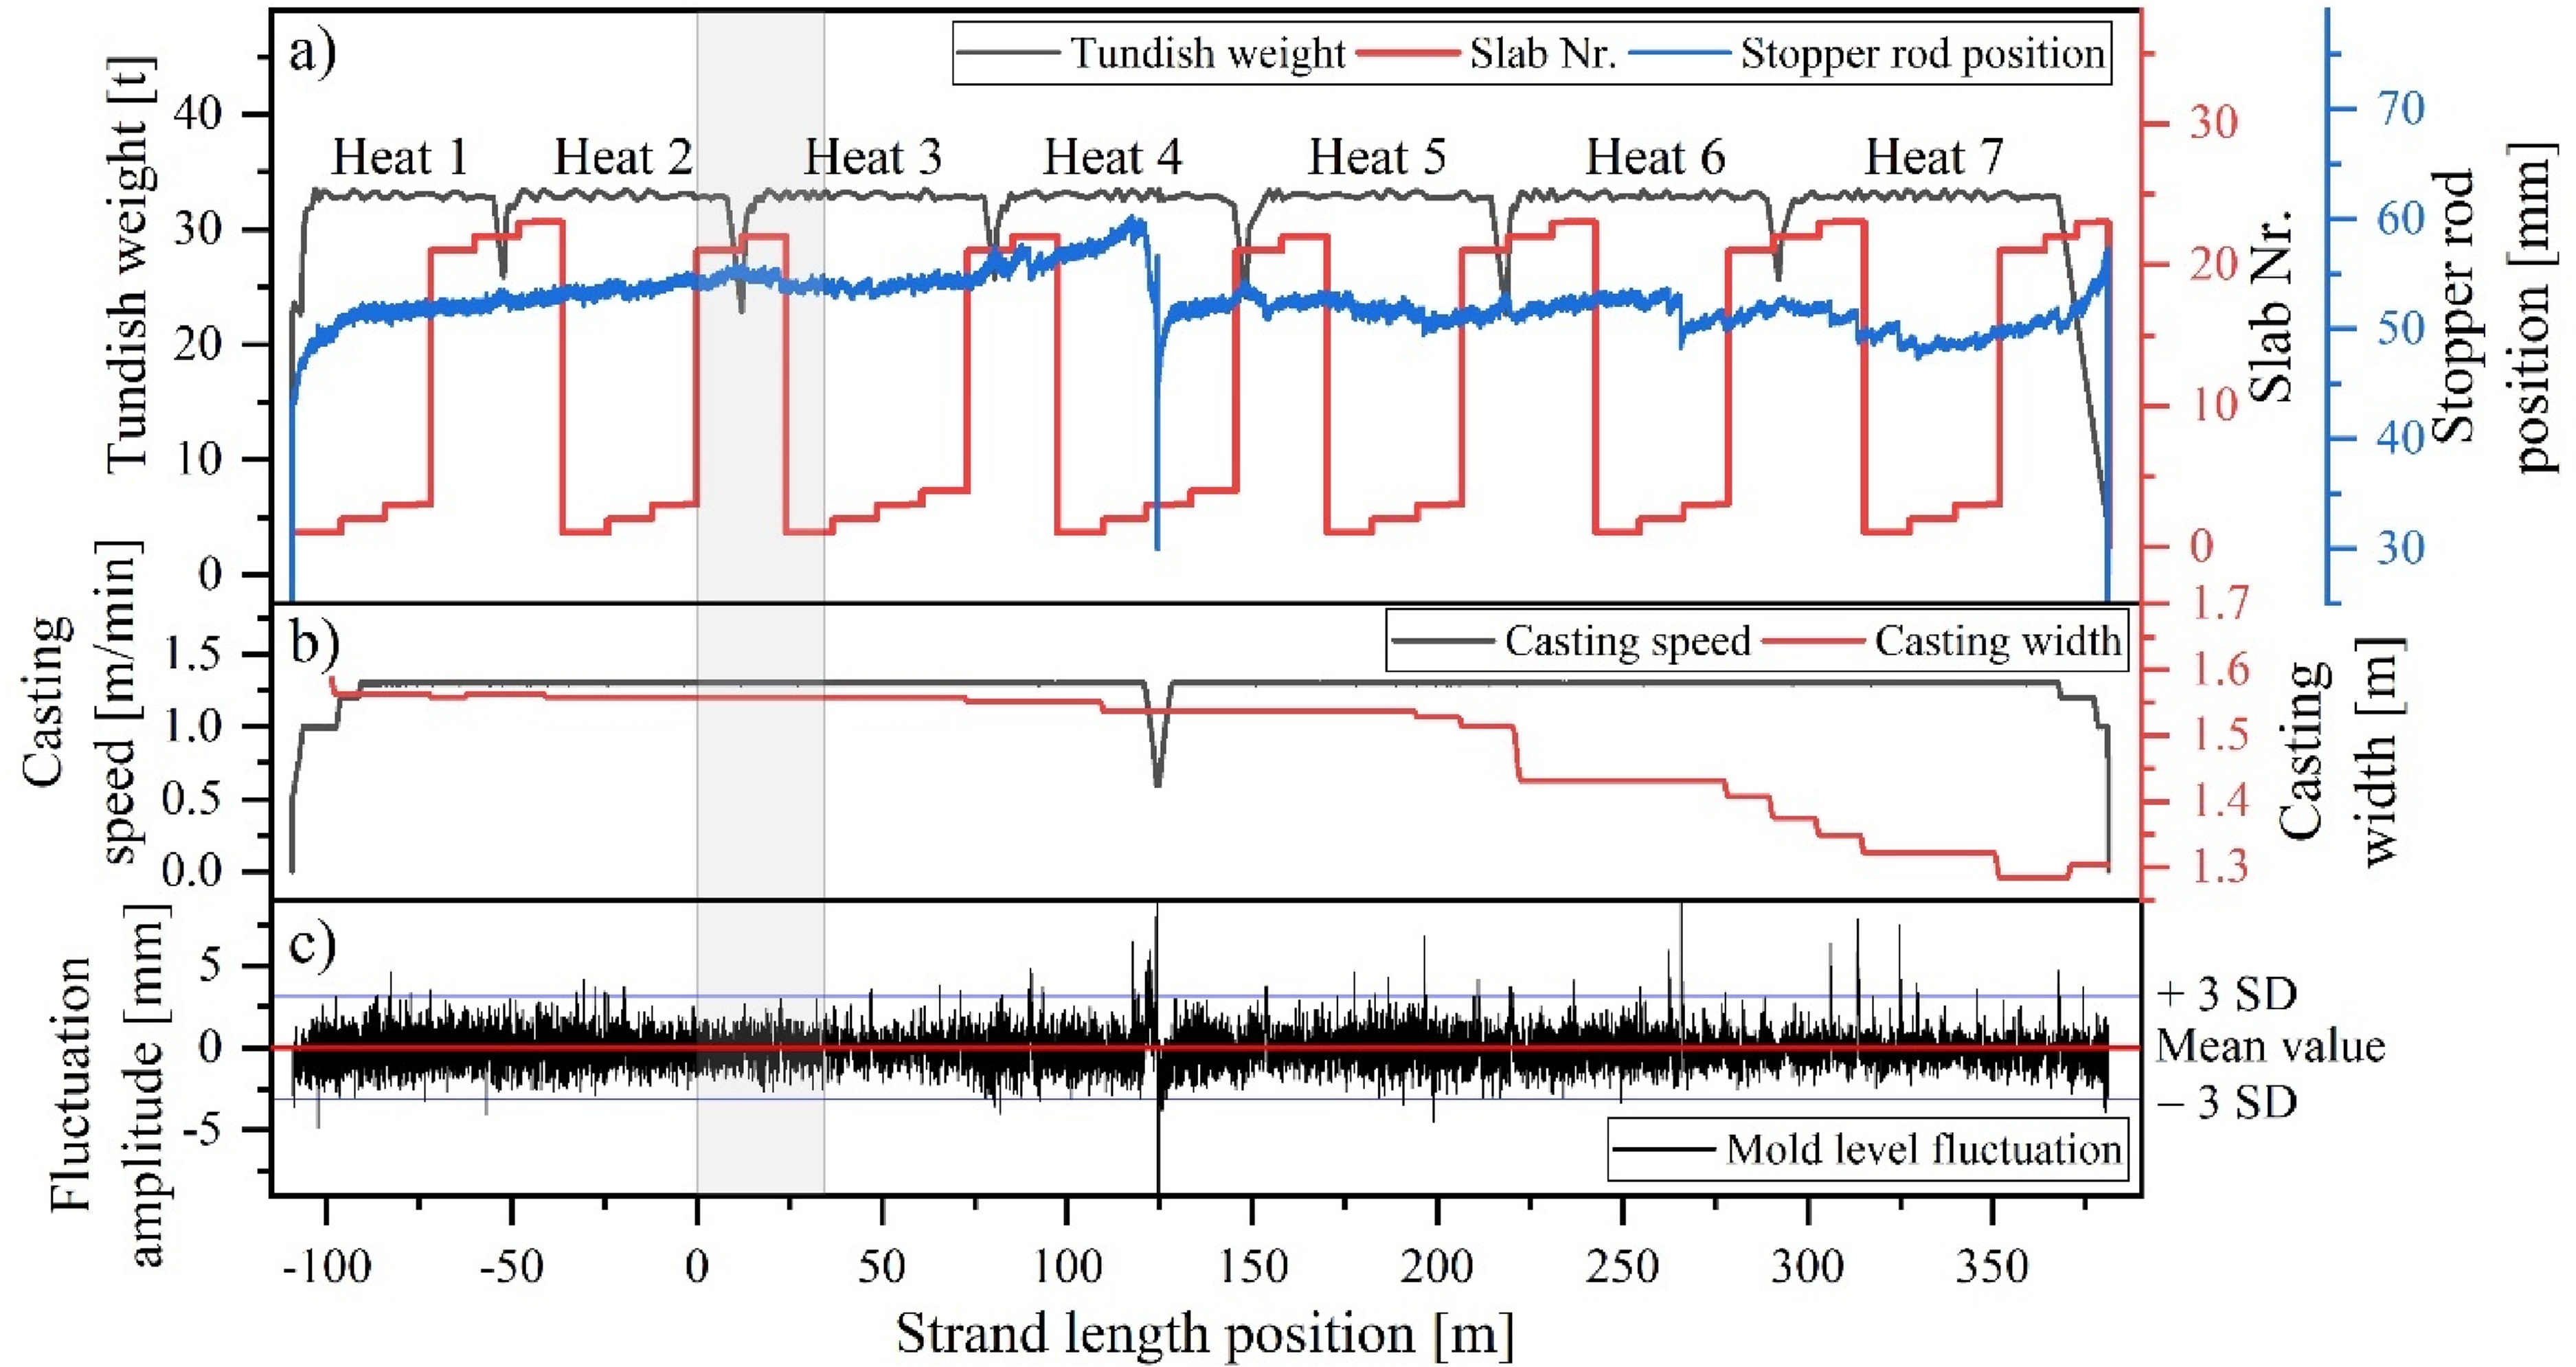
Casting parameters during steady and unsteady operation: (a) tundish weight and stopper rod position over time; (b) variation in casting speed and mould width; (c) meniscus level fluctuations during casting.
However, the data presented in Figure 14(c) indicate a relatively stable meniscus level during this casting period. Additionally, the movement of the stopper rod (Figure 14(a)) only indicates minimal clogging during the ladle change between Heat 2 and 3. Clear clogging behaviour, detachment of clogging material, and associated mould level fluctuations were observed at a later stage of casting between the strand length of 250 and 350 m. Moreover, the casting speed and width were maintained at constant levels, which is crucial in preventing mould slag entrapment, as noted by Zhang et al.. 69
Another possible cause for slag entrapment has been observed during water modelling experiments,70,71 which showed that certain flow conditions (e.g., asymmetric flow pattern due to clogging or inappropriate Ar-gas injection) within the mould could lead to vortex formation close to the SEN. These vortices can carry slag deeply into the liquid pool. Based on these findings, further process data were investigated. This included data from the eddy current sensors mounted on the top mould copper wall edge and Ar purging data from the stopper and upper tundish nozzle. The purpose was to identify any signs of asymmetrical flow within the mould. However, no evidence of such a flow pattern was found during the casting period of the ladle change. This suggests that the entrapment mechanisms might be more complex or involve factors that were not detectable with the available measurement systems or their positioning within the mould.
Another inclusion type located within the strand section cast during the ladle change was Type III. These NMIs were found exclusively in the strand section cast during the period when the tundish fill volume was at its minimum and the ladle slide gate of the following heat was opened. This period also showed the highest number of inclusions per measured volume, dominated by entrapped mould slag, followed by these MgO-based inclusions. Due to their chemical composition and irregular form, these macroscopic particles most likely originate from refractory material. The chemical composition of the refractory materials used in the ladle and the tundish was subsequently examined to narrow down the source. The research revealed that only two refractory sources come into question: the magnesia-C lining in the ladle's slag zone or the magnesia in the inlet area of the upper tundish nozzle. The ladle lining as a source seems improbable, as particles would most likely have been separated into the ladle slag during the transport of the melt to the continuous caster and the subsequent holding time at the ladle turret. It seems more plausible that the material originates from the eroded upper tundish nozzle, where unfavourable flow conditions prevent particles from separating into the mould slag. Nevertheless, the occurrence of this inclusion population is considered to be a stochastic single event, as no operational problems have been observed with the use of this upper tundish nozzle in the past.
In previous studies, for example,27,31,32 tundish covering slag or the slide gate sand were identified as sources of exogenous macroscopic inclusions during unsteady casting. However, in this particular study, there was no evidence of entrapped tundish slag. Furthermore, no evidence of exogenous particles originating from the chromite-based ladle filler sand could be found.
Considering the results presented on identifying sources of macroscopic NMIs during unsteady casting, it ' important to highlight that this detailed analysis focuses on a single ladle change event in the industrial setting. The cleanness level of the steel product and the origin of defects are greatly affected by the flow conditions at that particular period in the ladle, tundish and mould. As a result, each ladle change is unique, influenced by slight variations in casting parameters such as the rate of tundish emptying and refilling, steel temperatures of the two heats, casting speed and slab width, among other factors. This study highlights the valuable insights and benefits that the application of tracers can provide in large-scale cleanness investigations, offering a more precise identification of inclusion sources and enhancing the overall understanding of steel cleanness dynamics.
Conclusion
A slag tracer experiment was conducted at the integrated steel plant of voestalpine Stahl GmbH in Linz, Austria, during the production of Al-killed construction steel. The focus of the study was to evaluate the meso- and macroscopic cleanness level of steel products cast during ladle change operations.
To study the origin of these inclusions, BaO was used as a tracer for the ladle slag and SrO was applied to mark the tundish slag. As these oxides are highly exotic and rarely encountered in the steelmaking environment, any inclusions containing BaO or SrO can be directly correlated to their respective exogenous slag sources.
Hot-rolled coils produced from slabs cast during the unsteady casting period were sampled for the cleanness evaluations. Using X-ray radiography, NMIs larger than 80 µm were detected, and their positions were back-projected to the corresponding locations within the initial strand.
The following conclusions can be drawn from this research:
The application of BaO and SrO as tracers for ladle and tundish slags, respectively, proved effective and did not alter the chemical composition of pre-existing deoxidation products. The first inclusions exceeding the size of 80 µm were located approximately 3.1 m within the corresponding strand section before the ladle slide gate was closed. These particles could be associated with entrapped ladle slag, as they were marked by BaO. Over the next few metres, including the position where the slide gate of the draining ladle was closed, the size and number of inclusions steadily increased. Aside from particles originating from the ladle slag, NMIs originating from the mould slag were also found. These could be identified by their chemical composition, although process data does not give any indication of formation history. During the casting period, as the tundish weight decreased, the largest inclusions (maximum ECD of 484 µm) were detected, and the highest amount of NMIs per tested volume was observed shortly before the slide gate of the next heat was opened. Under these operating conditions, a third type of inclusion was identified, most likely originating from eroded refractory material from the upper tundish nozzle. In the following 11.2 m after opening the ladle slide gate, the inclusion number per tested volume and the size of inclusions decreased again. Within the strand section cast afterward, only single meso-inclusions of the detectable size were found, representing the baseline cleanness level for this steel grade.
This study demonstrates new possibilities for evaluating the meso- and macro-cleanness levels of steel products cast under both steady and unsteady conditions using X-ray radiography. Additionally, it highlights the valuable insights that tracer applications provide for cleanness investigations on an industrial scale.
Footnotes
Acknowledgements
Grateful acknowledgement is extended for the financial support provided by the Austrian Federal Ministry of Economy, Energy and Tourism, the National Foundation for Research, Technology, and Development, the Christian Doppler Research Association, and voestalpine Stahl GmbH.
Declaration of conflicting interests
The authors declared no potential conflicts of interest with respect to the research, authorship and/or publication of this article.
Funding
The authors received no financial support for the research, authorship and/or publication of this article.