
Abstract
This paper used graduation statistics of the Namibian secondary higher education over two decades to determine linkages to human capital of the youth and its multiplication into economic development. The paper assessed the effect of regional differences to show historic educational discrimination and why the education reform was required to correct the skewed past. It was hypothesized that the educational reform would result into improvements of the academic levels within the disadvantaged regions and anticipated that the correction will partly have negative effects on the previously advantaged regions. By applying panel data, the paper attempts to simultaneously address the complex relationships of development, education, and the underlying causalities within the economic system of Namibia. Concepts in the testing of socio-economic components are done by looking at confounding logics, stochastics, and the use of latent variables to determine linkages by using the canonical correlation method. This approach could be extended in future as guide for decisions on education. Our study shows that the implementation of the Namibian education reform resulted into increased enrolment numbers, but unfortunately also into the declining of academic levels, combined with the narrowing of learners’ outputs. The reform response in the previously disadvantaged regions was slower than expected. Findings of the longitudinal data show that education levels in Namibia partly contributed towards human capital formation to multiply into economic development. The study shows that the method of analyzing linkages between cause and effect by means of causality provides advantages for analysis. The results confirm findings that human capital formation has a positive effect on the country's economic status, but for efficacy analysis of policy, we need regional information.
Highlights
The inability to correctly channel the education budget into the right channel of human capital.
“Soft” variables can be used to understand the relationship between human capital formation and the macro-economic situation.
Only after 17 years, the education reform showed a slow recovery of the declining academic levels.
The intended reform response was less flexible in the previously disadvantaged northern regions.
Namibia, like other developing countries continue to rely on donor funding for its education program.
Introduction
For any country in the world, reforms follow circumstances, where past measures must be corrected to help the current regime. Similarly, Namibia, that became an independent country in 1990, identified their education system to be reformed. Namibia inherited a skewed education, due to apartheid. Only by 1996, the school education was reformed with the Cambridge system, to mainly to discuss injustice (Katjavivi, 2016). Prior to the Cambridge system, only 7% of the current number of learners had access to grade 12. Access to education in Namibia was constrained by German colonial activities, defined by the inside of a blue line territory boundary. By 1907, colonial rule determined what was perceived as important (Miescher, 2012). After the World War I, the second colonial rule only expanded educational efforts in the late 1960s to expand the Non-White enrolment in schools (Mbamba, 1981). Different educational systems were applied and administered separately. However, because of inadequate infrastructure provision and facilities, limited progress was achieved before the 1970s (Mbamba, 1981). At the time of Independence in 1990, Namibia inherited a skewed educational system and was tasked to correct the past. In 1996, the school education was reformed with the Cambridge system, to address injustice (Katjavivi, 2016).
The Namibian education reform was based on recognizing education as a human right. Education was regarded as the engine to develop individual levels, and to offer multiplier benefits such as employment, earnings, health, poverty reduction, and life fulfilment. Such gains call for investing in education to change the direction and destiny of societies in Namibia. This paper used grade 12 results of the Namibian schooling system as determinant of secondary higher education levels over time (see Mayston, 2013), and suggests that investment in education has a direct and lasting positive impact on people's lives (see Agbor, 2015), but also that policy matters. Literature argues in general that education levels contribute towards human capital of the youth and multiply into economic development, as discussed by Schultz (1961) and many others.
Santin and Sicilia (2015) showed that education contributes towards the economic status, showing that a better educated population is reflected by high percentage of public spending on education. Disaggregating data from higher educational levels, not always show mono-causality. This paper follows the debate on how to achieve a more efficient education system and questioning contributing factors and policy implications (Pearl & Mackenzie, 2018). Almost three decades after Independence, the reform was adjusted without appropriate justification, with a result that “former education ministers are on a warpath about the conundrum created by the new education curriculum, which has seen thousands of learners dumped on the streets, and their academic futures in disarray” (Mumbuu, 2022:1). To offer empirical answers, this paper attempts to address the complex relationships of economic development and education and to find the underlying causalities and significance of educational explanatory variables within the economic system of Namibia. Regional panel data over the past two decades show outcome changes since the reform was implemented. We used the canonical correlation method to build a model, to hypothesize and to causalities found in literature and applicable to Namibia. The longitudinal data over a period of two decades allow for concluding remarks on the education reform outcomes.
Literature
Correcting the past through reforms can be linked to human capital, claiming that education improvements through reforms develop skills and knowledge for economic growth. However, it remains often unproven. Literature shows that the return of educational investments typically is rewarded by economic growth through improved productivity and increased revenues (see Aristovnik & Obadić, 2014; Gyimah-Brempong, et al., 2006; Hanushek & Woessmann, 2012; Werner et al., 2019, and others). When the causality between human capital and economic growth were examined, studies provided mixed results (see Pegkas, 2014). They showed emerging evidence that education is also associated with a wide range of non-economic benefits (Pouris & Inglesi-Lotz, 2014), and measured as growth, rather straight well-being oriented. Gavurová et al. (2017) found that countries which invest in education can contribute to human development by reducing social inequalities, which promotes economic growth and productivity indirectly. Literature is limited regarding such assessment of contributing factors to both human capital and economic growth. For example, research on the Nigeria showed that the poverty rate, unemployment, and low income per capita, and low education levels attributed to low productivity growth. That study did not find significant educational nor health variables to explain the growth (see Asaleye et al., 2017, 2018 and Popoola et al., 2019).
With abundant human and natural resources, Namibia faces developmental challenges such as a high poverty rate, high unemployment, and low income per capita (Mwinga, 2012). Their hidden causalities must be reckoned in beliefs of population that income can be generated through resource use not education. Literature on African education show that this can be attributed to factors such as low productivity growth in some countries (Asaleye et al., 2017; Eigbiremolen & Anaduaka, 2014; Fashina et al., 2018; and Popoola et al., 2019). Research shows for example, that a low investment rate in human capital and the inability to channel the education budget into the right channel for human capital formation have serious consequences. In the Namibian case, the education sector always received a prominent part from the national budget (18%), which equals to 6%–7% of Namibia's total GDP (UNICEF, 2017).
Li et al. (2016) argues that a low rate of investment in human capital can be attributed to the inability of selecting the right channel of human capital investment to embark on. The investment in education is often found as signal to differentiate most productive individuals (see Popoola et al., 2019) from poor productive, to advance increased productivity (Escosura & Roses, 2010; Lee & Lee, 2016); yet a syllogism, but what drives what? Literature shows that high public expenditures on education result in increased educational equality, implying that in countries with higher investments in public education, there is a reduced variation of students’ performance. This shall contribute to growth, but it depends on historic characteristics (Schlicht et al., 2010; Stadelmann-Steffen, 2012).
The inputs from secondary schools do have a role to play in providing literacy and numeracy, which will enable students to survive in our complex technological society. But this might be only a necessary condition, not enough for success. Already Adam Smith recognized the principle that educational and professional achievements in life often depend on educational and professional attainments earlier in life. This principle was extended ever since to the “academic backbone” principle by McManus et al. (2013) defining longitudinal educational achievements to continue from secondary school via tertiary education up to the final level of specialization. The study from Hassan and Ahmed (2008) used cross-section panel data 1 regressions and found positive correlations between economic growth and variables reflecting human capital, such as the literacy rate, average years of schooling, and secondary school enrolment. However, methodological and measurement problems rarely sufficiently discuss the causalities between variables. Methodological exceptions are latent variable models (Wagner et al., 2010), which have been recently used to get the attitudes and causalities right.
Baharom et al. (2013) showed linkages between human capital and economic growth, being assessed by a dynamic panel system focusing on secondary school data as a proxy for human capital. Their aggregated country results showed that only the high school graduates affect the national growth, while performing secondary school graduates deemed insignificant. Findings often depended on the methodology and approach applied. For example, research on Indonesian secondary school education 2 showed an adverse impact on economic growth (Mendy & Widodo, 2018), while Kasri (2011) proved that secondary school education had a positive effect. The above examples show that model specifications cause different findings, leading to severe underestimation of its development effect on economic growth (Wößmann, 2003). It shows that the approach used by Baharom et al. (2013) can determine the Namibian causalities between school's educational achievements as a proxy to human capital formation and the resulting economic status.
Methodology
Data
Panel data was used to show that national causalities become more complex with regional findings. Data had to include changes from the education reform, such as 95% of school-age children can attend school now, the number of teachers increased by 30%, and over 4,000 new classrooms were built (UNICEF, 2017). The Namibian educational strategic plan aimed to improve quality, equity, and efficiency in the education sector countrywide, manifested in the goals access, equity, quality, democracy, and curricula. Regional differences caused by history, started the education reform in the 90s.
Mbamba's (1981) classified the educational system by divide the country into the northern sector as the previously educational disadvantaged regions (Zambezi, Kavango East and West, Ohangwena, Oshikoto, Oshana, Omusati, and Kunene). For these regions, English is foreign, which impacts being used as the taught medium for the last years of schooling. The southern sector is more educational advantaged, where many learners at least are aware of the English language, selected as national language at Independence. Learners from more the advanced regions originate from Otjozonjupa, Omaheke, Erongo, Khomas, Hardap, and !Kharas. Figure 1 provides a brief overview of these different regions as they are administered currently.
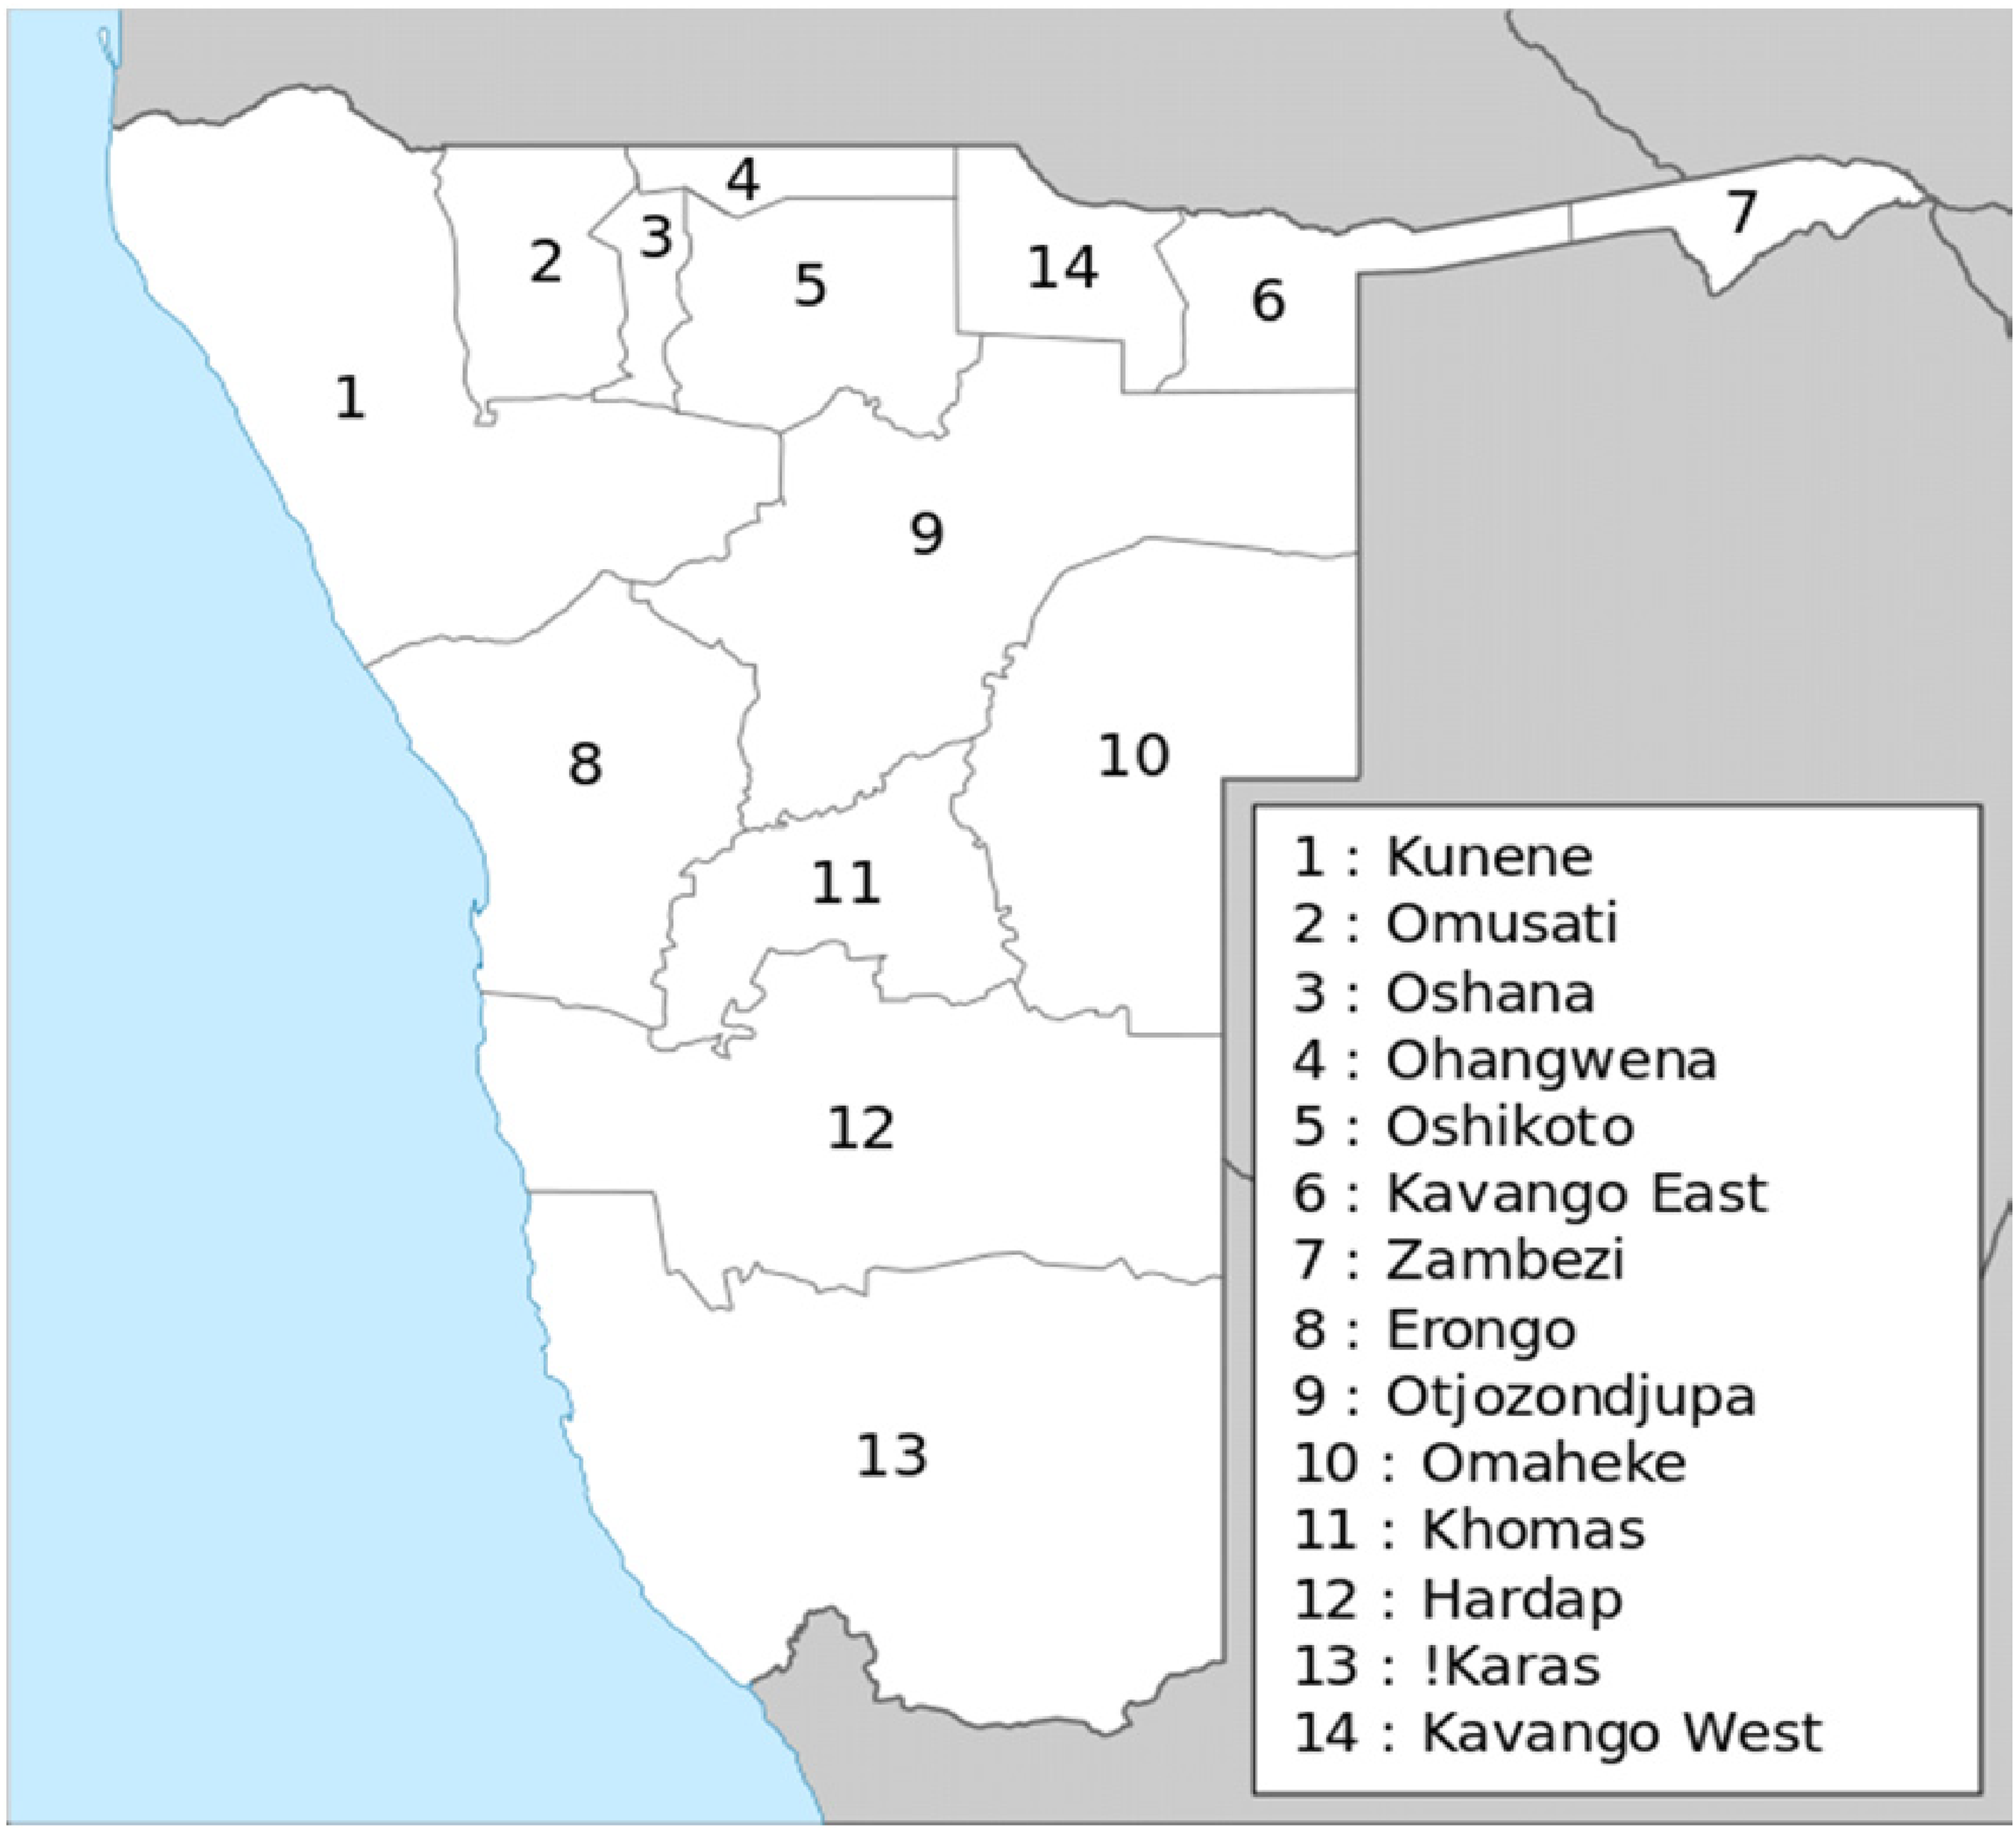
Namibian regions.
Variables selected were based on the above discussion and on the availability within the Namibian context. The analysis is based on longitudinal panel data (Baltagi, 2008; Manca, 2011; and Teixeiraa & Queiros, 2016) covering education on the one side and the economic status on the other side for regions. The education data consisted of the grade 12 results from the Cambridge (IGCSE) system, referred to as the Namibia Senior Secondary Certificate H levels (NSSCH). A learner could obtain maximum points of 54 for six subjects. For comparison, the basic entrance level to a Namibian university requires a minimum of 25 points. Individual learner's subject results were entered and averaged to regional NSSCH education levels over time for the years 1996, 1999, 2005, 2009, 2013, and 2018. As of 2019, the third basic educational reform changes were implemented, resulting in the phasing out of the NSSCH and introducing the different Namibian Senior Secondary Certificate Advanced Subsidiary (NSSCAS) level course. Thus, the 2019 data could not be included in this panel data.
The average learner marks were indexed, and they were also presented as skewness index 3 to show the regional secondary education levels. Besides the learner variables, additional regional 4 variables, such as number of teachers, learner per teacher ratio, the number of schools, teachers’ average salary, and various educational budget lines, were collected to describe the secondary education in Namibia.
We obtained the economically related data from the National Statistical Agency of Namibia (NSA, 2020). The following variables were collected: (1) regional population size, average regional household size, percentage of households having access to electricity, (2) young citizen (<34 years) unemployed, (3) regional urbanization %, (4) poverty rate, (5) inequality measure, (6) average regional household consumption, (7) percentage of formally employed, and (8) regional income tax contribution. Monetary values were deflated by the consumer price index.
It was hypothesized that the education reform would cause NSSCH levels to improve the disadvantaged northern regions, with accompanied equity of available resources. It was deliberate that the education reform intended to improve the disadvantaged regions and expected that the intention to correct the past might have an unintended negative effect on the previously advantaged southern regions.
To get an impression of the data, the higher secondary education level and equity were plotted in comparison to learner enrolment and number of teachers over years. Figure 2 shows the changes of weighted performance levels between the educationally advantaged (southern), and disadvantaged (northern) regions.
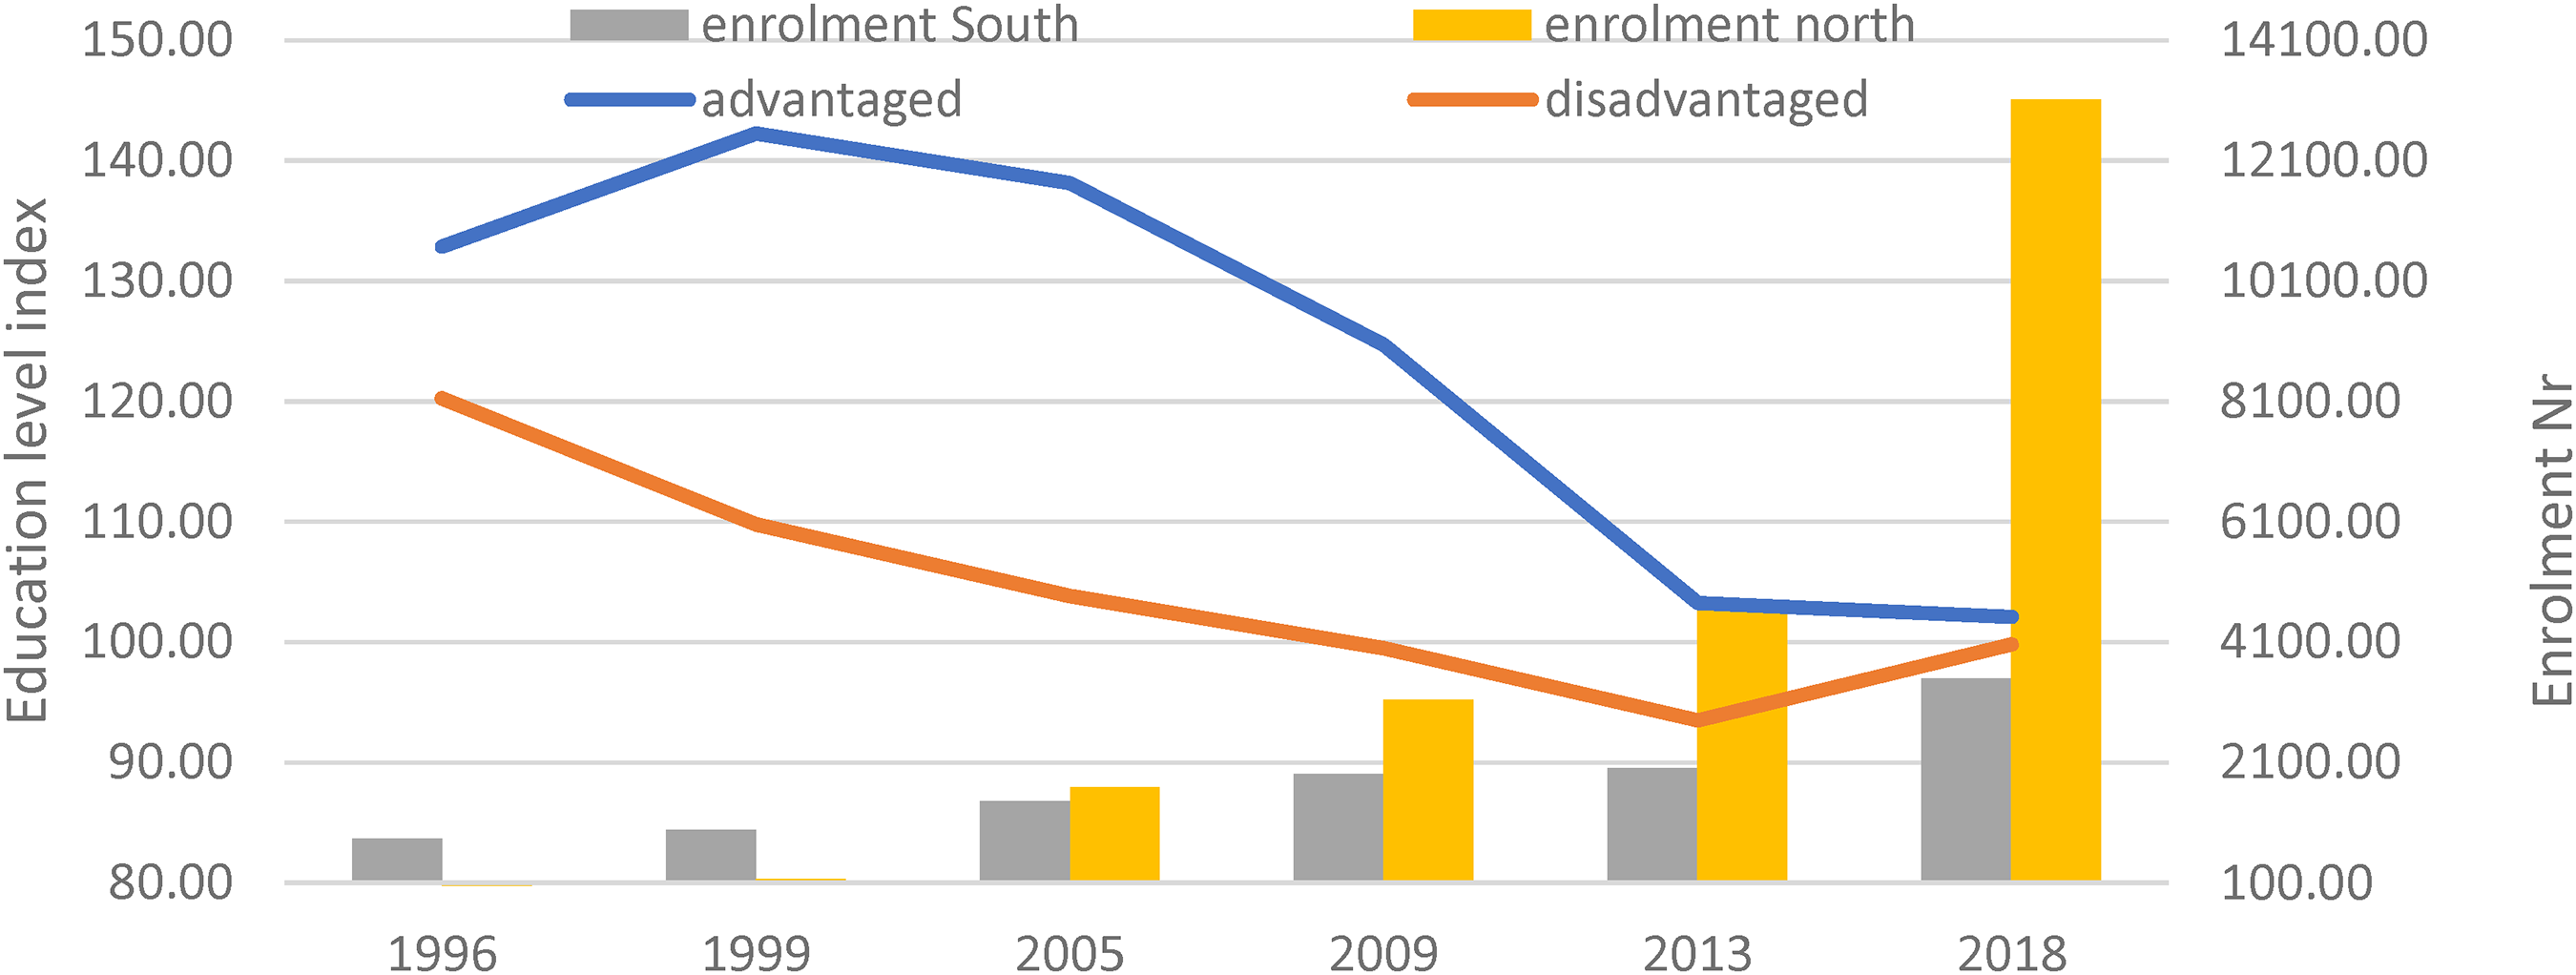
Higher secondary education performance level of different regions.
Figure 3 shows more equity in the academic level performance of the different regions and the number of teachers for the NSSCH system. The T-test showed significant t-statistic value of −8.438, and −9.776, respectively, for the advantaged and disadvantaged regions. It implies that the number of teachers in both classifications of regions contribute to the explaining of equity in the academic performance.
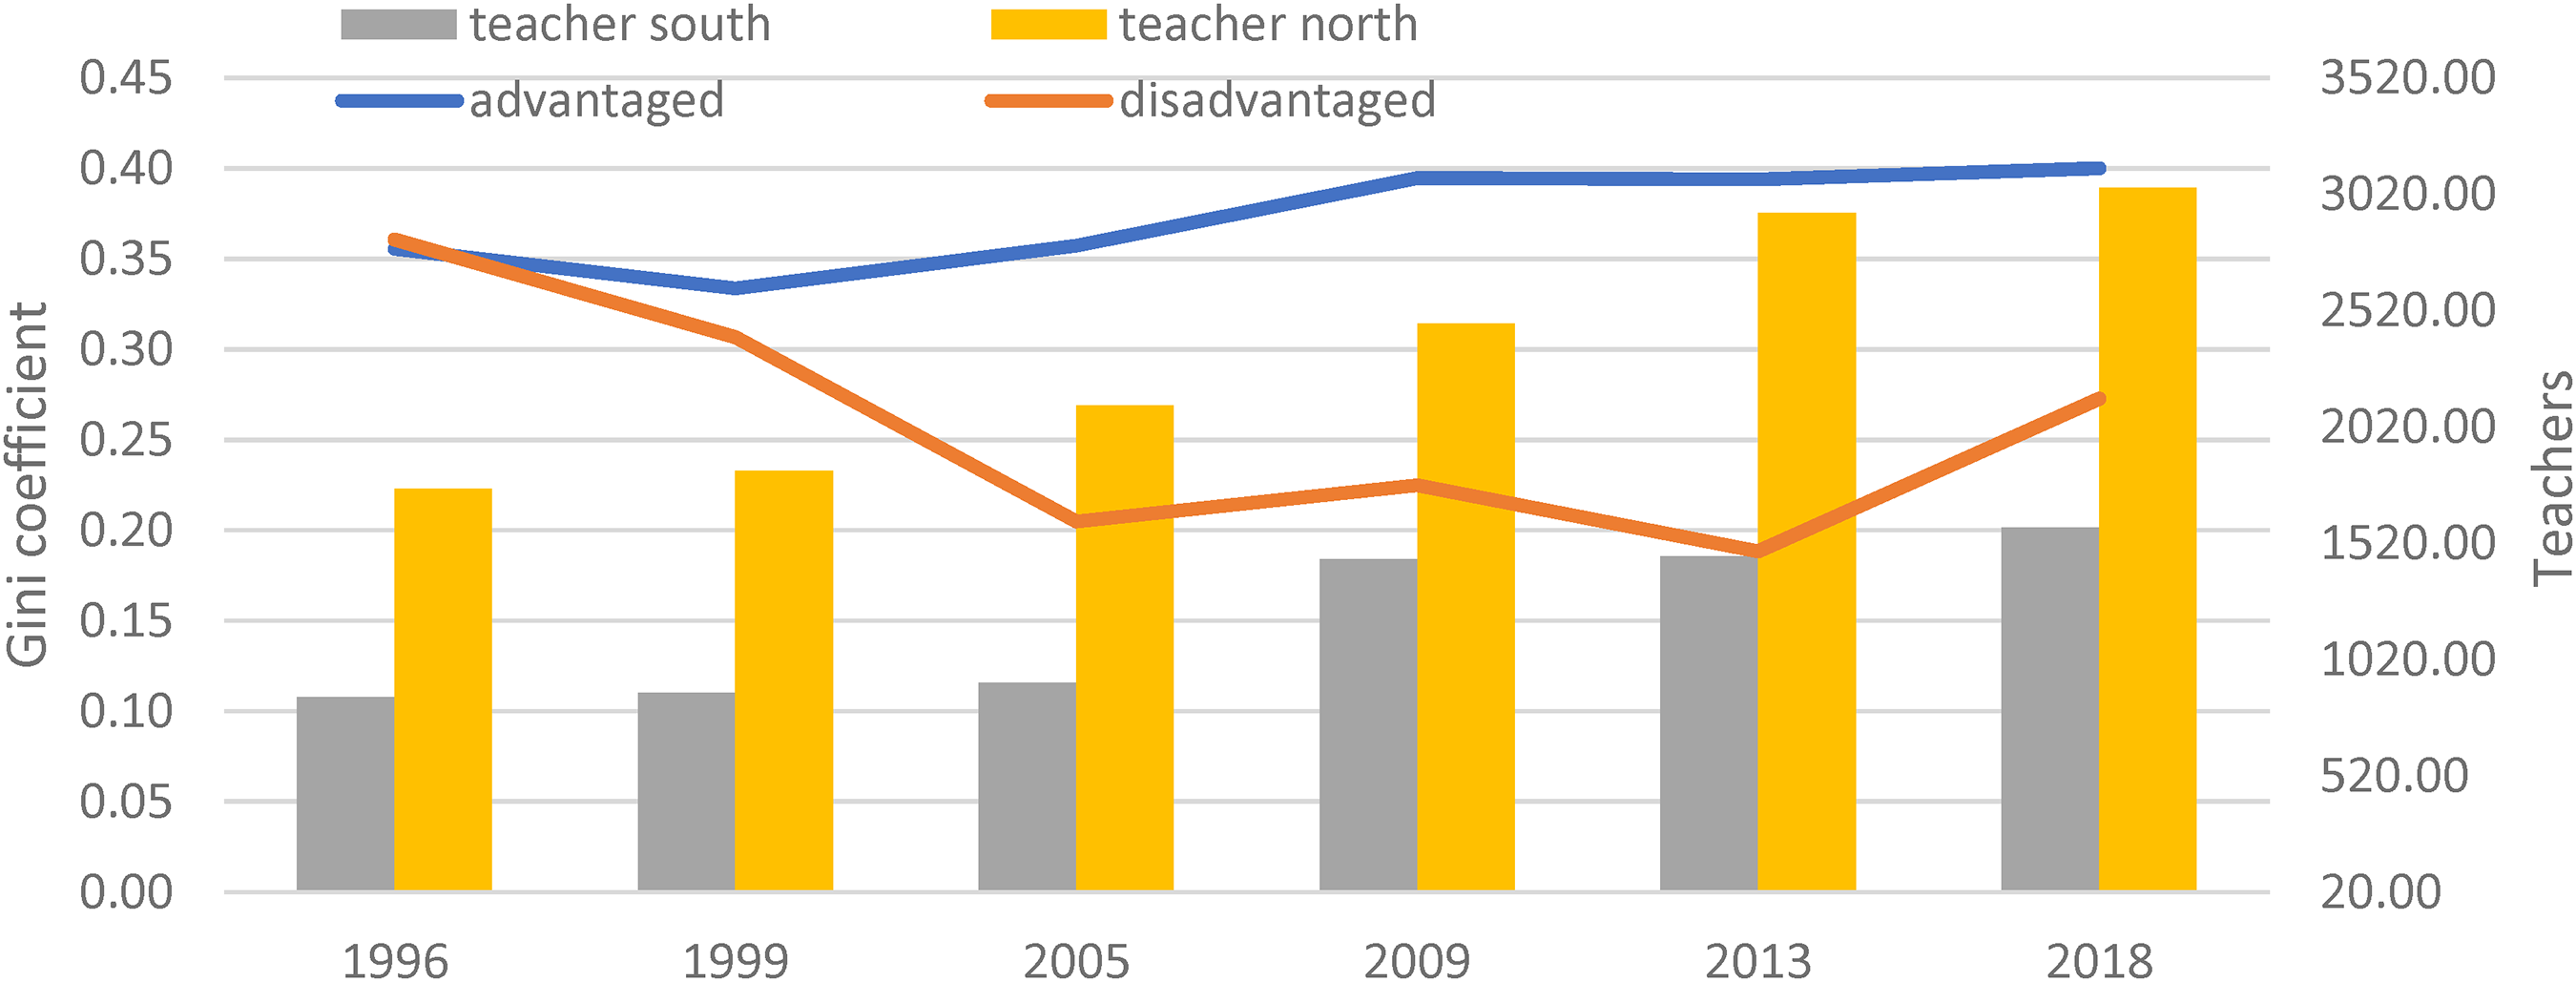
Higher secondary education equity in performance of different regions.
To explain the variables, our longitudinal panel data was grouped in the three levels of the educational index (low, average, and high), as 1, 2, and 3; and we went for regional disaggregation. A discriminant analysis was used to find underlying explanatory variables for both the school achievements and the regional economic status.
Causality Analysis
Progress in educational programs is often impeded by the empirical approach used, such as weak or strong causality. The theory provides reasons for implementation success or failure. The testing of causalities presents a case to understand the hidden variables of school achievement within the countries’ economic status as dependent on the perception on causalities (following Pearl & Mackenzie, 2018). Our paper aims to test the important socio-economic components in society by looking at confounding, logics, stochastics, and so on. It is an attempt to qualify variables of secondary education within the Namibian economic context working with causalities as pathways. Classical analysis showed that both the secondary education level and the household real consumption could be explained by explanatory variables, called “hard”-value variables within the education end economic fields. These variables are characterized by the standard assumptions of metric statistics. These variables are the “easy obtainable” variables for empirical analysis, which in most cases do not depict the full theory to be qualified, that is, most analysis could not reflect the full and complex theory.
One method to overcome this problem is to use less stringent assumptions on data and statistical tools, such as “soft” variables. They are variables which are not directly observed, often called “latent” variables and used where socio-economic characteristics are integrated in economic analysis. To explain this application, the least complex model illustrated by Dhrymes (1974) is used. Recently, Voelke et al. (2016) have shown the power of structure equation modelling SEM in time series and panel analysis. We follow that concept and offer a latent variable approach to the above problem on causalities. Equation 1 shows that the exogenous variable z determines an endogenous variable w, and both variables are regarded as not directly observable.

Individually, the indicator variables are indirectly correlated with each other, that is, if the traditional statistical methods have been applied, we could presume causality; but we have complex relationships. The equations seem purely exogenous and determined by z variables. However, for an in-depth quantitative approach, the magnitude of ɾ requires to be measured, since ɾ is the driving relationship in the setting (see Equation 2). This concept can be extended to systems of dependent and independent latent variables which are combined in structural interdependencies. Mathematically, this concept of interdependency and mutual causalities can be presented in Equations 2 and 3, yet it is the first offer of a pathway and reveals a recursive model and the second equation includes one interactive component (ζ, uni-lateral mono-causality).

Inserting the indicator variables, a structure of observable variables would be obtained


The above equations would result into a large correlation matrix, but it would not allow for the identification of structural parameters. We follow Dhrymes (1974) who proposed for a simple model like w = ϒ z, a constraint maximization of ϒ, extended to α and β simultaneously, which he called canonical correlation. Only in case where the endogenous variable is limited to one (e.g., m = 1), the generalized function (w = ϒ z) would be reduced to the standard multiple regression problem, but in the general form the canonical correlation (ϒ) would exhibit the relationship between latent variables, presented as:


Dhrymes (1974) proposed to maximize the canonical correlation coefficient ϒ in Equation 7 using constraints to result into a non-trival solution. This principle is applied using the Stata software (Stata, 2011). Empirical findings from several studies on the implications of human capital on economic growth have been used to guide on building the causalities between the school's educational achievements and the economic status in Namibia. The variable selection was based on the outcome of the classical econometric modelling and a causality diagram (below) which we kept simple, though it follows the above education-development-logic.
Findings of the best fitted model show that “school's educational achievements” 5 plays a significant role in the economic status in Namibia, though resource availability is different in regions. Figure 4 presents the causalities of the significant variables selected into the model. From this figure, it is evident that our latent variable “school's educational achievements” is sufficiently characterized by the average real teacher's salary and the development budget on secondary education, while the education level was the result of this “school's educational achievements.” Furthermore, the model showed a positive causality that the “economic status” is characterized by the soft latent variable “school's educational achievements”; it is hard explanatory variables, such as access to electricity and average real household spending that are paralleled. Furthermore, the “economic status” which is characterized by the variables formal employment, the poverty rate, urbanization, and household annual real income tax, gives significant output. Figure 4 shows that all variables are directly and indirectly related to form a system.
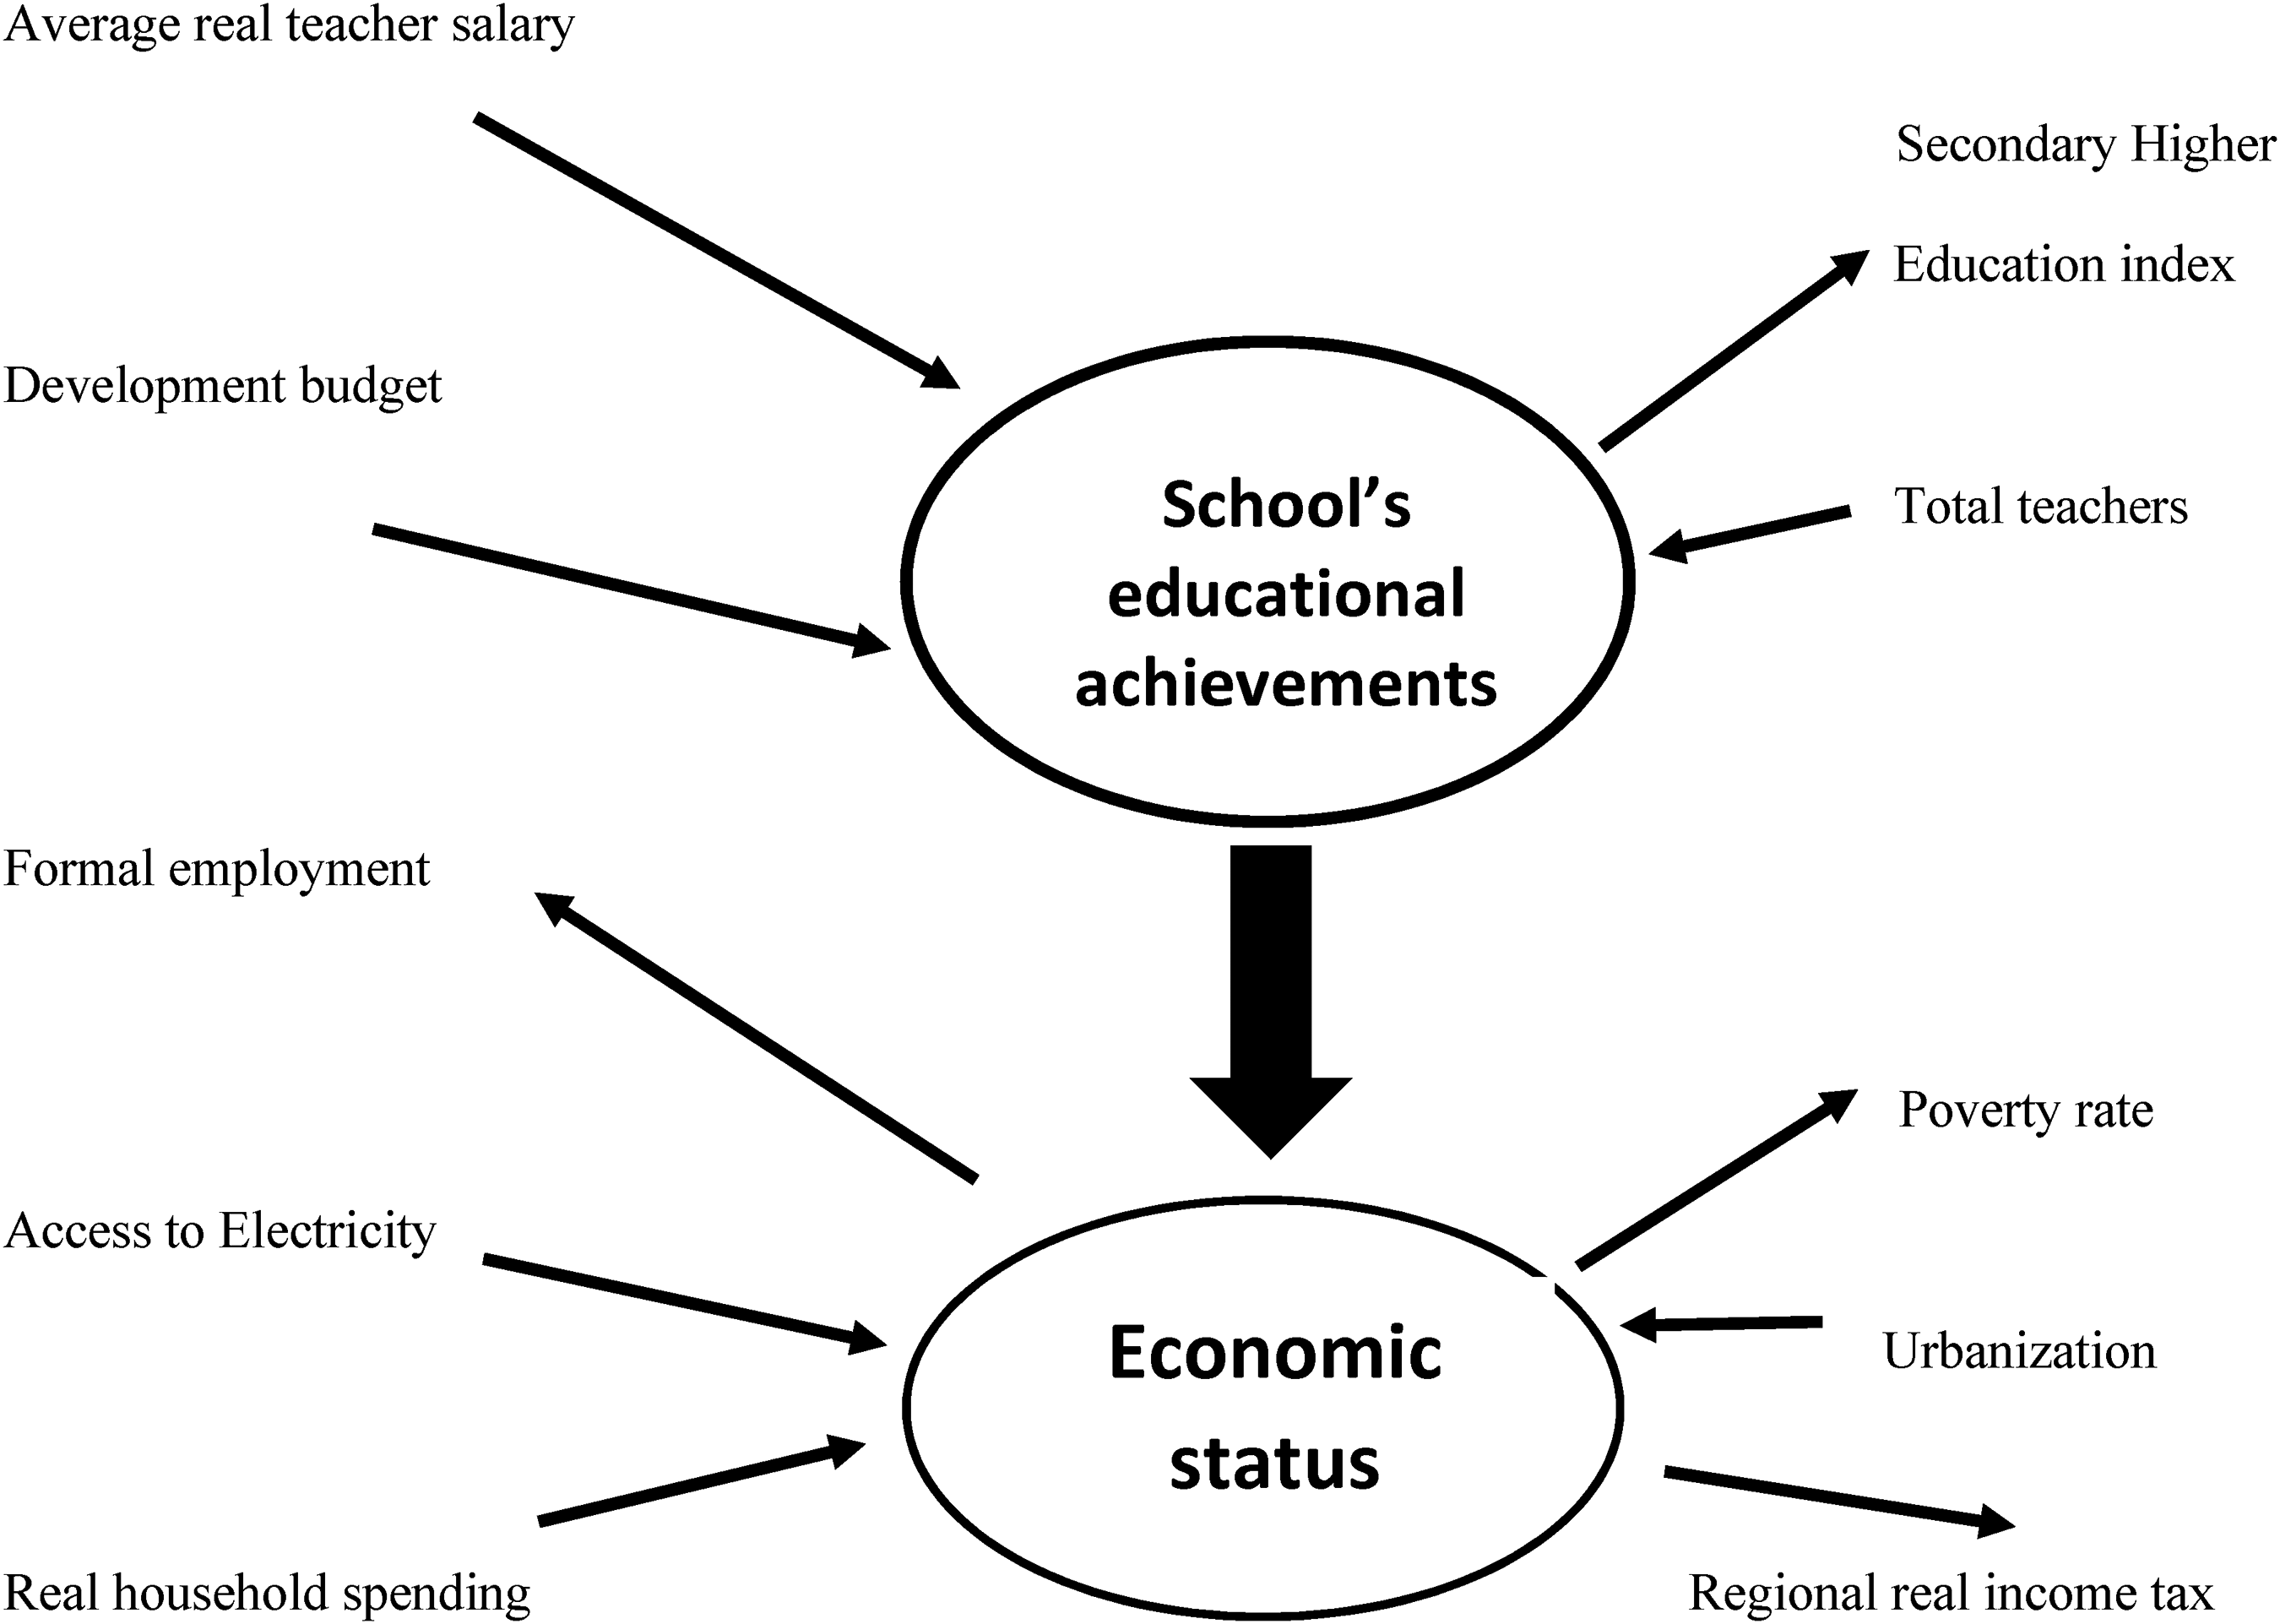
Causality links between school’s educational achievements and economic status in Namibia.
Results
Visual findings from Figure 2 show that both groups’ educational level followed a declining trend from a national weighted average index of 132 in 1996 to 100 in 2018. It is detected that the southern regions show a bigger variation of weighted average performance over the years. The recovery of the declining levels started only in 2013. The learners’ enrolment bars, especially in the northern regions, showed an enormous increase in the past 5 years, which followed 12 years after learners entered primary school, being admitted into grade 1. This relationship was tested with the T-test, showing a significance (p = .05) for the educational disadvantaged regions’ education level and the enrolment numbers. The advantaged regions showed insignificant results. This shows that the reform showed response, however, with an opposite intended relationship.
Figure 3 shows that for the first years until 1999, the calculated weighted Gini coefficient was decreasing, which implies that the variation of the average performance is widening. It can be observed that the equity of educational disadvantaged northern regions moved sideways until changes in numbers of primary school enrolment followed. That process, not unexpected, resulted in the situation in 2013 that the variation of the average academic level narrowed. This happened at a time when the actual weighted levels increased. Contrary, the southern region's equity of the academic level never entered a period of moving sideways. Since 1999 the variation of the average level narrowed while their weighted average academic level declined.
Combining the findings from Figures 2 and 3, it becomes clearer that the education reform resulted in a decline in output level of the advantaged regions joint with a reduced variety in level, while the numbers of teachers increased significantly. Significant corrections took place for the northern disadvantaged regions. The enrolment of higher secondary learners increased from 44 in 1996 to 13,124 in 2018. The growing enrolment numbers clearly required more classrooms, teachers, and so on, which in effect supported the improved education levels 17 years after the reform started. Educational levels dropped in all regions.
Graphs show three distinct phases. The first phase with improving education level from 1996 to 1999 could be associated to teacher's quality promotion through improving wages and salaries (adjustments in 1994). The next phase showed the general decline of academic results until 2013. This corresponds to the educational authorities’ decision to cut teachers’ incentive payments after obtaining further qualifications such as the Higher Education Diploma. The third phase started in 2013 when the educational reform could halt the declining of levels with a slight increase of these levels.
A discriminant analysis on grade 12 education outcome levels shows that the educational capital budget, the urbanization rate, formal employment rate, and the real average teacher's salary, all contributed on the classification of three education levels. A dummy variable (Khomas) further showed that Namibia's functional node contributed most towards the national formation of educational levels. The Fisher's linear discriminant coefficients and the means of variables are presented in Table 1, using the Stata Software (Stata, 2011).
Fishers’ Linear Discriminant Analysis.
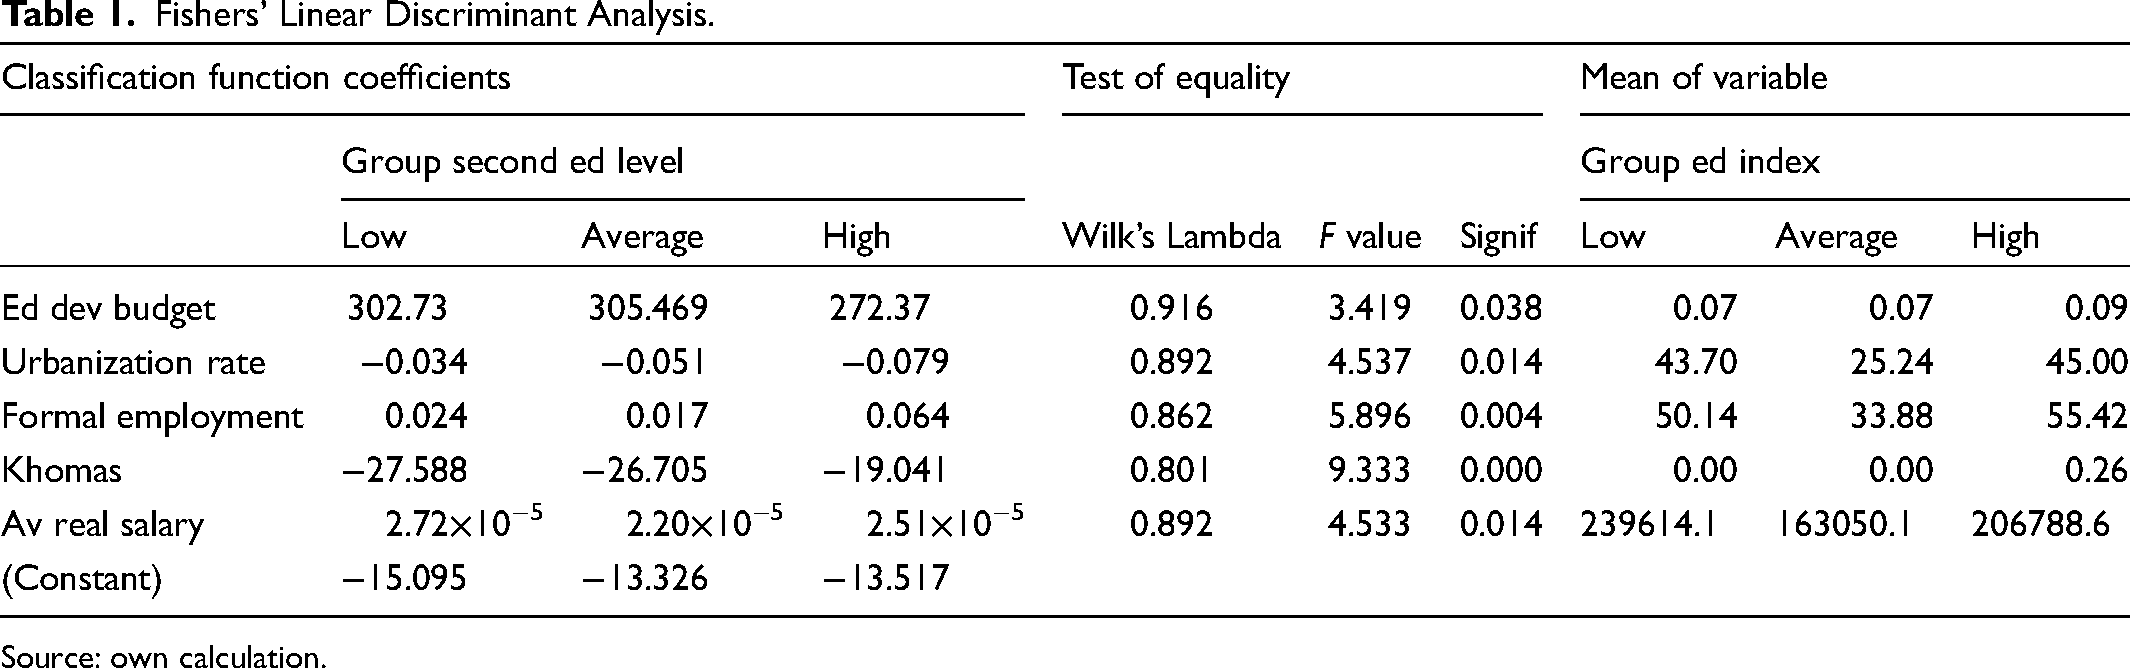
Source: own calculation.
The three overall classification levels of regions and its predictions of education levels are presented in Table 2. Out of the 27 low classifications, 17 originated from the previously advantaged regions, from the 28 average levels, the previously advantaged regions showed 9 cases and from the 23 high education levels, they showed 16 cases 6 . The discriminant analysis showed that 60.3% were correctly classified, most for the low educational level, followed by the medium group, and the smallest number for the high-level educational group. It implies that the high level of secondary education level is more difficult to explain.
Discriminant Analysis Educational Level Prediction.
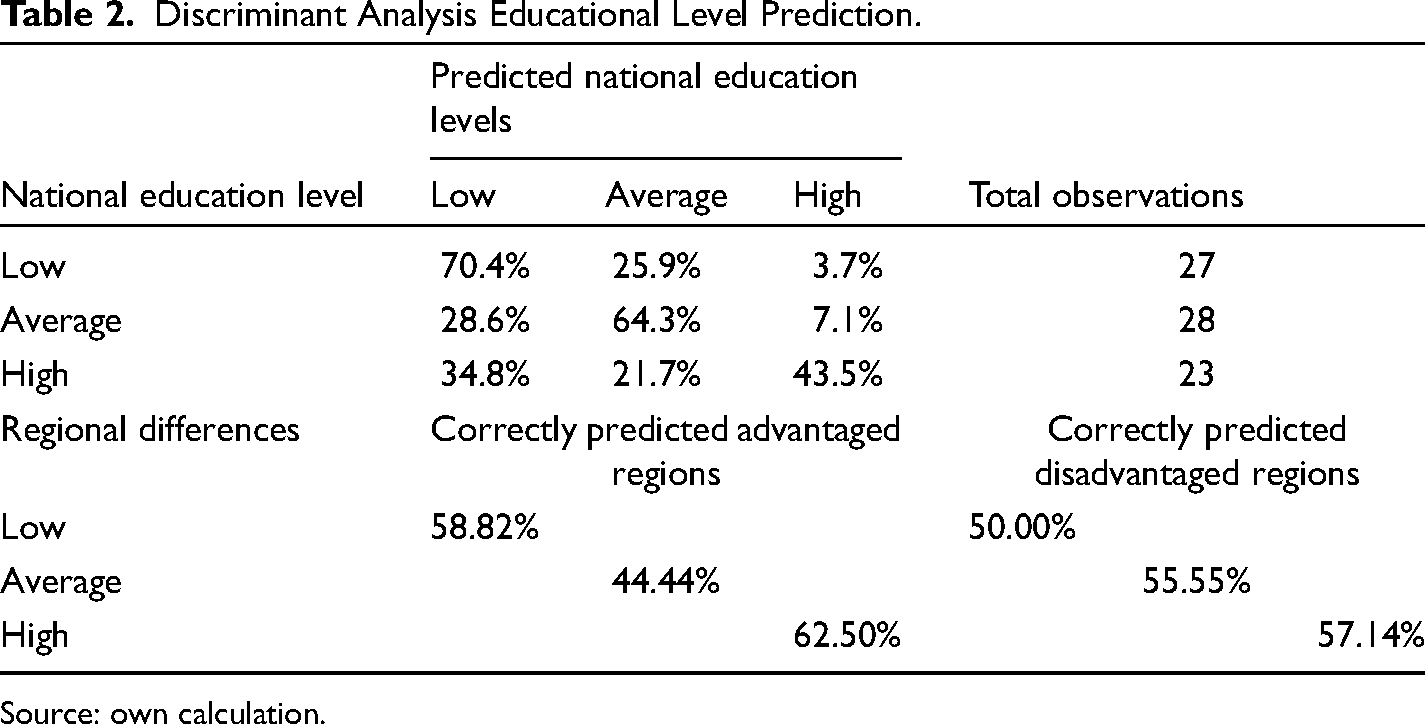
Source: own calculation.
Findings from the earlier steps were required to investigate the causal links presented in Figure 4. Each of the causal links received a significant coefficient, summarized in Table 3. To give a guide for interpretation: the “school's educational achievements” latent variable was characterized primarily by the average real teacher salary (coefficient −0.00007); yet good salaries seem to improve teaching quality. Total secondary teacher's numbers (coefficient −0.00734) and the education development budget (coefficient 260.825) are also contributing positively to “school's educational achievements.” This clarifies that the development budget is positively contributing to “school's educational achievements,” if there is a policy to promote teachers’ salaries. The secondary education level is described by hard educational variables, but especially characterized by the soft latent “school's educational achievements” variable. We found that “school's educational achievements” had a positive effect on the economic status of citizens of Namibia. The “economic status” was negatively characterized by access to electricity, but positively to the urbanization rate, and regional household spending.
Causalities in the Namibian Secondary Education.
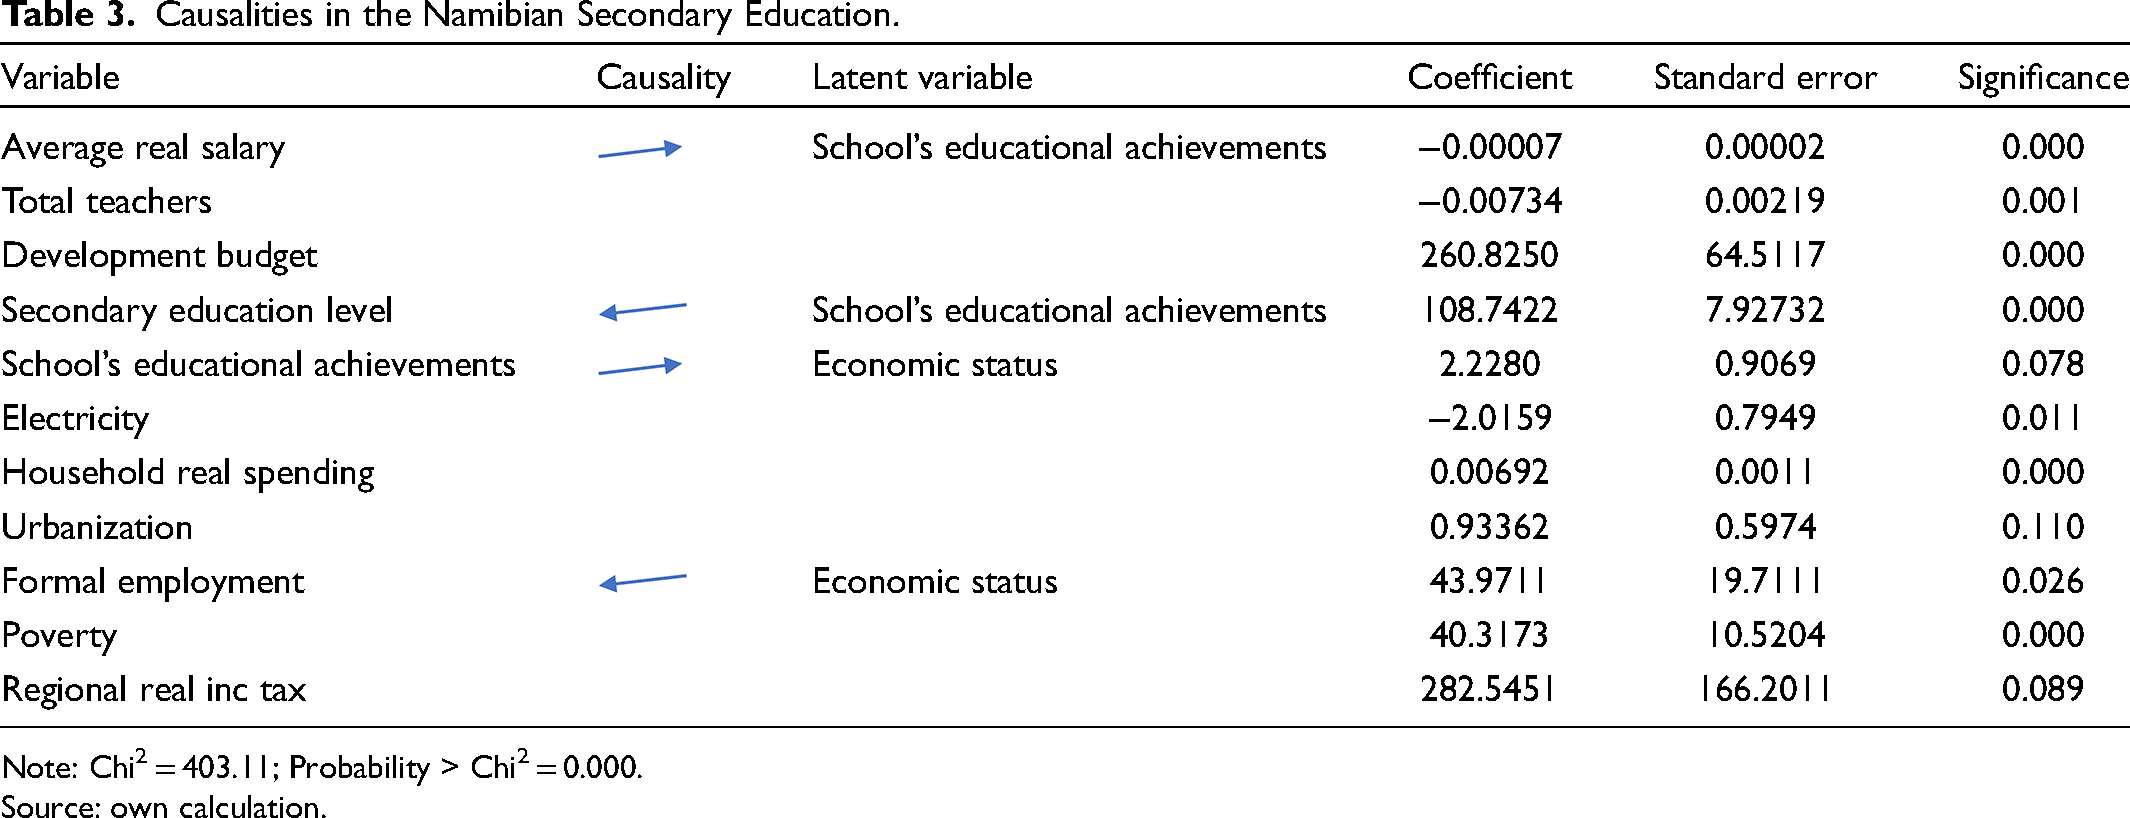
Note: Chi2 = 403.11; Probability > Chi2 = 0.000.
Source: own calculation.
To better understand these discovered causalities, regions were disaggregated into the previously educational advantaged and disadvantaged regions, as classified by Mbamba (1981). The three levels of education classes within the previously advantaged southern regions (as used in the earlier discriminant analysis) showed, that during the early years of reform implementation, the high-level classes could be correctly classified. What we see is a shift to the low-level classes since 2013. This implies that, although the reform showed results, the urbanization rate and the formal employment rate showed noticeable positive simultaneous impacts (as confounding). The real average teacher's salary explained different NSSCH levels. It may have contributed to overriding other factors that, especially learners in the previously advantaged regions lost their share of high-level ratings. Although different, the learners from the disadvantaged regions showed a similar declining trend, as presented in Table 4 which should be a factor for policy concern.
Correctly Predicted Regional Differences During the Educational Reform Period.
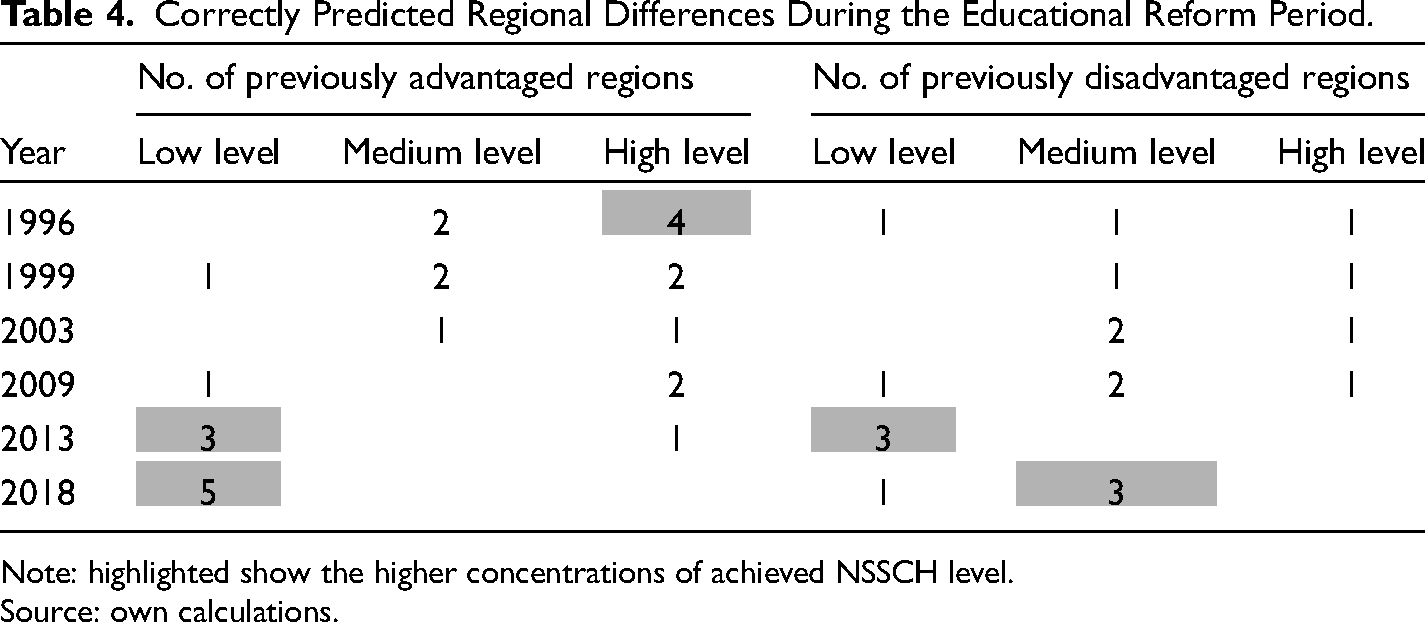
Note: highlighted show the higher concentrations of achieved NSSCH level.
Source: own calculations.
Discussions
We believe that any reform requires various assessments to determine the impact. The paper's empirical results for Namibia's progress in secondary education show that the implementation of the education reform (to correct the past) resulted in increased enrolment numbers, and also into declining academic levels of education. This was combined with the narrowing of learners’ outputs. With these findings, we reject the hypothesis that the reform improved NSSCH levels for, especially for the educationally disadvantaged northern regions. The education reform had the opposite result as expected. And it had to be reversed. Only after 17 years, a slow recovery of the academic levels showed some positive effects. The reform response was slower than expected in the northern regions but matched the secondary education levels of the southern regions. By disaggregation of the longitudinal data, the findings support the literature that education levels (in our case Namibia) partly contributed towards human capital formation and to multiply into the economic development. Since 2013, the education reform showed revised results to be associated with non-economic benefits by reducing social inequalities, and consequently promoting regional growth and productivity. These positive changes are those which the reform intended. It opens the question whether the reformed curriculum in 2019 (Nghipondoka, 2020) will strengthen or counter these results.
Results showed that the number of teachers had a negative effect on the overall higher secondary education levels, but this is not the full story. The decrease in the ratio of learners to teachers for the NSSCH, especially since 2009, had a positive impact on the recovery of the declining academic levels and its variation.
Conclusions
The results confirm findings that human capital formation through schooling has a positive effect on the country's economic status; yet overall, but for efficacy analysis of policy, we need regional information. Such a model can be used to evaluate the higher secondary education reform, and with more detailed information available, this approach could be extended with further “soft” variables to understand the relationship between the school's educational achievements and the macro-economic situation in a country.
The empirical results for Namibia's progress in secondary education show that the implementation of the education reform (to correct the past) resulted into increased enrolment numbers, but unfortunately also into declining academic levels of education. This was combined with the narrowing of learners’ outputs. With these findings, we reject the hypothesis that the reform improved NSSCH levels for, in particular the disadvantaged northern regions. Only after two decades, a slow recovery of the academic levels showed positive effects. The reform response was slower than expected, and regional levels showed similar outcomes. The disaggregation of the longitudinal data support literature that education levels (in our case Namibia) partly contributed towards human capital formation and to multiply into the economic development. Specifically, since 2013, the Namibian education reform showed revised results to be associated with non-economic benefits by reducing social inequalities, and consequently promoting regional growth and productivity. These positive changes are those which the reform intended.
Perhaps as a follow up, results suggest that Namibia needs good teacher's payments. Namibia, like other developing countries will rely on continued donor funding for its education program to become effective, since huge budgets are needed. At present, most of the current education budget is assigned to cover salaries, and only 8% is left to fund development projects. The analysis shows that in particular, the development budget positively supports the academic levels of the higher secondary education and regional income tax generated. However, it cannot be taken per se to invest in education. Empirically, the Namibian results imply that especially during the first years after the reform, economic losses followed, such as reduced regional income tax (see Chang et al., 2016 and Glewwe et al., 2014), attributed to the declining performance from an average index of 132 7 in 1996 to 100 in 2018. These reduced average academic levels may have impacted on the increasing youth unemployment growth (14.2% per annum). The analysis showed that the education reform only partly corrected the past and corresponds to other educational reforms such as in Zimbabwe (Kanyongo, 2005).
Final Recommendation
The paper findings show that the educational reform contributed towards economic development at national level, while regionally, adjustments were sensed only after the new enrolment of primary learners reached high school levels. Leveling of education systems, especially in the historically disadvantaged regions, positively impacted on the country's economic development.
The study shows that the chosen method of analyzing linkages between cause and effect by means of causality, provides advantages for educational policy analysis. However, a potential logic trap may still exist in this article with the exclusion of the literature in languages other than English. This paper provides an introductory approach to bridge research gap and to find answers on the cause and effect between education and economic outcomes.
Footnotes
Acknowledgments
The authors would like to extent gratitude to the Ministry of Education for providing comprehensive annual dataset of the higher secondary education variables.
Declaration of Conflicting Interests
The authors declared no potential conflicts of interest with respect to the research, authorship, and/or publication of this article.
Funding
The authors received no financial support for the research, authorship, and/or publication of this article.