
Abstract
Objective
The primary aim was to assess the cost (£) to the National Health Service (NHS) of hospital treatment for individuals born with bilateral cleft lip and palate (BCLP), unilateral cleft lip and palate (UCLP), and cleft palate (CP), from birth to 20 years. The secondary aim was to assess the number of scheduled clinical outpatient and inpatient/outpatient surgical visits for this cohort.
Design
Retrospective micro-costing analysis.
Setting
Patients treated within the South West of England Cleft Service (UK).
Patients
Twenty-three case-notes of children born with cleft (5 BCLP; 10 UCLP; 8 CP) were identified from birth up to and including secondary alveolar bone graft (ABG), and a second group of 23 hospital case-notes (3 BCLP; 10 UCLP; 10 CP) were identified, post-ABG to 20 years.
Results
Mean costs from birth to ABG were £17,004 (BCLP), £11,620 (UCLP), and £6137 (CP), and post-ABG to 20 years were £9,463, £7,945, and £3,816, respectively. The largest costs were for staff. Repeat surgery had a significant impact on costs. The mean number of clinical outpatient visits for BCLP, UCLP, and CP were 140, 110 and 83 respectively and 8, 6 and 2 for inpatient/outpatient surgical visits, respectively.
Conclusions
Costs for provision of cleft care by the NHS are significant. The greatest costs were incurred with care for patients with BCLP. Patients were expected to attend many appointments, with BCLP experiencing the most visits. Engagement with quality improvement programmes to minimise repeat surgery, and remote consultation for certain appointments, to reduce the patient burden are recommended.
Introduction
Treatment for cleft lip and/or cleft palate (CL/P) aims to restore anatomy and function, and support psychosocial, educational, and physical development. Management begins antenatally and often extends into adulthood. This management is resource intensive, with staged and co-ordinated surgical and non-surgical care provided from a range of specialists to achieve optimal outcomes. The impact of a cleft diagnosis on the child, their family, and a publicly funded health service providing cleft care is therefore potentially considerable.
Starting from 1998, cleft care within the United Kingdom (UK) has been organised as a centralised ‘hub and spoke’ model. Multi-disciplinary teams (MDT) co-ordinate cleft care, training and audit from 11 specialist regional cleft centres (hubs), and are supported by a series of peripheral sites (spokes) and local clinicians. 1 The current cleft model was borne out of the Clinical Standards Advisory Group (CSAG) Cleft Lip and Palate Study (1998), 2 which found that CL/P care outcomes across the United Kingdom (UK) were ‘disappointing compared with some of the better European centres.’ As well as the re-organisation of care, centralisation also provided the opportunity to streamline cleft resources. Prior to centralisation, 75 cleft surgeons and 105 consultant orthodontists operated across 57 different active UK cleft teams. By consolidating care into high volume specialist centres, fewer orthodontists and surgeons were required. 3
A summary of the typical patient journey for a child now born in the UK with bilateral cleft lip and palate (BCLP), unilateral cleft lip and palate (UCLP) and cleft palate only (CP) is illustrated in Figure 1.
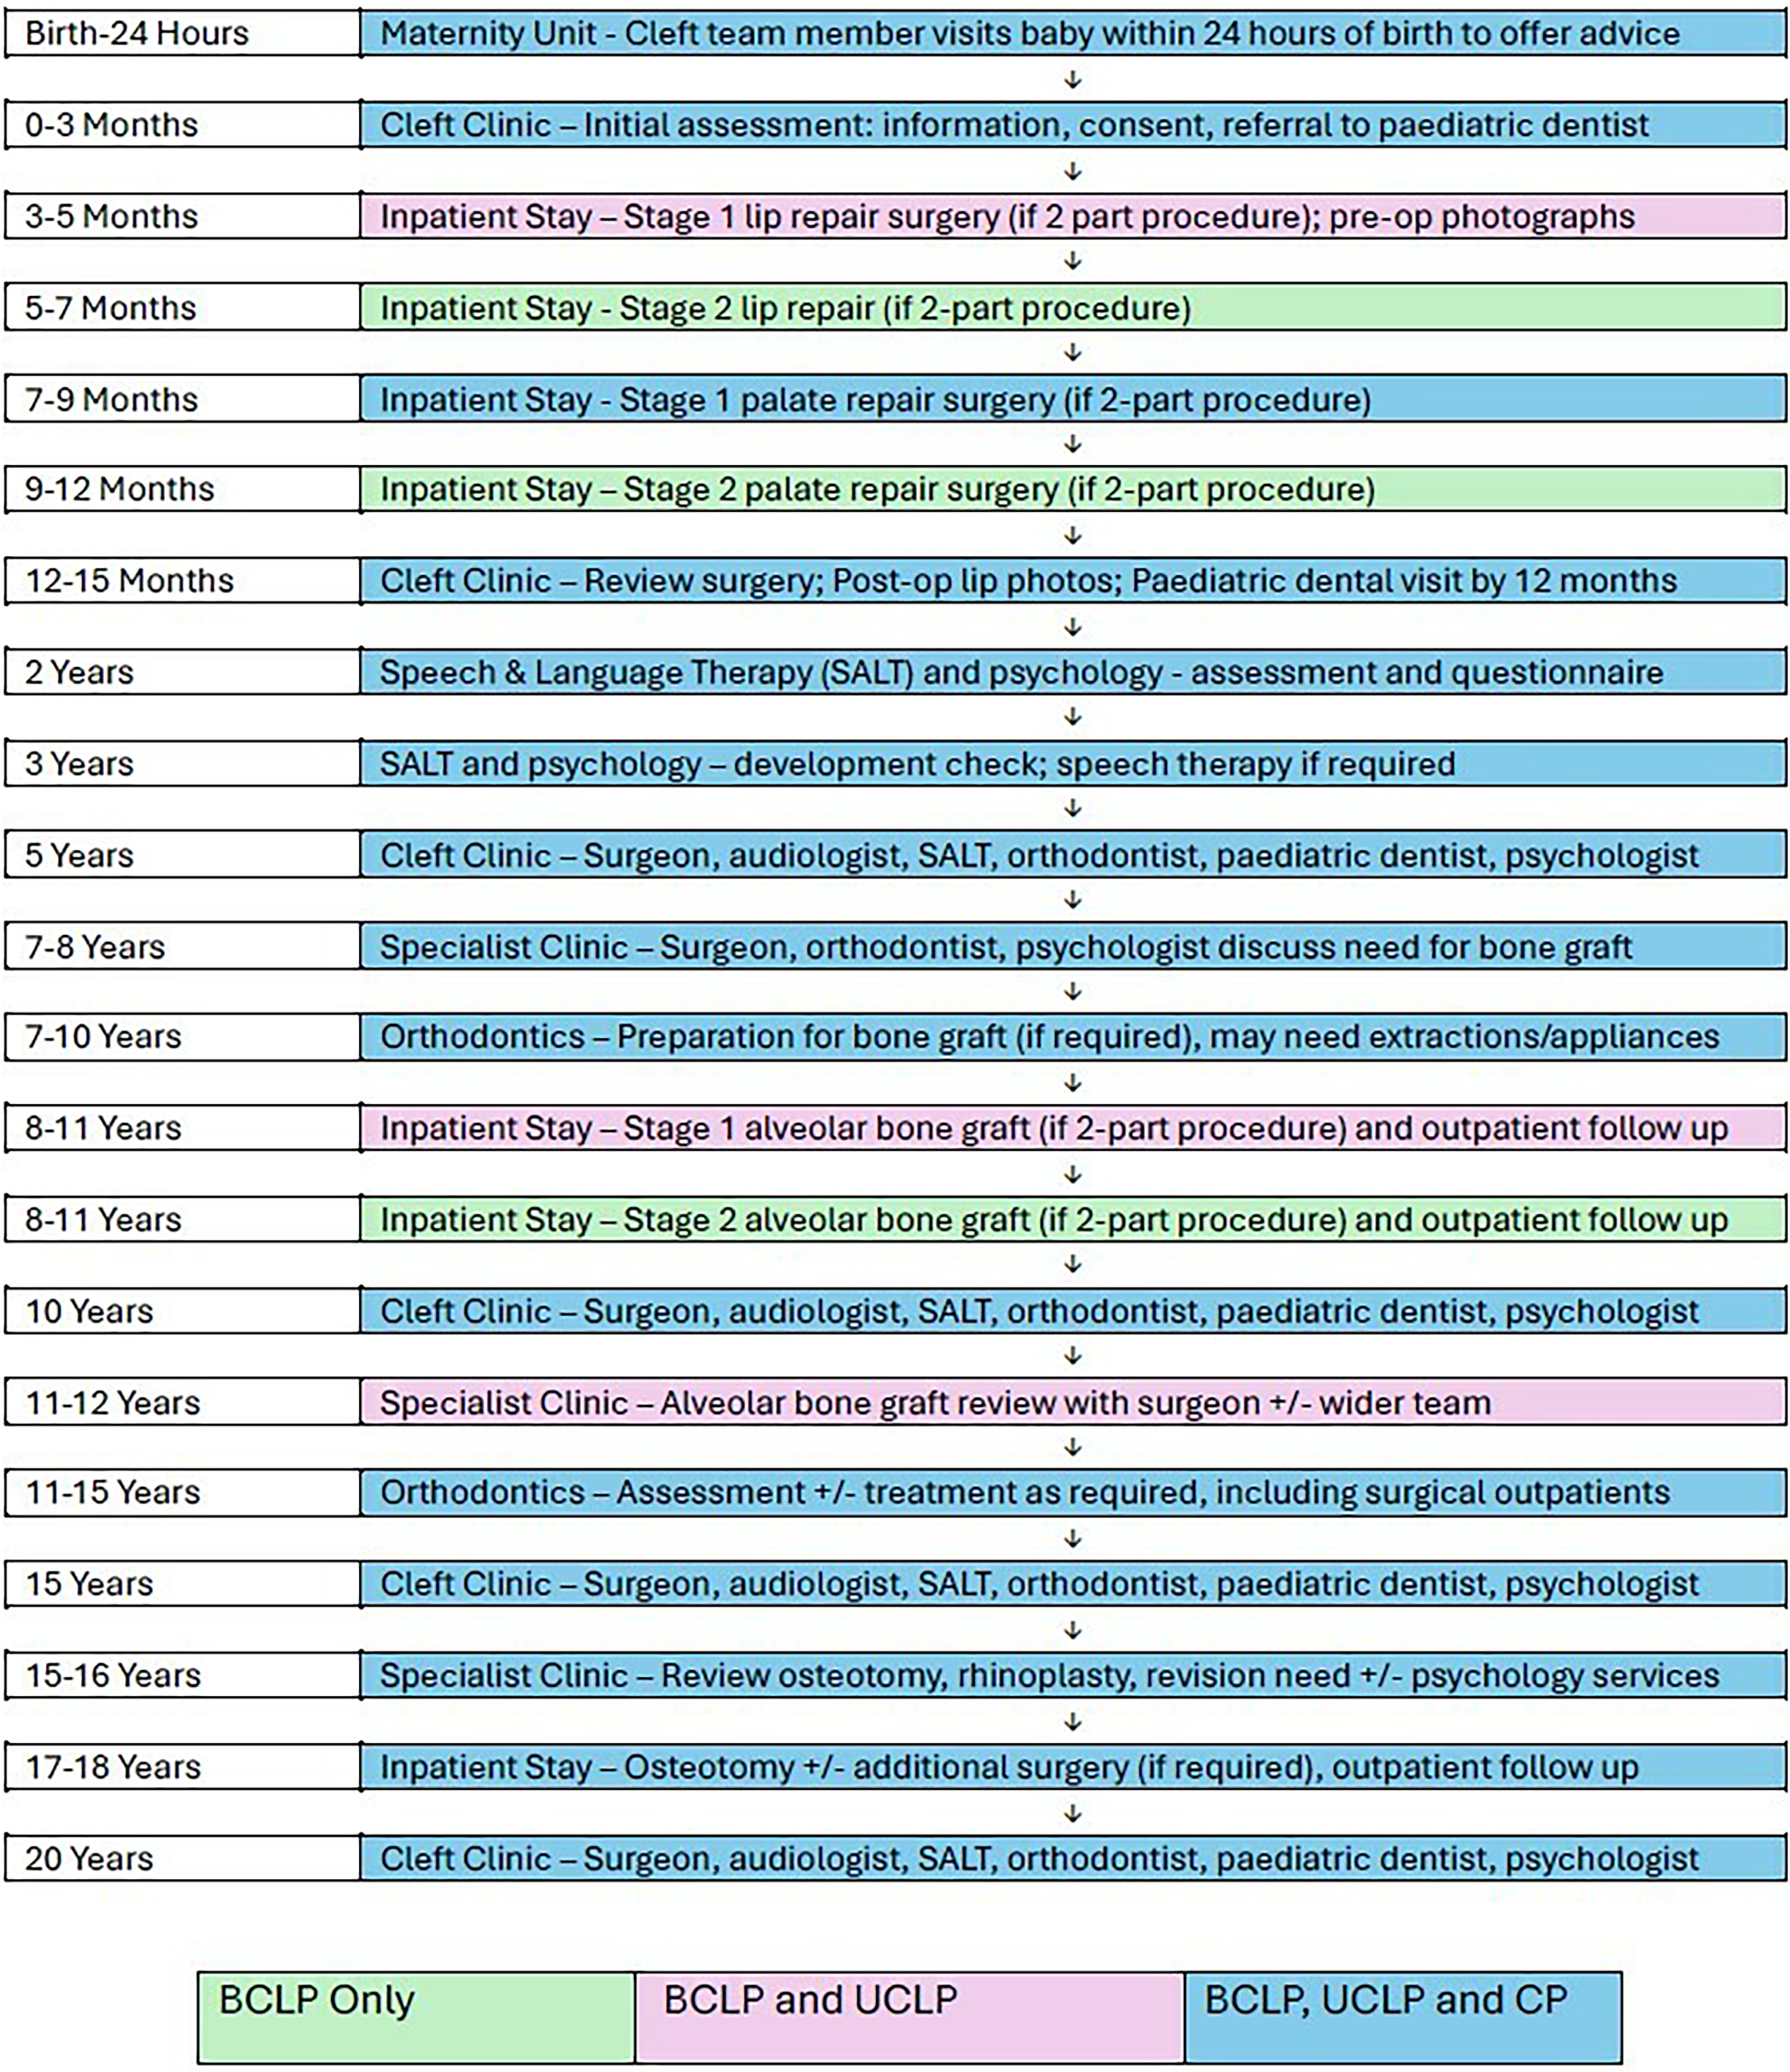
Flow diagram of the typical treatment pathways children born with BCLP, UCLP and CP. The boxes are colour-coded according to which phenotype typically undergoes each step of the pathway; green: patients with BCLP; pink: patients with BCLP and UCLP; blue: patients with BCLP, UCLP and CP. SLT: speech and language therapy; ENT: ear, nose and throat (otorhinolaryngology).
In the UK, all treatment associated with CL/P is publicly funded by the National Health Service (NHS) at the point of access and is available to all patients irrespective of the family's net worth, ability to pay or cost of procedure to be undertaken. There is no 3rd party involvement and is funded from NHS Trust commissioners responsible for their respective health care region. Although this simplifies the funding pathway, accessing services can be delayed due to demands from other NHS Trust activities. This differs from other funding pathways elsewhere which include 3rd party funding through health insurance with no or partial government and/or private funding. Cleft-related services are commissioned directly as one of the 149 ‘specialised services’. 4 Commissioning decisions are partly informed by input from the Cleft Registry and Audit NEtwork (CRANE) Database and the national Cleft Development Group. The CRANE Database collects information about all children born with cleft lip and/or cleft palate in England, Wales, and Northern Ireland, as well as analysing NHS hospital admission data; 5 as of 2023/24, Scotland has also joined the CRANE database. The Cleft Development Group provides advice and guidance to the cleft centres on all aspects of centralised cleft care delivery. 6
Health economics is a discipline that supports health care decision making by providing evidence to maximise benefits from available resources. In a publicly funded health system such as the NHS, there exists a limited ‘common’ pool of resources to meet an ever-increasing demand for care. 7 By providing insight into how healthcare is organised and financed, health economics can help lay the foundations for future healthcare improvement. 8 The CL/P pathway involves numerous appointments, across multiple specialities, over a prolonged period of time. There will inevitably be competition for resource allocation, not only across the NHS more broadly, but also within the cleft pathway itself. A deeper understanding of the pathway, from birth to 20 years, has the potential to identify improvements for patients, families, healthcare workers and NHS commissioners.
Micro-costing is a health economic method of assessing costs; it can be defined as ‘the direct enumeration and costing out of every input consumed in the treatment of a particular patient’. 9 Typically, it involves three main stages: (1) identification of resources used in the provision of care, (2) accurate measurement of each resource, and (3) valuation of these resources. 10 A UK based micro-costing analysis by Souster 11 (2017) to assess the cost of hospital based UCLP care from birth to 5 years in the South-West of England demonstrated that the majority of costs associated with this part of the patient pathway were attributable to the lip and palate repair surgeries. The mean cost of the pathway was £7076; mean costs for lip and palate surgery were £1976 and £1,610, respectively. To date, this has been the only UK-based health economic analysis of post-centralisation cleft care.
UK-based cleft-related health economics studies are rare in the literature. Mohiuddin et al. 12 (2015) performed a model-based cost-effectiveness analysis of the management of otitis media with effusion in children with cleft palate and concluded that grommet placement in this cohort was likely to be cost-effective. Alternatively, non-cleft health economic evaluations have been performed for procedures that also happen to be frequently carried out for individuals with CLP. However, fundamental differences in cohort mean these results would need to be treated cautiously if transferred to a cleft population. Kumar et al. 13 (2006) published a micro-costing analysis of combined orthodontic and surgical costs for UK-based orthognathic care. They reported median total treatment costs to be €6075.25, which included median orthodontic treatment costs of €1456.23.
Outside of the UK, Mann et al. 14 (2022) found costs of primary and secondary cleft procedures to range from US$3550.24 (for nasal alveolar moulding) to US$50,146.22 (for distraction osteogenesis, CT scan, presurgical orthodontics, and rigid external distractor frame). Ligh et al. 15 (2016) compared cumulative costs over a four-year period following initial surgery and reported that care for children born with CP was the greatest (US$106,090), followed by CLP (US$91,263), and CL (US$56,966). Abbott and Meara 16 (2011) reported the median cost of primary surgical repair for a unilateral CL to be US$12,091, which accounted for 91% of the total cleft care costs in the first year of life. Of this, US$5661 was attributable to theatre and recovery costs, US$3510 for the operating physician, and US$2605 for the inpatient stay. Boulet et al. 17 (2009) compared mean total costs, up to 10 years of age, for children born with CL, CLP and CP, whose costs were covered by employer-sponsored healthcare plans. Inpatient costs per child were similar between the groups, but outpatient costs were approximately two-fold in the CLP and CP cohorts compared with CL. A recent study by Lee et al. 18 (2022) reported wide variation in billing records of cleft team visits at an USA academic children hospital with a median (IQR) cost of $445 ($118, $749) for a single team care visit. A more recent burden of care study by Wells-Durand et al. 19 (2023) in Canada reported a large variation of total (direct and indirect) costs for patients with CLP from birth to maturity at a single hospital, which ranged from $45,874-$292,689 with a mean of $73,398. Hospital costs represented 31% of the mean cost.
The primary aim of the current study was to undertake a micro-costing analysis of the direct costs to the NHS of hospital-based care for children born with BCLP, UCLP and CP, from birth to 20 years of age in the UK, and is an extension of the initial work by Souster 11 (2017). The secondary aim was to calculate the number of scheduled outpatient and inpatient visits, to provide a better understanding of the burden of care for this patient cohort.
Methods
The study was categorised as a service evaluation by the University Hospital Bristol and Weston NHS Trust and ethical approval was ratified by the Caldicott Guardian on 12th April 2018. For the micro-costing component, the perspective of the study was that of the health care provider, which in this case was the NHS.
Patient Identification
In collaboration with members of the South West of England Cleft Team, hospital care pathways were mapped for children born with BCLP, UCLP and CP only from birth to 20 years. Patient records of those individuals treated by the Cleft Team were included or excluded in the study according to the following criteria:
Inclusion:
Patients born with either BCLP, UCLP or CP
Patients who would have received their cleft care following cleft service centralisation (1998)
Exclusion:
Patients diagnosed with a syndrome associated with the cleft, or with co-morbidities
Patient identification and data collection was separated into two cohorts: (1) birth to secondary ABG and (2) post-ABG to 20 years of age. Different cohorts were used for these two data groups to ensure that all recorded care was delivered post-centralisation of UK-based cleft care. The aim was to collect 10 sets of hospital patient records for each of the three cleft phenotypes, per cohort. The number of cases was determined following advice from a university-based health economist and the expectation that the analysis of 10 cases per cleft type was achievable within the time constraints of the study. In the younger cohort, 23 sets of patient treatment notes were found that satisfied the inclusion criteria (5 BCLP, 10 UCLP, 8 CP). In the post-ABG cohort, 23 sets of patient treatment notes were found to meet the criteria (3 BCLP, 10 UCLP, 10 CP).
Data Collection
Inpatient and outpatient activity was recorded as well as associated administration, such as letter dictation. Information on the specialty and grade of the treating clinicians, the date and location, patient (non)attendance and activity duration (in minutes) was recorded for each activity. The data were analysed using Stata Version 16 (Stata Corp, College Station, USA).
Missing Data
Considerable care was taken during data collection to identify all reasonable cost sources. Patient notes were scrutinised in detail and information cross-referenced across clinical notes, surgical summaries, and patient letters. Any ambiguity in the case records was discussed with the Clinical Director of the cleft service. In some cases, this process made it evident that information was missing. The speech and language therapy (SLT) and ear, nose and throat (otorhinolaryngology, ENT) teams kept their own clinical notes separate to the main clinical record; these records were requested and included. Patients who had received some of their care in a peripheral hospital would often have notes stored locally, including: Royal United Hospitals, Bath; Gloucestershire Royal Hospital, Gloucester; Musgrove Park Hospital, Taunton, and Yeovil District Hospital, Yeovil. Formal requests were made to these hospitals for the missing information, all of which were successful.
Non-Attended Appointments
Appointments that were cancelled by the patient at short notice, or unattended, were costed as if the patient had attended. It was deemed that the clinical time associated with this activity could not be re-allocated, meaning the NHS absorbed the cost as if the patient had attended.
Unit Cost Identification
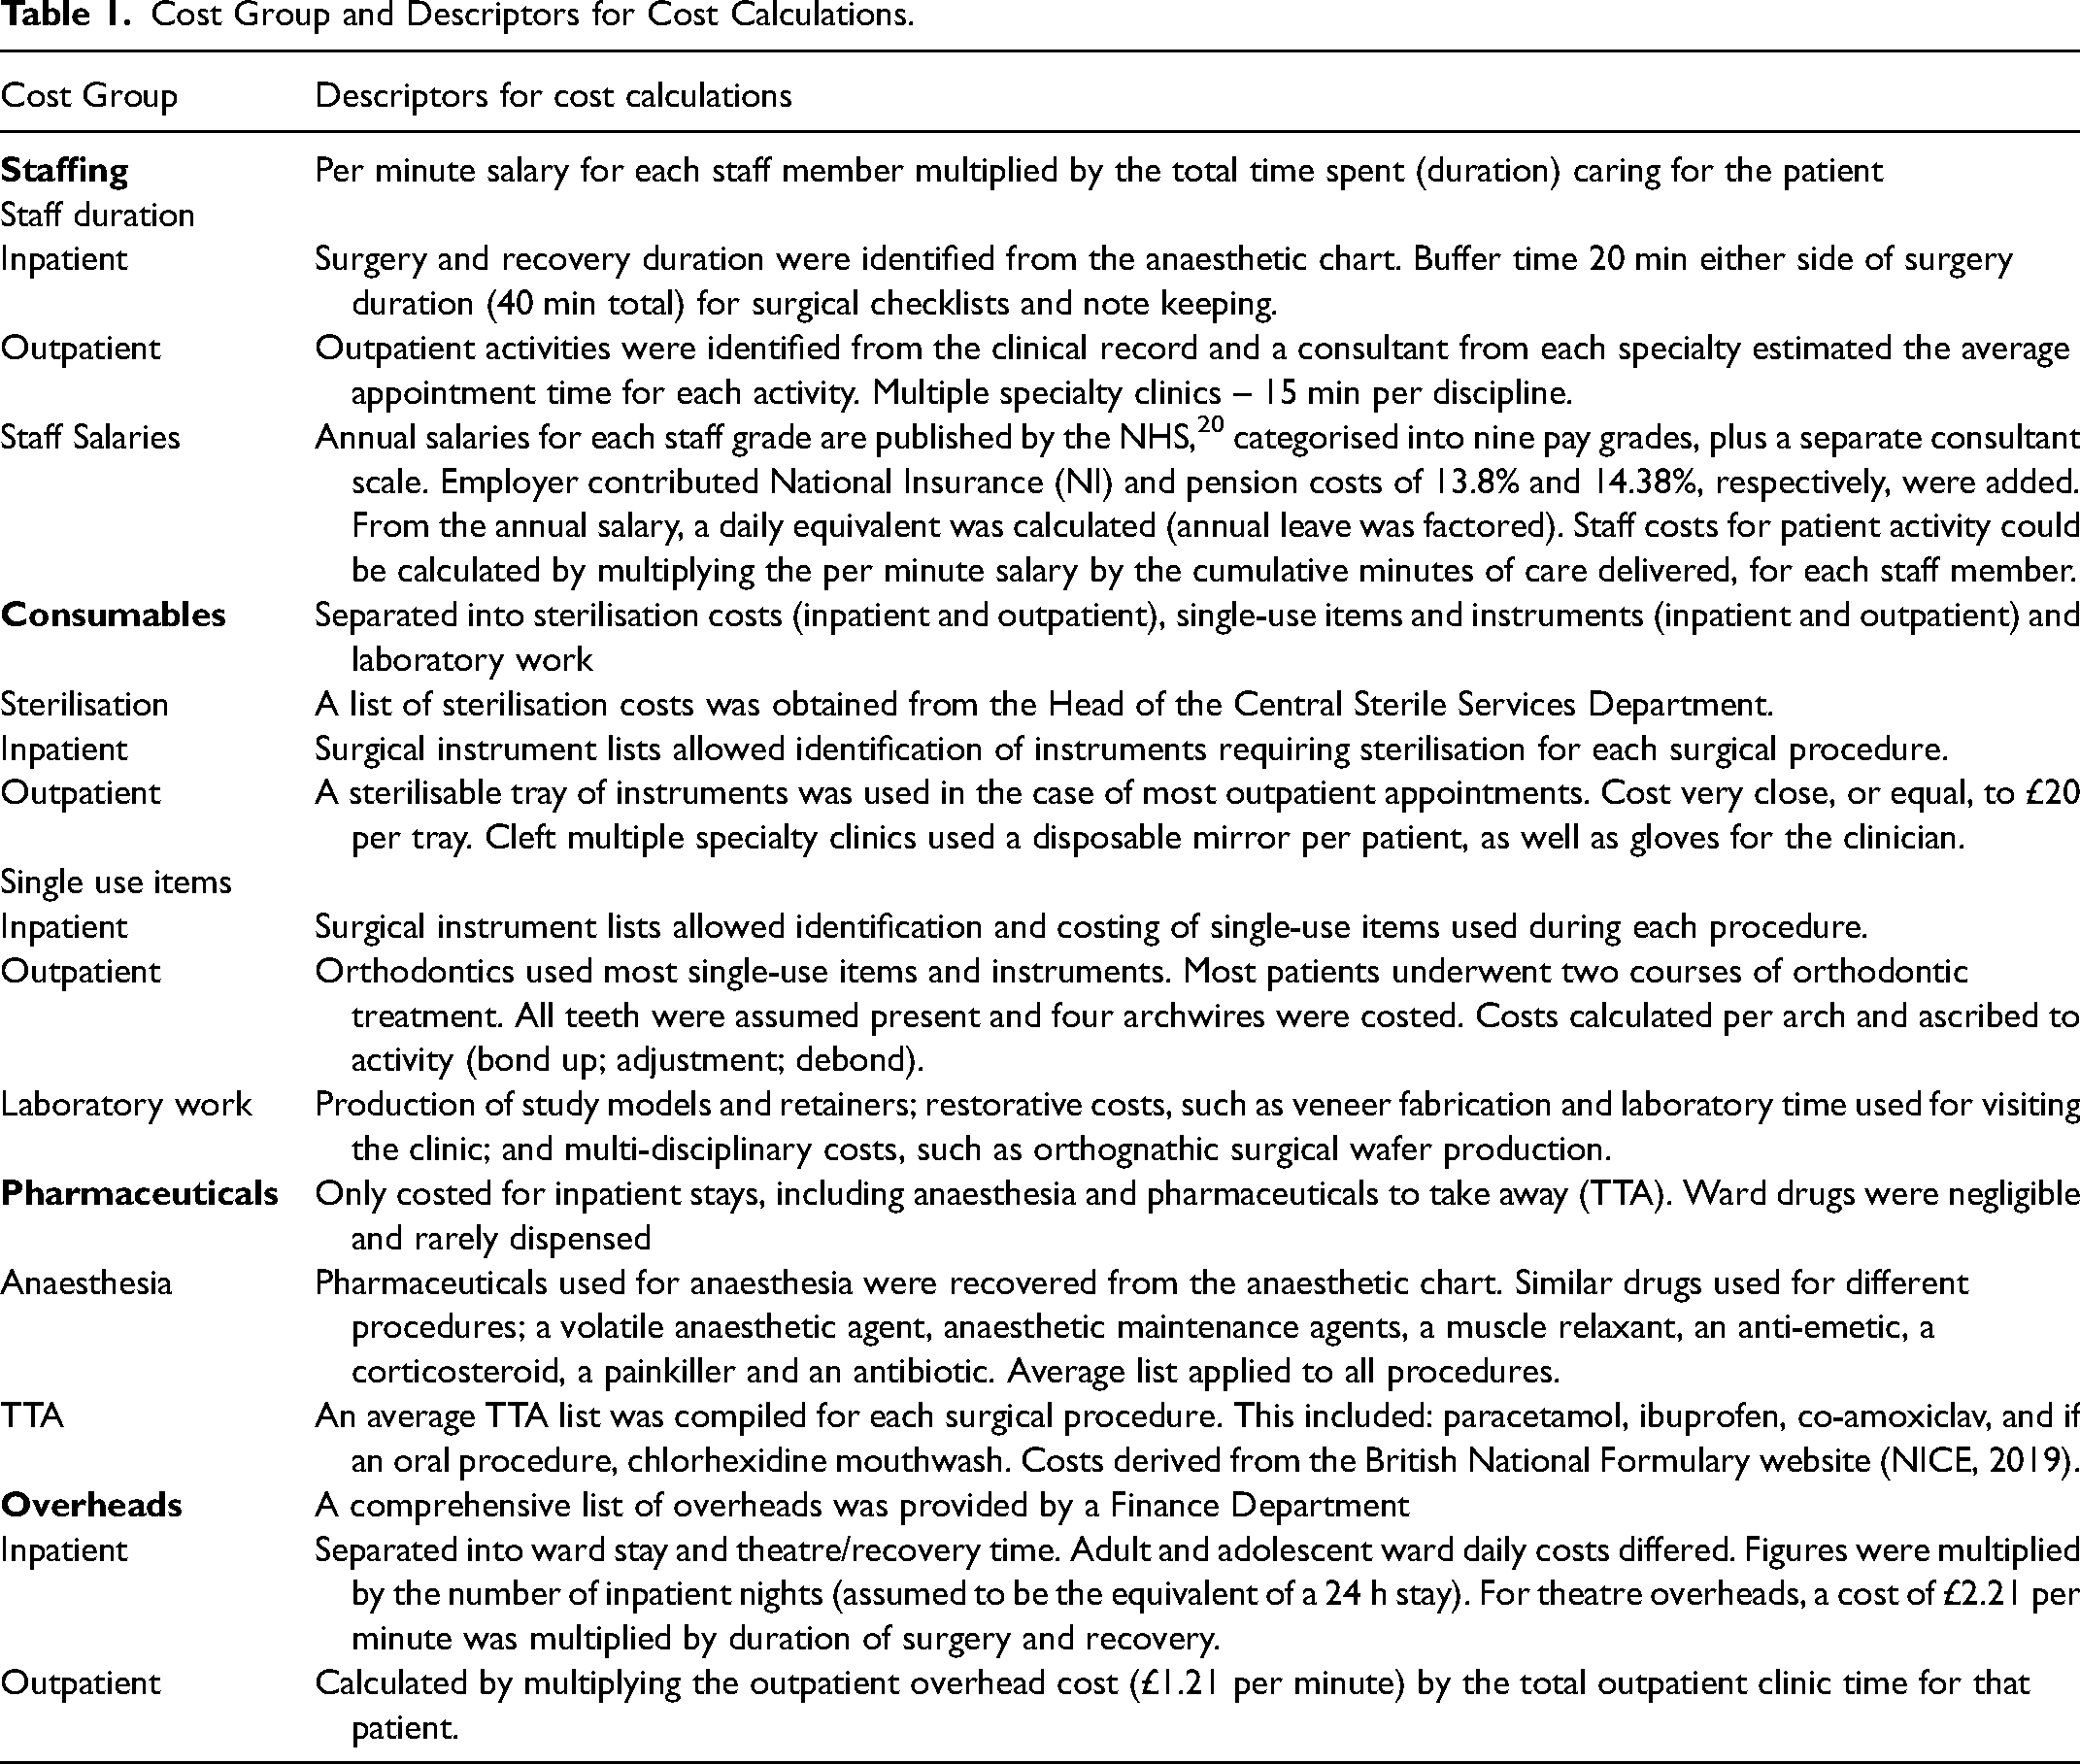
The cost of the cleft pathway for each individual was calculated by attributing unit costs (2019 cost year) to each activity. Costs were separated into groups to simplify the identification and collection of the information. Based on previous research (Souster 11 and Kumar et al. 13 ) the following groups were adopted: staffing, consumables, pharmaceuticals and overheads (Table 1).
Cost Group and Descriptors for Cost Calculations.
Statistical Analysis
Descriptive statistics were used due to differences in data availability from 0–10 years and 10–20 years. Mean costs and standard deviations were derived for each cleft phenotype, cost category and numbers of outpatient and inpatient contacts.
Results
Micro-Costing of Hospital-Based Cleft Care
Mean hospital care costs for children born with BCLP, UCLP and CP from birth and secondary ABG age were £17,004 (SD £7362), £11,620 (SD £2548), and £6137 (SD £2320), respectively. Mean costs for adolescents with BCLP, UCLP and CP from post-ABG to 20 years of age were £9463 (SD £6897), £7945 (SD £4786) and £3816 (SD £1809), respectively. The ratio of costs between phenotypes (BCLP:UCLP:CP) was close to 3:2:1 in both age groups.
Inpatient vs Outpatient Care Costs
Inpatient costs dominated from birth to ABG. Generally, this younger cohort underwent more surgical procedures and experienced longer inpatient stays. Outpatient costs were greater in the post-ABG to 20 years cohort, when individuals typically began attending many more appointments in the outpatient setting, such as orthodontic and restorative dental treatment.
A clear pattern emerged, evident in Figure 2; BCLP costs exceeded UCLP costs, which in turn exceeded CP costs. This was the case in both the younger and older age cohorts, with total costs as well as standalone outpatient and inpatient costs too.
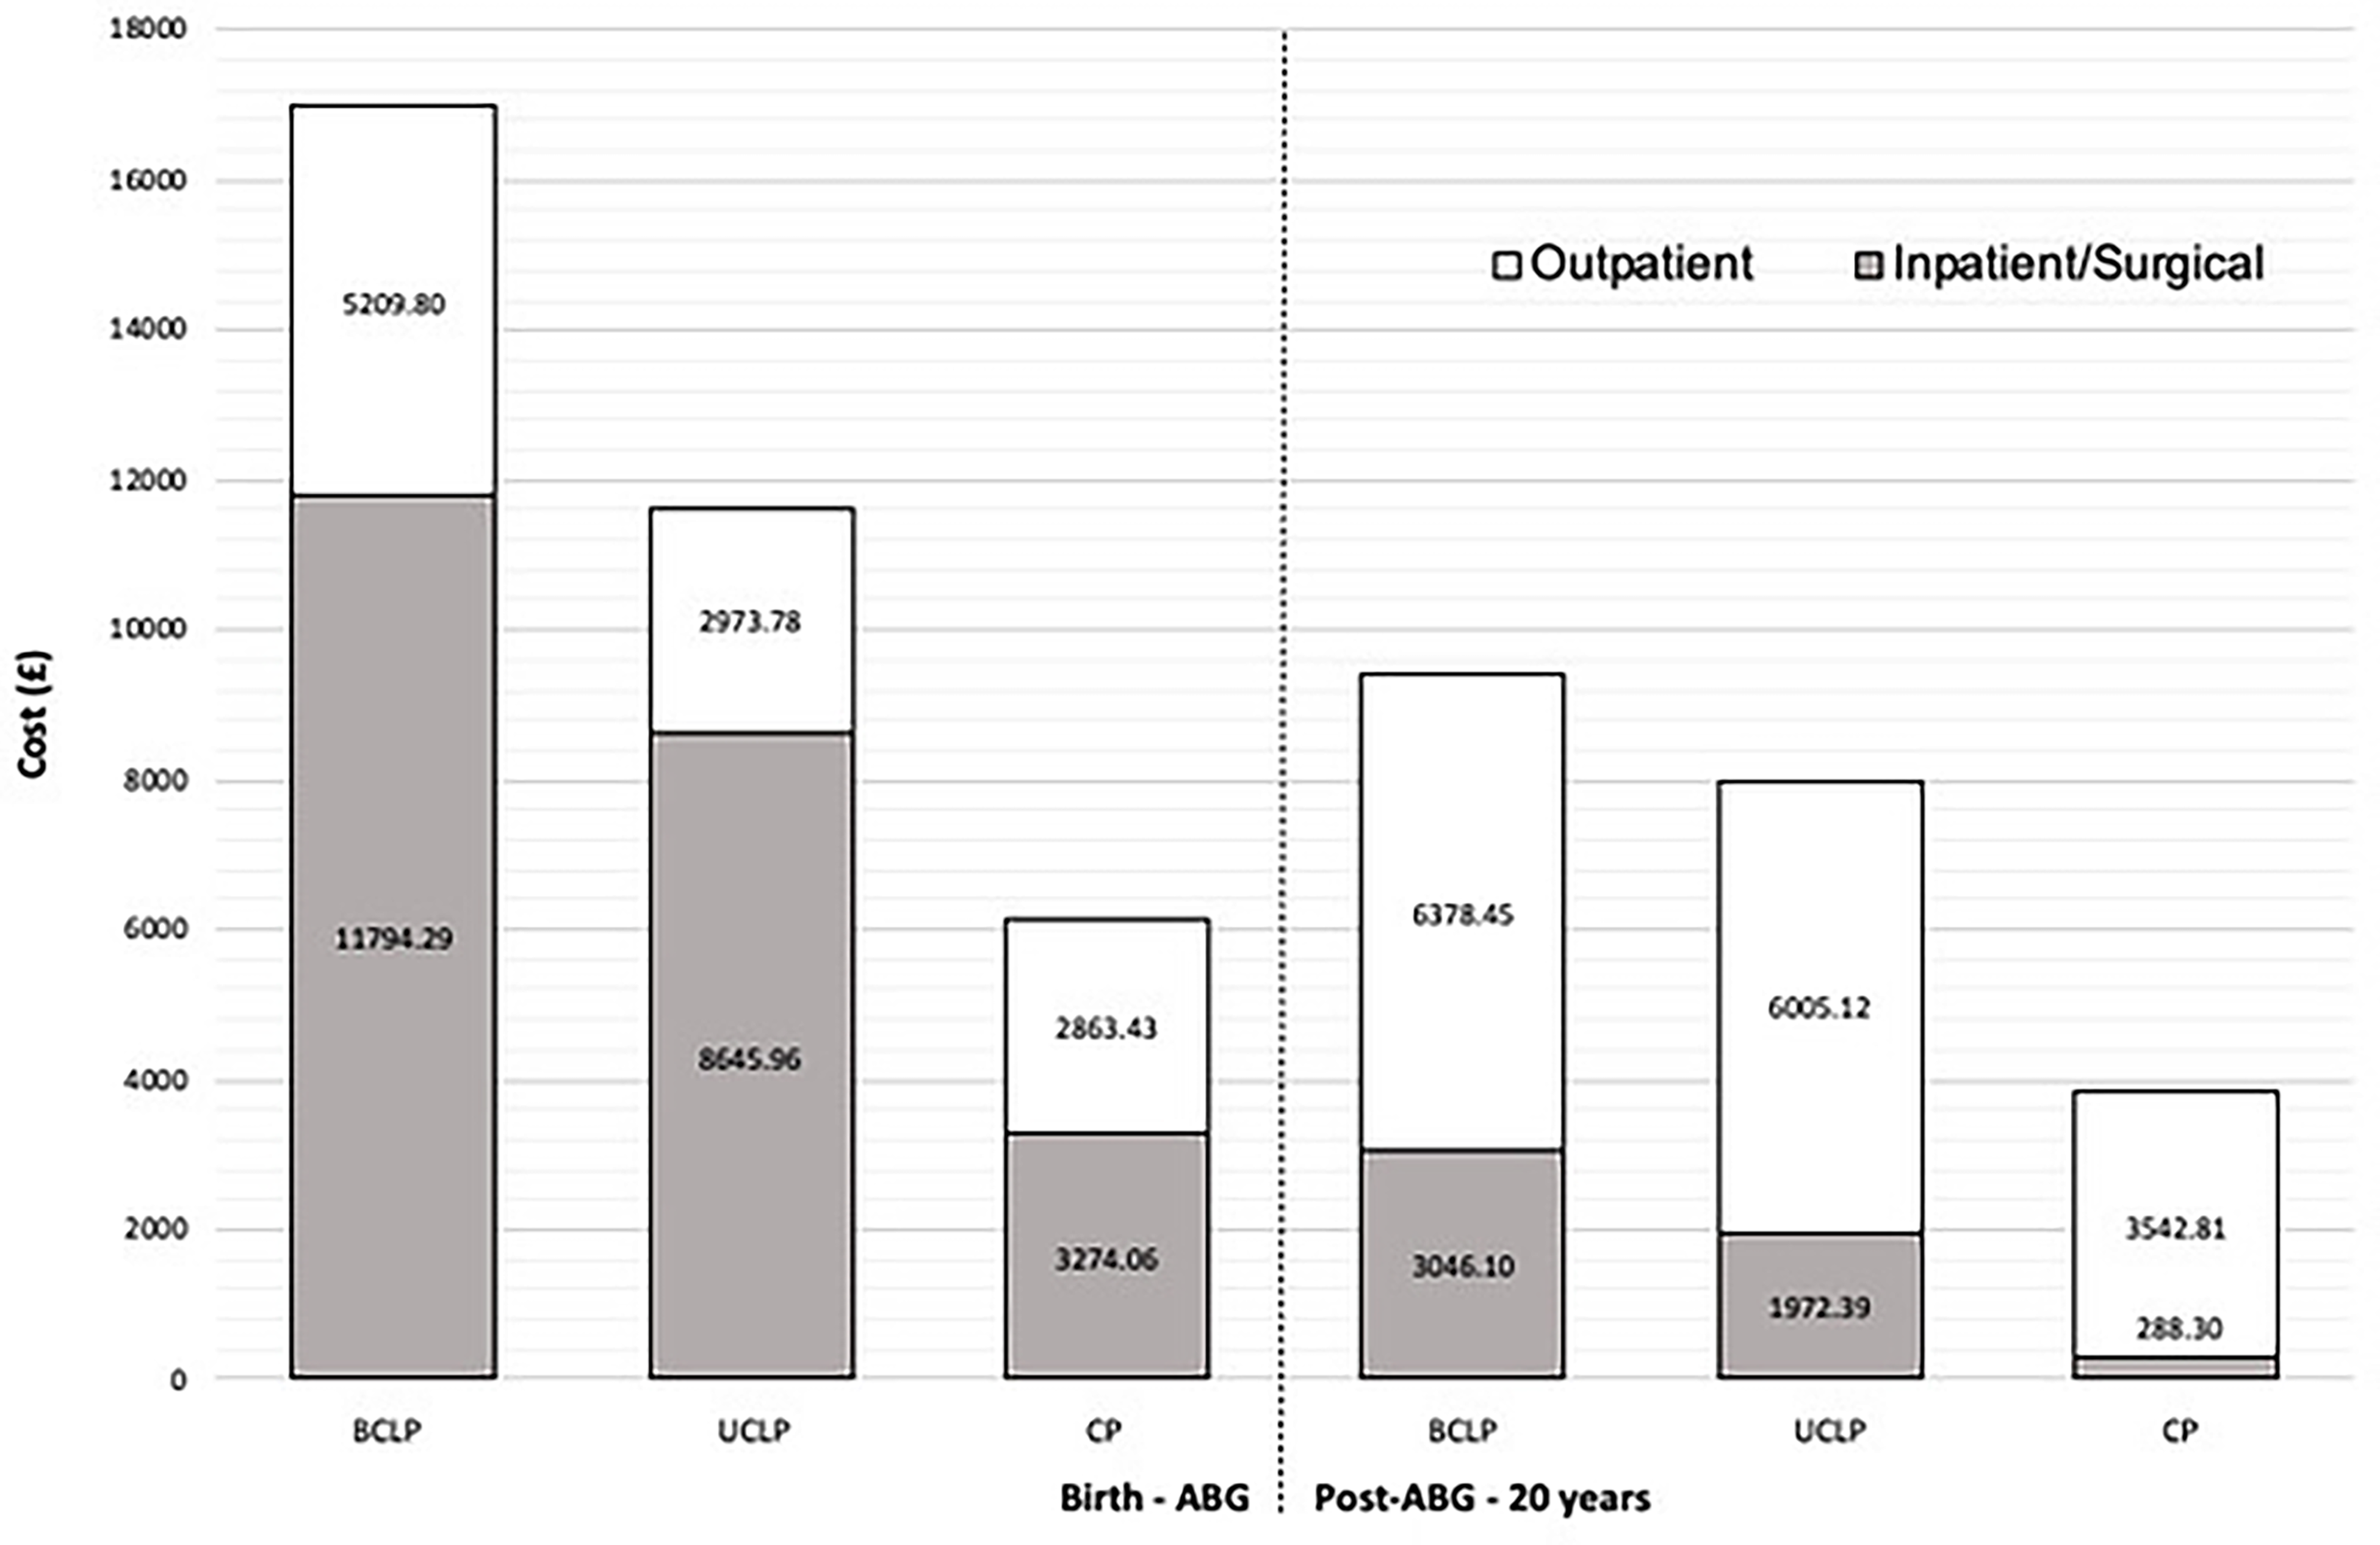
Mean inpatient and outpatient costs (£) for each phenotype from birth to ABG (left-hand side of the dotted vertical line) and post-ABG to 20 years (right-hand side of the dotted vertical line). The grey portion of the box includes costs for any inpatient or daycase surgical procedure, and the white portion of the box includes costs for any outpatient clinical visit.
Comparing across age cohorts, outpatient costs were almost 50% greater in the post-ABG cohort (£15,926.38) than the birth to ABG cohort (£11,047.71). This was largely due to orthodontic treatment being carried out in the older cohort. Most other outpatient appointments, such as cleft audit clinics, speech investigation clinics, and paediatric dental appointments, were similar in cost between age groups.
Inpatient costs were over four times greater in the birth to ABG cohort (£23,714.31), relative to the post-ABG cohort (£5306.79). More than twice as many inpatient procedures were performed in the birth to secondary ABG cohort (80 procedures) compared to the older cohort (38 procedures).
Cost Types
The greatest costs across all phenotypes were for staff, followed by overheads, consumables, and lastly pharmaceuticals. Mean staff costs in the birth to secondary ABG cohort accounted for 49% of the total cost of all surgical procedures. This is compared with 31% for overheads, 20% for consumables, and <1% for pharmaceuticals. In the post-ABG to 20 years cohort, the pattern was similar; mean staff costs accounted for 39%, overheads 34%, consumables 27%, and pharmaceuticals 1%.
Consumable costs varied significantly depending on the procedure performed. For example, consumables for alveolar bone grafting, which involves relatively expensive collagen-based graft materials, accounted for 42% of the total procedure costs. By contrast, consumables for a primary palate repair, which involves relatively less-complex equipment and materials, accounted for 17%. It is interesting to note that mean staff costs for these two procedures were similar, at £997.32 and £1030.42 respectively.
Repeat surgery had a marked impact on total cost. For example, the most expensive (mean) surgical procedure in the birth to secondary ABG cohort was the alveolar bone graft (£2824.30). Because the distinction between the two cohorts was made at the point of secondary ABG, any repeat ABG procedures fell into the post-ABG to 20-year cohort. Two patients in this older cohort had repeat ABG, with a mean additional cost of £2472.00 per procedure. Similarly, the most expensive (mean) surgical procedure in the post-ABG group was osteotomy (£2743.00). One individual with BCLP required a repeat osteotomy, and the additional cost of this procedure had a marked effect on the total cost for this patient.
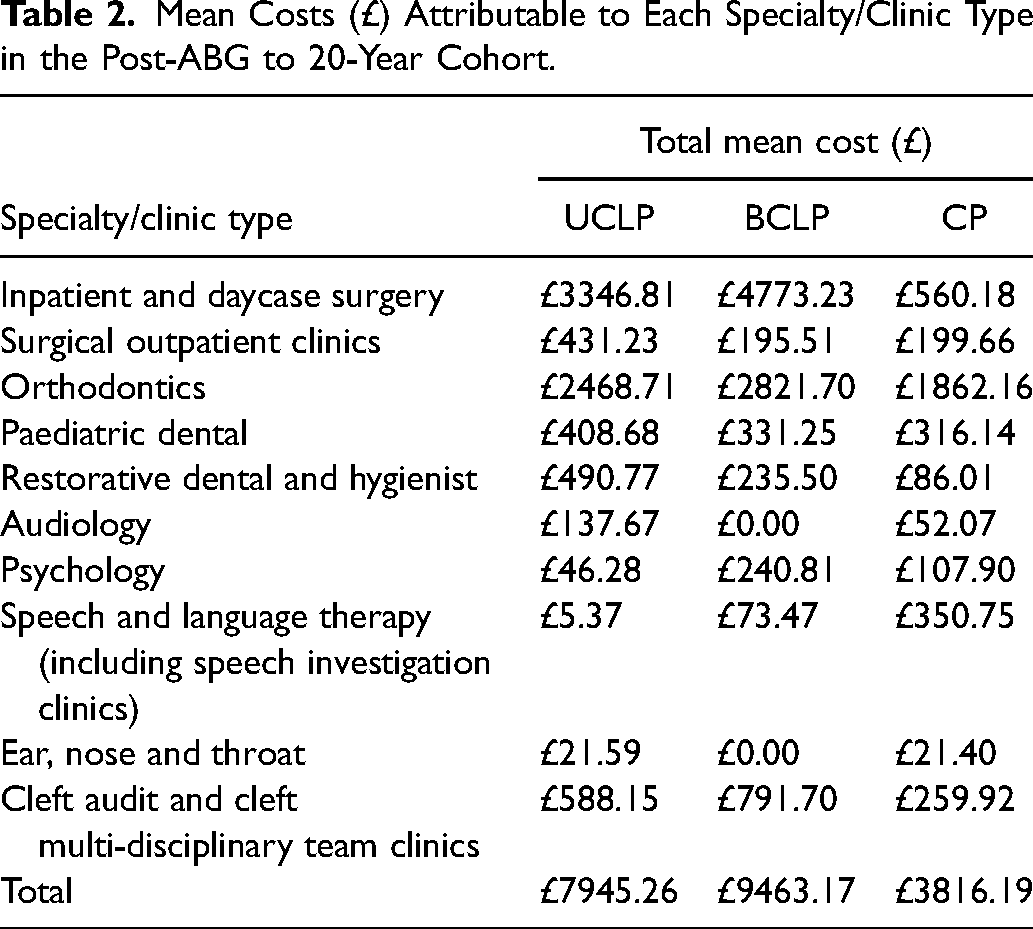
Orthodontics was the largest outpatient cost across all phenotypes. The mean orthodontic treatment cost was £2384.33. This was greatest in the BCLP group (£2821.70), followed by UCLP (£2468.71), and CP (£1862.16). Those with BCLP and UCLP were more likely to have two courses of orthodontic treatment, with the second course often being as part of their orthognathic treatment. Since all episodes were individually micro-costed, the second course of orthodontic treatment resulted in a marked increase in total cost for those individuals who underwent this treatment. Table 1 shows a breakdown of costs in the post-ABG to 20 years cohort, by specialty/clinic type.
Number of Inpatient/Outpatient Appointments
Tables 2, 3 and 4 show the minimum, mean and maximum number of scheduled clinical outpatient appointments and inpatient/outpatient surgical episodes for all three phenotypes across both the birth-ABG cohort and the post-ABG to 20 years cohort. Although the combined pre-ABG and post-ABG figures do not represent a single patient journey, it is useful to convey the number of appointments for those with the most convoluted journeys. These data showed that the patients with the most complex journeys may be expected to attend in the region of 200 outpatient appointments over the course of their cleft journey.
Mean Costs (£) Attributable to Each Specialty/Clinic Type in the Post-ABG to 20-Year Cohort.
Minimum, Mean and Maximum Appointment Numbers for Clinical Outpatient Visits Across All Three Phenotypes.
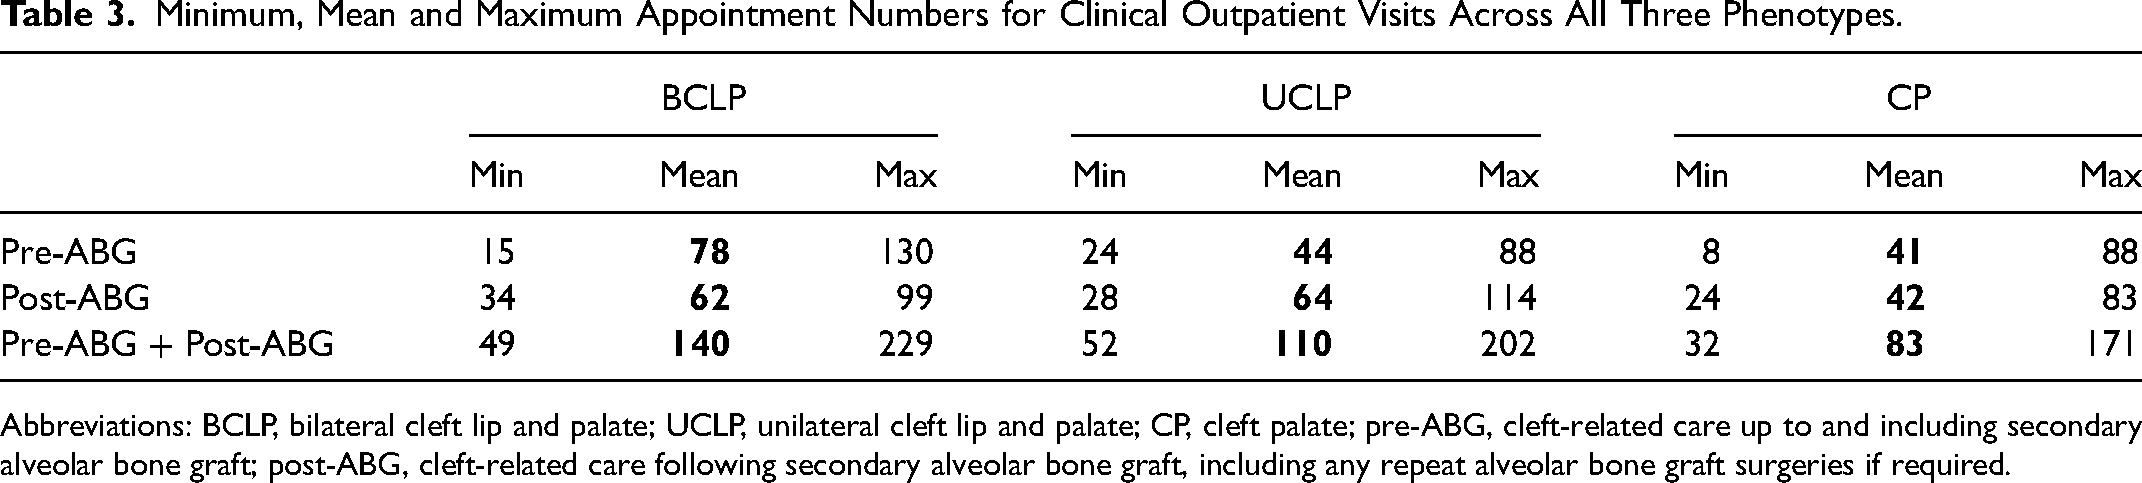
Abbreviations: BCLP, bilateral cleft lip and palate; UCLP, unilateral cleft lip and palate; CP, cleft palate; pre-ABG, cleft-related care up to and including secondary alveolar bone graft; post-ABG, cleft-related care following secondary alveolar bone graft, including any repeat alveolar bone graft surgeries if required.
Minimum, Mean and Maximum Appointment Numbers for Inpatient and Outpatient Surgical Visits Across All Three Phenotypes.
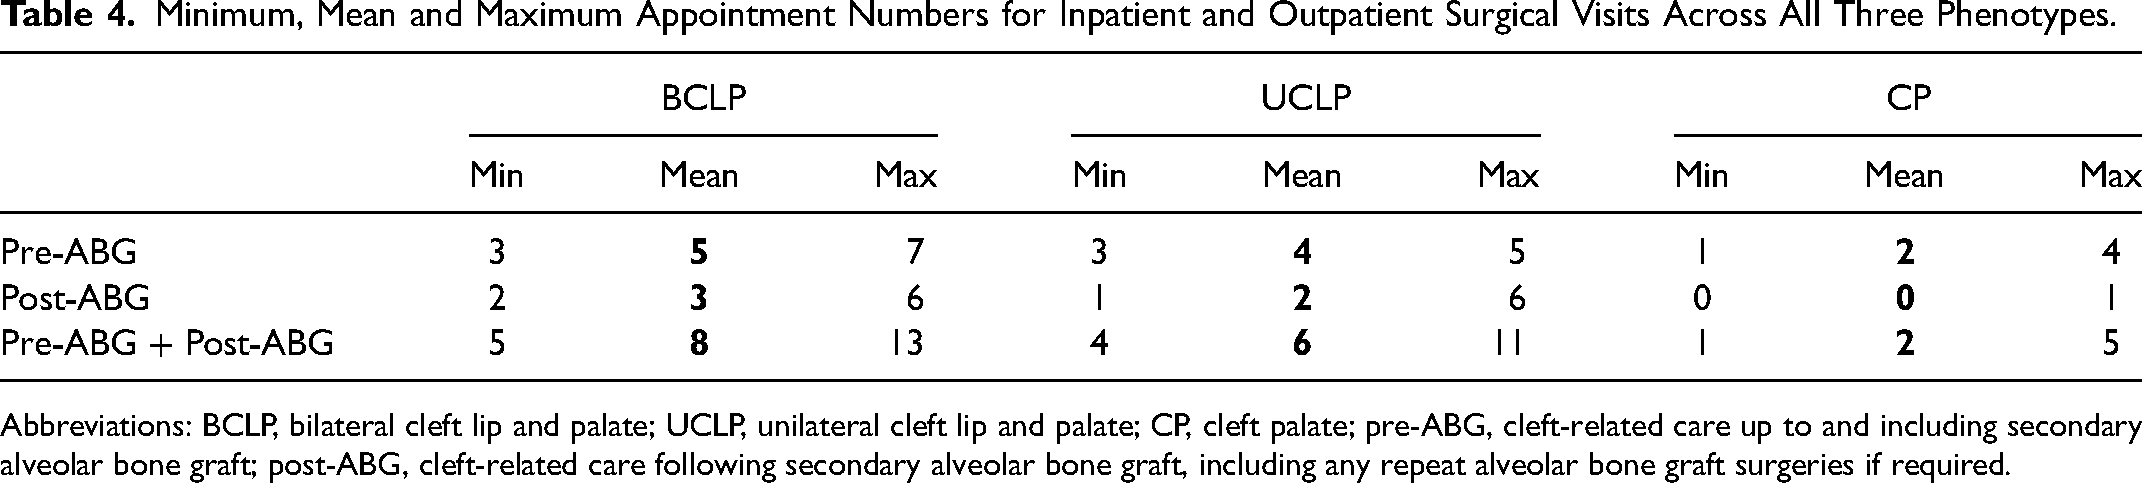
Abbreviations: BCLP, bilateral cleft lip and palate; UCLP, unilateral cleft lip and palate; CP, cleft palate; pre-ABG, cleft-related care up to and including secondary alveolar bone graft; post-ABG, cleft-related care following secondary alveolar bone graft, including any repeat alveolar bone graft surgeries if required.
The BCLP cohort had the greatest mean number of scheduled appointments overall. On average, this patient group underwent more inpatient/outpatient surgical procedures both from birth-ABG and post-ABG to 20 years, than patients with UCLP and CP. They also had around 75% more clinical outpatient appointments than the UCLP and CP cohorts, in the birth to ABG age group. In the post-ABG group, individuals with UCLP and those with BCLP attended a similar number of clinical outpatient appointments.
Discussion
The primary aim of this study was to determine the costs to the NHS of providing multi-disciplinary care to children born with BCLP, UCLP and CP, from birth to 20 years of age in the UK. Costs were calculated using established health economic concepts; specifically, the micro-costing method was used to identify costs for inpatient and outpatient activity across the breadth of the hospital-based, cleft-related multi-disciplinary care pathway. Costs within each specialty and within each setting were split into staff, overheads, consumables and pharmaceuticals.
Largest Cost Factors – Cleft Phenotype and Repeat Surgery
This study found that costs associated with BCLP care were greater than for UCLP, which in turn was greater than for CP care. This is true from birth to 20 years, and also true from birth to secondary ABG and from post-ABG to 20 years. Staffing was the largest cost component, followed by overhead costs, consumables, and lastly pharmaceuticals, which made up a very small component of total costs. Costs associated with the multi-disciplinary teams varied between the three phenotypes. In the BCLP and UCLP cohorts, the largest costs were associated with surgery, although orthodontic outpatient costs also accounted for a large proportion of total costs. In the CP cohort, where surgical interventions were fewer, orthodontic costs were predominant. Due to the significant cost associated with surgical procedures found in this study, repeat surgery in any cohort had a marked impact on the total cost. The cost of SLT for the CP group was larger than the other cleft subtypes and was a reflection of an anomaly where one child with CP received extensive and prolonged speech therapy for over 12 months following a palatoplasty. All children with CP, UCLP, BCLP had surgical palate closure. A palatoplasty was an additional surgical procedure undertaken to improve speech and this required extensive and prolonged speech therapy postoperatively to optimise the surgery. It was an operation undertaken where there the anatomy of the palate required modification to improve speech. Not all children with cleft palate required any surgery beyond primary palate closure. Overall, total clinical outpatient costs compared similarly with total inpatient/surgical outpatient costs across all three phenotypes; this is despite outpatient appointments being markedly more numerous, where 95%-99% of all hospital attendances across all three phenotypes were for non-surgical outpatient visits.
Inpatient and Outpatient Episodes – Complexity vs Volume
Collectively, the findings from this study suggest that the greater the number and the more complex the interventions provided, the greater the cost to the NHS. This was not surprising, but it is still an important finding as it helps to clarify where and why cost-improvements might be achievable. Inpatient care tended to consume a large amount of the more-costly resources, such as expensive materials, theatre time, and larger multi-skilled teams. So, whilst inpatient interventions were typically few, when repeat surgery was required the additional cost implication to the NHS was considerable. However, while individual outpatient care was less costly, often involving less expensive materials, shorter appointments, and smaller teams, the high number of outpatient appointments in the cleft pathways studied elevated the total cost of outpatient episodes close to that of inpatient care; this was true for all three phenotypes.
Value of the Cleft Pathway
The patient pathways in this study largely followed the well-established and robust pathways for cleft care that have become the norm in the UK following care-centralisation. When compared with other UK-based micro-costing studies on conditions with similar longitudinal pathways, such as for type 1 diabetes 21 and cystic fibrosis, 22 the findings of the study demonstrate a service that is relatively low cost. Most notably, rather than any significant departure from current practice, the largest benefits are likely to be gained from effective use of resources within the current system, to avoid additional burden on the health service or patients. Two key recommendations are to strive, where possible, to minimise repeat surgery, such as through the use of Quality Improvement Programmes, and to make efforts to minimise the appointment burden for patients, such as with the use of remote consultation where practical.
Reducing the Burden of Outpatient Attendances
The number of scheduled outpatient appointments found in this study were, for most patients across most phenotypes, considerable. It is particularly important to note that these appointments occurred at a busy and formative period of a young person's life and at a time when families were likely to also have other young children to care for. The findings hopefully demonstrate the burden placed on patients and their support network to attend appointments regularly and largely without fail. It should be the role of healthcare professionals, where possible, to acknowledge and reduce that burden.
Historically, remote consultation was feasible but not widely adopted, partly because there had been no great need to change the status quo. The changing face of medicine in response to the COVID-19 pandemic has brought with it many useful adaptations to normal working practice, one of which being the significant technology investment in remote consultation platforms, coupled with a greater open-mindedness and skill within the medical and dental profession, as well as with patients, to use these platforms. According to a recent Australian study by Teoh et al. 23 (2018) on the economic evaluation of tele dentistry, the mean provider costing of remote dental consultations for children with cleft were approximately 47% less than onsite consultations. Now is an appropriate time to translate this knowledge and take hold of the opportunities and strengths hard won by the healthcare profession during the COVID-19 pandemic. The introduction of remote consultation is a realistic and practical solution to the significant burden placed on patients with cleft and, at the same time, should help to reduce the financial burden shouldered by the NHS for missed appointments. Clearly, not all appointments can be managed remotely, but there is an increasing appreciation of the role that remote consultation can play in medicine and dentistry. 24 In particular, remote consultation has become popular with certain review appointments, such as orthodontic retainer reviews and genetic counselling, and there are companies that can now provide equipment to facilitate remote monitoring of orthodontic appliances.
Limiting Repeat Surgery
There is a requirement to limit the need for repeat surgeries (one and done approach). Quality Improvement Programmes are a well-recognised approach to improving the efficiency and the effectiveness of procedures and systems. In the UK, Getting It Right First Time is one such national programme ‘designed to improve the treatment and care of patients through in-depth review of services, benchmarking, and presenting a data-driven evidence base to support change’. Clearly, all surgeons aim to achieve the highest standards for their patients, and any need for repeat surgery is typically not reflective of skill, or effort, of the surgeon or practitioners involved. Evidence from the Getting It Right First Time programme has demonstrated that disparities in outcome across units is often attributable to small but significant variations at all levels, from Trust behaviour through to clinical technique. 25 In this way, Quality Improvement Programmes aim to elevate underperforming teams, units or centres to the level of the highest. Avoiding even a single repeat surgery is likely to make a marked difference to total costs to the health service provider, as well as significantly reducing the psychological and physical burden for the patient and their family.
Strengths and Limitations
Micro-costing specific areas of activity is helpful but the overall costing is incomplete and will require more extensive data. Clinical Nurse Specialists and foetal medicine specialists for example will be involved in cases diagnosed antenatally and may have five or six contacts before birth. These activities are not recorded as discrete financial entities anywhere routinely. The routine care of a significant portion of cleft children involves geneticists, clinical psychologists, paediatricians and paediatric cardiology and this needs a wider costing approach. Moreover, some cleft centres have arrangements where some of the care is devolved to care providers (SLT, clinical psychology, orthodontics) more local to the patient. These costs are not discrete and need to be recognised in the overall costs of care.
Data collection and cost calculation methods were applied scrupulously to try to achieve as comprehensive a picture as possible. However, there remain limitations of the study that may have influenced the accuracy of the findings. The authors acknowledge that missing data is a limitation of this study. Missing data was uncommon but where present included data absent from the clinical notes and an inability to access certain records, such as those from community care settings. Because NHS costings were used in this study the findings are potentially applicable to other NHS funded units, although some treatment protocols may differ. As this study used data from a a single centre, the generalisability to other cleft units may be limited, considering the variability in treatment protocol between cleft units, both within the UK and internationally.
Future Work
Although the costs of cleft care incurred by the NHS have been assessed, these will need to be referenced to the overall burden of care. Focusing on direct and indirect costs incurred by patients and families in the UK would provide invaluable insight into our patients’ journeys, as part of their cleft care pathways and the assessment of the total burden of care.
Conclusions
Costs for provision of cleft care by the NHS are significant and vary, based on the care provided. The greatest costs were incurred with BCLP care. Patients were expected to attend a large number of appointments; those with BCLP typically had the most visits. Efforts to minimise repeat surgery, and the implementation of remote consultation are recommended, where practical.
Footnotes
Acknowledgments
We wish to acknowledge that Prof Martyn Sheriff provided valuable guidance and direction with the statistics. Senior cleft surgeons, Mr Per Hall and Mr Peter Hodgkinson provided deep insights and thoughts on study direction and limitations.
Declaration of Conflicting Interests
The authors declared no potential conflicts of interest with respect to the research, authorship, and/or publication of this article.
Funding
The authors received no financial support for the research, authorship, and/or publication of this article.