
Abstract
Background
Post-stroke, damage to the prefrontal cortex (PFC) disrupts the neural circuits involved in motor control and sensorimotor integration, which contributes to impaired ankle sensorimotor function.
Objective
Apply functional near-infrared spectroscopy (fNIRS) post-stroke to investigate, 1) whether PFC activation differed among active and passive dorsiflexion/plantarflexion and somatosensory stimulation of the paretic ankle, 2) differences between hemispheres, and 3) interhemispheric asymmetry and functional outcomes.
Methods
In nine participants, bilateral hemodynamic responses of the PFC were collected with fNIRS during active and passive dorsiflexion/plantarflexion and somatosensory stimulation. Sensorimotor function and interhemispheric asymmetry were assessed using the Fugl-Meyer Lower Extremity (FMLE) assessment and laterality index.
Results
Across the three tasks, no differences in PFC activation were found within or between hemispheres. There was a potential relationship between interhemispheric asymmetry with the sensory and motor portions of the FMLE, suggesting that greater asymmetry during passive and somatosensory stimulation tasks may be associated with poorer functional outcomes.
Conclusions
Our results highlight that ankle sensorimotor functions may not generate different levels of PFC activation in a single hemisphere. The imbalance of PFC activation between the hemispheres from somatosensory and motor input may relate to clinical somatosensory function, which could be a useful measure of recovery.
Keywords
Introduction
The ankle provides somatosensory feedback to the central nervous system (Pavailler et al., 2016), making ankle sensorimotor functions essential to walking (Zhou et al., 2018). Active movement requires coordination between sensory input and motor output; therefore, the active movement includes the sensory processing with the somatosensory system. Passive tasks involve the ability to differentiate between sensory ques (e.g., pain, stretch, temperature) where the somatosensory system processes these sensory inputs, and has been demonstrated with brain electrophysiological measurements during ankle kinesthetic movement (Toledo et al., 2016). Somatosensory stimulation (SS) tasks are involved with neurological conditions (e.g., neuropathy, stroke, spinal cord injury) and provide an opportunity to assess somatosensory function. Following a stroke, individuals often display impairment in ankle somatosensation and motor coordination including the ability to plantarflex and dorsiflex, limiting individuals’ ability to walk independently (Kim & Cha, 2015). Rehabilitation through physical therapy sessions which target ankle sensorimotor function post-stroke conducted early in the rehabilitation process may have long-term benefits but remain understudied (Edwards et al., 2019).
While typically associated with higher-order cognitive functions such as attention and decision-making, the prefrontal cortex (PFC) is involved in processing information related to sensorimotor function (Dixon, 2015; Fuster, 1991; Miller et al., 2002). In healthy adults, the PFC contributes to the planning of voluntary movements, analysis and integration of sensory and motor information, coordination of movements, and adjustment of motor responses based on the environment (Buschman & Miller, 2007; Dixon, 2015; Hasan et al., 2013; Pirker & Katzenschlager, 2017). Following a stroke, damage to the PFC can disrupt the neural circuits involved in motor control and sensorimotor integration, which can contribute to impairments in sensorimotor functions in the ankle, as well as other areas. Physical therapy of ankle sensorimotor function in people with Multiple Sclerosis has been shown to significantly improve active range of motion, dorsiflexion, dorsiflexor and plantar flexor muscle strength, and balance and locomotion (Lee et al., 2017). The physical therapy of ankle sensorimotor function enables sensorimotor function to be retained and is thought to improve functional outcomes, such as mobility. Ankle sensorimotor retraining typically includes active and passive range of motion activity and somatosensory stimulation. Thus, physical therapy interventions address both somatosensory and motor aspects of functional tasks, promoting walking function, and leading to greater independence for individuals following a stroke (Connell et al., 2008; Meinders et al., 1998; Perry et al., 2000; Winward et al., 2007).
Physical therapy rehabilitation may include range of motion exercises involving the ankle which can be active (e.g., individual moving their ankle voluntarily) or passive (e.g., individual's ankle is moved by the therapist) movements described as dorsiflexion and plantarflexion. In healthy participants, previous studies investigating ankle dorsiflexion/plantarflexion using functional Magnetic Resonance Imaging (fMRI) reported increased activation in the primary sensorimotor cortex in both active and passive tasks compared to rest (Enzinger et al., 2008; Francis et al., 2009). Similarly, research in healthy adults reported increased activation in the primary somatosensory cortex, among other regions, during light touch in the foot (Akselrod et al., 2017; Vieira et al., 2017; Wang et al., 2015; Willoughby et al., 2021). Fewer studies have assessed activation in the PFC during these types of tasks. One study reported more PFC activation in active ankle movement than the passive task in healthy adults (Francis et al., 2009). However, no studies have compared PFC activation during active and passive ankle dorsiflexion/plantarflexion or cortical activation during ankle somatosensory stimulation in the post-stroke population. Thus, our understanding of how stroke impacts cortical activation associated with these sensorimotor functions is limited.
Neuroimaging studies during the early and late subacute stages of stroke recovery reveal asymmetrical patterns of brain activation between the hemispheres when compared to healthy individuals, termed interhemispheric asymmetry (Boyd et al., 2017; Feydy et al., 2002; Schaechter et al., 2002). While no studies have investigated interhemispheric asymmetry during ankle sensorimotor functions following stroke, previous studies on walking performance post-stroke have provided divergent findings. For active paretic knee movement, one fMRI study reported that faster walking was associated with greater contralesional activation in the sensorimotor cortex in people with chronic subcortical stroke (Luft et al., 2005). Yet, another study, also in individuals with chronic stroke, found that increased contralesional activation in the primary motor cortex and primary somatosensory cortex was negatively correlated with paretic ankle and leg function (Enzinger et al., 2008). Though interhemispheric asymmetry is found post-stroke in primary sensorimotor cortices (Casula et al., 2021), it is unknown whether interhemispheric asymmetry of the PFC during ankle sensorimotor physical therapy activity is present. If PFC activation is asymmetric, this may be related to functional outcomes and could then potentially be a useful neuroimaging marker to evaluate response to physical therapy interventions and recovery.
fMRI assessments are costly and unavailable in rural or remote areas. Furthermore, fMRI tasks and measurements are conducted in a restrictive environment, limiting the inclusion of individuals post-stroke who are claustrophobic, or those unable to complete bedside transfers onto an MRI table, or have common electrical or magnetic devices, such as pacemakers and hearing aids (Hoshi, 2005). Functional Near-Infrared Spectroscopy (fNIRS) may offer a solution to these limitations. fNIRS devices are lightweight and portable which is ideal for recording cortical brain activation in physical therapy settings (Scarapicchia et al., 2017). Its portability allows neuroimaging research to be conducted with participants during ecologically valid tasks such as standing or walking (Ayaz et al., 2013; Karim et al., 2012). However, to our knowledge, no experiments have yet used fNIRS to explore the PFC activation associated with various ankle sensorimotor physical therapy exercises used in sensorimotor training post-stroke.
The primary objective of this study was to use fNIRS to explore whether PFC activation differs during active and passive dorsiflexion/plantarflexion and light touch SS around the paretic ankle in people with subacute stroke within either hemisphere. Secondly, we explored PFC activation differences between hemispheres during each of the tasks. Finally, we investigated the relationship between interhemispheric asymmetry using a Laterality Index (LI) and clinical outcome measurement scale using the Fugl-Meyer Lower Extremity (FMLE) assessment.
Material and Methods
Participants
Nine participants with subacute stroke participated in this experiment approved by the Western University Health Sciences Ethics Review Board, London, Canada (HSREB#119880). We used a convenience sample of participants recruited from the inpatient stroke rehabilitation unit at Parkwood Institute in London, Ontario, Canada. Individuals were eligible to participate if they were medically stable, age greater than or equal to 19 years of age, displayed hemiparesis after a stroke in either hemisphere, were an independent community ambulator prior to the stroke, could understand and follow instructions in English, and could provide informed consent. Individuals were excluded if they were unable to communicate in English, presented with other chronic health conditions that would adversely affect participation (e.g., Parkinson's disease, multiple sclerosis, cancer, orthopedic limitation of the lower extremity) and/or directly affected hemoglobin levels, or had a cerebellar stroke. Each participant provided written informed consent prior to data collection. All demographic and clinical characteristics of the participants were collected from their medical charts by a licensed physiotherapist on the team (Table 1).
Demographic and Clinical Characteristics of the Participants.
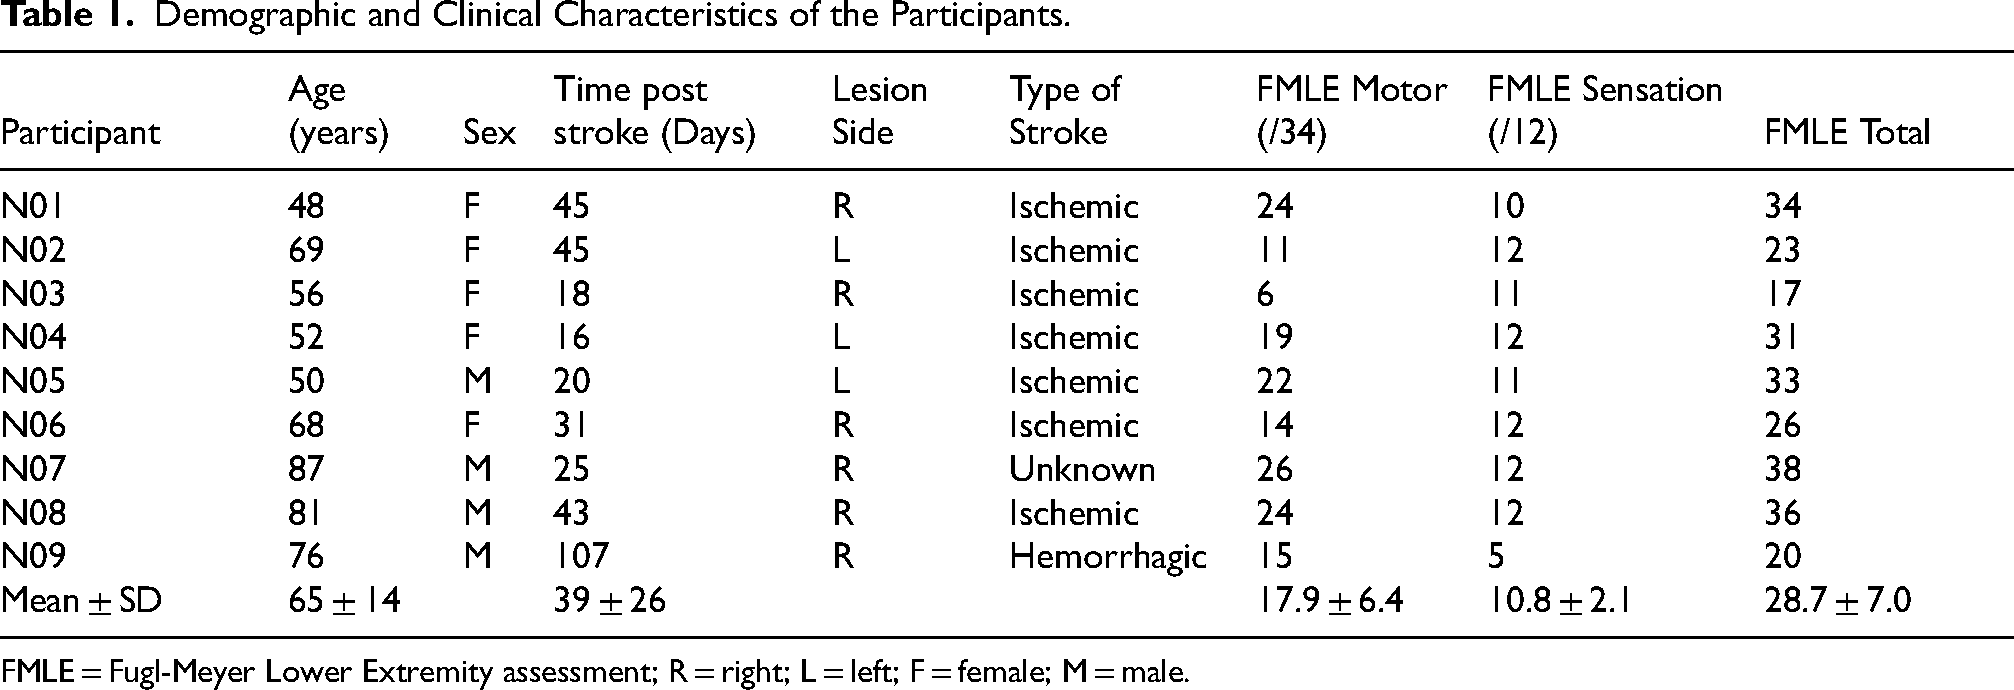
FMLE = Fugl-Meyer Lower Extremity assessment; R = right; L = left; F = female; M = male.
fNIRS System and Placement
The continuous wave fNIRS system (PortaLite, Artinis Medical Systems, Elst, The Netherlands) with LED optodes (wavelengths of 759 and 841 nm) was used to measure functional brain activity at a sampling rate of 50 Hz through Oxysoft 1.3.1 software. Each device contained one source and three detectors. Prior to the experiment, the nasion-inion distance, ear-to-ear distance (between preauricular points), and head circumference of the participants were measured to ensure consistent placement between participants. Two fNIRS devices were placed over the bilateral PFC in accordance with the international 10-20 landmarking system (Jurcak et al., 2007). A headband affixed the sensors to the head to ensure minimal ambient light would affect the signals recorded by the fNIRS sensors (Figure 1).
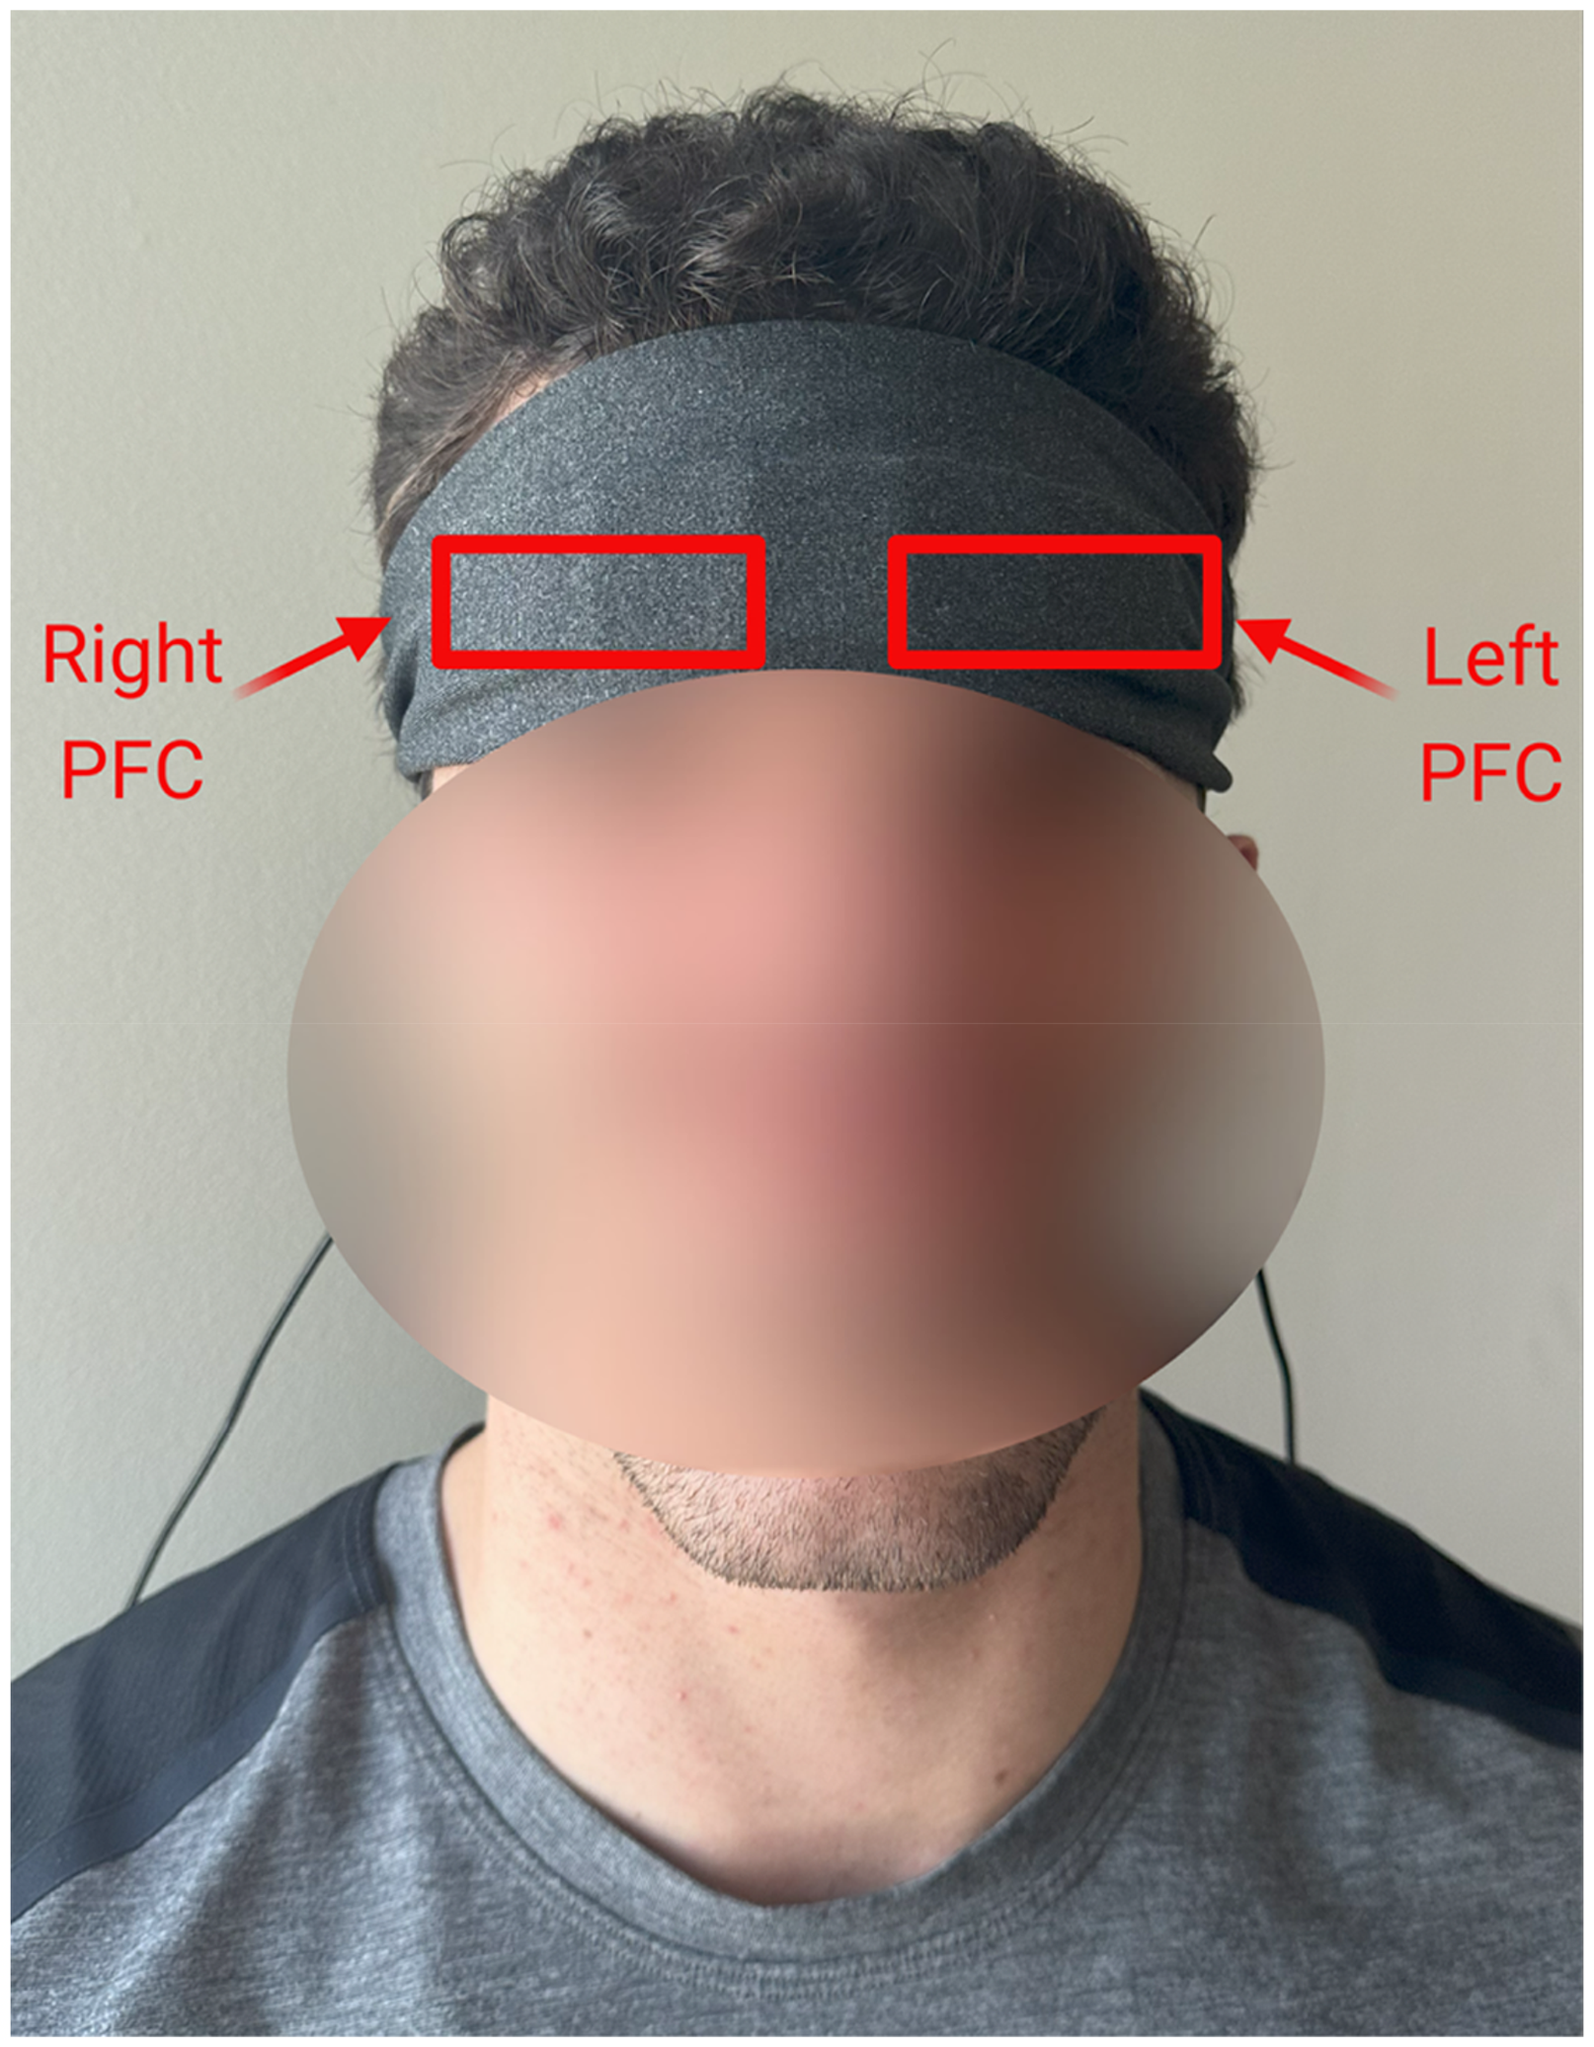
Representative Participant Placement for Two fNIRS Devices on the Prefrontal Cortex (PFC) Beneath the Black Headband to Block Out Light.
Task Procedures
All participants were asked to lie in a supine position on a plinth in the inpatient stroke unit or in their hospital bed with pillows placed under the knee and calf to allow the ankle to move freely. The protocol involved completing 5 trials for each of three tasks using the paretic ankle: (1) Active ankle dorsiflexion/plantarflexion, (2) Passive ankle dorsiflexion/plantarflexion, and (3) a SS task using a reformed paperclip to stimulate the ankle. Task order was randomized with the experimenter triggering the start of each trial with a verbal cue to start and stop the tasks (Urbaniak & Plous, 2013). Participants started their first movement for each trial in the midrange position. Each trial lasted 20 s and the rest time between trials varied from 15 to 30 s to minimize the physiological effects of breathing and heart beat on the hemodynamic response during the task (Leff et al., 2011). All tasks were performed under metronome guidance at a frequency of 0.33 Hz (20 BPM) and the metronome was kept on during tasks and rest periods to control for the effects of the auditory stimulus. For each metronome beat, participants were instructed to move through their available range of dorsiflexion and plantarflexion. The pace was visually monitored by the experimenter to ensure that participants adhered to the 0.33 Hz tempo, allowing for three dorsiflexions and four plantarflexions within each 20-s trial. The auditory cues from the metronome allowed for consistent task repetitions between participants and between trials. Leaving the metronome on during rest periods also allowed for a consistent auditory stimulus to the cortex throughout the data collection session and was considered an input during rest and during activity. Participants were blinded to the order of the tasks, number of total trials, and length of each trial. Additionally, they were instructed to look at a visual fixation point on the ceiling during tasks and rest periods to minimize head movements, to relax and refrain from moving other parts of their body, and not to count the number of trials. The comfortable active and passive range of motion of the ankle was determined by a physiotherapist prior to the task in each participant. If the participant's full available range of the ankle was limited due to pain, the physiotherapist determined the active and passive range of ankle movement without stimulating a pain response. While specific ROM values were not formally documented and may have differed slightly between AROM and PROM, both active and passive ROM were clinically observed at the ankle by the physiotherapist to ensure safe and consistent movement within each participant's capabilities across the data collection session.
For the Active task, participants were instructed to move their paretic ankle through their full dorsiflexion/plantarflexion range of motion within the metronome time/pacing. Participants were told to only move their ankle once they heard a beat from the metronome (e.g., beat – dorsiflex – beat – plantarflex). Due to varying degrees of impairments in ankle sensorimotor function among the participants, the degree of range of motion was not restricted, but was kept similar for all repetitions of the active task. Similarly, participants were instructed to focus on moving their ankle, rather than achieving a certain degree of movement.
During the Passive task, the participants’ paretic ankle was moved through a comfortable ankle dorsiflexion and plantarflexion range of motion. Participants were instructed to be as relaxed as possible and to allow the experimenter to complete each movement. The experimenter placed one hand around the metatarsal heads and the other hand cupped under the ankle proximal to the malleoli. The experimenter maintained continuous hand contact with the foot throughout all trials of the passive task to regulate and account for any potential impact of additional somatosensory input resulting from touching the foot, including during rest periods.
For the SS task, the experimenter applied a reformed paperclip for all but one participant (reformed safety pin used for the first participant) in accordance with the metronome. The paperclip used was reformed to have one sharp end and one dull end in a “Z” shape. The same sensory stimulation site, within 1–2 cm superior to the medial malleolus, was stimulated using the sharp end for all participants. The experimenter placed their thumb and index finger at the dull end of the tool and slid down towards the sharp end to apply even pressure to the skin of all participants. The experimenter avoided any part of their hand touching the participant's skin to avoid additional somatosensory input.
Clinical Outcome Measure
The sensory and motor function portions of the FMLE (Gladstone et al., 2002) were completed by a trained physical therapist after the fNIRS session, and scores were not available to the fNIRS assessor during data collection or initial processing, ensuring assessor blinding. FMLE is recommended by the Stroke Rehabilitation and Recovery Roundtable recommendations (Van Criekinge et al., 2024) and shown to have a high inter- and intra-rater reliability (Sullivan et al., 2011). FMLE scores of 21 or higher indicate better sensorimotor function (Kwong & Ng, 2019).
A marker in the fNIRS software was placed at the start of each 20 s trail to synchronize the data. fNIRS data were processed using open-source software, HOMER3 (Huppert et al., 2009), which is implemented in MATLAB (Mathworks, 2017b, Natick, MA, USA). All HOMER3 functions and corresponding parameters are indicated within square brackets. The raw fNIRS intensity data were first converted to optical density [hmrR_Intesnity2OD] and a lowpass filter of 0.15 Hz was applied to the data to remove high-frequency noise [hmrR_BandpassFilt:Bandpass_Filter_OpticalDensity: lpf = 0.15] (Peters et al., 2020; Stuart et al., 2019). Optical density data was then converted into relative concentration changes of oxy-hemoglobin (HbO) and deoxy-hemoglobin (HbR) based on the modified Beer-Lambert law [hmrR_OD2Conc: ppf = 6.0 6.0] (Boas et al., 2004; Kocsis et al., 2006; Sassaroli & Fantini, 2004). Last, the hemodynamic response was estimated using the general linear model [hmrR_GLM_old] with an ordinary least squares approach [glmSolveMethod = 1], and consecutive sequence of gaussian functions [idxBasis = 1] as the type of basis function [trange = −5.0 30.0, paramsBasis = 0.5 0.5, rhoSD_ssThresh = 0, flagNuisanceRmethod = 1, driftOrder = 3, c_vector = 0] (Peters et al., 2020; Ye et al., 2009). Trials with noisy signals were excluded.
We calculated the mean and standard deviation of both HbO and HbR during the baseline (−2 to 0 s) and task (0 to 20 s) period for each task and participant. Two participants had fewer repetitions included in the analysis for the Active (n = 1) or the SS (n = 1) tasks due to noisy signals.
Data Analysis: Laterality Index
We calculated the LI for both HbO and HbR using the following equation (He et al., 2022):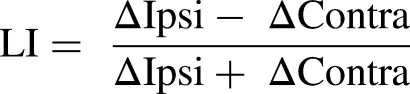
ΔIpsi and ΔContra represent the Hb concentration change within the PFC in the ipsilesional (ipsi) and contralesional (contra) hemispheres, respectively (Seghier, 2008). The change in concentration is determined by subtracting the mean of baseline values (measured before the start of the task: −2 s to −0.02 s) from the mean task values (measured throughout task performance: 0 to 20 s) (Balconi et al., 2015). This equation yields values where negative LI values is thought to indicate more contralesional activation and positive values more ipsilesional activation (Ruff et al., 2008). Outliers for LI were identified using interquartile range (IQR) with outlier < Q1 − 1.5*(IQR) or outlier > Q3 + 1.5*(IQR) (Jones, 2019).
Statistical Analysis
To address objective 1, a single-factor ANOVA evaluated differences between the Active, Passive and SS tasks using the average HbO and HbR concentration level during each task (0–20 s). For objective 2, differences between ipsilesional and contralesional hemispheres were evaluated with paired t-tests, using the average HbO and HbR concentration level of each hemisphere during each task (0–20 s). Lastly, objective 3 explored interhemispheric asymmetry and clinical outcomes using FMLE and LI. All of the statistical significance levels were set to p < 0.05.
We completed an a-priori sample size calculation for a one-way ANOVA using G*Power 3.1 Software, assuming α = 0.05, a power of 0.80, and a 0.40 effect size which indicated a sample size of 66. The effect size was chosen from previous research that reported similar study designs (Miyara et al., 2020; Rothwell et al., 2018). We anticipated that our recruitment would be affected due to the COVID-19 restrictions in an inpatient hospital. Hence, we completed a post hoc power analysis to evaluate the robustness of study findings given the existing sample size of this study.
Results
The demographic and clinical characteristics of the participants are displayed in Table 1. Based on the FMLE Motor scores, 4 participants had high sensorimotor function and 5 had lower sensorimotor function (Table 1; Kwong & Ng, 2019). All nine participants completed the Active, Passive and SS tasks.
Difference in PFC Activation Between Tasks
A one-way ANOVA demonstrated no statistically significant difference in HbO concentration in the ipsilesional and contralesional PFCs between the Active, Passive and SS task (Fipsi(2,24) = 0.23, p = 0.79; Fcontra(2,24) = 1.05, p = 0.36, respectively). Similar results were found with HbR concentration, with no statistically significant differences found between the three tasks (Fipsi(2,24) = 3.28, p = 0.06; Fcontra(2,24) = 2.01, p = 0.16).
Differences in PFC Activation Between Hemispheres During Each Task
The two-tailed paired t-test found no statistically significant differences between the ipsilesional or contralesional hemisphere for any of the three tasks for either HbO or HbR concentrations (p ≥ 0.09).
Interhemispheric Asymmetry and Clinical Outcomes
For LI, three numbers were identified as outliers and we calculated results with and without outliers for HbR Passive, HbO SS and HbR SS (Table 2). The LIHbO values (mean ± SD) were 0.73 ± 0.85 for Active, −0.23 ± 0.69 for Passive, −0.46 ± 0.65 for SS or 2.06 ± 7.17 with outliers. The LIHbR values (mean ± SD) were 1.02 ± 1.21 for Active, −0.22 ± 0.92 for Passive or 3.12 ± 9.50 with outliers, and 0.20 ± 0.27 for SS or 0.04 ± 0.52 with outliers (Table 2). The motor FMLE was 17.89 ± 6.42, the sensory FMLE was 10.78 ± 2.15, and the total FMLE was 28.67 ± 7.02 (Table 2). On average, LI values with passive and active ankle movement appear to have a negative relationship with motor FMLE for both HbO and HbR. Conversely, LI values have a positive relationship with sensory FMLE for HbO (Figure 2). These findings were not powered to run a Pearson Correlation; however, the correlations with LI suggest that there is greater interhemispheric asymmetry which is potentially associated with poorer functional outcomes during the passive range of motion and SS tasks (Figure 2).
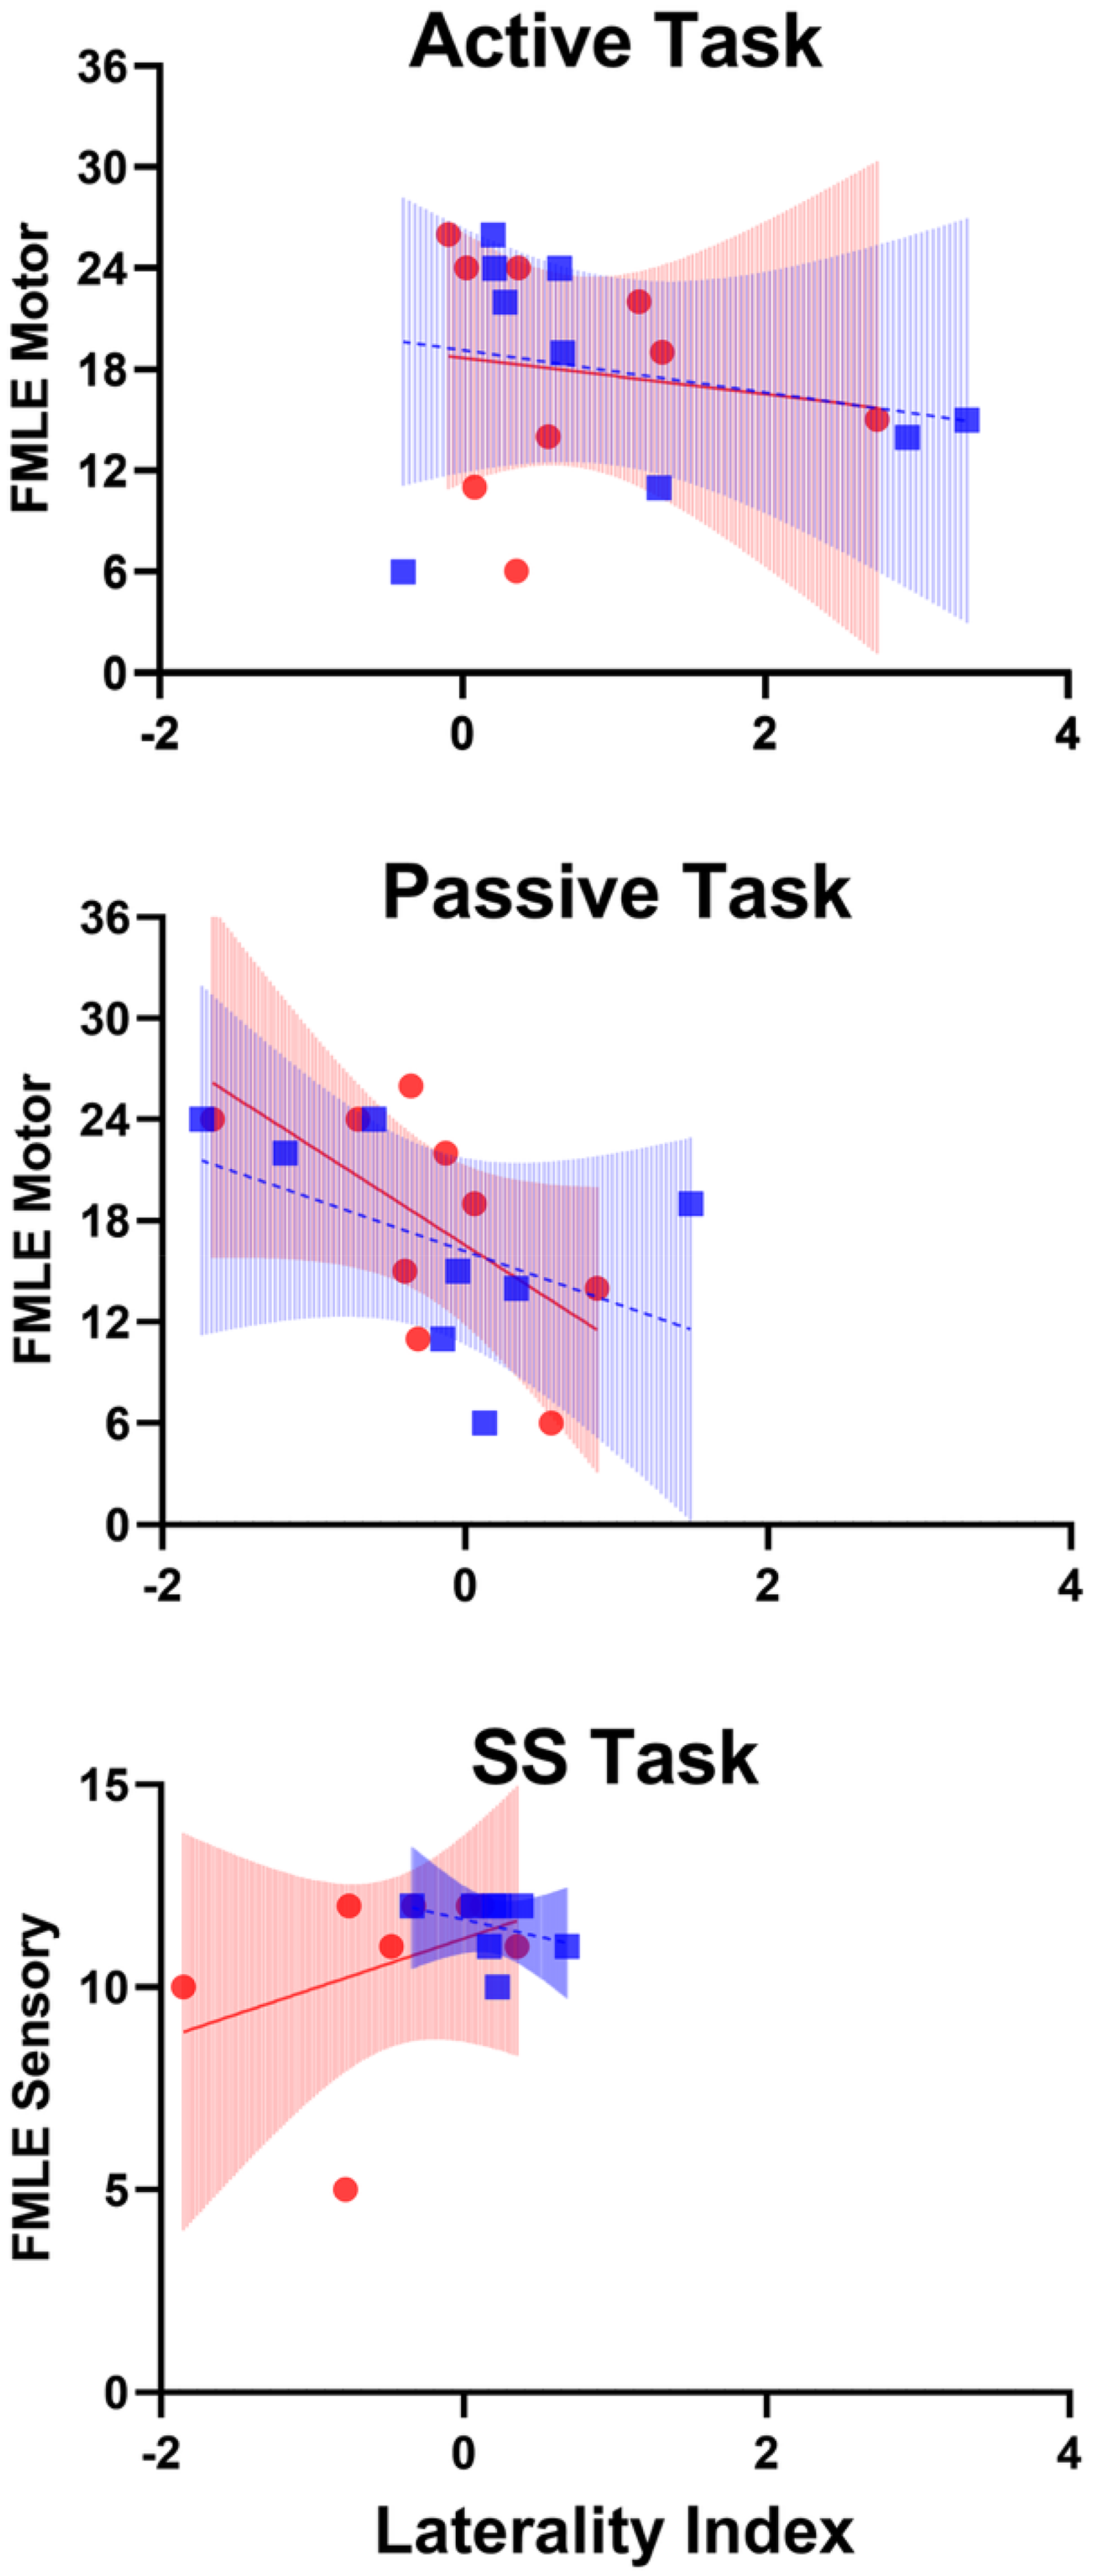
Oxygenated (Red Circles) and Deoxygenated (Blue Squares) Responses to the Active Task (Top Panel), Passive Task (Mid Panel), and Somatosensory Stimulation Task (Lower Panel). Corresponding Lines and 95% Confidence Intervals for Oxygenated (Red Solid Lines and Red Shading) and Deoxygenated (Blue Dashed Linesand Blue Shading) Hemoglobin Content Changes Are Represented on Each Panel. Outliers for the Laterality Index Were Identified Using Interquartile Range (IQR) with Outlier < Q1 − 1.5*(IQR) or Outlier >Q3 + 1.5*(IQR) (Jones, 2019). Plots Do Not Include Outliers, Participant 7 Was an Outlier for the Oxygenated Somatosensory Stimulation Task and Deoxygenated Passive Task, and Participant 9 Was an Outlier for the Deoxygenated Somatosensory Stimulation Task. SS = Somatosensory Stimulation.
Relative Concentration Changes of Oxy-Hemoglobin (HbO) and Deoxy-Hemoglobin (HbR) During the Active, Passive and Somatosensory Stimulation (SS) Tasks, Alongside the Fugl-Meyer Lower Extremity (FMLE) Scores.
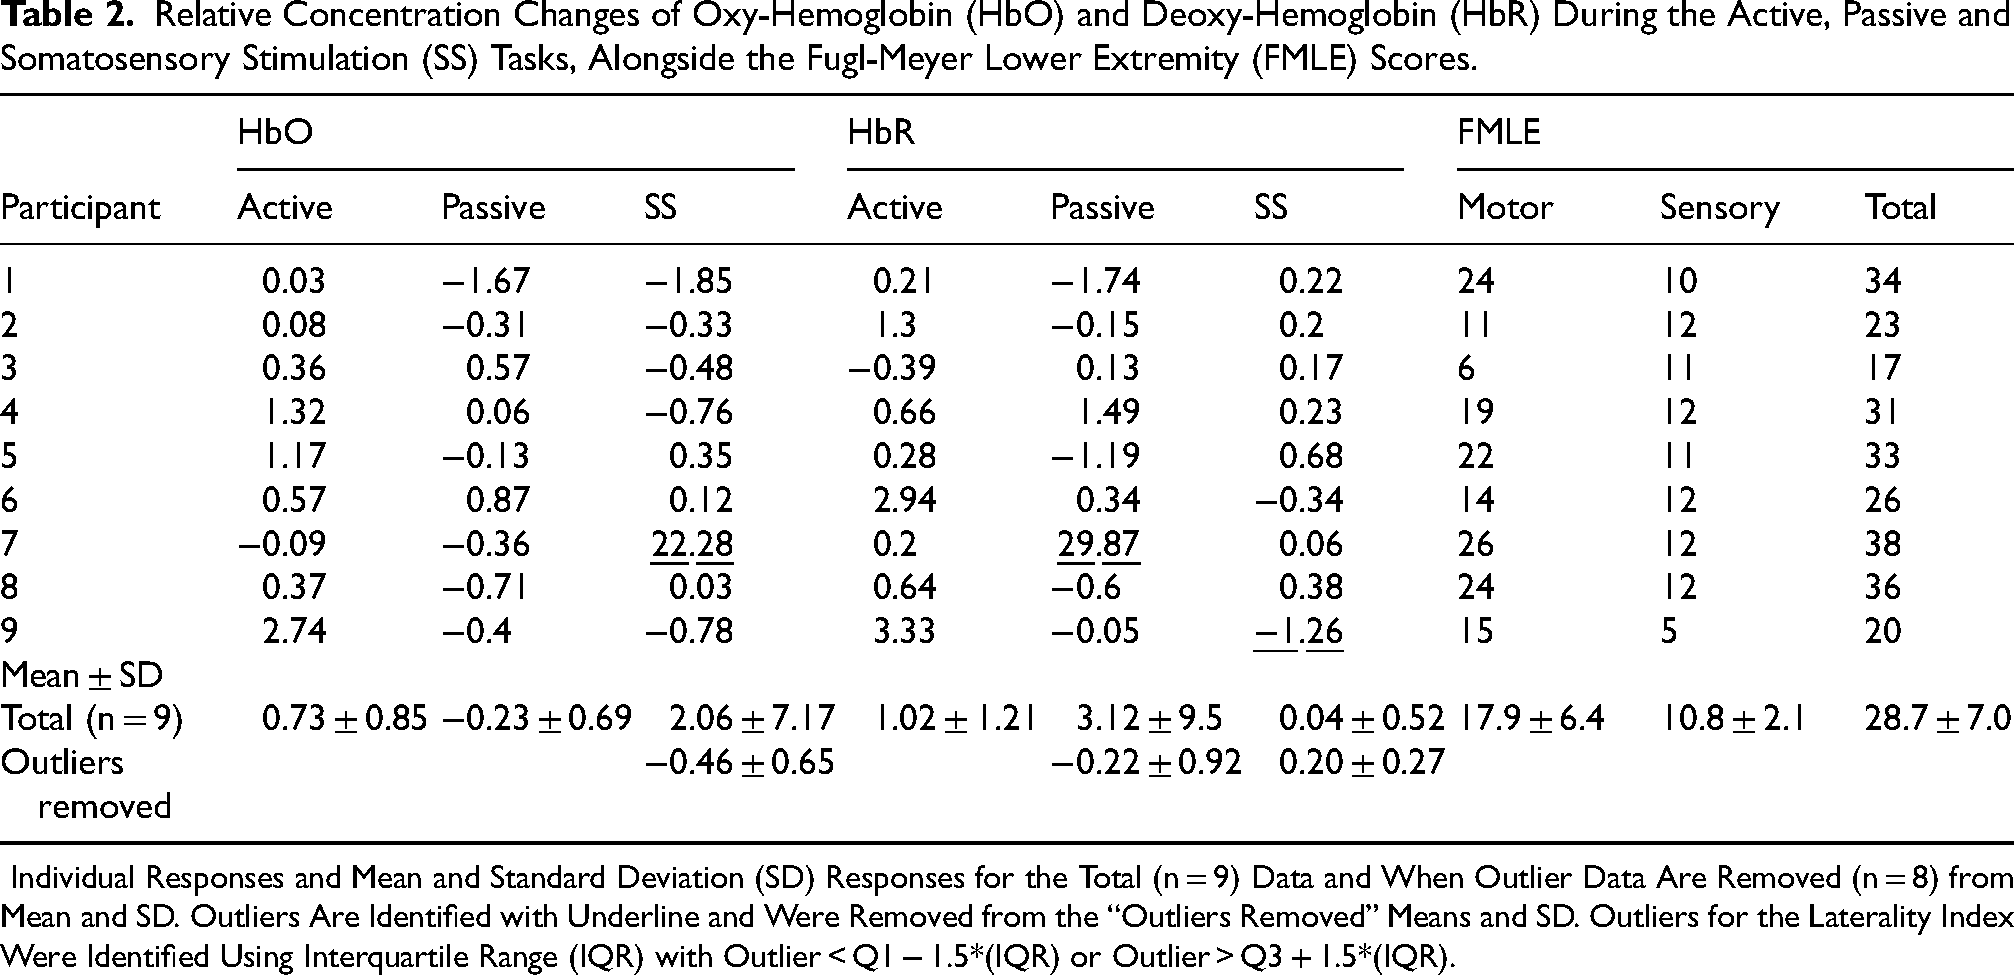
Individual Responses and Mean and Standard Deviation (SD) Responses for the Total (n = 9) Data and When Outlier Data Are Removed (n = 8) from Mean and SD. Outliers Are Identified with Underline and Were Removed from the “Outliers Removed” Means and SD. Outliers for the Laterality Index Were Identified Using Interquartile Range (IQR) with Outlier < Q1 − 1.5*(IQR) or Outlier > Q3 + 1.5*(IQR).
Post Hoc Power Analysis
In the current literature, effect sizes are classified as small (d = 0.2), medium (d = 0.5), and large (d ≥ 0.8) (Sullivan & Feinn, 2012). Given α = 0.05, a power of 0.80, and a total number of 27 observations (3 tasks for 9 participants), the post hoc power analysis for a one-way ANOVA test resulted in an effect size of 0.64, which is a medium effect size.
Discussion
This is the first fNIRS study completed in people with subacute stroke that compared bilateral PFC activation during ankle range of motion and SS tasks that are part of sensorimotor physical therapy rehabilitation, and probed the relationship between PFC activation and the FMLE. Our exploratory study, while not powered to definitively detect differences in PFC activation, may have found a potential relationship between the level of interhemispheric asymmetry for the SS task for deoxygenated hemoglobin and the sensory portion of the FMLE. Below, we discuss the potential implications of these early findings for future physical therapy research.
Differences Between Tasks
No differences were found between tasks in our sample. This result contrasts with some of the current literature that found greater PFC activation during the Active task in healthy adults (Enzinger et al., 2008; Francis et al., 2009). There are several possible explanations for our results. First, we predicted that active movement would produce higher PFC activation compared to passive movements since the former requires voluntary motor control (Dixon, 2015; Hasan et al., 2013). Walking and standing require the collective contribution of the entire body to maintain upright postural control, whereas ankle sensorimotor functions in supine are limited to one peripheral joint. Thus, the brain activation changes in a supine task may be more subtle than a standing task with smaller changes in Hb amplitude, which suggests that study protocols in an upright posture may not be similar enough to compare to our study results. Of note, previous fNIRS studies in walking post-stroke have primarily reported findings in HbO concentrations (Lim et al., 2021). Although reporting of HbR is recommended because the data complements HbO, few studies report or analyze HbR which limits our ability to cross-reference our results to other studies (Menant et al., 2020; Yücel et al., 2021). Our study included 4 repetitions of movement per 20 s trial, which is consistent with Enzinger et al. (Enzinger et al., 2008) (20 bpm, or 6–7 repetitions per 30 s trial) and less repetitions than reported in Francis et al. (2009) (8 repetitions in 20 s). It is possible that more repetitions in a shorter timeframe may increase the signal measured by fNIRS. Future studies using fNIRS in a physical therapy setting may consider performing ankle tasks in a different posture or incorporating a protocol with a faster tempo or more repetitions to test whether these types of methodological features impact HbO and HbR amplitudes in single joint data collection protocols.
Second, the differences between the results in previous studies and the current study may be explained by stages of post-stroke recovery (i.e., chronic stroke compared to subacute stroke) (Enzinger et al., 2008; Francis et al., 2009). Brain recovery post-stroke varies across individuals and recovery stages (Grefkes et al., 2020). In our study, we included people in the subacute stage of recovery receiving physical therapy treatments in a rehabilitation hospital. It is possible that people with chronic stroke (the population where the majority of fNIRS studies have been completed) display different brain activation patterns that contribute to distinct research findings during the performance of similar tasks (Xu et al., 2024). In chronic stroke, neuroplastic adaptations tend to stabilize over time, often resulting in more consistent and lateralized cortical activation patterns during motor tasks (Wang et al., 2023). In contrast, the subacute phase is marked by dynamic neurophysiological changes, including variable recruitment of bilateral cortical regions, compensatory activation, and inconsistent engagement of higher-order areas such as the PFC. This heterogeneity in neural reorganization during the subacute stage could conceal systematic patterns of PFC involvement and contribute to the absence of significant group-level differences in PFC activation observed in our study. These findings underscore the need for individualized or stratified analysis in early stroke populations and suggest that task design and recovery timeline post-stroke are critical when interpreting cortical activation profiles.
Somatosensation is an integral part of retraining functional tasks with physical therapy, yet the relationship between the brain and ankle function post-stroke in a physical therapy context has been explored either in isolation (e.g., solely sensory or motor) (Chia et al., 2019; Francis et al., 2009), during dynamic movements (e.g., walking) (Caliandro et al., 2020; Lim et al., 2022; Pelicioni et al., 2019), or using other aspects of sensation (e.g., visual or auditory tasks) (Guo et al., 2016). Thus, this work is the first to report the PFC's response to ankle somatosensation and movement in the same study participants during the subacute stage of recovery; this work also highlights the potential of fNIRS to measure the PFC's contribution during physical therapy of the ankle using range of motion exercises.
Between Hemisphere Differences
Supported by current literature, we hypothesized greater contralesional than ipsilesional activation in all physical therapy ankle tasks in our experimental protocol (MacIntosh et al., 2008). However, we found no differences between hemispheres in our sample. As mentioned above, most of the current literature examining interhemispheric differences post-stroke is based on walking rather than isolated ankle tasks which may explain this difference. Hence, future studies may consider incorporating a faster tempo, or more repetitions during ankle tasks which may provide a stimulus that produces a larger change in brain activation and be more measurable with fNIRS.
Laterality Index Values Among People with Stroke
In healthy adults, the typical hemodynamic response to neural activation consists of increased HbO concentration and decreased HbR concentration compared to the baseline (Watanabe et al., 2017). This assumes activation values will be positive for HbO and negative for HbR. However, Watanabe and colleagues’ work was not conducted in a post-stroke cohort and therefore may not apply to brains with injury. A common characteristic observed in our study is different directions of change for the hemispheres (Table 2) meaning that some participants had positive values in one hemisphere and negative values in the other hemisphere. There is limited information regarding changes in Hb concentrations during tasks in the brain after an injury, such as after a stroke (Watanabe et al., 2017). Thus, data visualization approaches like plotting (e.g., Figure 2) may provide a better quantification of the cortical activation imbalance that may be present. Visualizing the hemodynamic response function for contra- and ipsilesional hemispheres could be an alternative to examine the relationship between interhemispheric asymmetry and clinical outcome measures. Therefore, exploring other approaches for representing interhemispheric asymmetry post-stroke may serve to advance the field.
FMLE and LI
We observed a potential relationship between the SS LIHbR and FMLE-S in our study (Figure 2, lower panel). However, the ability to compare to the current literature is restricted due to the limited reporting of LIHbR values in the literature (Menant et al., 2020; Yücel et al., 2021). This indicates that even studies with small sample sizes, like ours, are needed to provide a starting point for hypothesis generation for future research. The variability of the LI values within individuals may be the result of spontaneous recovery or compensatory cortical activation patterns poststroke. Healthy adults typically display bilateral activation in some brain regions (e.g., the primary somatosensory cortex) during cutaneous somatosensory stimulation in the lower extremity (Akselrod et al., 2017; Vieira et al., 2017; Wang et al., 2015; Willoughby et al., 2021). Consequently, improved sensory functions in the lower extremity in people with subacute stroke may create brain activation patterns that resemble those of a healthy adult. Given the paucity of data on individuals with neurologic diseases (e.g., stroke), our findings are different from healthy adults. Future studies with larger sample sizes should confirm these differences to better inform the understanding of interhemispheric asymmetry in the stroke population.
Clinical Relevance
Despite restrictions during the COVID-19 pandemic (outbreaks, isolation periods etc.), we were able to recruit 9 people for this study. The sample size is consistent with other exploratory studies in the subacute phase after stroke (Alber et al., 2017; Demers & McKinley, 2015; Kim et al., 2018; Li et al., 2022). Though this study has a small sample and demonstrates preliminary research findings, it can inform a future adequately powered study. Exploratory studies with small sample sizes are vital to identify important directions for future research and to distinguish areas of clinical importance beyond statistical significance (Fethney, 2010; Ranganathan et al., 2015; Sharma, 2021). Moreover, the tasks in this study are a component of common activities that are implemented during post-stroke physical therapy sessions during inpatient rehabilitation, such as active movements (e.g., sit-to-stand), passive movements (e.g., passive cycling) and sensory interventions (e.g., functional electrical stimulation, mirror therapy) (Doyle et al., 2010; Galvão et al., 2024).
The absence of significant PFC activation across tasks provides valuable insight into the neural mechanisms underlying lower-limb motor control in individuals with subacute stroke. While the PFC is known to integrate sensory information for postural control and movement adaptation, our findings suggest that simple, isolated ankle tasks may not impose sufficient cognitive or postural demand to engage this region robustly. These null findings are meaningful in that they highlight the importance of task complexity and ecological validity when designing rehabilitation protocols to probe cortical involvement in lower-limb motor control.
Clinically, these findings underscore the importance of incorporating more functional and cognitively engaging activities—such as upright tasks, dynamic balance training, or whole-body movements—into rehabilitation programs. Such tasks may better recruit cortical networks involved in sensorimotor integration and postural control. Additionally, it is possible that individuals in the subacute phase post-stroke rely more heavily on subcortical or spinal pathways during basic limb movements, further highlighting the need for targeted interventions that re-engage cortical control mechanisms to optimize recovery.
Few fNIRS studies post-stroke report or analyze HbR concentration despite HbR reporting being recommended because the data complements HbO (Menant et al., 2020; Yücel et al., 2021). Here, we have reported HbR data in a LI as well as other HbR data. Reporting HbR values here provides information on subacute stroke PFC activation for comparison in future studies.
By collecting HbO and HbR fNIRS data for a typical ankle therapy post-stroke, we have demonstrated the feasibility to include fNIRS into clinical practise. fNIRS is portable, unobtrusive, affordable, and effective in collecting relative changes of hemoglobin content. We have also exemplified the usefulness of fNIRS in clinical practice to track and monitor changes of HbO and HbR during a therapeutic session in rehabilitation . Monitoring with fNIRS during a single session can inform the physiotherapist if the movement pattern is eliciting the desired outcome of the target exercise. Following the fNIRS responses throughout the rehabilitative process allows for tracking of recovery progression.
Limitations
This study has several limitations. First, fNIRS is restricted to examine cortical regions and our fNIRS device specifically is confined to the PFC. Other cortical (e.g., primary sensorimotor cortex) and subcortical (e.g., thalamus) regions may be involved during ankle sensorimotor functions that were not captured by this study. These areas are worth exploring in the stroke population using a whole-head covering fNIRS device or other neuroimaging modalities. Second, the range of motion for the Active task was not standardized across participants. Our protocol emphasized voluntarily moving the ankle rather than meeting pre-specified ranges of motion to allow for the participation of individuals with lower motor function. We acknowledge this may contribute to higher variability in our results. Third, a researcher's hand was placed on the participant's ankle during the Passive task, which added somatosensory input that was not present in the Active task. Thus, the amount of somatosensory input received for the Active and Passive tasks may be different. Fourth, the large age range (48–87 years) may have resulted in varied recovery responses. With aging, humans have a reduced ability for functional plasticity and reorganization (Burke & Barnes, 2006; Spriggs et al., 2017), which may have contributed to the post-stroke outcomes. Fifth, time post-stroke varied from 18 to 107 days which may have impacted the responses. The participants with the shortest and longest time post-stroke had outlier data for FMLE scores; where participant 3 was 18 days post-stroke with a motor FMLE score of 6 when the mean was 17.9, and participant 9 had a time post-stroke of 107 days post-stroke with a sensation FMLE score of 5 when the mean was 10.8. Last, the three tasks chosen may not represent the whole range of sensorimotor function, so future work may consider adding variations to these tasks.
Conclusion
This exploratory study reports for the first time the PFC activation during typical ankle physical therapy exercises in people with subacute stroke. We propose that future studies investigate potential somatosensation contributions in addition to motor tasks in people post-stroke. We also recommend further investigation to potential relations of both HbO and HbR with somatosensation results. However, the current study findings require further investigation to understand the added utility of these proposed elements. Overall, this study provides insight into potential relationships of ankle sensorimotor function and PFC after stroke.
Footnotes
Acknowledgements
We would like to thank all the participants and clinicians on the inpatient stroke unit at Parkwood Institute for their time and contribution that made this work possible. The current manuscript is constructed from the MSc thesis work of Siying Liu's MSc from Western University, London, ON.
Funding
This work was supported by the Gray Center Seed Grant; Faculty Development Research Fund at Western University.
Declaration of Conflicting Interests
The authors declared no potential conflicts of interest with respect to the research, authorship, and/or publication of this article.