
Abstract
This mixed-methods study synthesizes Standards-Based Grading (SBG) literature, analyzes 249 Arkansas administrators’ survey responses using OLS regressions, and identifies themes through in-vivo coding of qualitative feedback. Results show more SBG support among liberal, elementary-level administrators in larger, economically diverse districts. Qualitative insights highlight structural barriers and mindsets against SBG, emphasizing its importance for mastery-focused assessment and grading alignment. These findings underscore the influence of principals’ beliefs on SBG support and suggest researching the contextual and ideological factors influencing SBG’s implementation.
Introduction
In the evolving landscape of educational assessment, Standards-Based Grading (SBG) emerges as a pivotal reform, shifting focus from traditional grading practices towards a mastery-oriented evaluation. Historically, schools have used a “hodgepodge” grading approach, combining academic achievement with non-academic factors, often leading to ambiguity and inconsistency (Bredeson, 2013; McMillan, 2001). Critics argue this approach exacerbates historical educational inequities, particularly for underserved students (Feldman, 2019; Ogut & Circi, 2023). SBG aims for a more uniform assessment, focusing on mastery of specific objectives and minimizing nonacademic influences (Guskey, 2020; O’Connor, 2017). However, despite growing enthusiasm for SBG, research on its effectiveness remains limited, leaving questions about its superiority over traditional systems (Fergus & Smith, 2022; Guskey et al., 2020; Guskey & Link, 2022; Morris et al., 2023; Townsley & Varga, 2018; Welsh et al., 2013; Wilcox & Townsley, 2022). The success of SBG largely depends on the acceptance and preparedness of educators, necessitating significant professional development and alignment with teachers’ views on grading practices (Feldman, 2019; Link & Guskey, 2022; Stan, 2012; Williams, 2023).
This paper explores administrators’ perspectives on SBG, a critical factor in advocating and implementing grading reforms. Understanding their views is essential, as administrators play a key role in shaping school policies and practices (Bambrick-Santoyo, 2012; Guskey, 2011; Hess, 2013; Sutherland, 2016; Townsley et al., 2019). Additionally, the study examines how personal responsibility values and political ideologies might influence their stance towards SBG (Arslan & Wong, 2022; Feldman, 2019; Haskins, 2009; Hess & Noguera, 2021; Hess, 2000; Brewer & Stonecash, 2015; Woo et al., 2022). Our mixed-methods study addresses critical research questions at the intersection of administrators’ ideologies, personal responsibility levels, and characteristics with their perspectives on grading equity and SBG. By synthesizing literature, analyzing survey responses, and extracting qualitative insights, this study contributes to understanding educational equity and leadership roles in grading practice reform, providing nuanced insights into SBG perception and implementation across various educational contexts.
Literature Review
Standards-Based Grading
For over a century, grading practices have sparked debate among educators and scholars (Brookhart et al., 2016). Schools commonly use a “hodgepodge” approach, blending academic achievement with non-academic factors like effort and participation, which can lead to ambiguity and inconsistency (Bredeson, 2013; McMillan, 2001). Critics argue that such practices reinforce historic educational inequities, especially for underserved students (Feldman, 2019; Ogut & Circi, 2023). Experimental evidence also shows that teacher assessments can be biased based on students’ gender, social class, and migrant background, contributing further to educational inequalities (Gil-Hernández et al., 2024). Additionally, despite the seemingly objective nature of electronic grade books, grades based on average scores may discourage students (Brookhart et al., 2016).
To address these perceived unfairnesses, educators developed SBG to provide a more uniform assessment focused on mastery of specific objectives without nonacademic influences (Guskey, 2020; O’Connor, 2017). SBG introduces three fundamental changes: decoupling academic proficiency from behavior, permitting various opportunities to demonstrate learning without penalty, and shifting homework from point-earning to skill practice (O’Connor, 2017). Although monitoring student behaviors is supported by psychologists (Hessen & Kuncel, 2022), SBG separates these from academic skills on report cards, centering on knowledge and ability acquisition (Guskey, 2020; Zimmerman, 2017).
Despite recent enthusiasm, research on SBG’s effectiveness is limited, and its superiority over traditional grading remains questioned. Advocates argue that SBG can enhance student success, engagement, and confidence by shifting focus from scoring to learning (Morris et al., 2023). However, research suggests that higher grading standards can raise overall student achievement but may disproportionately benefit higher-performing students while negatively impacting graduation rates among historically marginalized groups (Betts & Grogger, 2003). Figlio and Lucas (2004) found that higher grading standards at the teacher level significantly improved student test score gains in both mathematics and reading. Fleischmann et al. (2021) used a natural experiment to test whether grading on a curve reinforces the Big Fish Little Pond Effect and found no significant differences between graded and nongraded students. Benefits include improved performance for students with math anxiety due to retakes (Fergus & Smith, 2022) and a closer correlation between SBG grades and test scores, suggesting a more accurate measure of proficiency (Welsh et al., 2013). However, concerns remain about aligning SBG with real-world expectations and college readiness, particularly in science education (Wilcox & Townsley, 2022). Ambiguities also exist regarding SBG’s impact on academic indicators like GPAs and ACT scores, with previous performance needing consideration (Townsley & Varga, 2018). Guskey et al. (2020) note that despite SBG’s implementation, students still struggle with college adaptation.
While SBG aims to improve grading fairness, Feldman (2019) emphasizes that true equity in grading requires more than just standards. He critiques traditional grading for penalizing economically disadvantaged students for non-cognitive traits and giving unfair advantages to those with cultural capital (Griffin & Townsley, 2022). The success of SBG also depends on teacher acceptance and preparedness, demanding significant professional development (Williams, 2023). Teachers’ perspectives, including those who favor traditional methods, must be considered (Stan, 2012). Equitable grading requires navigating complex scholarly debates on fairness, systemic pedagogical changes, and continuous reevaluation (Feldman, 2019; Link & Guskey, 2022). Despite research indicating that certain teachers are more likely to support equitable grading, understanding administrators’ perspectives on adopting SBG and equitable reforms remains a gap in the literature.
Principal Perceptions
Principal perceptions are essential in educational reform, particularly in grading practices. Their role in influencing school dynamics through strategic staffing decisions and policy advocacy can make or break the implementation of new systems like SBG (Bambrick-Santoyo, 2012; Hess, 2013; Maranto et al., 2018). While SBG is gaining favor, especially in elementary education, resistance persists, often due to the perceived temporary nature of such reforms and a lack of inclusive development processes (Guskey, 2011; Sutherland, 2016; Townsley et al., 2019). Principals’ support is critical, given their authority over essential school functions and resources that can drive the adoption of SBG (Stronge et al., 2008; Waters & Cameron, 2007). Buckmiller et al. (2020) reported positive attitudes and knowledge about SBG among rural high school principals, suggesting potential widespread rural adoption soon. However, there is a gap in research regarding the variation in administrator support for SBG and the factors influencing this stance.
Personal Responsibility
Administrators’ support for SBG often mirrors their values, particularly around personal responsibility. Administrators aligned with conservative and neoliberal views might hesitate to embrace equity-focused grading, fearing it undermines individual accountability and the reward for effort, conflicting with societal and parental expectations (Haskins, 2009). Conversely, progressives argue that societal structures largely influence student outcomes (Feldman, 2019; Brewer & Stonecash, 2015). The Responsibility Questionnaire (R.Q.) developed by Arslan and Wong (2022), validated for assessing personal responsibility in adults, offers insight into how these values may influence educational leadership and support for SBG.
Political Ideology
The connection between administrators’ political ideologies and grading preferences is an area ripe for research. Political leanings influence educational outlooks, with debates often rooted in values and politics (Hess, 2000; Hess & Noguera, 2021). Conservatives and liberals are typically divided over the role of personal responsibility in education, as highlighted by Brewer and Stonecash (2015), and this divide extends to grading practices. Tools like the Pew Research Center’s scale provide a structured approach to quantify these ideologies, though not without debate. Woo et al. (2022) emphasize the significance of personal ideologies in shaping educational leadership and decisions, pointing to the profound effects these beliefs can have on implementing policies like SBG.
Administrators Characteristics
The existing literature highlights a complex relationship between administrator experience and support for innovative practices like SBG, with seasoned officials often exhibiting skepticism due to past experiences with unsuccessful initiatives (Downs, 1967; Hess, 1998; Teodoro, 2011). Larger organizations benefiting from economies of scale may have the resources and expertise necessary to adopt and sustain innovations, suggesting that administrators from larger schools or districts might be more receptive to SBG (Teodoro, 2011). Additionally, school culture, particularly in elementary settings, may influence the acceptance of SBG, as smaller school sizes and closer relationships with students could foster a more favorable attitude towards focusing on individual mastery over traditional grading practices (Morris & Barton, 2022; Rinkema & Williams, 2018).
Difficulties in SBG Implementation
SBG represents a shift toward assessing student learning against defined benchmarks, yet its implementation is hampered by varying and sometimes unclear guidance from its advocates (Link & Guskey, 2022; Peters & Buckmiller, 2014). While its theoretical benefits are recognized, practical obstacles arise, particularly in secondary education, where students question how SBG aligns with traditional higher education grading and workplace evaluations, potentially impacting their future academic and career endeavors (Oswald et al., 2019; Peters et al., 2017). Confusion over the value of homework in SBG further complicates its acceptance, highlighting the need for consistent implementation and clear communication about its processes and expectations (Peters et al., 2017).
Teachers’ receptiveness to SBG varies with experience; veterans often regard it with skepticism, while newcomers tend to support it, reflecting a broader trend where less seasoned public servants favor change (Downs, 1967; Hany et al., 2016). Despite some consensus on SBG’s alignment with educational standards (Schiffman, 2016), its implementation can lead to an “implementation dip,” where students submit homework less frequently when adjusting to new evaluation methods. Teachers also face the burden of creating additional retake assignments (Schiffman, 2016) and confusion over grading versus practice tasks (Wheeler, 2017). SBG’s top-down implementation often leaves teachers feeling excluded from decision-making, underscoring the need for strong leadership to guide the transition and engage teachers in the process (Townsley & Knight, 2020).
Resistance to SBG is not limited to teachers; parents often prefer traditional grading systems they see as benchmarks of a “real school” (Tyack & Cuban, 1995) and worry about how SBG might affect college admissions and job prospects (Frankin et al., 2016; Oswald et al., 2019). This reluctance is influenced by trust in conventional grading and a lack of clarity about SBG’s benefits. However, admissions officials have indicated that SBG will not disadvantage students in university applications (Buckmiller & Peters, 2018). To overcome resistance, clear communication outlining current practice limitations and the rationale for change is crucial for increasing buy-in, transparency, and teacher engagement (Guskey, 2021; Townsley & Buckmiller, 2020).
For effective SBG implementation, researchers emphasize the necessity of a strategic, multi-faceted approach. Key steps include initiating discussions about the purpose of grading led by school leaders (Guskey, 2011; Guskey, 2020; Shepherd et al., 2018; Townsley et al., 2019), providing ongoing quality training for teachers (Guskey, 2021; Townsley et al., 2019), and engaging parents through transparent, regular communication to bridge understanding gaps (Townsley et al., 2019). Implementation should be gradual, incorporating feedback loops and trial phases while persevering through early challenges (Townsley & Buckmiller, 2020; Townsley & Knight, 2020). Anticipating and addressing resistance from both teachers and parents is crucial (Guskey, 2021), as is promoting collaboration across all stakeholders to ensure alignment in the school’s approach to SBG (Townsley et al., 2019). By focusing on clear communication, strategic planning, and managing resistance, schools can improve the chances of successful SBG reform (Guskey, 2021).
Case of Arkansas
This study aims to address a literature gap by examining how administrators’ characteristics—such as experience, education level, prior teaching subjects, personal responsibility, and political ideologies—influence their support for equitable grading and SBG practices. Understanding administrators’ perspectives is crucial, as their advocacy and implementation are key to successful district grading reforms. While proponents like Feldman (2019) and Guskey (2021) emphasize the importance of these practices, research on the impact of administrators’ traits on educational policies remains limited. Given that the success of SBG hinges on administrators’ support and their ability to influence other stakeholders, this study is essential in identifying the factors that shape their views on grading reforms and their potential to promote equity and standardization in grading systems.
To achieve this goal, this study will address the following research questions. • • • • •
Methodology, findings, and implications will be discussed to enhance understanding in this field and contribute to the dialogue on grading reform.
Methods
Procedure
In April 2023, the Administrator’s Grading Perceptions survey was developed and ethically cleared by the IRB (approval number 2,303,462,350) for distribution among Arkansas administrators. The 27-question survey aimed to capture administrators’ views on SBG, grading efficacy, equity, personal responsibility, political ideologies, and demographics. Distributed via Qualtrics from June 5 to July 31, 2023, it reached 1502 Arkansas administrators using email addresses from the ADE My School Info website. Managed by the Office for Education Policy at the University of Arkansas and promoted by a noted policy researcher, participation was incentivized with a $100 gift card lottery. Anonymity was strictly maintained, and the drawing entry was kept separate from survey responses.
Participants
Our survey reached 1502 Arkansas administrators, with 249 completing it, resulting in a 16.6% response rate. Although demographic comparisons to the overall administrator population are unavailable, our sample’s demographics are provided in Appendix Table 1a. The majority of respondents are White (84.7%), followed by Black administrators (13.3%). For analysis, administrators with only a bachelor’s degree (n = 2) were grouped with those holding a master’s degree due to the small sample size.
Instruments and Questions
Before the primary survey, a pretest was conducted in May 2023 to identify issues and understand participant interpretations, ensuring face and content validity (Simon & Francis, 1998; Crocker & Algina, 1986). Faculty (n = 10) and graduate students (n = 14) completed the pretest in an average of 7–8 minutes. Based on feedback, we retained the original vision questions from prior research (Townsley et al., 2019) and revised one question to define standards-based grading (SBG) according to Guskey’s research (2022). Other than these two adjustments, no further changes were needed. Table 2a in the Appendix lists the items and corresponding questions for the instruments used.
Grading Equity Scale
We adopted the Morris et al. (2023) grading equity scale with an alpha of 0.84, which encompasses 16 items based on Feldman’s (2019) Grading for Equity. Our administration yielded a reliability coefficient of 0.84, explaining 25% of the response variance.
Vision Scale
Despite the original study’s lack of reported validity or reliability, we selected five questions from Townsley et al. (2019) to assess administrators’ SBG vision. We confirmed content validity and construct adequacy, with Cronbach’s alpha of 0.85 indicating reliable measurement.
Personal Responsibility Scale
We adopted Arslan and Wong’s (2022) Personal Responsibility scale, which initially showed a 0.92 reliability coefficient. In our context, the scale accounted for 46% of the variance, with a reduced Cronbach’s Alpha of 0.78. This decrease may be due to Arkansas-specific factors or higher responsibility levels among administrators, leading to a concentration of Agree or Strongly Agree responses, potentially reflecting the state’s conservative nature. Despite the lower reliability, we retained the scale to explore our second research question (RQ2).
Political Ideology
We chose not to use the Pew Research Center’s 10-question ideological consistency scale due to concerns about its potential offensiveness and extremity for our administrator audience. Similarly, we dismissed a Left-Right scale for its unreliability and length (Bauer et al., 2017). Lacking a short, validated alternative, we developed a two-question approach to assess administrators’ social-political and fiscal-political liberalism in collaboration with an educational statistics expert. This participant-friendly scale, previously used to measure educators’ political ideologies (Morris et al., 2023; Morris & McKenzie, 2023), achieved a Cronbach’s alpha of 0.86 for our sample.
The Survey Document
Our survey began with an introductory page outlining the study’s objectives and informed consent. It then presented questions on SBG implementation and grading practices adapted from Townsley et al. (2019), followed by queries on grading equity and personal responsibility. Subsequent sections collected data on administrator demographics and professional roles, including position, gender, race/ethnicity, grade levels served, teaching subjects, coaching experience, educational attainment, and school community context. The survey concluded with questions about political ideology, which were placed at the end to minimize early termination rates by addressing potentially sensitive items after primary data collection (Crocker & Algina, 1986).
Quantitative Methods
In the quantitative methods section, we detail our approach, beginning with a hierarchical linear regression model to identify key variables, followed by an ordinary least squares (OLS) regression for analysis, and concluding with our qualitative methods to examine administrators’ perceived barriers to SBG implementation.
Hierarchical Linear Regression
We used hierarchical linear regression to assess whether specific administrator demographic variables added exploratory value beyond our initial hypotheses (Rutter & Gastonis, 2001). Model 1, which included hypothesized characteristics and two scales, explained 5.1–13.8% of the variance. Adding gender, race, coaching experience, and school role in Model 2 slightly increased the explained variance to 6.7–14.8%, though not statistically significant. However, incorporating district-level data on free/reduced-price lunch and enrollment in Model 3 significantly improved the model, explaining 13.4–17.4% of the variance, underscoring the importance of district context. The regression results in Table 3a demonstrate the progression to the most robust model that includes district characteristics.
Multivariate OLS Regressions
After identifying key variables through hierarchical regression, we applied OLS regression to determine the parameter values within our model by minimizing the sum of squared residuals (Cunningham, 2021). The dependent variables were the vision and grading equity scales, while the independent variables included political ideology, personal responsibility, administrator characteristics, and district characteristics. Our OLS multivariate regression was designed to explore our first three research questions: • y
i
is the standardized dependent variable of interest, vision for SBG implementation and support for grading equity practices scale for administrator i • • • • Ω
i
is a vector of district characteristics i (percentage of FRL students in each district and size of district enrollment), each associated with corresponding • ε
ic
accounts for the random error associated with the teacher i

Open-Ended Responses
We asked participants to identify current limitations or challenges to implementing SBG in their districts and schools, with 212 of the 249 participants responding. These qualitative responses were imported into NVivo 14 for coding and analysis to draw connections between themes and participant demographics. Using in-vivo coding (Saldana, 2021) and thematic analysis (Braun & Clarke, 2006), one researcher initially coded the responses, followed by discussions between two researchers to group codes into topic categories and refine them into themes. These themes were then added as variables in the quantitative dataset, where a ‘1' indicated the theme was addressed, ‘0' indicated it was not, and non-responses were coded as NA.
Results
Descriptive Findings
Most participants in our sample indicated that implementing SBG is part of their vision, with 86.3% selecting it as either “a vital part” or “a part” of their vision, consistent with prior research (Townsley et al., 2019). Additionally, 76.3% believe they have the resources needed for SBG implementation, 79.1% feel they understand the necessary steps, 75.9% think they can effectively inform their communities, and 72.6% believe they have the leadership support to implement SBG. Regarding professional development, 49% of administrators reported their schools had SBG-related PD in the last decade, 33.7% said they had not, and 17.2% were unsure. When asked if the difficulty of translating SBG onto report cards was a reason for not shifting, 59.3% agreed. Pressure to adjust students’ grades varied, with 68.3% never feeling pressure from central office leadership, but 41% sometimes or often feeling pressure from parents. Table 4a highlights ideological differences, showing that support for grading equity practices increases from 61% to 70% as one moves from conservative to liberal viewpoints, indicating modest support for Feldman’s (2019) equitable grading framework.
Multivariate Regressions
Table 5a presents the outcomes of our OLS multivariate regressions. Our model accounts for 15-19% of the variance in our outcomes; however, only ten relationships of interest are statistically significant after controls.
Political Ideology
Holding other variables constant, administrators identifying with more liberal-leaning political ideologies are 0.66 standard deviations more likely to support grading equity practices than their conservative-leaning counterparts (p < .01). Similarly, administrators identifying with more liberal-leaning political ideologies are 0.58 standard deviations more likely to have SBG implementation in their vision than conservative-learning administrators (p < .01).
Personal Responsibility
Holding other variables constant, there is no statistically significant association between administrators’ levels of personal responsibility and their support for grading equity practices or vision of SBG implementation.
Administrator characteristics
Years of Experience
Holding other variables constant, no statistically significant associations exist between administrators’ years of experience and their support for grading equity practices or their vision of SBG implementation.
Grade Level Served
Holding other variables constant, no statistically significant associations exist between administrators’ grade levels served in their school buildings and their support for grading equity practices. However, holding other variables constant, administrators in buildings serving middle grades (5–8) are 0.48 standard deviations less likely to envision SBG implementation than administrators serving elementary grades (PK-4) (p < .01). Additionally, holding other variables constant, administrators in buildings serving secondary grades (9–12) are 0.65 standard deviations less likely to envision SBG implementation than administrators serving elementary grades (p < .01).
Content Taught
Holding other variables constant, no statistically significant associations exist between administrators’ content they used to teach and their support for grading equity practices or vision of SBG implementation.
Education Degree
Holding other variables constant, no statistically significant associations exist between administrators’ degree levels and their support for grading equity practices or vision for SBG implementation.
District Characteristics
Although district characteristics were not part of our original investigation, we found that district size and the percentage of FRL students were statistically significant factors associated with our outcomes. A ten percent increase in district enrollment size correlates with a 0.12 standard deviation increase in support for grading equity practices (p < .01) and, similarly, a 0.14 standard deviation increase in the vision of SBG implementation (p < .01). As school size increases, so does support for grading equity practices and SBG implementation. Conversely, a ten percent increase in district FRL composition is associated with a 1.08 standard deviation decrease in support for grading equity practices (p < .01). However, it does not significantly impact the vision of SBG implementation.
Open Ended Response
We identified four major themes in participant responses: challenges in SBG implementation observed by school administrators, broad support and positive experiences with SBG, concerns about grading system equivalence, and resistance to SBG. Table 6a summarizes these themes and primary codes. Chi-square tests revealed no statistically significant association between the themes and participant demographics, such as race/ethnicity, gender, role, education level, or community type. Additionally, t-tests comparing mean outcome variables (ideology, SBG support, responsibility, vision, and FRL and White student populations) between groups discussing a theme versus those who did not are presented in Table 7a.
Theme 1: Structural Challenges, Including State Policy, Resources, and Communication, Impede the Implementation of SBG (131 Participants)
Participants who discussed structural limitations in SBG implementation had significantly lower mean levels of vision for SBG and came from districts with a high proportion of FRL and racially diverse students. This theme highlighted barriers to state policies and logistics, with administrators citing challenges due to the lack of a state-level plan for SBG. For example, Participant 120 noted, “It is impossible to implement SBG in the state’s version of e-school.” In contrast, Participant 181 stated, “State education policies are impeding the switch to SBG report cards in the upper grades.” Communication also emerged as a critical theme, with participants emphasizing the need for a clear, articulated plan across all levels of school administration to ensure community buy-in and consensus. Effective communication was essential for overcoming “lack of knowledge” and “lack of understanding.” Participant 54 observed, “While standards-based is a much better system...it will take lots of intentional effort...to ensure that the community understands why.” Participants stressed the importance of uniform communication, especially at the secondary level, where the traditional grading system is deeply ingrained.
Additionally, participants expressed concerns about the “lack of resources” and “professional development” necessary for successful SBG implementation. Time and financial resources were seen as critical barriers. For instance, Participant 114 noted, “Factors that impede implementation include teacher understanding with professional development and the cost in PD for teachers.” At the same time, Participant 158 highlighted the need for “time to train teachers and systems to collect data and track.” Participant 162 summarized the sentiment: “To successfully implement the concept, more professional development for all educators is extremely important.”
Theme 2: SBG is a Necessary Change That Places Mastery Learning at the Center of Assessment (87 Participants)
Participants who discussed the need for implementing SBG showed significantly higher levels of vision for SBG and served schools with a lower proportion of FRL students and a higher proportion of white students. This theme reflects participants' positive views on SBG, particularly its emphasis on mastery learning as the foundation of educational assessment. Many participants praised SBG as a better measure of student knowledge and a system that allows multiple opportunities for students to demonstrate mastery (e.g., Participant 157: “SBG is a far better measure of student knowledge… and allows for multiple opportunities for students to show mastery”; Participant 49: “SBG gets down to the essential standards, weeding out less critical criteria”). Participant 23 emphasized the need for SBG, stating, “Transitioning to standards-based grading is fundamental... averaging grades is educational malpractice and does not provide meaningful feedback.”
Some participants noted that their schools have already implemented or begun implementing SBG at the elementary level, highlighting benefits and positive experiences despite the challenges. For example, Participant 172 stated, “[SBG] helps students and parents better understand the true meaning of learning,” and Participant 34 shared, “We adopted SBG a few years ago, and it has been wonderful.” However, the transition has not been without difficulties. Participant 199 described the slow process, noting that shifting the focus from “chasing points” to proficiency was the biggest barrier. Despite these challenges, administrators remain hopeful about the future of SBG implementation. As Participant 245 noted, “We are progressing toward SBG but still overcoming barriers due to teacher mindset and traditional grading practices. I think we will be able to progress in the next two years, not the next school year.”
Theme 3: Equivalence of Grading Systems is Necessary for SBG Success (75 Participants)
There were no differences between participants who discussed and those who did not discuss concerns about the equivalence of grading systems. Participants emphasized that SBG’s success depends on developing equitable grading systems that transition seamlessly across educational levels. Concerns were raised about implementing SBG in middle and high schools, particularly regarding converting SBG reports to GPAs, supporting SBG in high schools, and aligning standards to report cards (e.g., Participant 49: “how to convert an SBG report to obtain a GPA equitably”; Participant 210: “HS lack of a grading system that does not support SBG”; Participant 259: “mixture of courses that are credited and others that are not, it is difficult [to do] SBG due to transcript reporting issues”). Many participants worried that SBG might hinder students’ post-secondary aspirations, mainly calculating GPAs and class ranks for college admissions and scholarships. Participant 61 summarized, “SBG seems like the best thing for teaching and learning but not for state reporting...the last thing we want to do is create issues in getting students to college and or money for college.” To address this, participants suggested that SBG needs to be understood and accepted across all educational levels, with Participant 112 noting, “I would like to see it expand through 12th grade, but colleges and universities (across the board) need to be willing to accept standards-based grades for acceptance.”
Theme 4: Individuals’ Traditional Mindsets and Misconceptions Prevent Discussions About SBG to Focusing on Actual Learning (74 Participants)
Participants who discussed the role of traditional mindsets had significantly lower levels of vision for SBG than those who did not. This theme highlighted resistance to SBG rooted in traditional beliefs about grading, often attributed to senior staff and seasoned teachers comfortable with existing practices. For example, Participant 6 noted, “Change is challenging and scary, especially to seasoned teachers that are comfortable with certain aspects of grading,” while Participant 121 remarked, “Adults are creatures of habit.” Misconceptions about SBG were also discussed, such as the belief that it lowers grades, confuses parents, does not prepare students for the real world, and causes classroom management issues (e.g., Participant 98: “[SBG] is a grading system that simultaneously lowers grades and confuses parents; traditions die hard in a small town”; Participant 160: “SBG causes classroom management problems because students do not focus because they can retake it later”). Participant 23 pointed out the fear that SBG might increase workload. At the same time, Participant 113 expressed concern that SBG could expose poor performance previously masked by traditional grading methods: “Instituting standards-based grading may hurt [the] classroom grade because it is now a TRUE reflection of student knowledge and performance.”
Discussion
This study used mixed methods to understand what factors might explain school principals’ support for SBG. Our findings offer significant insights into how administrators’ perceptions, shaped by the context of their schools and their own ideologies, play a crucial role in implementing SBG. This underscores the complexity of educational reform, where both the environmental setting of schools and the personal beliefs of principals critically dictate the trajectory and success of such initiatives.
Administrators’ Grading Perceptions
This study’s main finding is that principals’ context and personal beliefs significantly influence their understanding and support of SBG. Our hierarchical regression analyses revealed that principals with liberal views and a strong vision for SBG are likelier to endorse and support its implementation. These participants feel confident in their leadership abilities to secure community buy-in and perceive greater resource availability for SBG. Supportive principals were more likely to serve schools with a high proportion of white students and lower proportions of FRL students. Our thematic analysis (themes 1, 2, and 4) further supported this finding, highlighting the connection between school demographics and principals’ vision for SBG.
In contrast, participants who discussed barriers to SBG implementation and negative mindsets displayed lower levels of vision and typically served more diverse and low-income student populations. These administrators may anticipate more challenges due to existing resource limitations than a lack of support for SBG. The open-ended responses also revealed perceived challenges in implementing SBG at various levels (state, district, school) and the need for effective communication and consensus-building with stakeholders (Bauer, 2016; Campbell, 2023; Townsley et al., 2019). These concerns align with recent studies (e.g., Campbell, 2023; Nash, 2023) and reflect the broader cultural and institutional reform challenges required for SBG implementation. The themes of equivalence across educational levels and grading systems, particularly during the transition from K-12 to college, were also prominent.
Our quantitative analysis underscored the significant role of ideology in shaping support and vision for SBG. Principals with conservative views were more resistant to abandoning traditional grading practices, often due to misconceptions about SBG, such as its perceived leniency or tendency to inflate grades. In contrast, liberal-leaning participants were more open to SBG, valuing its focus on fairness and equitable grading. While ideology did not significantly affect the themes discussed by participants, 28% mentioned resistance to SBG due to traditional views on grading and student accountability. Principals with a strong vision for SBG, especially in conservative contexts, may need to develop strategic plans to educate stakeholders, secure resources, and allocate time for professional development (Bauer, 2016), thus ensuring the successful implementation of SBG.
Acknowledging SBG’s potential to transform grading practices underscores the important role of evaluator training. Effective implementation relies on robust systems and comprehensive educator training to ensure assessment consistency and fairness. Additionally, individual teacher tendencies, whether lenient or strict in grading, can significantly impact outcomes. This variation highlights the importance of ongoing professional development and support to align teachers’ assessment practices with SBG principles, enhancing effectiveness in various educational contexts.
Future Directions
Our research highlights the impact of school context and principals’ political ideologies on their perceptions and commitment to implementing SBG. Principals with liberal leanings, particularly in homogeneous and resource-rich schools, tend to have more favorable views toward SBG than their conservative counterparts or those in more challenging environments, showing greater confidence in securing community and stakeholder support. The study underscores the importance of considering educational context and political ideology in successfully implementing grading reforms. As the educational landscape evolves, there is a pressing need for comprehensive research on innovative practices like SBG and equitable grading. Despite increased scholarly attention, a significant gap in peer-reviewed studies necessitates further exploration.
Building on this study and previous work by Bauer (2016), future research should broaden the understanding of contextual variables, exploring leaders’ perceptions of SBG and readiness at various levels—school, district, and state. A multifaceted approach is needed to assess resource availability, including professional development, time allocation, and report card adaptations. Further investigation into the relationship between political ideology and SBG implementation is essential to determine whether ideology is a significant predictor or barrier to success. Additionally, there is a need for comprehensive program evaluation at all educational levels to empirically assess SBG’s impact on student and school outcomes, using rigorous methodologies to provide robust conclusions. In conclusion, understanding the complexities of SBG requires a comprehensive approach that intertwines ideological, contextual, and practical dimensions, paving the way for informed practices and policies that genuinely support student learning.
Footnotes
Declaration of Conflicting Interests
The authors declared no potential conflicts of interest with respect to the research, authorship, and/or publication of this article.
Funding
The authors received no financial support for the research, authorship, and/or publication of this article.
Appendix
Administrator Demographics of Administrators’ Grading Perceptions Survey.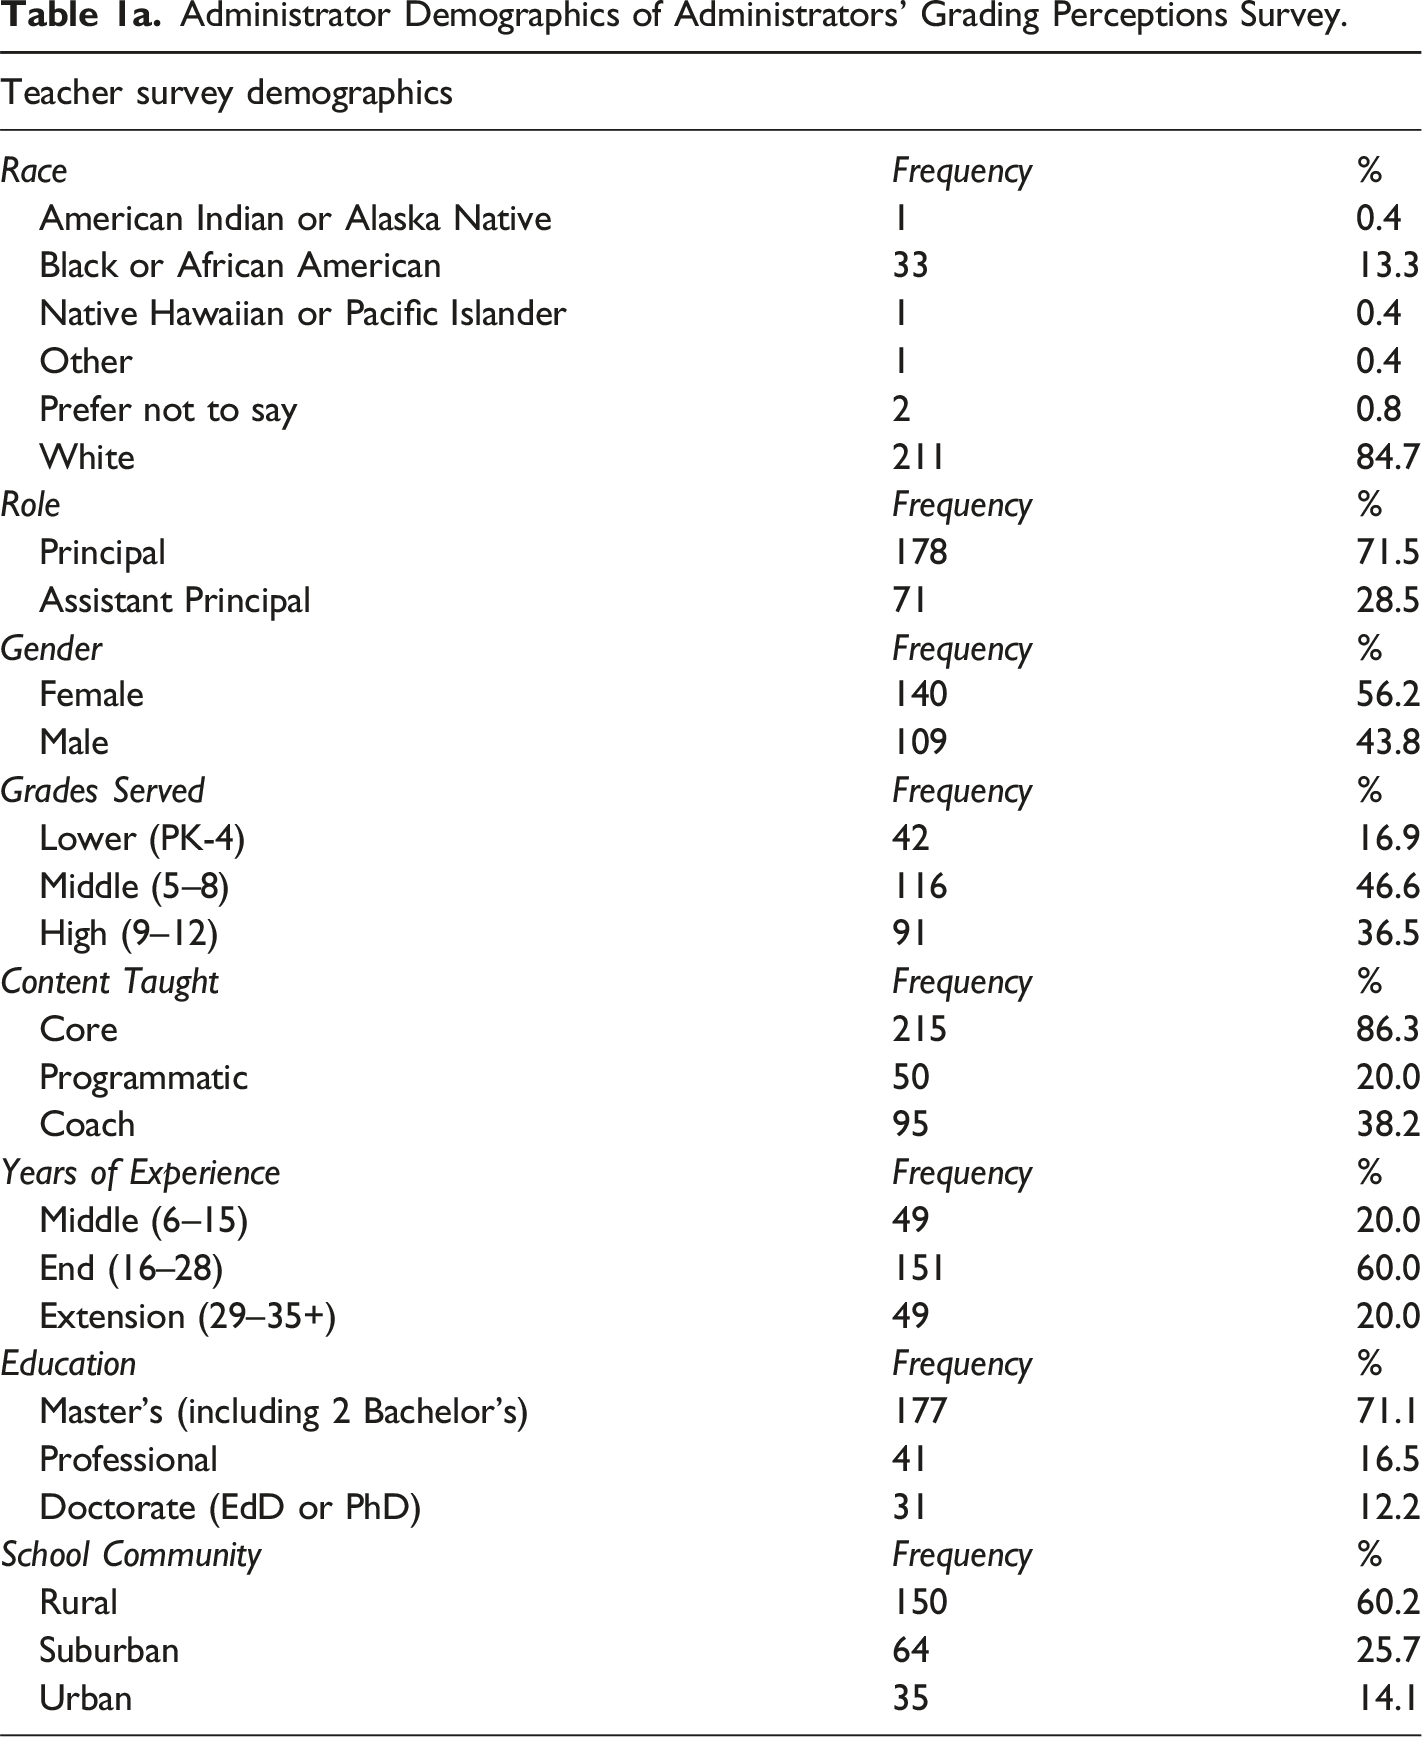
Teacher survey demographics
Race
Frequency
%
American Indian or Alaska Native
1
0.4
Black or African American
33
13.3
Native Hawaiian or Pacific Islander
1
0.4
Other
1
0.4
Prefer not to say
2
0.8
White
211
84.7
Role
Frequency
%
Principal
178
71.5
Assistant Principal
71
28.5
Gender
Frequency
%
Female
140
56.2
Male
109
43.8
Grades Served
Frequency
%
Lower (PK-4)
42
16.9
Middle (5–8)
116
46.6
High (9–12)
91
36.5
Content Taught
Frequency
%
Core
215
86.3
Programmatic
50
20.0
Coach
95
38.2
Years of Experience
Frequency
%
Middle (6–15)
49
20.0
End (16–28)
151
60.0
Extension (29–35+)
49
20.0
Education
Frequency
%
Master’s (including 2 Bachelor’s)
177
71.1
Professional
41
16.5
Doctorate (EdD or PhD)
31
12.2
School Community
Frequency
%
Rural
150
60.2
Suburban
64
25.7
Urban
35
14.1
Survey Instrument Questions.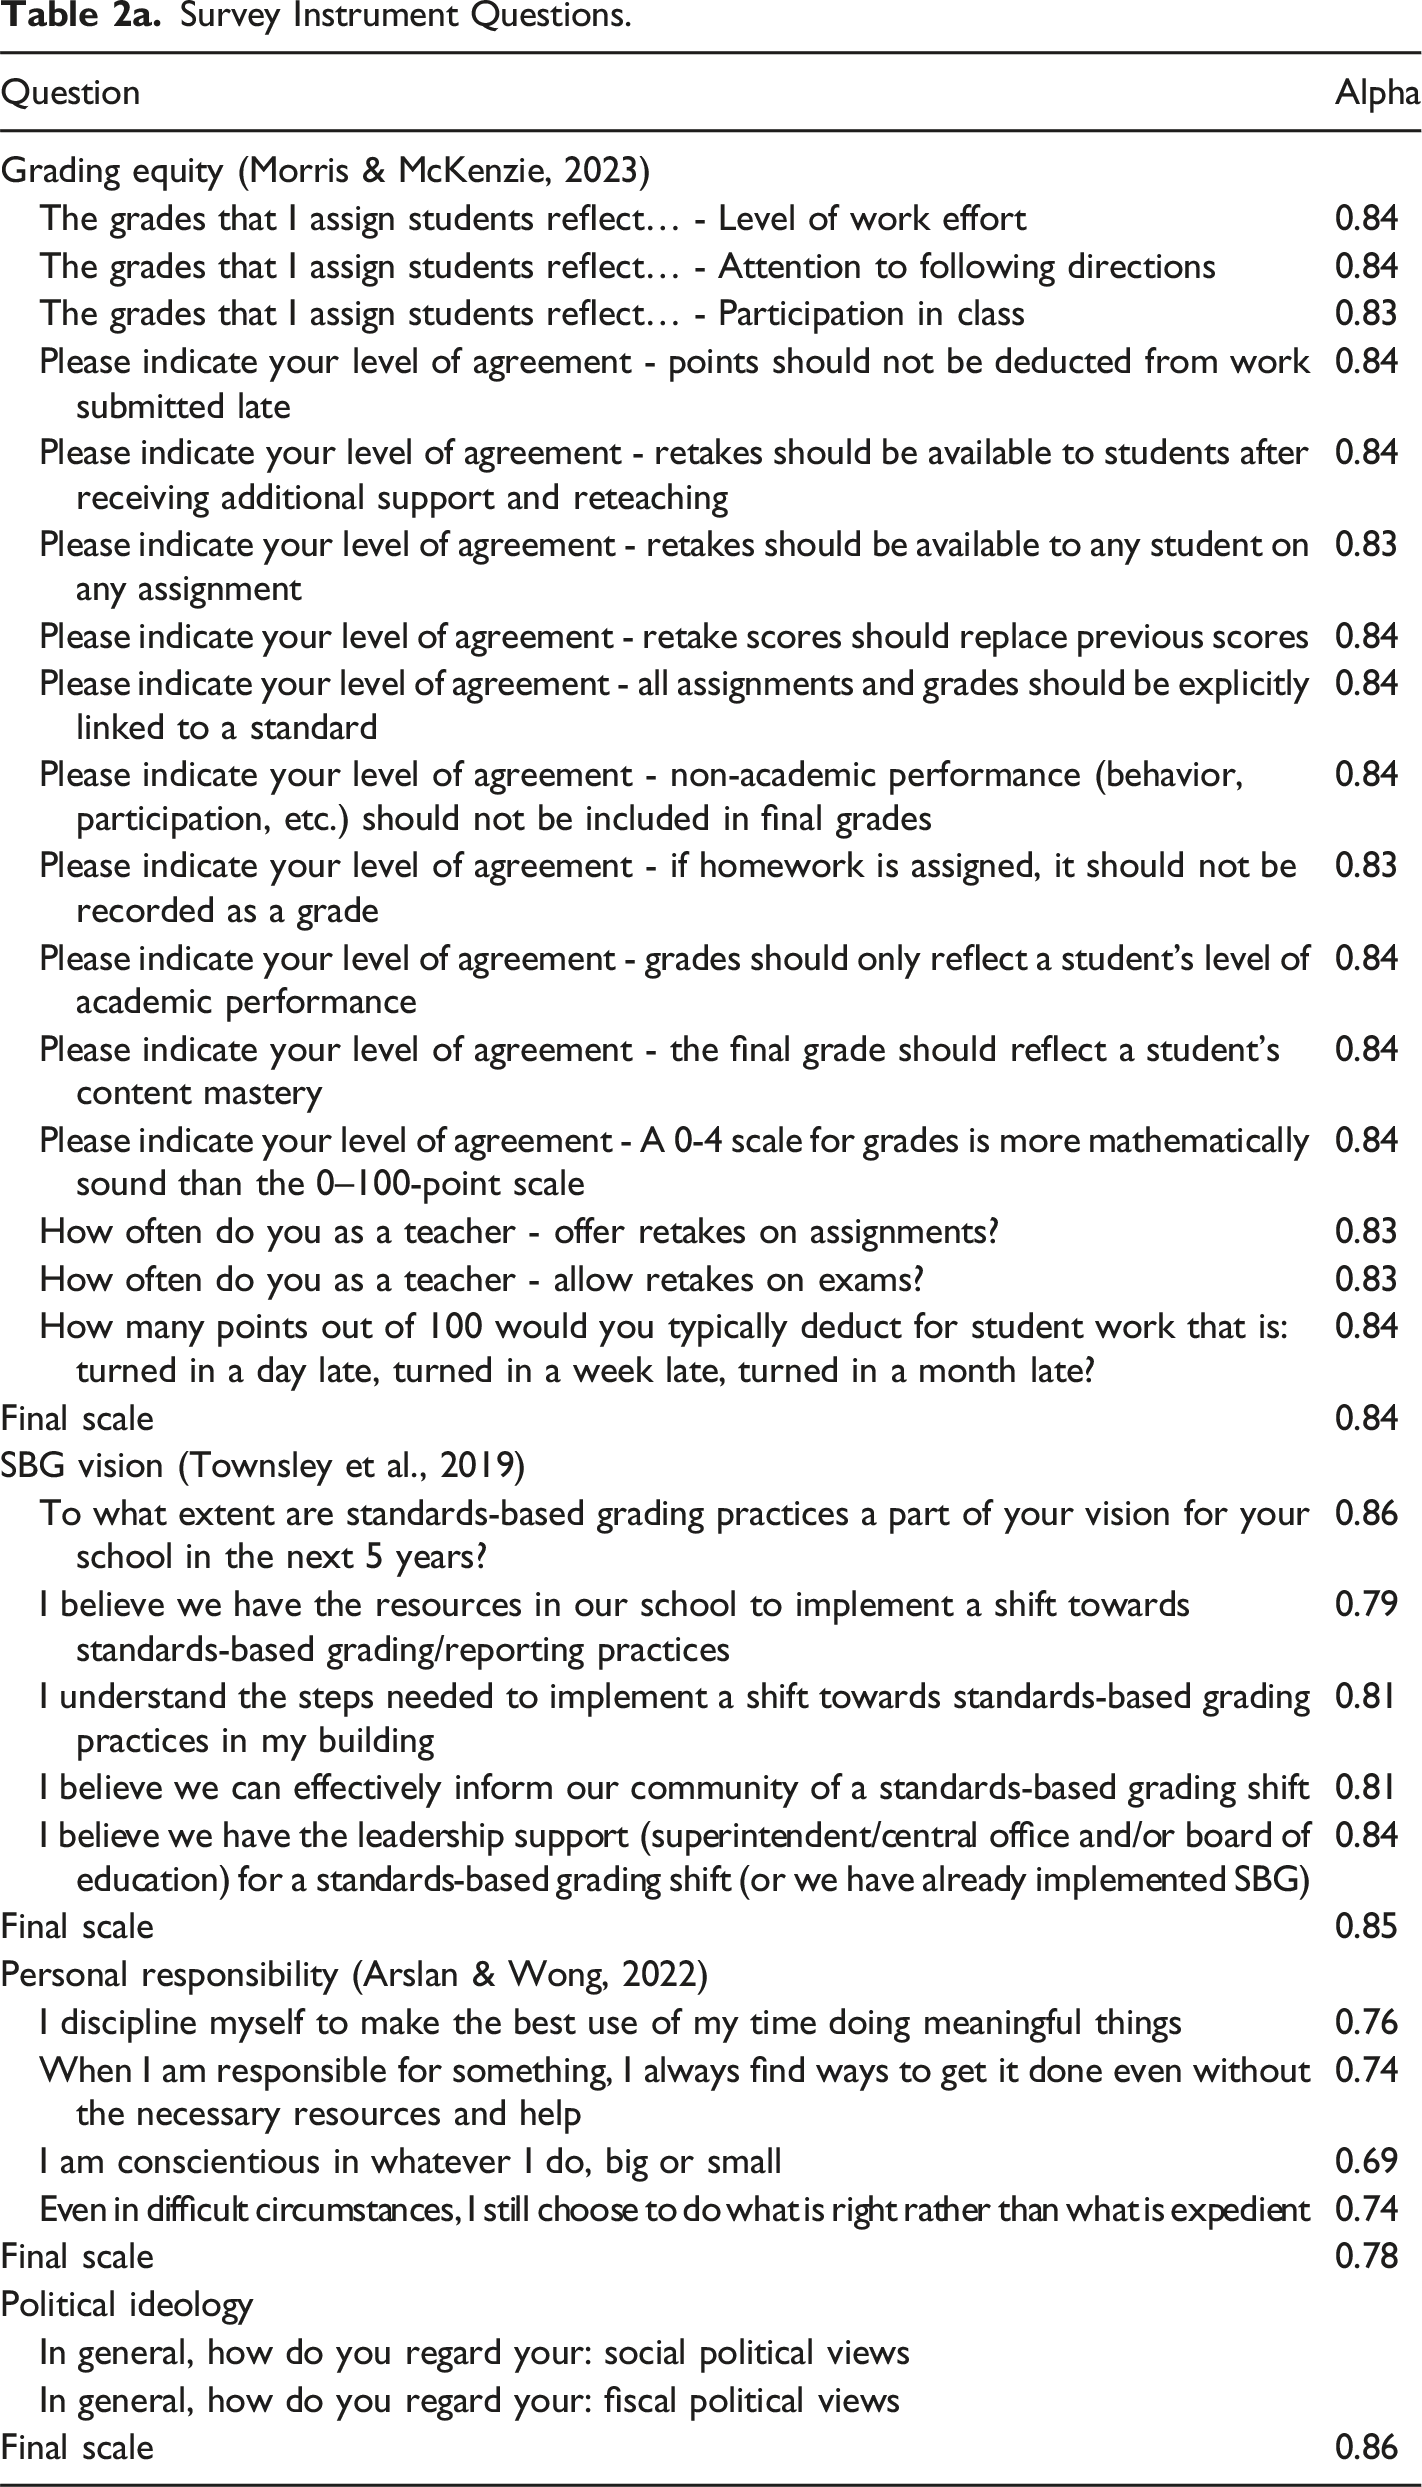
Question
Alpha
Grading equity (Morris & McKenzie, 2023)
The grades that I assign students reflect… - Level of work effort
0.84
The grades that I assign students reflect… - Attention to following directions
0.84
The grades that I assign students reflect… - Participation in class
0.83
Please indicate your level of agreement - points should not be deducted from work submitted late
0.84
Please indicate your level of agreement - retakes should be available to students after receiving additional support and reteaching
0.84
Please indicate your level of agreement - retakes should be available to any student on any assignment
0.83
Please indicate your level of agreement - retake scores should replace previous scores
0.84
Please indicate your level of agreement - all assignments and grades should be explicitly linked to a standard
0.84
Please indicate your level of agreement - non-academic performance (behavior, participation, etc.) should not be included in final grades
0.84
Please indicate your level of agreement - if homework is assigned, it should not be recorded as a grade
0.83
Please indicate your level of agreement - grades should only reflect a student’s level of academic performance
0.84
Please indicate your level of agreement - the final grade should reflect a student’s content mastery
0.84
Please indicate your level of agreement - A 0-4 scale for grades is more mathematically sound than the 0–100-point scale
0.84
How often do you as a teacher - offer retakes on assignments?
0.83
How often do you as a teacher - allow retakes on exams?
0.83
How many points out of 100 would you typically deduct for student work that is: turned in a day late, turned in a week late, turned in a month late?
0.84
Final scale
0.84
SBG vision (Townsley et al., 2019)
To what extent are standards-based grading practices a part of your vision for your school in the next 5 years?
0.86
I believe we have the resources in our school to implement a shift towards standards-based grading/reporting practices
0.79
I understand the steps needed to implement a shift towards standards-based grading practices in my building
0.81
I believe we can effectively inform our community of a standards-based grading shift
0.81
I believe we have the leadership support (superintendent/central office and/or board of education) for a standards-based grading shift (or we have already implemented SBG)
0.84
Final scale
0.85
Personal responsibility (Arslan & Wong, 2022)
I discipline myself to make the best use of my time doing meaningful things
0.76
When I am responsible for something, I always find ways to get it done even without the necessary resources and help
0.74
I am conscientious in whatever I do, big or small
0.69
Even in difficult circumstances, I still choose to do what is right rather than what is expedient
0.74
Final scale
0.78
Political ideology
In general, how do you regard your: social political views
In general, how do you regard your: fiscal political views
Final scale
0.86
Hierarchical Linear Regression Model Results. ***p < .01, **p < .05.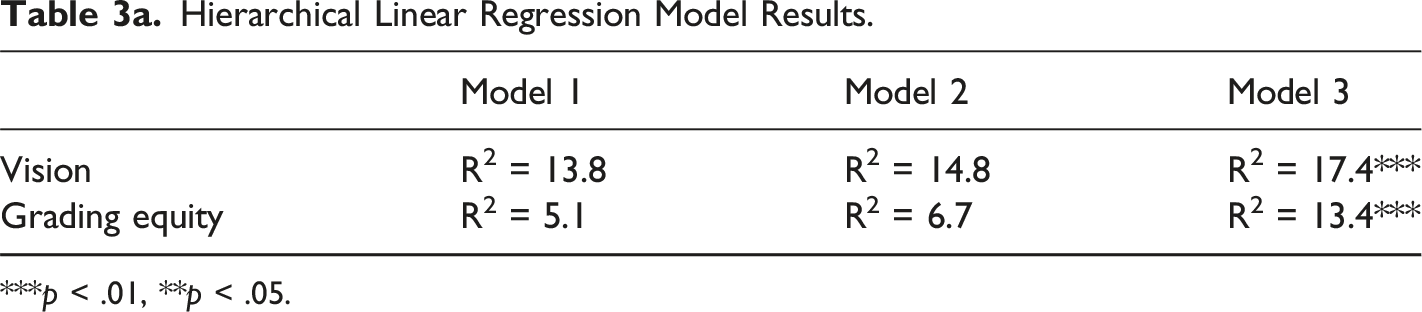
Model 1
Model 2
Model 3
Vision
R2 = 13.8
R2 = 14.8
R2 = 17.4***
Grading equity
R2 = 5.1
R2 = 6.7
R2 = 13.4***
Political Ideologies and Perceptions of Grading Equity Practices.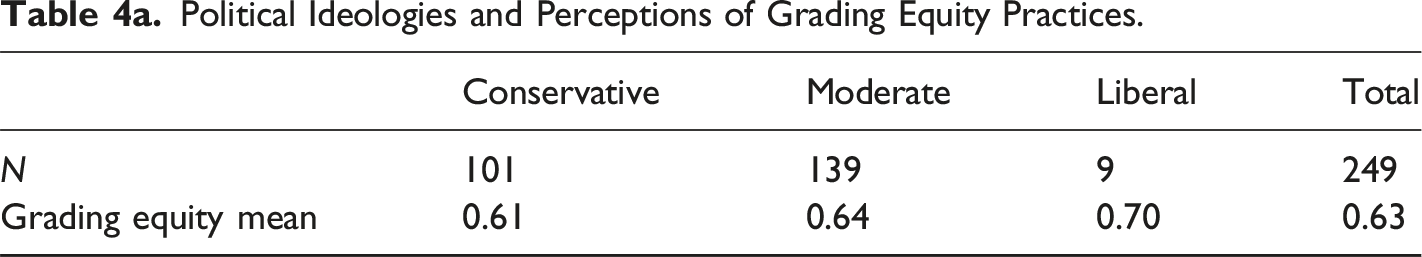
Conservative
Moderate
Liberal
Total
N
101
139
9
249
Grading equity mean
0.61
0.64
0.70
0.63
OLS Regression Analyses of Administrators’ Grading Perceptions and Administrator Characteristics on Grading Equity Practices. Note. Robust standard errors are in parenthesis. Support for grading equity practices and the vision of SBG implementation are in standard deviations. ***p < .01, **p < .05.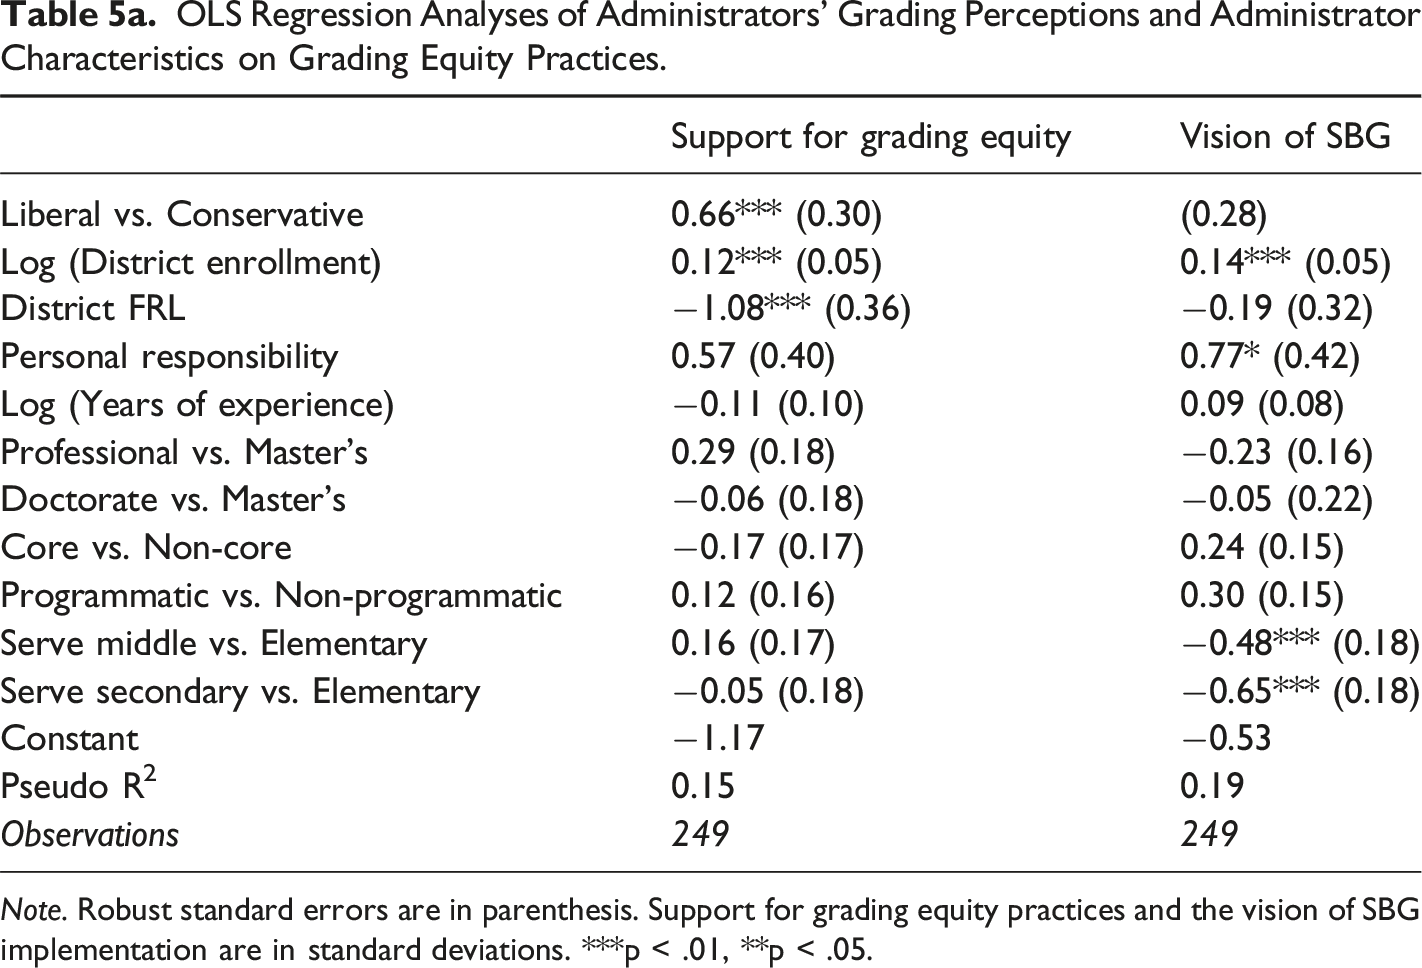
Support for grading equity
Vision of SBG
Liberal vs. Conservative
0.66*** (0.30)
(0.28)
Log (District enrollment)
0.12*** (0.05)
0.14*** (0.05)
District FRL
−1.08*** (0.36)
−0.19 (0.32)
Personal responsibility
0.57 (0.40)
0.77* (0.42)
Log (Years of experience)
−0.11 (0.10)
0.09 (0.08)
Professional vs. Master’s
0.29 (0.18)
−0.23 (0.16)
Doctorate vs. Master’s
−0.06 (0.18)
−0.05 (0.22)
Core vs. Non-core
−0.17 (0.17)
0.24 (0.15)
Programmatic vs. Non-programmatic
0.12 (0.16)
0.30 (0.15)
Serve middle vs. Elementary
0.16 (0.17)
−0.48*** (0.18)
Serve secondary vs. Elementary
−0.05 (0.18)
−0.65*** (0.18)
Constant
−1.17
−0.53
Pseudo R2
0.15
0.19
Observations
249
249
Summary of Themes Across Participant Responses.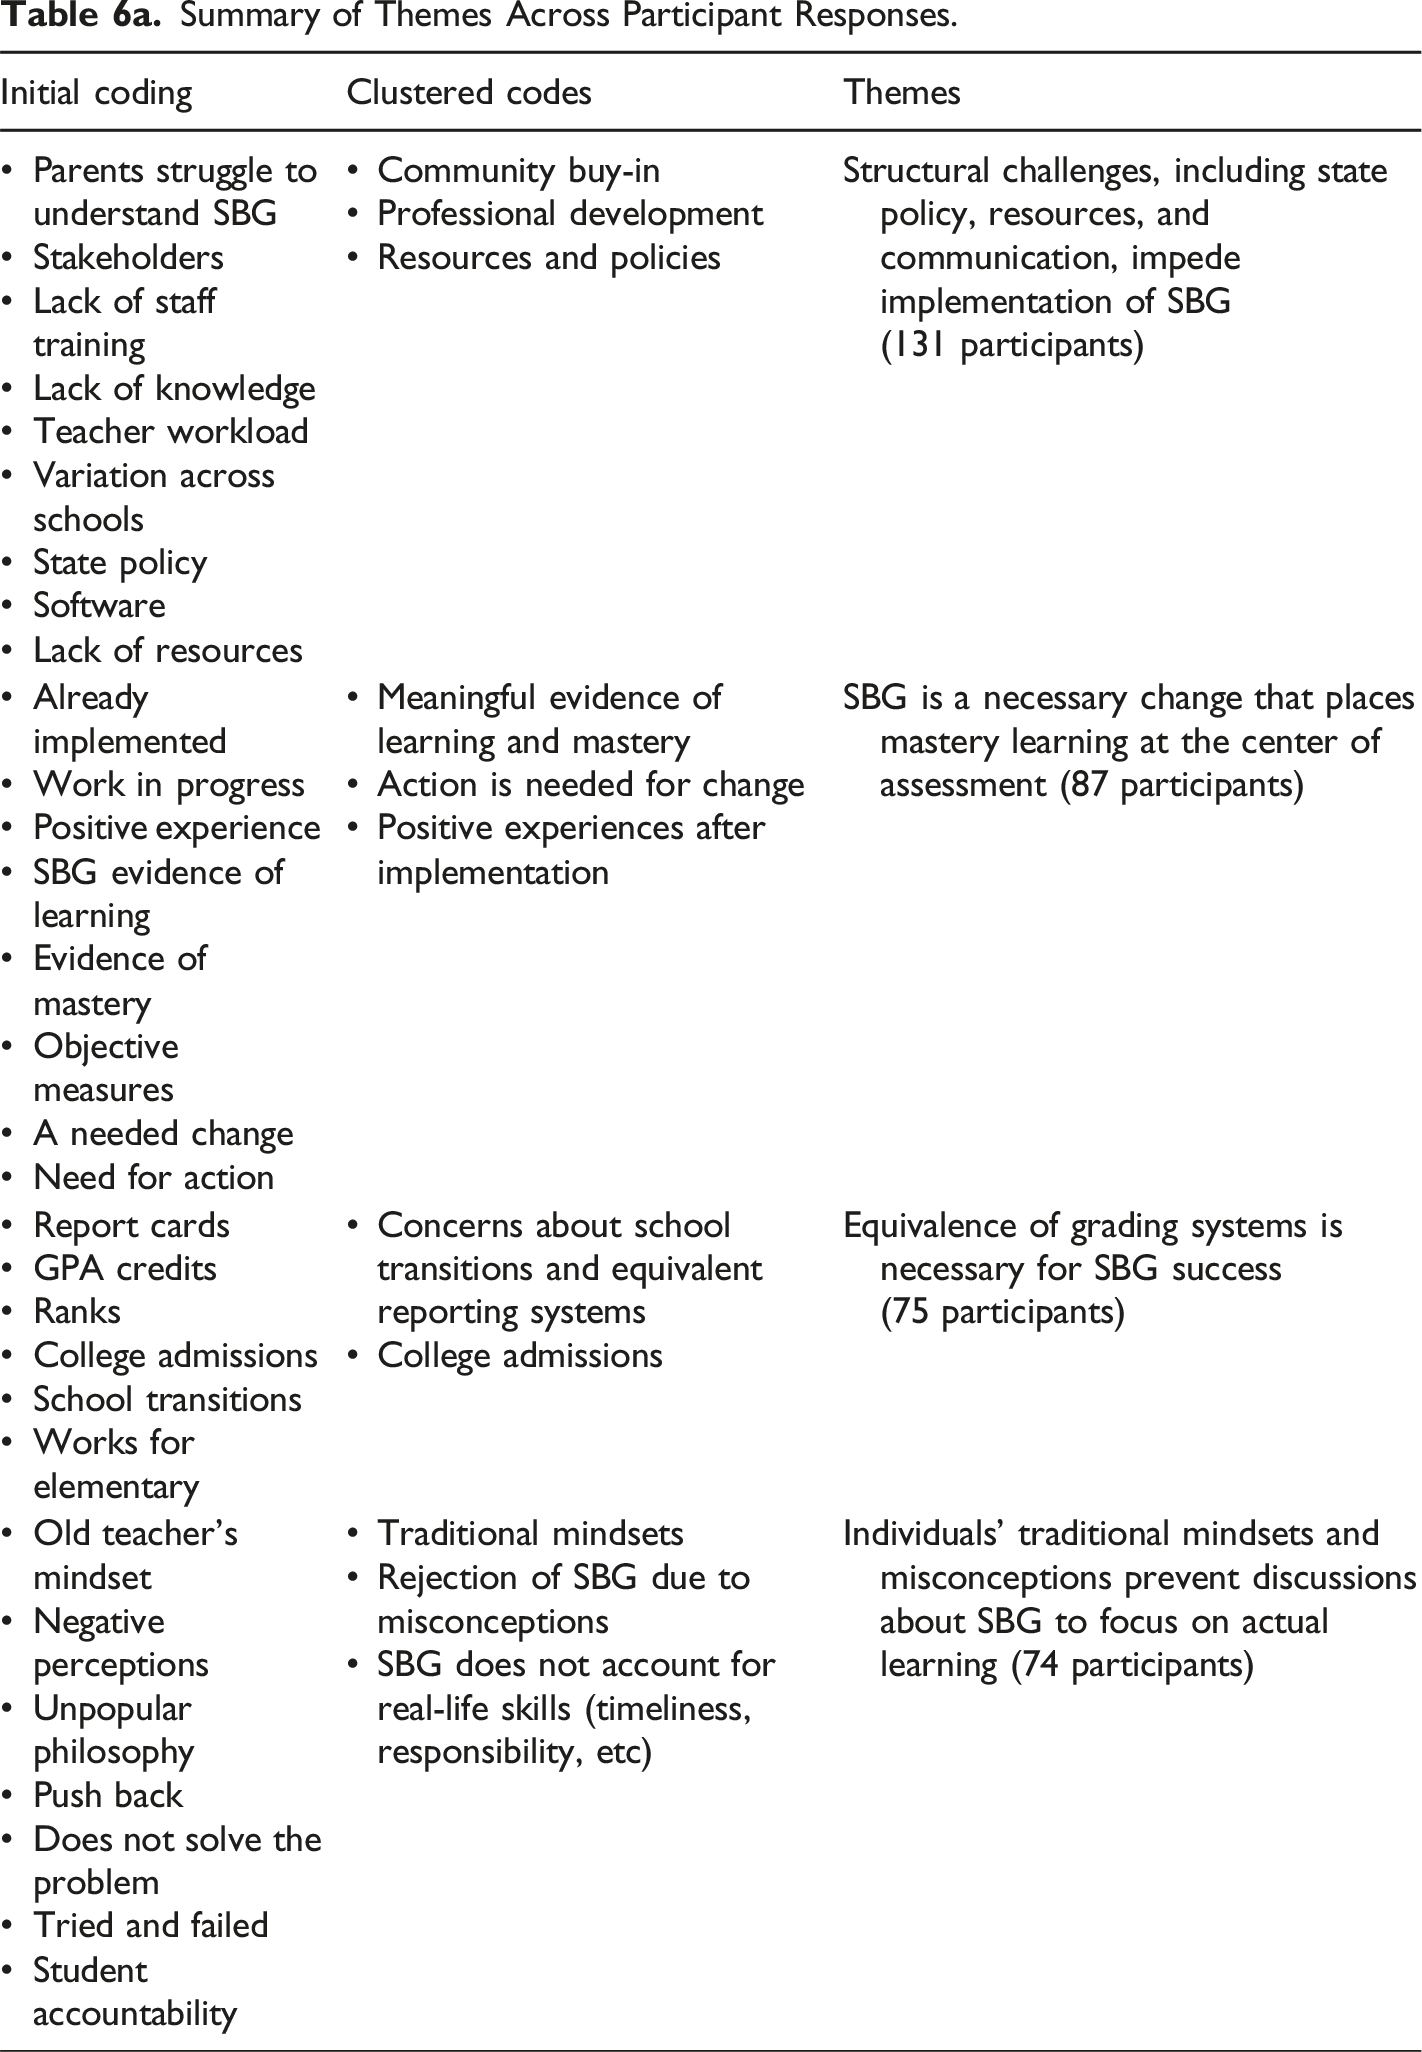
Initial coding
Clustered codes
Themes
• Parents struggle to understand SBG
• Stakeholders
• Lack of staff training
• Lack of knowledge
• Teacher workload
• Variation across schools
• State policy
• Software
• Lack of resources• Community buy-in
• Professional development
• Resources and policiesStructural challenges, including state policy, resources, and communication, impede implementation of SBG (131 participants)
• Already implemented
• Work in progress
• Positive experience
• SBG evidence of learning
• Evidence of mastery
• Objective measures
• A needed change
• Need for action• Meaningful evidence of learning and mastery
• Action is needed for change
• Positive experiences after implementationSBG is a necessary change that places mastery learning at the center of assessment (87 participants)
• Report cards
• GPA credits
• Ranks
• College admissions
• School transitions
• Works for elementary• Concerns about school transitions and equivalent reporting systems
• College admissionsEquivalence of grading systems is necessary for SBG success (75 participants)
• Old teacher’s mindset
• Negative perceptions
• Unpopular philosophy
• Push back
• Does not solve the problem
• Tried and failed
• Student accountability• Traditional mindsets
• Rejection of SBG due to misconceptions
• SBG does not account for real-life skills (timeliness, responsibility, etc)Individuals’ traditional mindsets and misconceptions prevent discussions about SBG to focus on actual learning (74 participants)
Summary of Mean Comparisons of Variables of Interest Across Themes.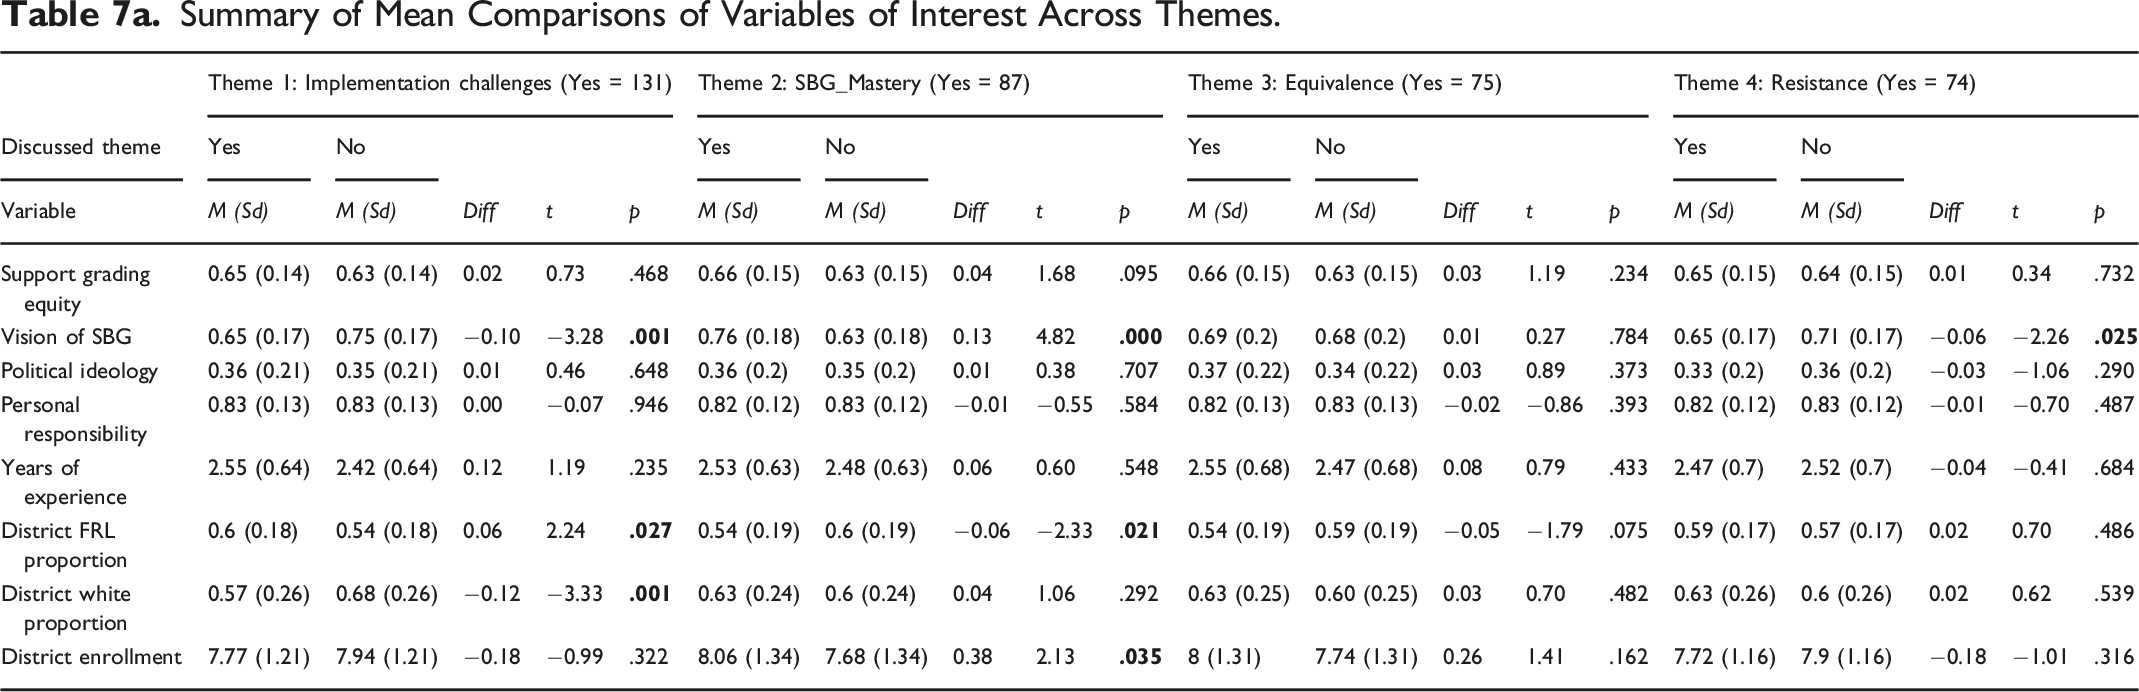
Theme 1: Implementation challenges (Yes = 131)
Theme 2: SBG_Mastery (Yes = 87)
Theme 3: Equivalence (Yes = 75)
Theme 4: Resistance (Yes = 74)
Discussed theme
Yes
No
Yes
No
Yes
No
Yes
No
Variable
M (Sd)
M (Sd)
Diff
t
p
M (Sd)
M (Sd)
Diff
t
p
M (Sd)
M (Sd)
Diff
t
p
M (Sd)
M (Sd)
Diff
t
p
Support grading equity
0.65 (0.14)
0.63 (0.14)
0.02
0.73
.468
0.66 (0.15)
0.63 (0.15)
0.04
1.68
.095
0.66 (0.15)
0.63 (0.15)
0.03
1.19
.234
0.65 (0.15)
0.64 (0.15)
0.01
0.34
.732
Vision of SBG
0.65 (0.17)
0.75 (0.17)
−0.10
−3.28
0.76 (0.18)
0.63 (0.18)
0.13
4.82
0.69 (0.2)
0.68 (0.2)
0.01
0.27
.784
0.65 (0.17)
0.71 (0.17)
−0.06
−2.26
Political ideology
0.36 (0.21)
0.35 (0.21)
0.01
0.46
.648
0.36 (0.2)
0.35 (0.2)
0.01
0.38
.707
0.37 (0.22)
0.34 (0.22)
0.03
0.89
.373
0.33 (0.2)
0.36 (0.2)
−0.03
−1.06
.290
Personal responsibility
0.83 (0.13)
0.83 (0.13)
0.00
−0.07
.946
0.82 (0.12)
0.83 (0.12)
−0.01
−0.55
.584
0.82 (0.13)
0.83 (0.13)
−0.02
−0.86
.393
0.82 (0.12)
0.83 (0.12)
−0.01
−0.70
.487
Years of experience
2.55 (0.64)
2.42 (0.64)
0.12
1.19
.235
2.53 (0.63)
2.48 (0.63)
0.06
0.60
.548
2.55 (0.68)
2.47 (0.68)
0.08
0.79
.433
2.47 (0.7)
2.52 (0.7)
−0.04
−0.41
.684
District FRL proportion
0.6 (0.18)
0.54 (0.18)
0.06
2.24
0.54 (0.19)
0.6 (0.19)
−0.06
−2.33
.
0.54 (0.19)
0.59 (0.19)
−0.05
−1.79
.075
0.59 (0.17)
0.57 (0.17)
0.02
0.70
.486
District white proportion
0.57 (0.26)
0.68 (0.26)
−0.12
−3.33
0.63 (0.24)
0.6 (0.24)
0.04
1.06
.292
0.63 (0.25)
0.60 (0.25)
0.03
0.70
.482
0.63 (0.26)
0.6 (0.26)
0.02
0.62
.539
District enrollment
7.77 (1.21)
7.94 (1.21)
−0.18
−0.99
.322
8.06 (1.34)
7.68 (1.34)
0.38
2.13
8 (1.31)
7.74 (1.31)
0.26
1.41
.162
7.72 (1.16)
7.9 (1.16)
−0.18
−1.01
.316