
Abstract
Research provides ample evidence that positive social relations and access to knowledge are supportive for educational change. However, few studies have examined how personnel turnover and restructuring in school districts influence these processes, specifically as they relate to leaders’ access to research evidence and perception of organizational learning and culture. In this longitudinal exploratory mixed-methods case study, we examine the changes in social networks and organizational learning among school and district leaders during a 3-year district restructuring process. Our study uses social network analysis, bivariate analyses, and qualitative coding. We surveyed district and school leaders about their districts’ capacity for organizational learning, organizational culture, and social ties around research evidence. Our results suggest a decrease in the district’s capacity to diffuse ideas from research between Years 1 and 3, which may inhibit efforts for improvement. Further, the data on school and district leaders who did not leave the district indicates a decrease in the perception of organizational learning and culture in school sites, but not in the district with differences between principals and central office staff. Qualitative findings support an association between the restructuring and changes in organizational learning and social structures and provide further reasons for the changes (e.g., lack of communication, time to maintain/build relationships, and opportunities for professional development). These findings speak to the importance of leaders focusing on the social side of change during times of churn, including strengthening trust, fostering collective values and beliefs, and countering division.
Keywords
While efforts to improve educational systems and bring about change in the U.S. have a long history, many of the same concerns around stagnant performance, particularly in urban districts, are raised year after year. It has become evident that a positive social infrastructure is essential for change (Daly, 2010; Finnigan & Daly, 2012; Hopkins et al., 2015; Payne & Kaba, 2007) since reforms are implemented and generated in personal interactions among actors who confront real problems and make policy in their everyday actions (Mehan et al., 2010). It follows that professional collaboration (Datnow & Park, 2019) and organizational learning (Louis, 2006) among educators are critical for educational reforms. However, these social relationships are frequently interrupted by personnel turnover and restructuring (Finnigan et al., 2016). This interruption affects communication behaviors and the movement of knowledge between and within organizations, which, in turn, affects organizational learning and educational change (Daly, 2010; Ji et al., 2014; Nahapiet & Ghoshal, 1998). One key type of knowledge is the knowledge from research, which continues to play a limited role in the decision-making of central office staff (Farley-Ripple, 2012) and principals (Fraser et al., 2018). These same leaders, however, play a crucial role in directing improvement efforts based on different types of evidence (Finnigan & Daly, 2014).
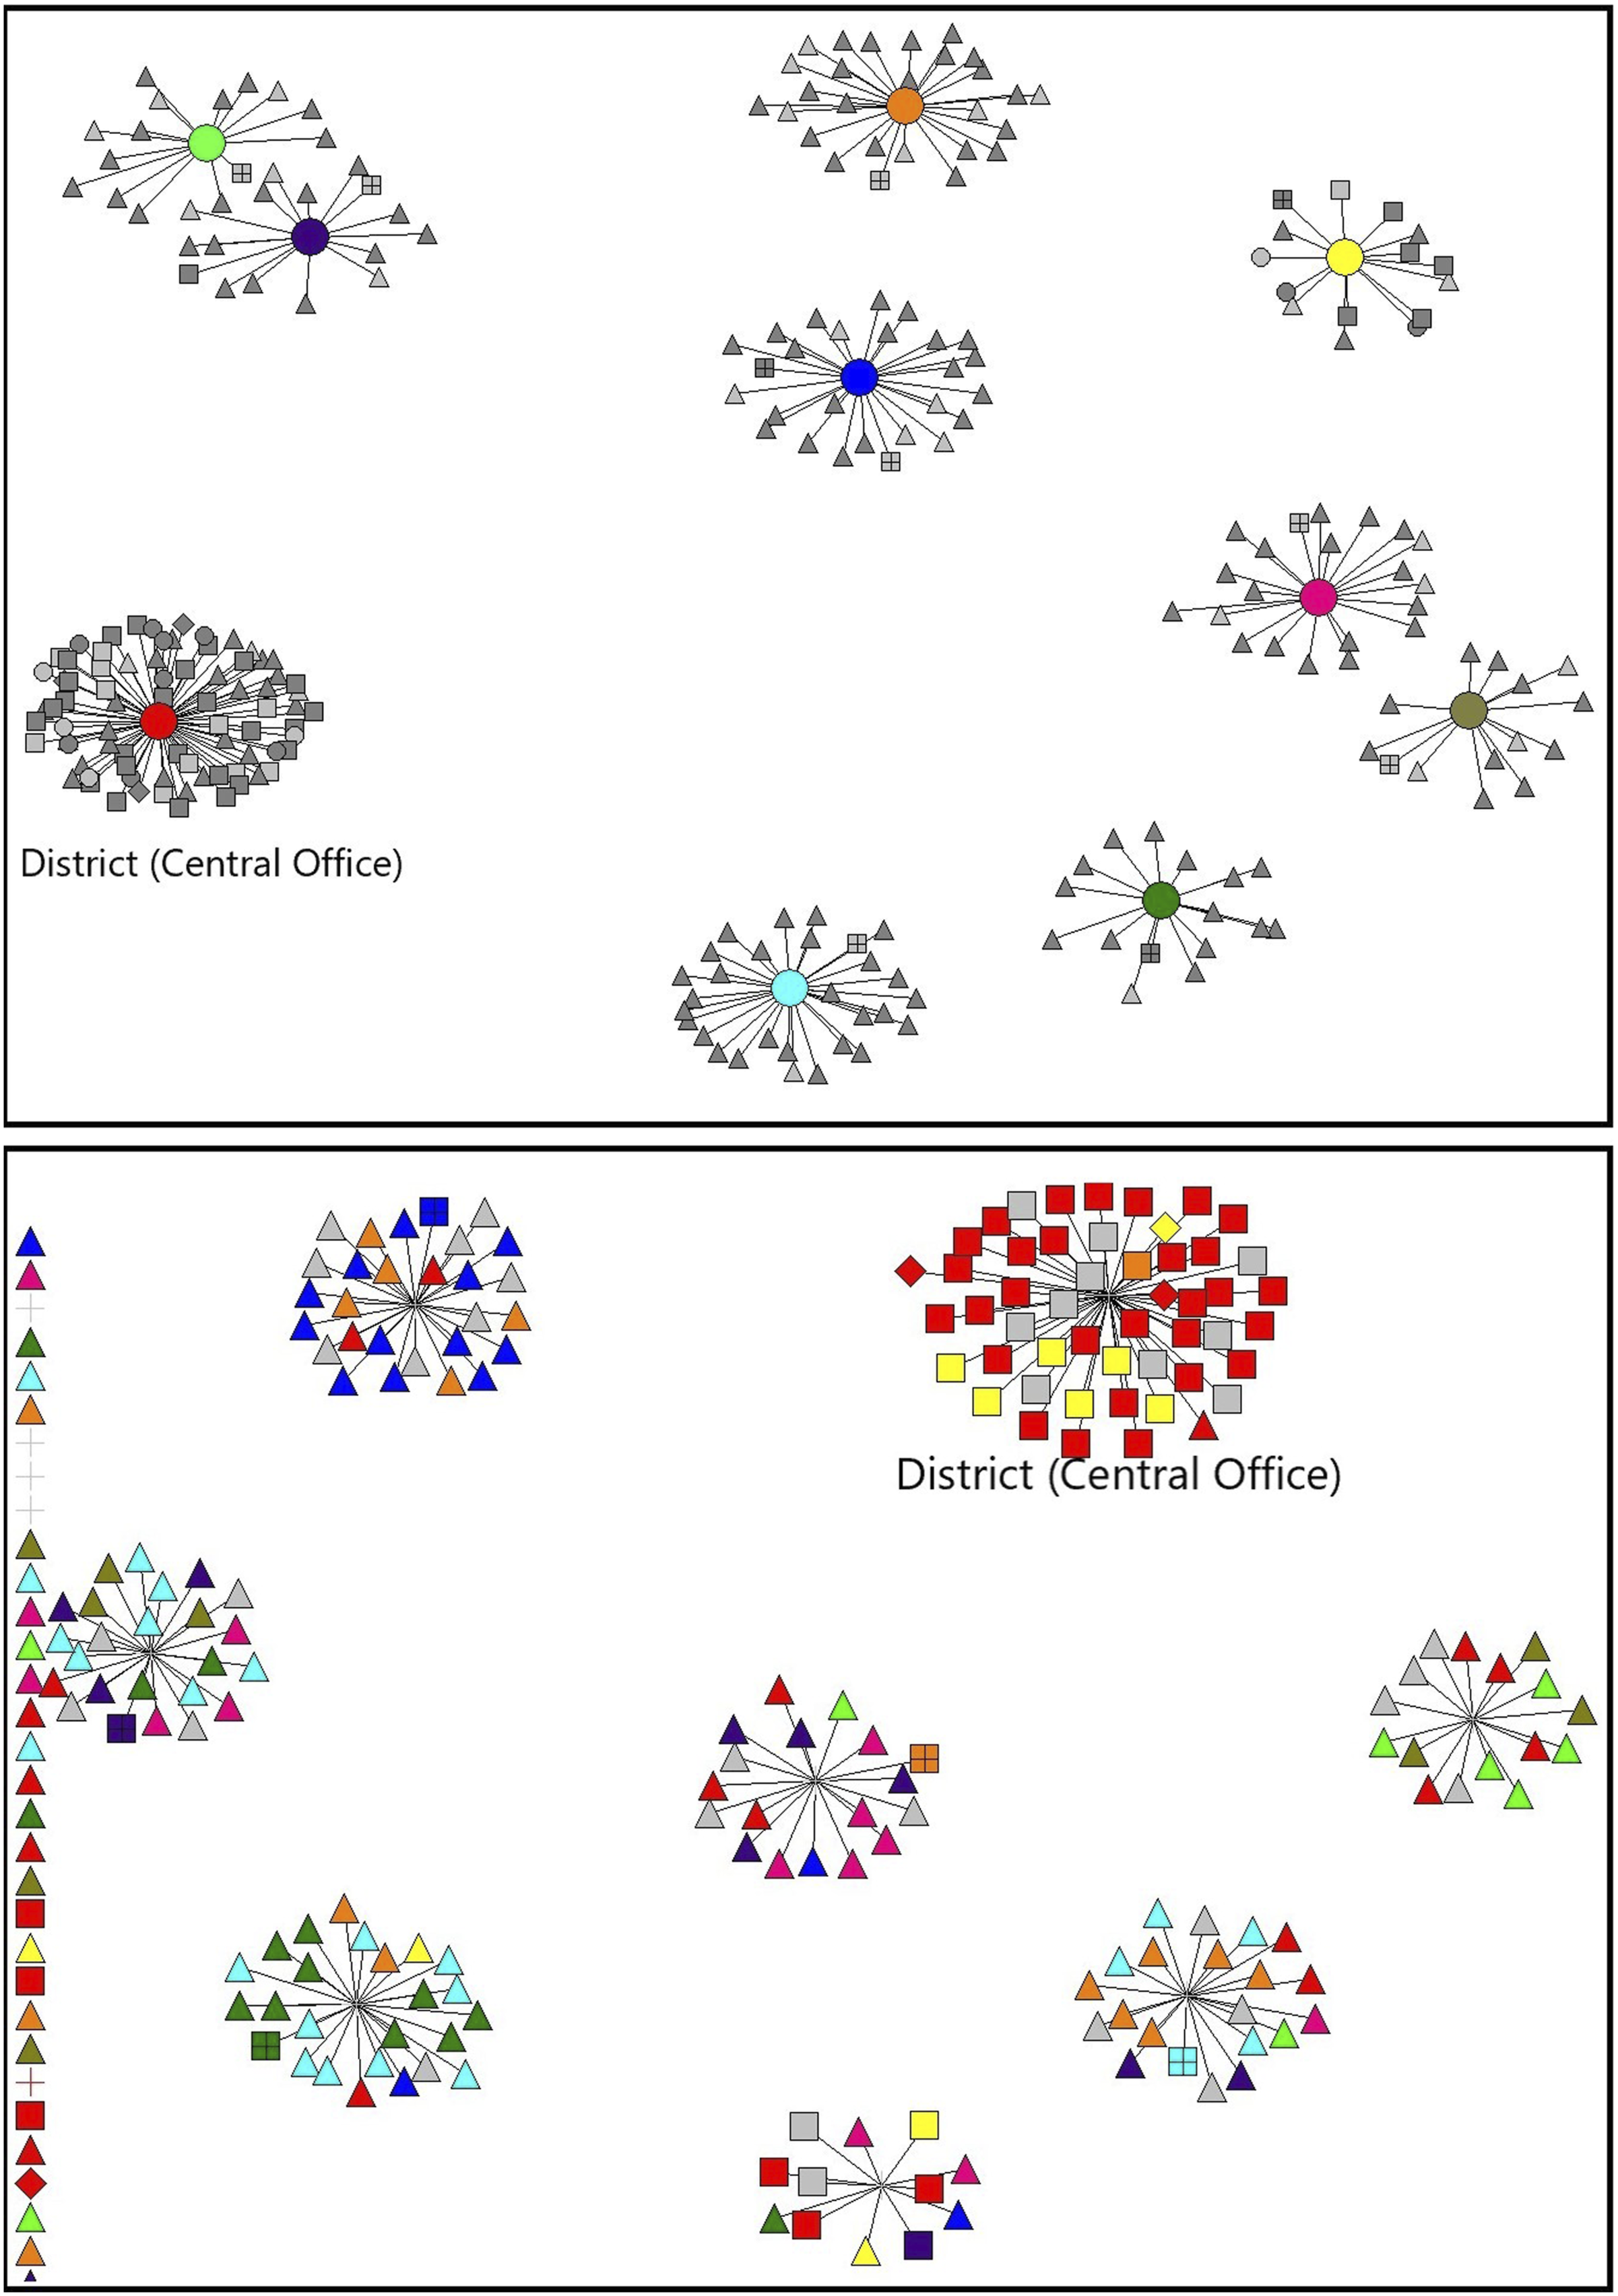
To gain a more nuanced understanding of the movement of knowledge over time among district leaders in pursuit of organizational learning and educational change, we conducted a mixed-methods study in a large urban school district in the Western U.S. The purpose of this article is to examine what happens in a district during a 3-year restructuring process accompanied by a large leadership churn. With restructuring, we refer to the change of the district’s organizational structure (see Figure 1). The following research questions guided our study: 1. To what degree is a district 3-year restructuring and leadership churn related to the underlying social structure and access to research evidence? 2. How did leaders’ perceptions of the organizational climate and organizational learning change over time? Area-Affiliation Networks in Years 1 (top) and 3 (bottom), and Leaders’ Re-Assignment to Areas.
Theoretical Framework and Literature Review
This study is grounded in the literature on school and district leadership turnover, organizational learning theory, and research evidence in education (see Figure 2). Theoretical Framework.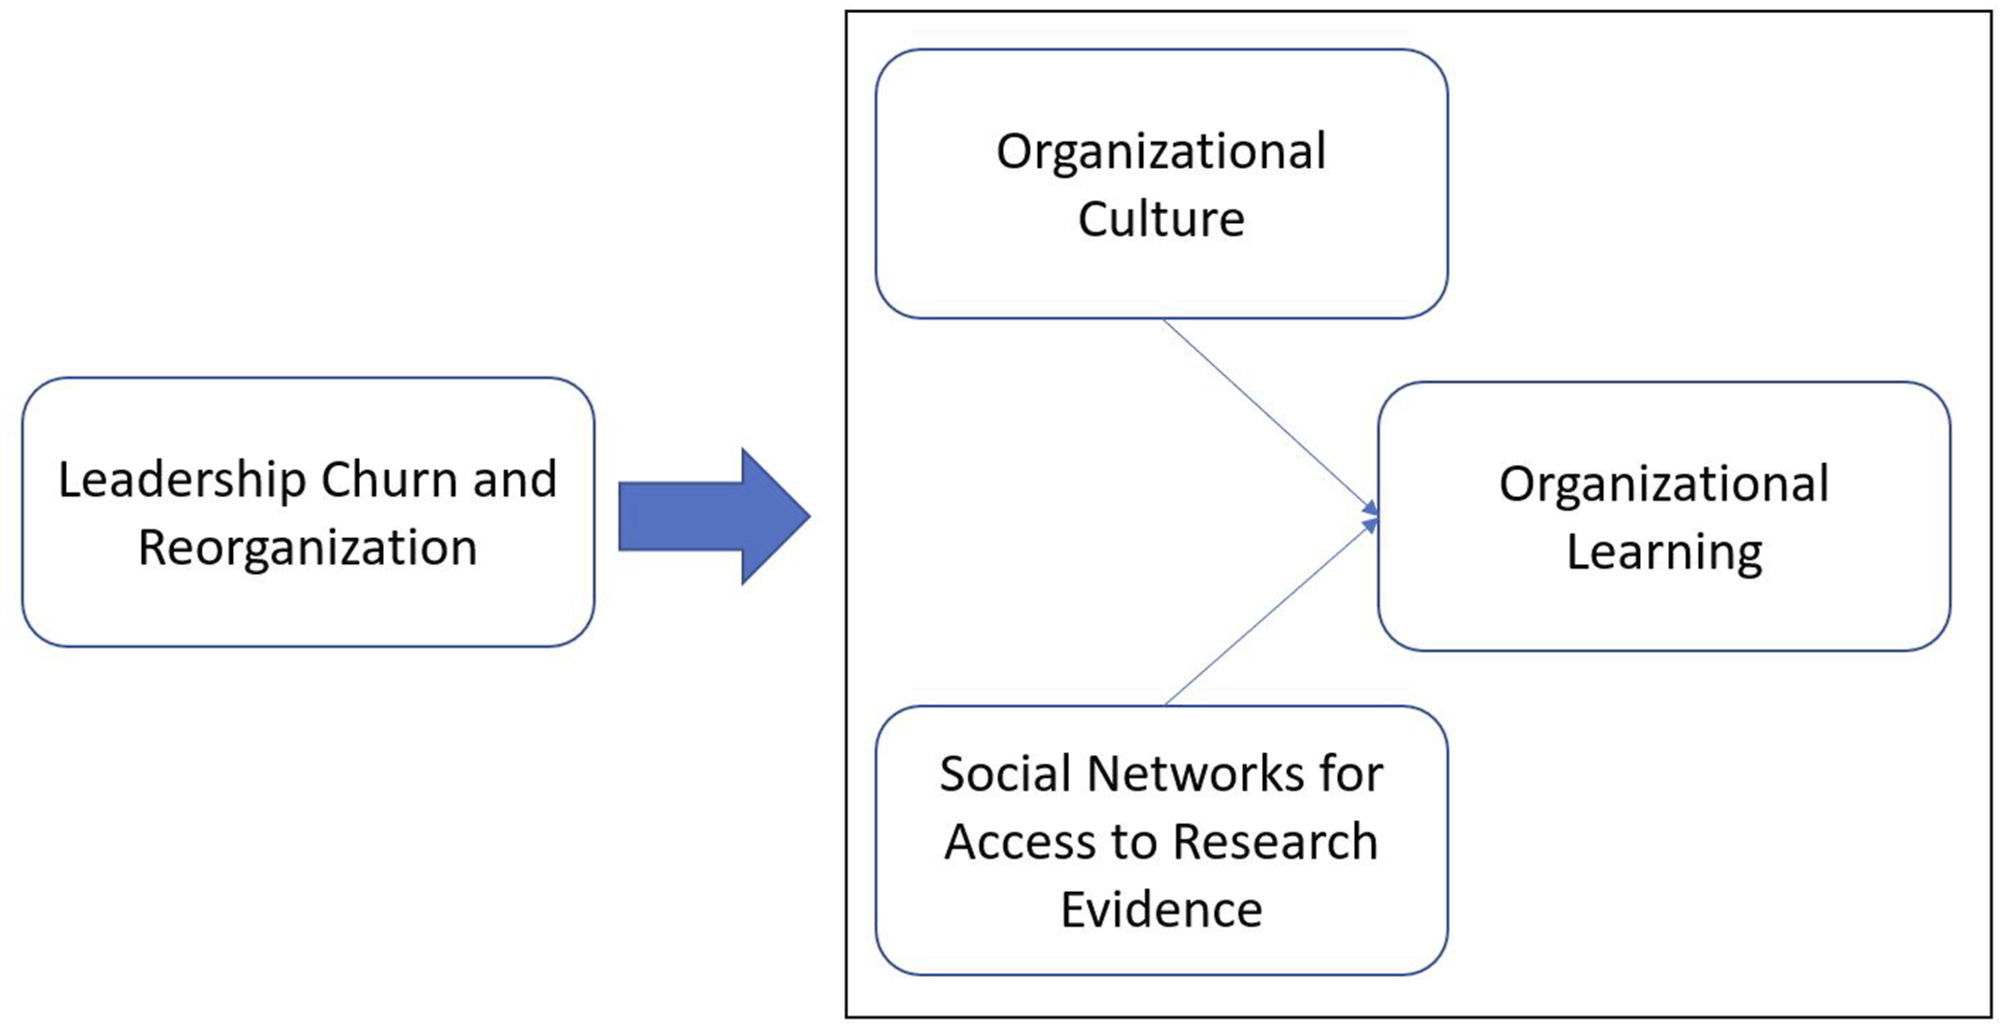
School and District Leadership Turnover and Churn
Leadership turnover in schools and districts is common. Turnover is defined as “changes to other schools, districts, or positions as well as exits from the school system all together” (Snodgrass Rangel, 2018, p. 87). In 2015–16, approximately 82% of all U.S. public school principals remained at the same school for the consecutive school year, whereas 18% left their school (Goldring & Taie, 2018). Similar observations were made for superintendents: for example, of 215 randomly selected superintendents in California, 45% left their position within three years (Grissom & Andersen, 2012). Reasons for turnover include, perceived lack of autonomy, low school performance, changing nature of the position, and lack of positive relationships with supervisors, peers, subordinates, and the community (Snodgrass Rangel, 2018). While literature primarily focuses on turnover, churn is broader and refers not only to the—voluntary and involuntary—departure of actors but also to their arrival within a given network (Daly et al., 2015).
Churn can take a toll on organizations, such as the loss of knowledge and organizational memory related to the exit of individuals and the costs for training for new hires (Daly et al., 2015). Churn among principals and superintendents might be even more detrimental, as they are central in creating an environment for and leading school improvement, as well as building relationships instrumental to the success of their institutions (Björk et al., 2014; Louis et al., 2010). For example, since school change and improvement can take from two to 10 years, depending on the complexity of the change (Fullan, 2016), leadership turnover can make it hard for districts and schools to implement new programs and policies and to commit to improvement (Grissom & Andersen, 2012; Snodgrass Rangel, 2018). Further, in a literature review on principal turnover, Snodgrass Rangel (2018) showed that principal turnover was related to lower student achievement and graduation rates. Also, principal turnover was associated with higher teacher turnover and school culture challenges, which, in turn, are both linked to lower student achievement (Snodgrass Rangel, 2018). While there may be some advantages of churn if less-performing individuals leave, high levels and constant churn is disruptive to the overall organizational processes and success, including efforts at organizational learning, which we will discuss next.
Organizational Learning and Culture
Organizational learning is a process in which actors of an organization actively use data, such as research evidence, to guide behavior that promotes the organization’s ongoing adaptation and improvement (Popper & Lipshitz, 2000). It is often “stimulated by multiple sources of knowledge, where knowledge is a constantly changing collective understanding” (Louis, 2006, p. 481), involves the detection and correction of error (Argyris & Schön, 1978), and is understood as the procedure of building and organizing knowledge to develop organizational efficiency and improve actions (Dodgson, 1993; Fiol & Lyles, 1985). This process involves the “encoding [of] inferences from history into routines that guide behavior” (p. 320), where routines include, among other things, rules, procedures, strategies, conventions, beliefs, cultures, and paradigms (Levitt & March, 1988). Within an organization, routines are transmitted through education, imitation, and socialization, and are recorded in, inter alia, the social structures and relationships of an organization (Argote, 2011; Levitt & March, 1988). Teachers’ active seeking of information, shared decision-making, the availability of resources and time to develop professionally, and the consistent information distribution promote organizational learning within schools (Fauske & Raybould, 2006; Leithwood et al., 1998; Silins et al., 2002), as does a positive organizational culture (Argyris & Schön, 1978; Fiol & Lyles, 1985; Popper & Lipshitz, 2000).
A positive organizational culture is often described as one that is collaborative and collegial, informed by open and supportive communication among staff, respect of colleagues’ ideas, and a willingness to take risks was associated with increased organizational learning (Leithwood et al., 1998; Silins et al., 2002). In addition, psychological safety (Argote, 2011), a willingness to share values and beliefs (Popper & Lipshitz, 2000), and a focus on the development of members’ full potential (Dodgson, 1993) foster organizational learning. Furthermore, social structures that support the movement of information and knowledge within and between organizational units may also shape organizational learning and ultimately change (Nahapiet & Ghoshal, 1998). Conversely, organizational learning may be inhibited by actors’ unwillingness to discuss issues that trigger conflicts, open secrets, and mutual protectiveness—all of which stifle the formation of high trust relationships necessary for organizational learning (Argyris & Schön, 1978). As a result, personnel turnover and turbulences in the organizational environment may negatively affect organizational learning (Argyris & Schön, 1978; Carley, 1992; Fiol & Lyles, 1985; March, 1991). To better understand the social part of organizational learning, we examined the extent to which restructuring and leadership churn are related to a school district’s organizational learning capacity.
Organizational Learning and Research Evidence
Organizational learning involves accessing data to improve the organization (Popper & Lipshitz, 2000). Such data includes research evidence. Asen et al. (2013) defined research evidence as “empirical findings derived from systematic analysis of information, guided by purposeful research questions and method” (p. 40). However, education stakeholders often consult other forms of evidence, such as experience, testimony, law/policy, student performance data, and school evaluations (Asen et al., 2013; Finnigan et al., 2013), and research evidence plays a limited role in decisions and actions of central office staff (Farley-Ripple, 2012) and principals (Fraser et al., 2018). Prior research suggests that central office staff favor conferences, leadership books, and publications from professional organizations over research evidence (Farley-Ripple, 2012), and educators would turn to their colleagues first to inform their practices and decisions (Fraser et al., 2018; Lysenko et al., 2016). Indeed, district and school leaders are vital in disseminating research (Daly, Finnigan, Jordan, et al., 2014; Daly, Finnigan, Moolenaar, et al., 2014), suggesting that educators access ideas from research evidence through social interactions. As such, social structures to move research evidence within the organization are crucial for learning, change and improvement (Nahapiet & Ghoshal, 1998). Hence, we describe how the social networks around research evidence change concurrently with leadership churn.
Method
This longitudinal exploratory mixed-methods (Creswell & Plano Clark, 2018) case study (Yin, 2018) employs social network analysis to examine the association between a district restructuring and changes in social structure and organizational learning. Case study methods are appropriate for research focusing on an in-depth understanding of dynamics present in contemporary real-world contexts (Eisenhardt, 1989; Yin, 2018). In this study, case study methodology is valuable since the goal is to understand experiences and dynamics in a real-world case shaped by historical, social, political, and personal contexts (Stake, 1995). For this research, we purposely selected a case district that had been underperforming, engaged in a district-level change effort, served a diverse student population, and was in a major urban setting that reflected qualities of many urban districts across the U.S. to support theory building.
Case District
The case district, Bern City Unified School District (BCUSD), 1 is located in the Western United States, serving over 130,000 students from 15 ethnic groups and over 60 languages in preschool through grade 12 (preK-12). At the time of data collection, the district included more than 100 elementary and K-8 schools, over 40 middle and high schools, and many “atypical” and charter schools. The ethnic breakdown of BCUSD included approximately 45.7% Hispanic, 23.9% White, 11.8% African American, 5.1% Indo-Chinese, 3.3% Asian, Native American, Pacific Islander, and Multi-Racial/Ethnic students. BCUSD covered over 200 square miles and employed more than 14,000 individuals, of which close to 6,500 were teachers who were spread across 223 educational facilities. District positions included a wide range of administrator positions, including the district superintendents (comprised of the superintendent and deputy superintendents), area superintendents, central office leaders (e.g., directors and managers of the departments curriculum, data communication, human resources, business, student services), and principals 2 . The sheer size of the system influenced the formal way that the district was organized. The district was comprised of nine “areas,” with each area consisting of up to three high school clusters (an elementary and middle school that feed into the high school). These areas were loosely organized by geographic location and were each served by an area superintendent responsible for several schools. These areas were roughly the size of many mid-size districts in the U.S. and often thought of as “mini” districts.
During the study, approximately 20% of the BCUSD leadership team left the district. This level of churn was slightly more than in previous years. As aforementioned, high turnover rates among school and district leaders are common in the U.S. (Goldring & Taie, 2018; Grissom & Andersen, 2012). Further, the district was reorganized by reducing the number of areas from nine to seven. Through this restructuring process, school leaders were assigned to new areas, often with new supervisors. This process resulted in a new set of areas that were only tangentially related to the previous areas. Reasons for this restructuring were manifold. In the study’s first year, the district’s governing board implemented a process to create a quality school in every neighborhood within five years as an attempt to create greater coherence across the entire system to enhance outcomes and augment collaboration opportunities. In year two, due to underperformance, the state’s State Board of Education required the district to take action due to failing to meet Adequate Yearly Performance. Among other things, the district needed to improve communication, collaboration, and a more direct focus on data-driven decision-making grounded in high-quality evidence. In sum, the restructuring aimed to improve local neighborhood schools, create more alignment across the district through restructured areas, and improve district-to-site communication and opportunities for collaboration within and across areas, all to improve student outcomes and meet state mandates.
Participants and Data Collection
The study participants included the district and area superintendents, central office staff, and principals at the school sites. Together, they constituted the district leadership team. Across three years, we collected data through an online survey regarding organizational climate, organizational learning, the social interactions around research use, and suggestions about strengthening the leadership network. In the study’s first year, the average leader had 23 years of experience as an educator; had spent 18 years in the BCUSD; had 11 years of experience in administration, and had been at their current site for five years. Of the 257 leaders, 13 (5.1%) were district or area superintendents, 44 (17.1%) were central office administrators, and 185 (71.9%) were principals (see Figure 3). These positions represent 94.2% of the district leadership team and reflect the expected proportions between district office and site administration at the time. Throughout the study, approximately 20% of the BCUSD leadership team (i.e., district and site administrators) left the district. In Year 3, the 248 leaders’ work positions included nine (3.6%) district and area superintendents, 57 (23.0%) central office administrators, and 173 (69.8%) principals. In other words, 96.4% of the leadership team’s work positions were known. The response rates for the social network question were 91.4% and 76.2% in Years 1 and 3, respectively. A response rate of above 70% is generally required for social network analysis (Kossinets, 2006). The response rates for the organizational learning and organizational culture scales are displayed in the respective tables’ notes. Distribution of Work Positions in Years 1 and 3.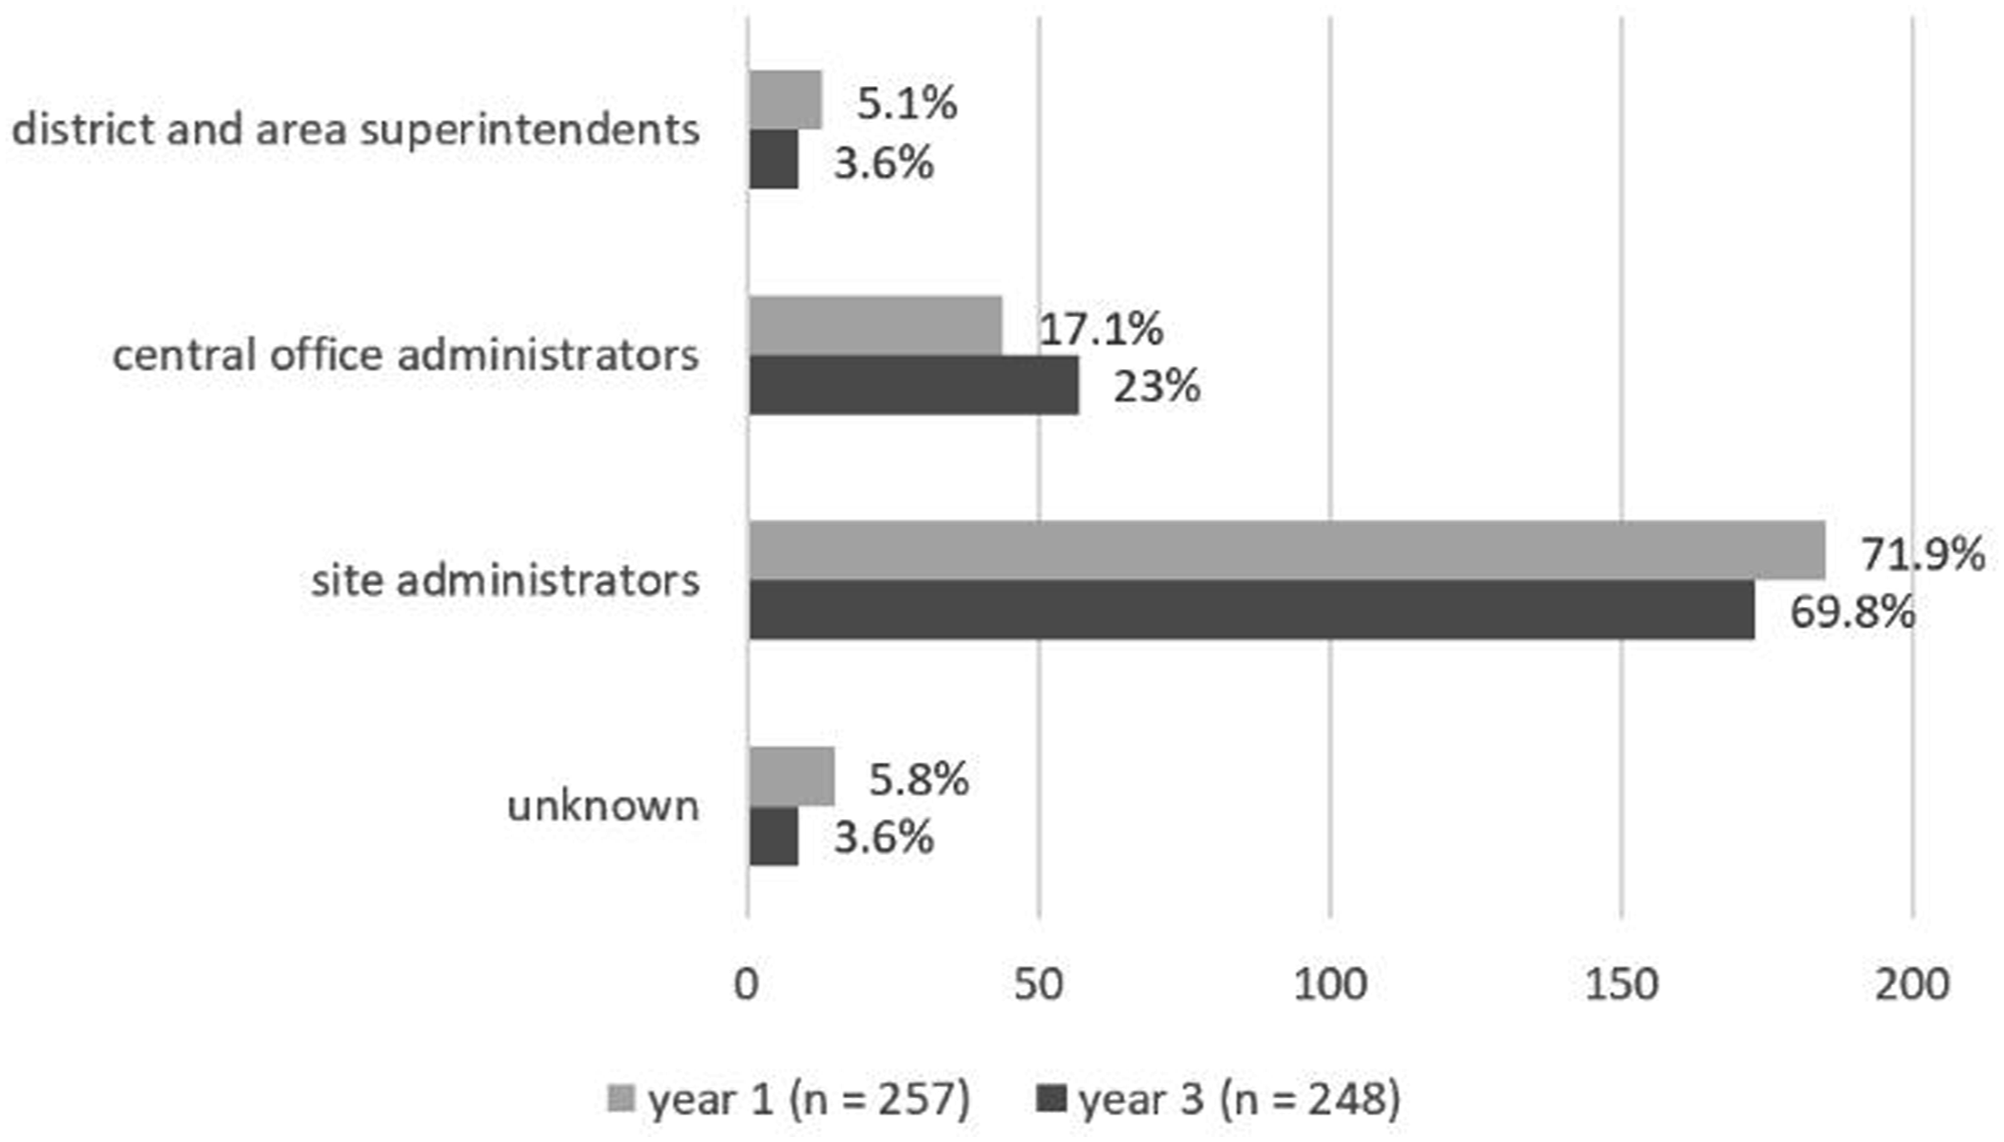
Of all respondents, 203 participants belonged to the leadership team in both Years 1 and 3. Of these 203 participants, 155 were principals and 38 were central office staff (including superintendents) in Year 1; 148 were principals and 54 were central office staff in Year 3 (some stayers’ positions were unknown). The Year 3 numbers correspond to 85.5% of all principals and 81.8% of all central office staff, respectively. It is noteworthy that some of the staying central office staff in Year 3 were principals in Year 1. In subsequent paragraphs, we call these members “stayers,” “staying participants,” or “staying leaders” to refer to school and district leaders who stayed in the district throughout the study.
We used an online survey to collect data, which included organizational learning and culture scales, social network questions, demographics, and open-ended prompts. The instrument was grounded in the literature on organizational learning, district improvement processes and practices and network studies. Also, the validity of the instruments has been established. We attended to the context in which the instrument was used, and it was piloted with administrators before the survey administration (American Educational Research Association, 2014; Daly, Finnigan, Moolenaar, et al., 2014). Survey data was complemented with administrative data on the participants’ positions.
Quantitative Data
Organizational Learning and Culture Measures
To measure the participants’ perception of the district’s capacity for organizational learning, we modified items used in other contexts, such as the “learning organization survey” (Garvin et al., 2008), which “enjoys substantial face validity” (Singer et al., 2012, p. 435) and whose psychometric properties have been assessed (Edmondson et al., 2019; Singer et al., 2012). We used a 15-item scale with two subscales: organizational learning in the school sites (8 items) and organizational learning in the district (7 items). Both subscales were designed to assess the degree of participants’ belief that members of the leadership team are willing to learn and try out new ideas, are willing to take risks to make the district better, serve as resources to each other, encourage each other to grow, and continuously develop new approaches to support improvement. Both subscales’ reliability proved acceptable (Taber, 2018): the site subscale had a Cronbach’s alpha of .87, and the district subscale had a Cronbach’s alpha of .92.
To measure the participants’ perception of organizational culture, we used a modified scale from the “trust in colleagues” survey validated and published by Hoy and Tschannen-Moran (2007) (see also Daly & Finnigan, 2012). We used an eight-item scale with two subscales consisting of four items each: organizational culture within the school sites and organizational culture within the district. 3 Both subscales were designed to assess the degree of participants’ belief that members of the leadership team respect, trust, help, and support each other, as well as believe that others do their jobs well. Both subscales’ reliability proved acceptable (Taber, 2018): the site subscale had a Cronbach’s alpha of .58, and the district subscale had a Cronbach’s alpha of .75. The Likert-type response continuum ranges from 1 (strongly disagree) to 4 (strongly agree) for all scales.
Social Network Analysis and Measures
A social network is a set of actors (also called nodes) and the relationships (also called ties) among them (Wasserman & Faust, 1994). Unlike conventional methodological approaches, social network analysis privileges the relationships among actors over their personal attributes when studying social processes (Borgatti et al., 2018; Wasserman & Faust, 1994). An actor’s position in a social network, the network’s structure, and the quality of ties determine their access to resources and capability to influence others (Coleman, 1988; Gould, 1989; Granovetter, 1973; Lin, 2001).
In this study, we focus on the actors’ interactions around research evidence, which we argue are instrumental to organizational learning. Participants were asked, “Which site administrators/ district office administrators regularly bring new ideas from research that you use (by regular we mean at least twice a month and by research we mean empirical studies)?” This question resulted in binary network data, which means that participants were or were not identified as fitting this description. Respondents were provided with a roster including all leadership team members’ names. This process is called the saturation sampling technique (Carolan, 2014), and yields whole-network data (Borgatti et al., 2018). The saturated/whole-network approach provides a more complete picture of the underlying structure than the egocentric approach (Borgatti et al., 2018; Wasserman & Faust, 1994).
It is important to note that, despite being prompted to focus on empirical pieces, as we note in our network question, the participants decided whether they deemed an idea as being based on research evidence. Their understanding of research evidence might not follow the academic definition of “empirical findings derived from systematic analysis” (Asen et al., 2013, p. 40). Hence, it might be that the participants did not access ideas based on research but other forms of evidence through their social relationships, as we have showed in previous work (Finnigan et al., 2013).
Qualitative Data
Open-ended Prompt about Suggestions for Improvement
At the end of the survey, respondents were asked to answer the open question, “What suggestions do you have for strengthening the leadership network?” We analyzed only the stayers’ replies (n = 203). In Year 1, 126 staying participants, and in Year 3, 83 staying participants answered this question. The stayers’ response rate was 62% and 41% in Years 1 and 3, respectively.
Data Analysis
First, we ran graphic representations of the networks using the Netdraw software (Borgatti, 2002). This method provides visual images of the network (i.e., sociograms) and illuminates the underlying social structure. Next, we ran various network analyses using the UCINET software (Borgatti et al., 2002). These analyses included whole-network measures, such as density, connectedness, reciprocity, average degree, and degree centralization. The density of a network is the number of social ties between actors divided by the number of total possible connections (Borgatti et al., 2018), and can be thought of as how tightly knit a network is (Scott, 2017). A dense network moves resources more quickly than a network with sparse ties (Scott, 2017). The connectedness indicates the proportion of actors who are connected and located in the same component (Borgatti et al., 2018). A component is a subgraph in which all nodes are connected through paths (Scott, 2017). Reciprocity indicates the proportion of ties that are reciprocated (i.e., actor A nominates actor B as a source of ideas from research evidence and vice versa) (Borgatti et al., 2018). Reciprocity indicates a network’s stability and equality as reciprocated ties tend to be more stable and equal (Carolan, 2014). The average degree is the sum of all actors’ degrees divided by the network’s size (Borgatti et al., 2018). Additionally, we calculated the average normalized in- and out-degree for principals and central office staff each. These standardized measures indicate the mean percentage of actors’ actual ties of all possible ties and can be compared across networks of different sizes (Wasserman & Faust, 1994). Finally, the centralization measure indicates the extent to which a single actor dominates a network. A centrality score of 1 means that the network resembles a star (Borgatti et al., 2018). A network’s centralization affects the speed through which information is spread in a network (Carolan, 2014). Additionally, we used the statistical software Stata (StataCorp, 2019) to run t-tests to compare the normalized in- and out-degree means and the means of organizational learning and culture between (a) principals and central office staff, (b) Years 1 and 3, and (c) stayers and new people in Year 3.
The codebook for analyzing the open survey prompt was developed, on the one hand, based on the organizational learning theory (i.e., deductive coding), and, on the other hand, emerged progressively during the analysis process (i.e., inductive coding) (Miles et al., 2014). The first author added all responses to a spreadsheet and coded the participants’ responses based on their initially developed codebook. Next, the authors discussed the codebook and coding to resolve any questions arising during independent analysis and revise the codebook accordingly to ensure the codes’ relevance for the data and research questions. These discussions and peer reviews are meant to promote validity (Merriam & Tisdell, 2016). Codes included, among other things, social relationship facilitators, social relationship inhibitors, communication, support, and diffusion of knowledge/research evidence/practices. We employed an explanatory sequential mixed-methods research design (Creswell & Plano Clark, 2018). As such, the qualitative findings were used to explain and contextualize the quantitative results.
Findings
We divided the findings section into three parts: (a) description of the churning, (b) change in underlying social structures around research evidence (research question 1), and (c) description of change in organizational learning and culture (research question 2).
Churning: Turnover and Restructuring
As mentioned before, leadership turnover was substantial in BCUSD during the study with approximately 20% of the BCUSD leadership team leaving the district. Additionally, the district was reorganized, and the number of areas was reduced from nine to seven. Through this restructuring process, school leaders were assigned to new areas. Figure 1 shows how these new areas were only tangentially related to the previous areas.
Change in Underlying Social Structures
Our results suggest a change in the district’s leadership team’s underlying social structures. This change indicates a decrease in the district’s capacity to diffuse ideas from research between Years 1 and 3. There are several indications for this assertion.
Changes in Sociograms
To begin with, the sociograms for Years 1 and 3 show more isolates and a lower density in Year 3 than 1 (see Figure 4). Additionally, the sociograms indicate that different positions held different roles in disseminating research evidence, which changed over time. For example, compared to Year 1, fewer area superintendents were central in the whole-district network in Year 3, which was also related to their smaller number. Instead of area superintendents, central office staff, such as instructional leaders, and the district superintendents were central. In other words, they were sought out for ideas from research evidence more often and moved from previously more peripheral to more central positions, which were previously held by area superintendents. District and School Leaders’ Interactions around “Research Evidence” Years 1 (top) and 3.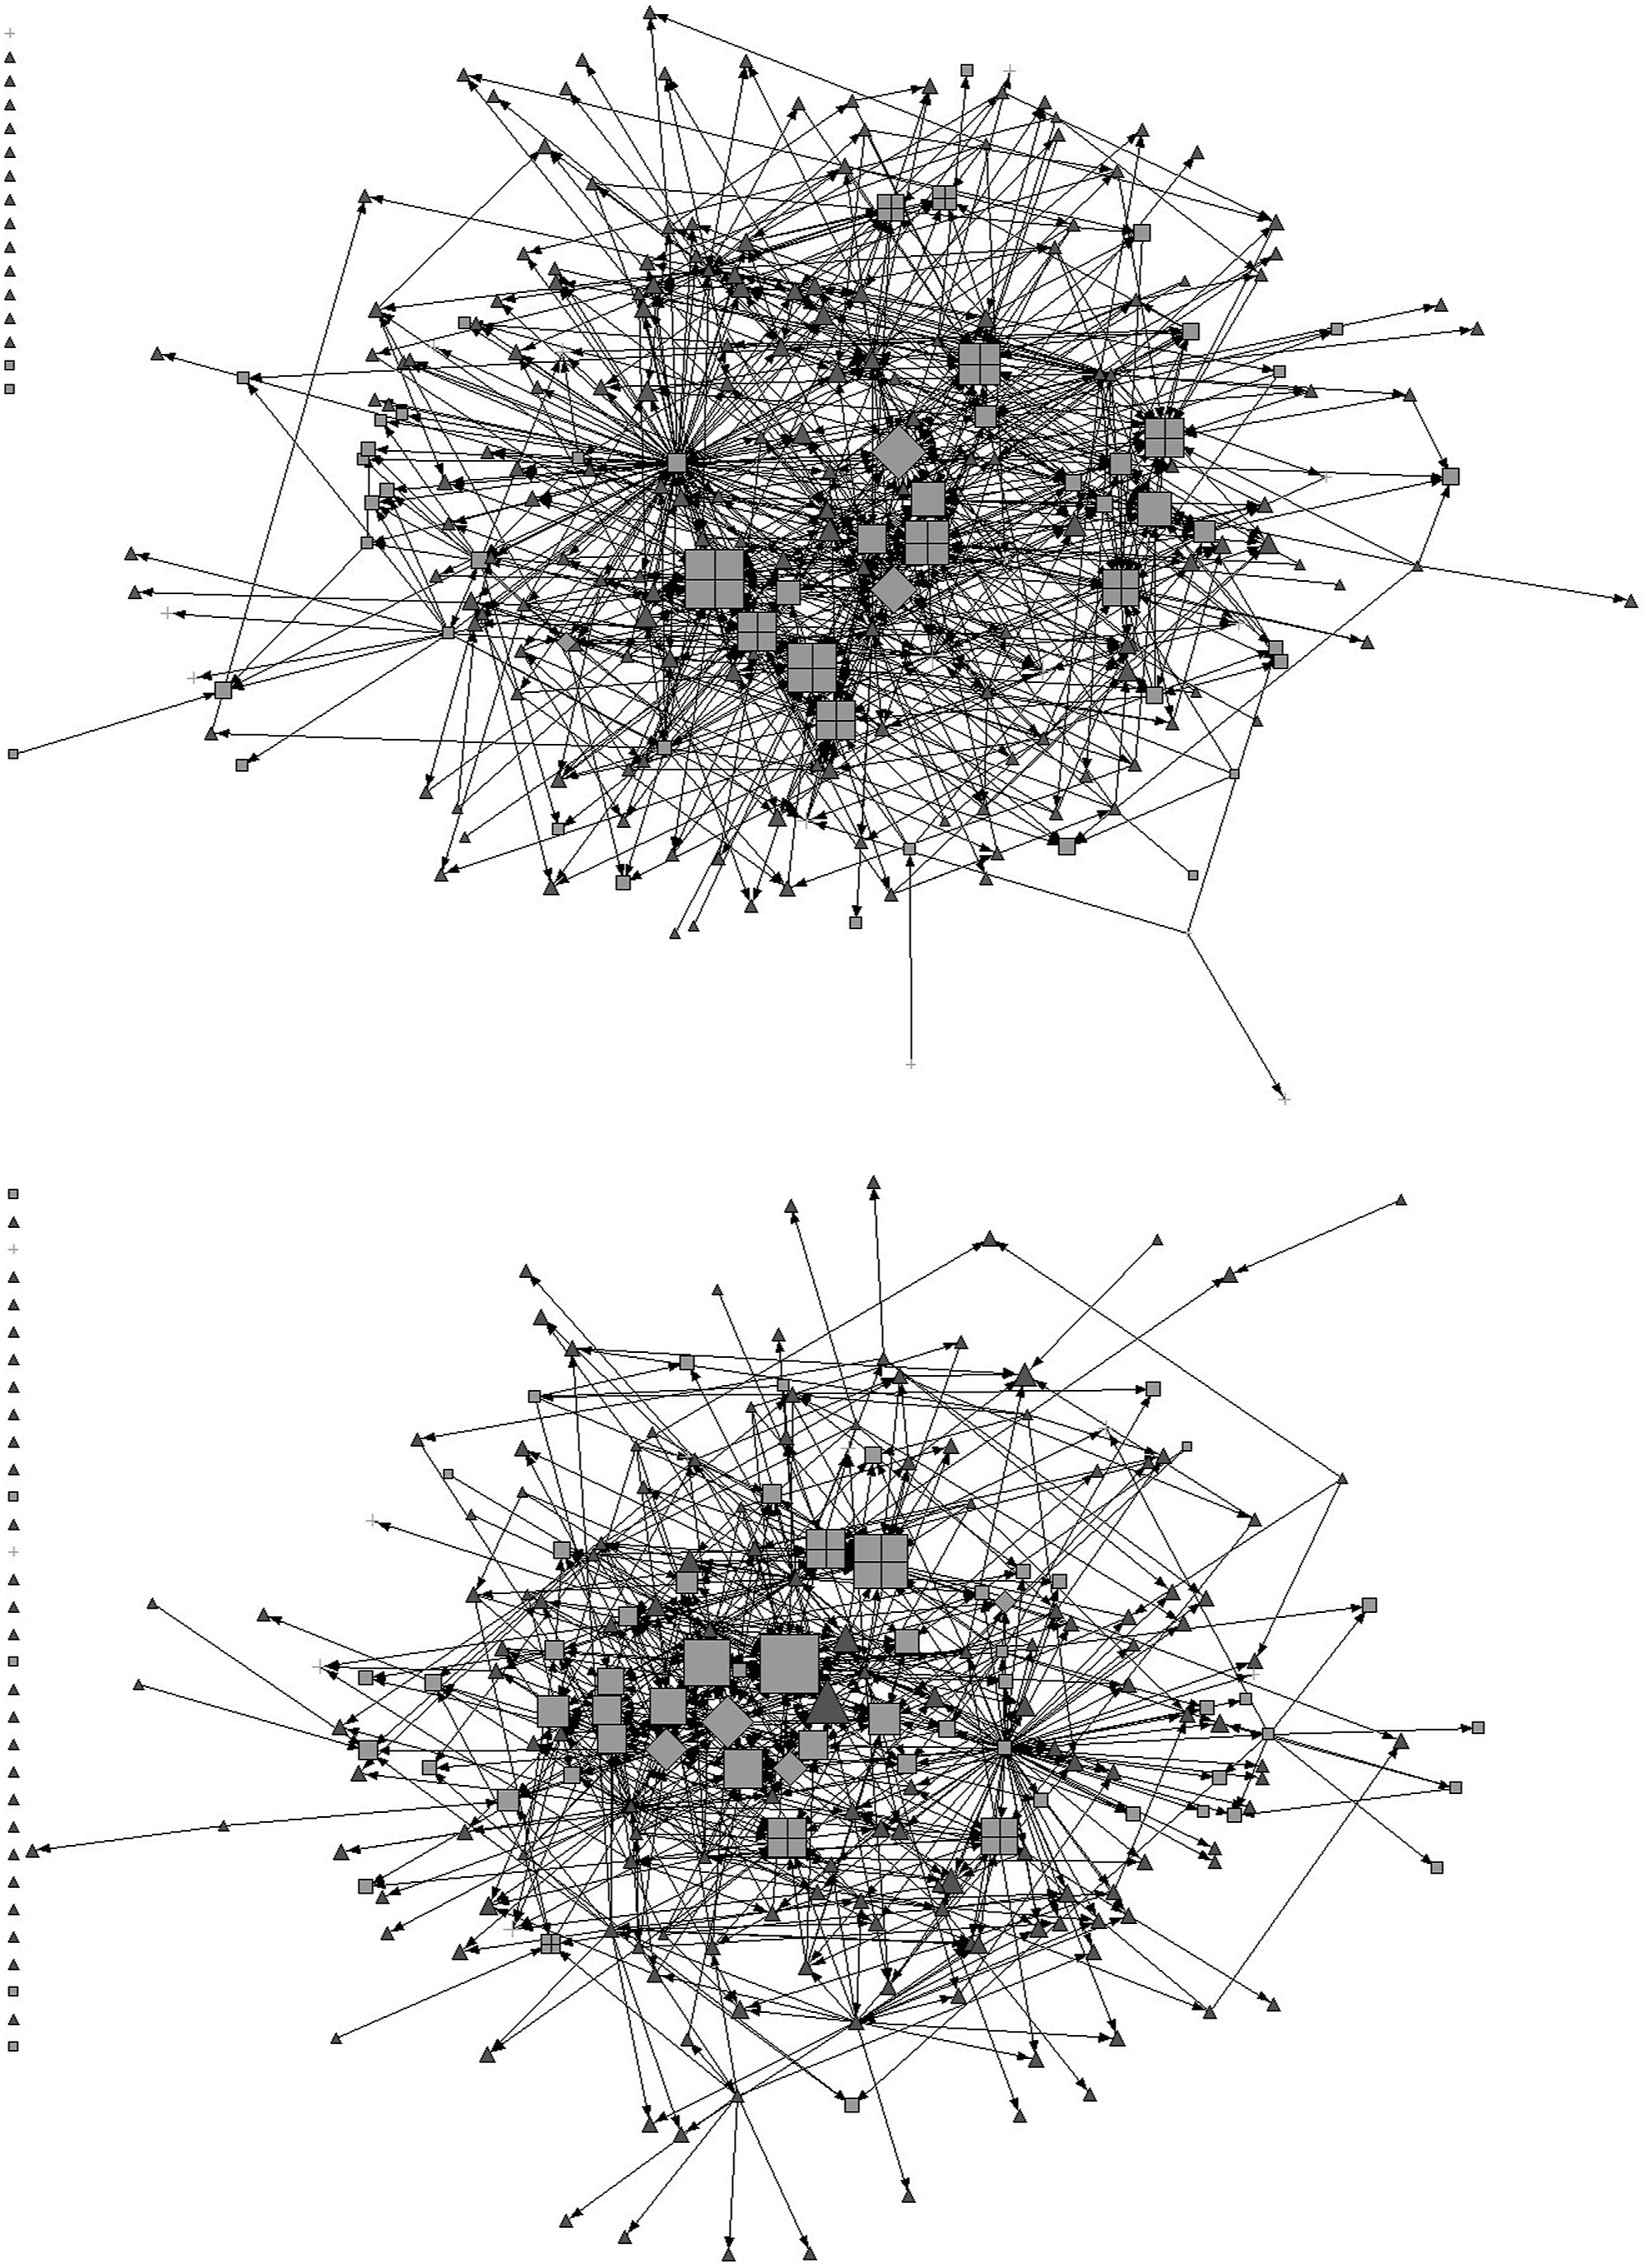
Network Measures for Whole District and Stayers Only
Whole Network Measures for the Research Ideas in Years 1 and 3.
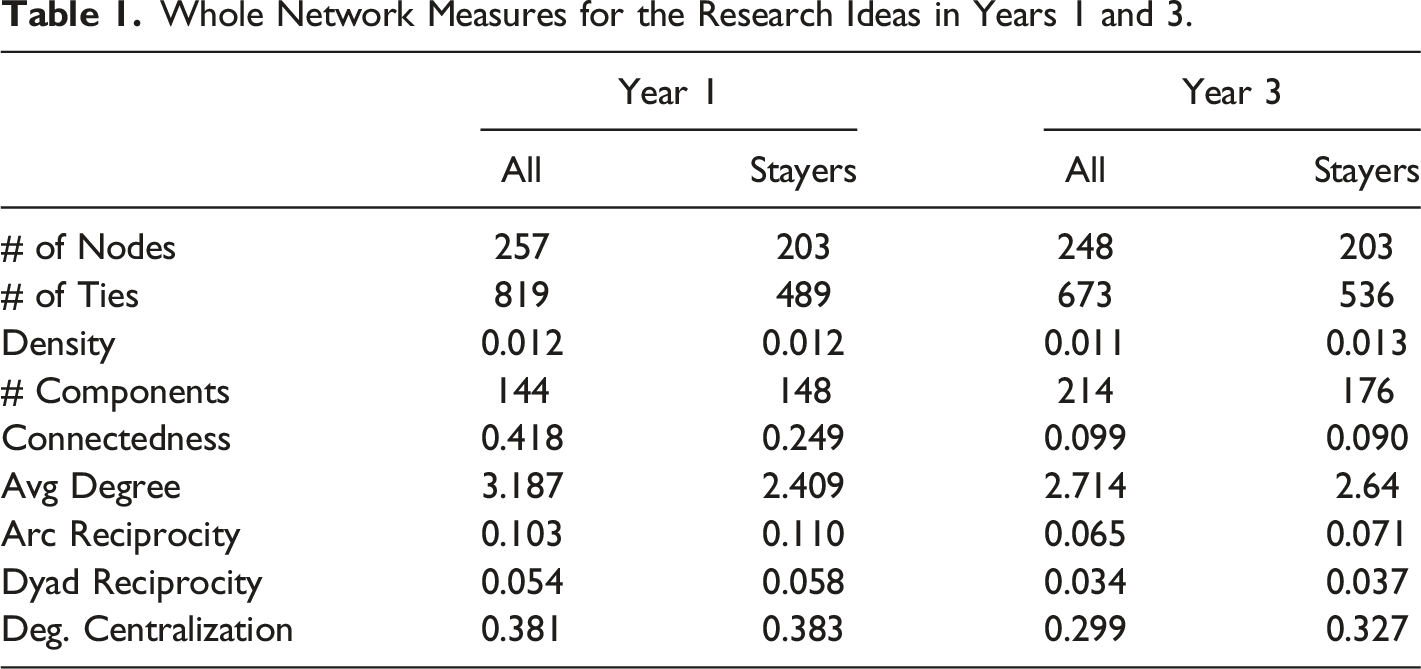
Overall, these whole-network measures among the district and school leaders suggest a decreased capacity to access and distribute ideas from research evidence across the district. Since organizational learning is a process of using data, such as research evidence, to promote the organizations’ improvement (Popper & Lipshitz, 2000), we argue the decreased capacity around research evidence impacts the district’s ability for organizational learning. The measures suggest that leaders did not have as frequent interactions around research evidence in Year 3 as in Year 1. Additionally, the leaders had, on average, fewer ties around research evidence, which indicates that district and school leaders’ ideas from research evidence can be diffused among fewer actors. The increase in the average number of ties among stayers might be an indicator for how social structures would have developed without the churn.
Changes in Research Evidence Relationships among Principals and Central Office Staff
Comparison of Mean Normalized in- and Out-Degree Between Principals and Central Office Staff. in Years 1 and 3.
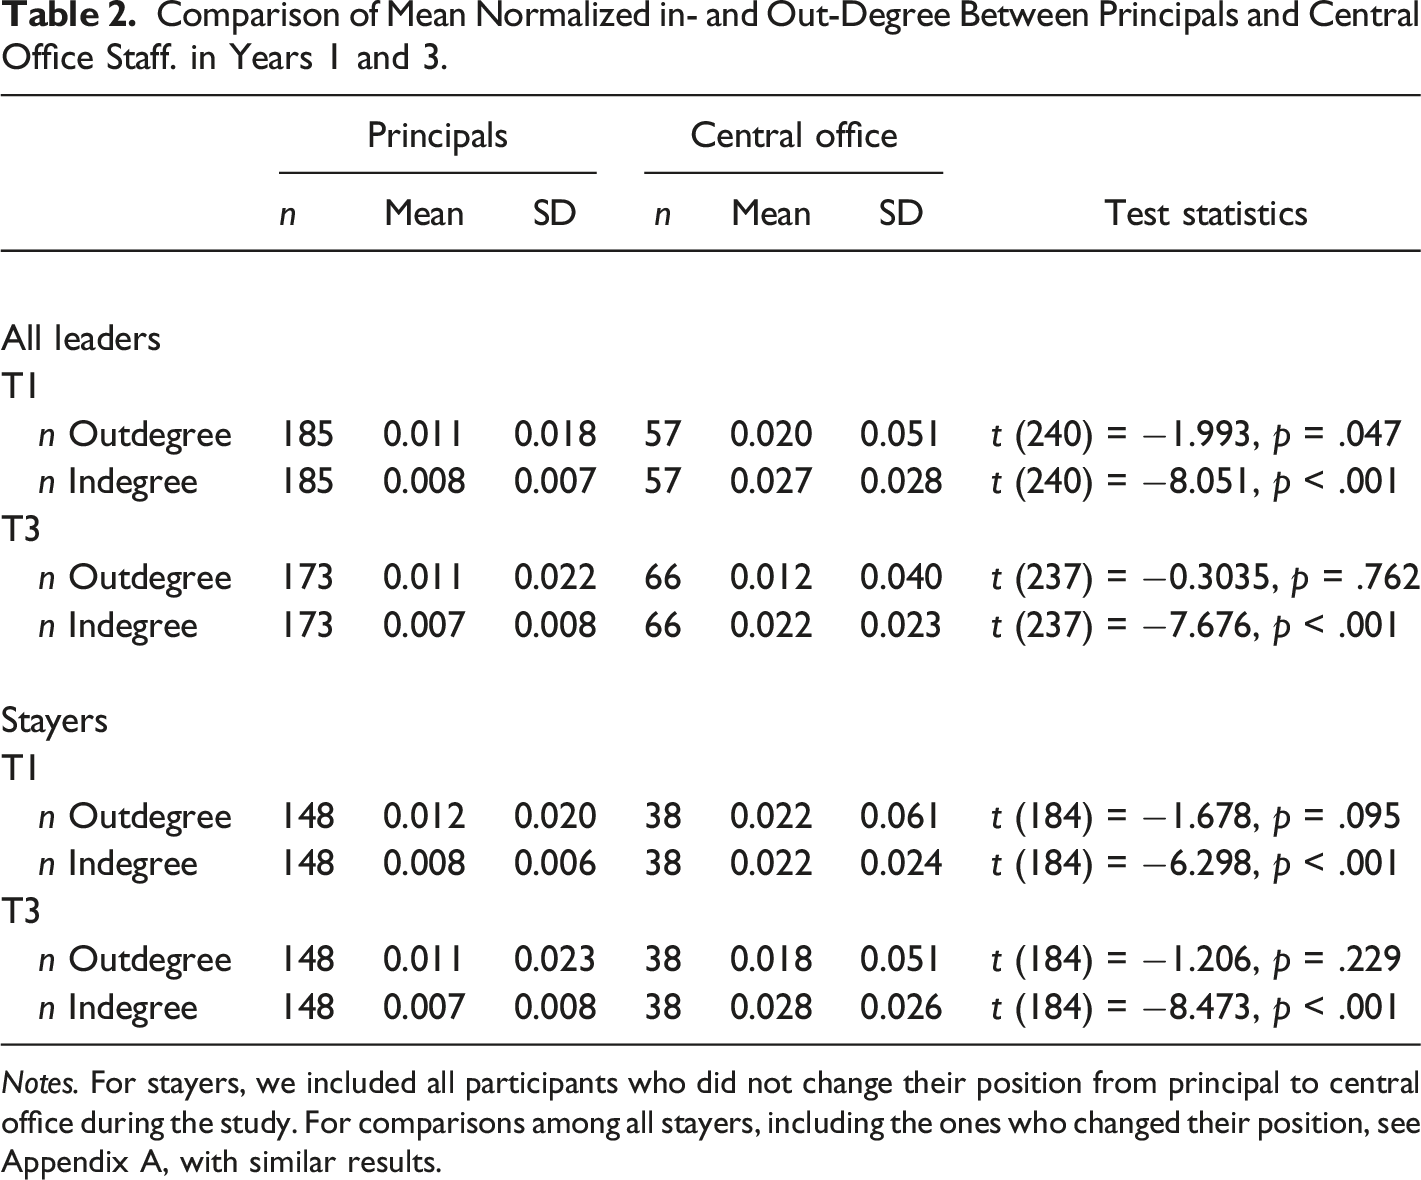
Notes. For stayers, we included all participants who did not change their position from principal to central office during the study. For comparisons among all stayers, including the ones who changed their position, see Appendix A, with similar results.
Comparison of Mean Normalized In- and Out-Degree in Years 1 and 3.
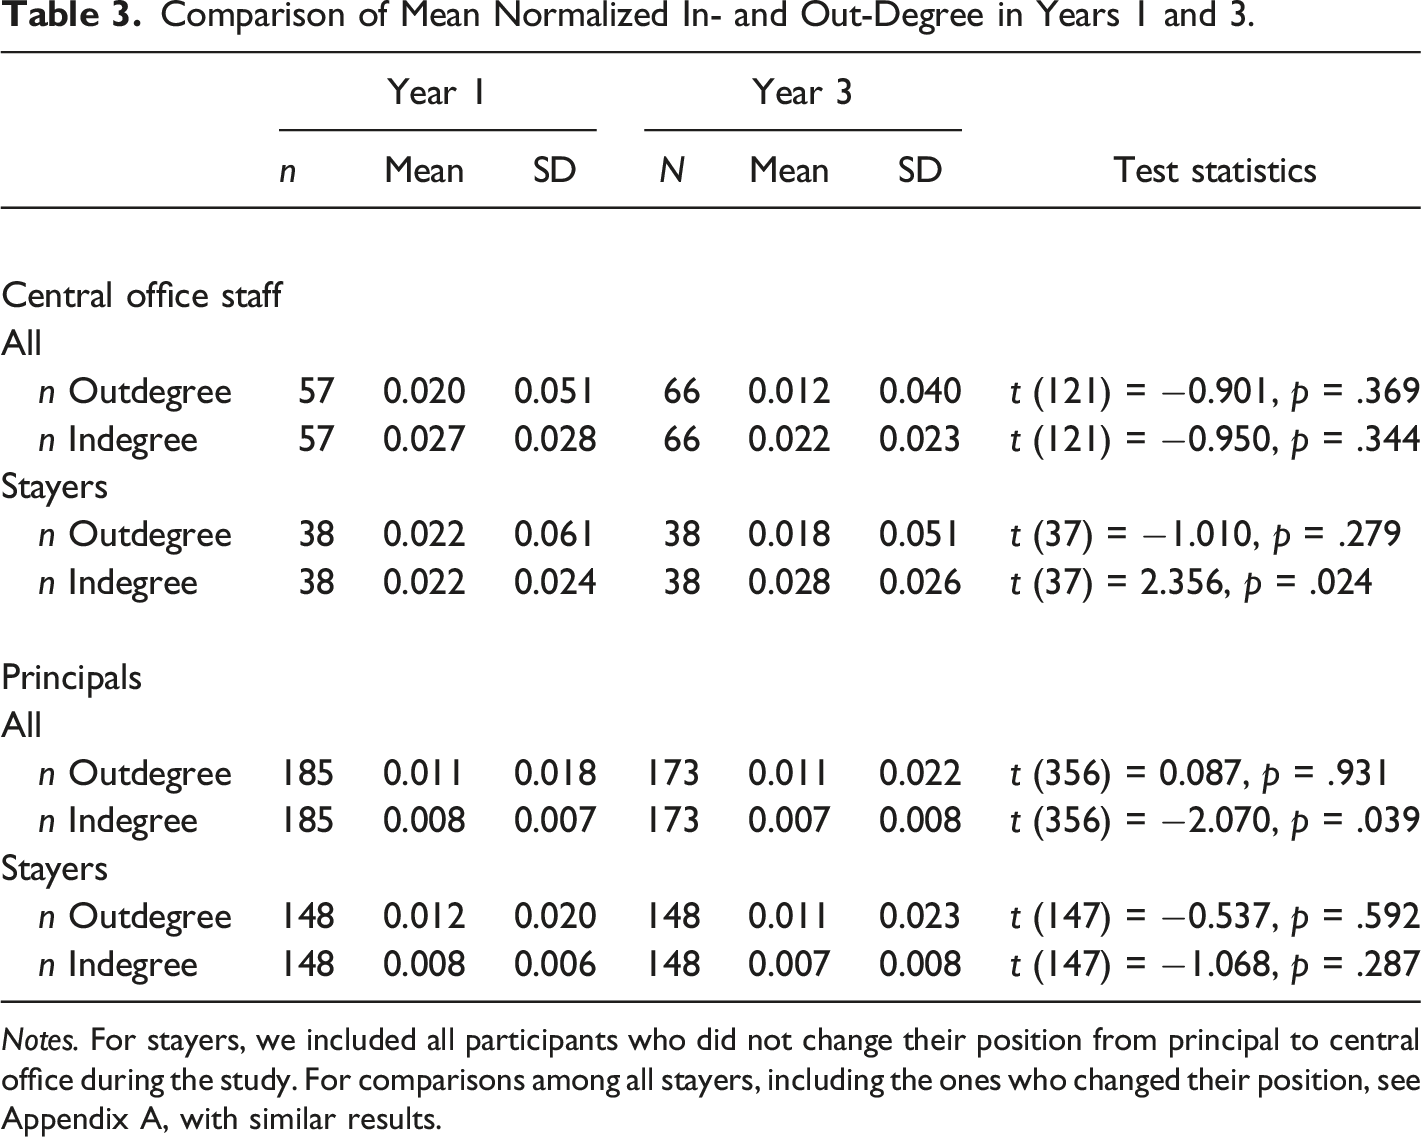
Notes. For stayers, we included all participants who did not change their position from principal to central office during the study. For comparisons among all stayers, including the ones who changed their position, see Appendix A, with similar results.
Next, we examined the differences in normalized out- and in-degree between Years 1 and 3 for principals (see second panel in Table 3). While there were no significant changes in in- and out-degree among the staying principals, the average normalized in-degree among all principals statistically significantly decreased (nIy1 = 0.008; nIy3 = 0.007, t (356) = −2.070, p = .039). The average normalized out-degree stayed the same among all principals. These results indicate that principals, who, on average, were not a source for ideas from research evidence for many leaders, were even less often sought out in Year 3 after the district restructuring. Unlike staying central office staff, staying principals did not increase their centrality in the research evidence social network.
Comparison of Mean Normalized In- and Out-Degree in Between Stayers and New People in Year 3.
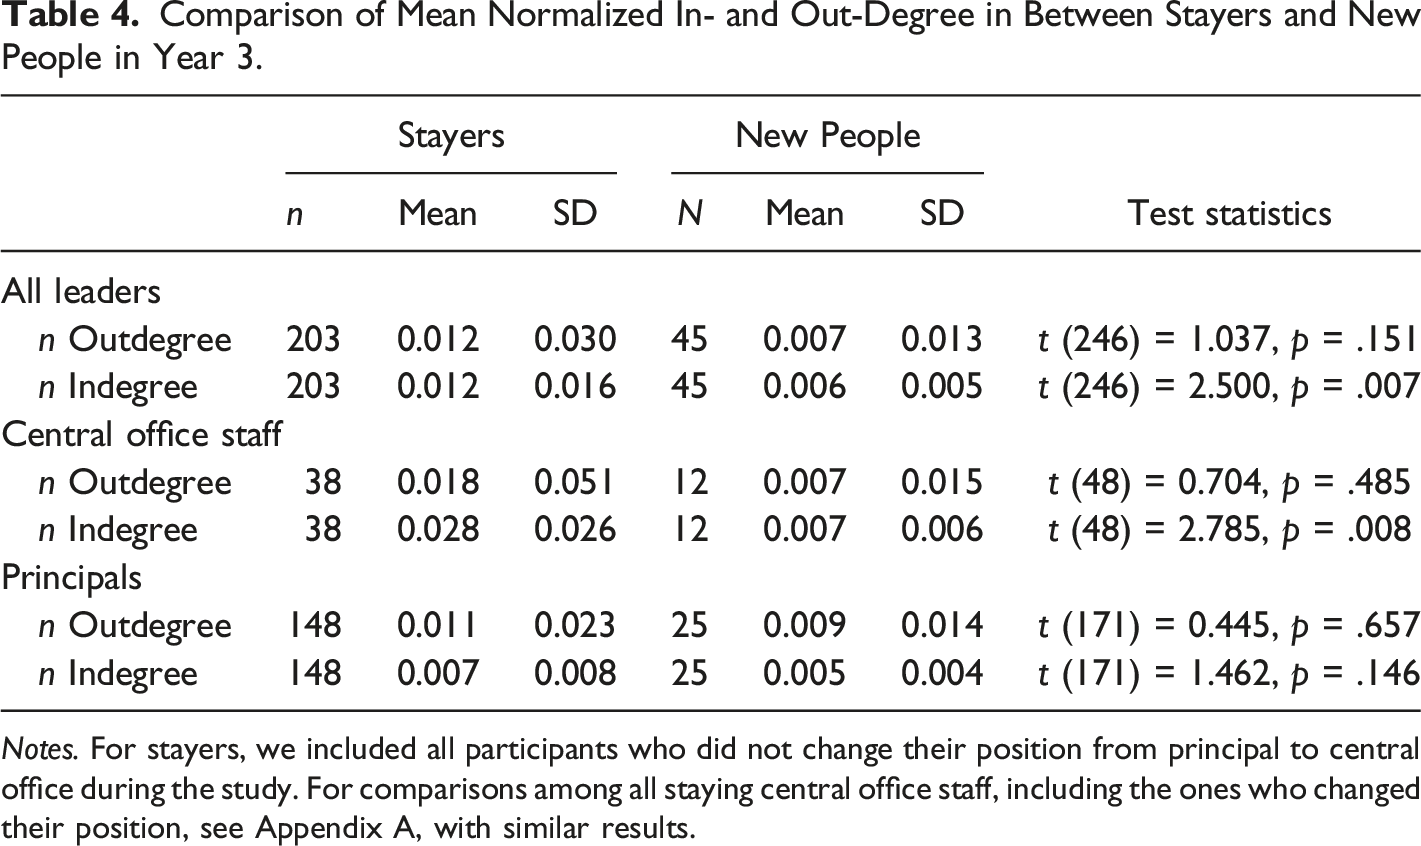
Notes. For stayers, we included all participants who did not change their position from principal to central office during the study. For comparisons among all staying central office staff, including the ones who changed their position, see Appendix A, with similar results.
Qualitative Findings of Open-Ended Prompts on Social Structure
Findings from the qualitative analyses indicate that the leadership fluctuation was a salient theme and was seen as partly responsible for the decline in social structures that foster access to and dissemination of research evidence in Year 1. As a principal in Year 1 put it: “The turnover year after year of upper management/leadership makes it very hard to establish trust and rapport so that a professional relationship can grow.” And another principal mentioned: “I have had six new bosses in 6 years.” In Year 3, participants rarely mentioned and/or critiqued leadership churn.
Another central theme in Year 1 was the structures created through the area superintendent model. This organization structure was criticized repeatedly in Year 1 as having “created silos of information,” impeded unity across the district, and complicated access to other central office specialists since the area superintendents served as intermediaries. In brief, the current organizational structures were critiqued as inhibiting the building and maintaining of social relationships across areas and seem to run counter with the intention of the restructuring effort. Conversely, the area superintendent organizational model was rarely critiqued in Year 3.
While churn and the area superintendent model were critiqued primarily in Year 1, the theme of the need to strengthen existing and facilitate building social relationships particularly between the central office and site administrators and within the principal group was prominent among the participants across both years. Towards this end, many leaders suggested providing more time to interact and collaborate to build trusting relationships between and among site and central office leaders. A principal in Year 1 said they needed “time and opportunity to develop relationships.” And another principal demanded, “Give principals time to share research, supportive data, and practices that work to improve student achievement. In the past 4 years we have become increasingly isolated.” The requests were similar in Year 3. For example, a principal voiced they needed more time “for principal networking/ planning/ dialogue/ working collaboratively within the workday.”
Combined with the social network findings above, these qualitative data suggest that the areas were sites of communication and information sharing, including ideas from research evidence—despite the widespread critique of the area superintendent model in Year 1. Through the prolonged churn in leadership and reorganization of areas (see Figure 1), relationships around research evidence were broken. A lack of time seems to have inhibited strengthening existing and building new relationships, including around research evidence and support coherent communication.
Change in Perception of Organizational Learning and Culture among Stayers
In addition to the social structures around research evidence, we examined whether the perception of organizational learning and culture changed among the stayers during the study period. Our results suggest a relationship between leadership fluctuation and district restructuring and the perception of organizational learning and culture in school sites, but not in the district. In the following sections, we discuss the analyses that led us to this conclusion.
Change in Perception of Organizational Learning and Culture among Staying Leaders
Comparison Organizational Culture and Learning among stayers in Years 1 and 3.
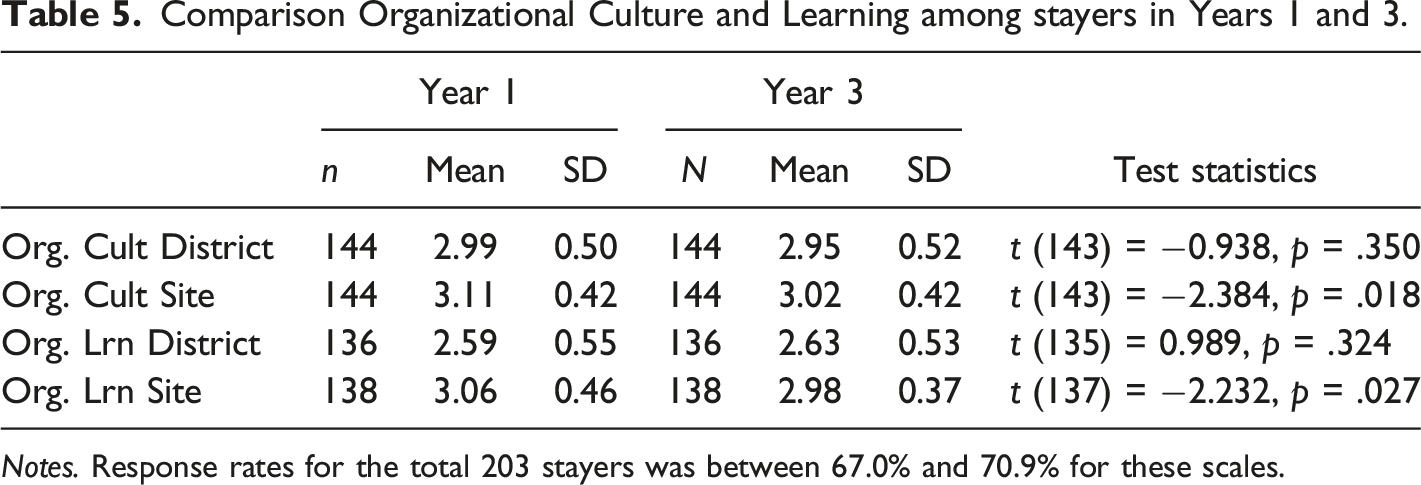
Notes. Response rates for the total 203 stayers was between 67.0% and 70.9% for these scales.
Change in Perception of Organizational Learning and Culture among Staying Central Office Staff
Stayers’ perceived Organizational Culture and Learning in Years 1 and 3.
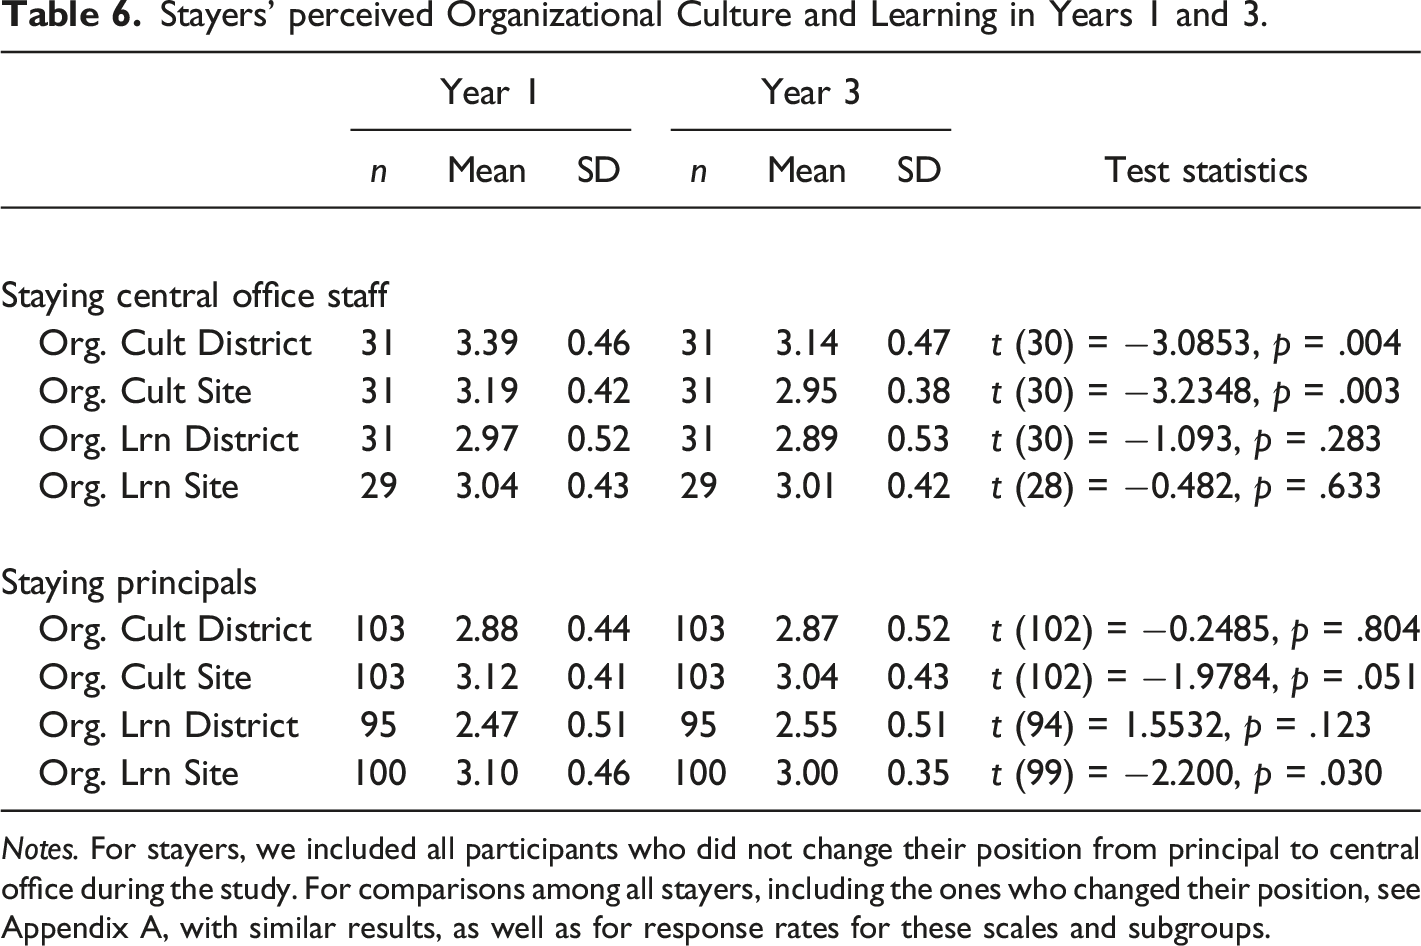
Notes. For stayers, we included all participants who did not change their position from principal to central office during the study. For comparisons among all stayers, including the ones who changed their position, see Appendix A, with similar results, as well as for response rates for these scales and subgroups.
Change in Perception of Organizational Learning and Culture among Staying School Leaders
The results for principals were different than for the central office staff (see second panel in Table 6). The perception of organizational learning capacity within the sites decreased statistically significantly between Years 1 and 3 (My1 = 3.10; My3 = 3.00, t (99) = −2.200, p = .030). Additionally, there was a tendency of declined perception of the organizational culture within the sites and improved perception of the district’s organizational learning capacity.
Qualitative Findings of Open-Ended Prompts on Organizational Learning and Culture
Integral to organizational learning is the culture of an organization (Argyris & Schön, 1978; Fiol & Lyles, 1985; Popper & Lipshitz, 2000), including the encouragement to learn (Dodgson, 1993), shared values (Popper & Lipshitz, 2000), and psychological safety (Argote, 2011). However, qualitative data suggest that the organizational culture was not beneficial for organizational learning in BCUSD.
In both years, a salient theme among the leaders was the desire to learn, participate in high-quality and relevant professional development, and share ideas on what works and how they could implement initiatives. For example, a central office member mentioned in Year 3: “Central office leaders rarely are able to meet with principals to communicate and plan program activities to successfully implement the changes the district is expecting.” This lack of meeting and communicating may have negatively impacted the attempts at coherence the district was pushing for during the restructuring effort.
Additionally, there was a perception of lack of support, such as manpower in administrative tasks, which was more often criticized by principals than central office staff. A site administrator in Year 1, for example, mentioned: “The current central organization is not sufficient to support the sites. A great deal of work is falling to site administrators, whose primary responsibility should be the instructional program.” Similarly, another principal in Year 3 wrote: “Strengthen PD, support and resources for principals to help us provide direction and leadership.” Also, it was perceived that not all district leaders received “the same level of support.” For instance, the critique was voiced that not all administrators were affected the same by budget cuts. A principal in Year 1 suggested that leaders should “treat people professionally and refrain from favoritism practices that create inequities between schools.”
Furthermore, the leaders perceived the district as lacking a shared focus, goal or vision, and consistency across areas—a theme that was salient in both years too. As a principal in Year 3 put it: “It is important that the vision and goals are clearly articulated so that all members of the leadership network are working toward common ends.” Similarly, a principal in Year 1 mentioned: “I believe our practices were much stronger when we have a district focus, or at least a common area of focus.” Leaders even perceived the district as divided, particularly into the central office versus the sites, as shown by a principal’s quote in Year 1: “There persists an us versus them environment between sites and central office.” Another site administrator in Year 3 voiced their hope that the district would finally become “a UNIFIED district.” And another principal in Year 1 explained how this climate impacted their work: “it [the “us versus them” environment] does not help us at our school sites as we try and develop trust with our staff and community.” Finally, the district leadership team was perceived as partisan and not open to critique. A principal in Year 1 described there were “real concerns about repercussions for speaking out.” And a district leader wrote, “Decisions and supports need to be based on needs and relevance not based on fear, and favoritism.” These two participants’ responses were exemplary for other statements and indicated a lack of psychological safety and a reduction in trust. Combined with the survey data, the qualitative data indicate a by leaders perceived low capacity for organizational learning, which even decreased over the course of this study.
Discussion
In our case study, central office staff were vital in distributing ideas from research evidence across the district, which is consistent with previous research. Still, the central office staff’s overall capacity to disseminate ideas from research evidence tended to decrease from Year 1 to 3. Conversely, the staying central office staff could, on average, significantly increase their normalized in-degree, and had a significantly higher normalized in-degree than new central office staff. These findings suggest that the decline in social structures essential for organizational learning resulted from leadership churn, which is supported by previous research (Finnigan et al., 2016; Nahapiet & Ghoshal, 1998). Further support for this claim was provided by respondents’ explanations in the open survey question. For example, some critiqued the district restructuring and leadership fluctuation for the lack of social capacity to disseminate research evidence. However, staying principals did not significantly differ from their new peers in being sought out for ideas from research evidence. An explanation for this non-significant finding could be the assignment of principals to new areas, and, thus, new groups that were only tangentially related to previous areas. Furthermore, our findings suggest central leaders in the network left the district, while more peripheral leaders remained and became more central, which also aligns with previous research (Finnigan et al., 2016). These findings are relevant as changes in an organization’s social structures interrupt the transmission of organizational routines, which is a central process in organizational learning (Argote, 2011; Levitt & March, 1988).
In addition, our results suggest that the leaders’ perception of organizational learning and culture within school sites statistically significantly decreased over the course of the study. Also, the turnover among leaders was frequently mentioned as inhibiting factor to building trust and rapport in the open questions. These findings are consistent with previous research that found personnel turnover affects organizational learning (Argyris & Schön, 1978; Carley, 1992; Fiol & Lyles, 1985; March, 1991). However, the change was not significant for organizational culture and organizational learning within the district. This finding might be an indicator for a relationship between churn/restructuring and perception of organizational culture and learning at school sites, but not at the district level. A decrease in school sites’ organizational learning might have adverse effects on students since organizational learning at school sites has been shown to mediate principals’ effects on teachers’ work and student outcomes (Silins et al., 2002). Additionally, positive organizational culture has been found to be positively associated with increased organizational learning (Argote, 2011; Fauske & Raybould, 2006; Leithwood et al., 1998; Silins et al., 2002). Consequently, our finding indicates a double disadvantage of the restructuring and churn for the district. On the one hand, students may be negatively affected by the decreased organizational learning in school sites. On the other hand, the diminished organizational culture does not help increase the sites’ capacity for organizational learning. These findings, combined with the social network analysis, further indicate a risk for increased turnover since lower school performance and perceived lack of positive relationships with supervisors and peers have been shown to be related to higher turnover rates (Snodgrass Rangel, 2018).
Finally, we observed differences in the perception of organizational culture and learning between principals and central office staff. For example, our findings indicate more often a significant decrease in these measures among central office staff than principals. Additionally, the qualitative analysis of the open-ended survey questions indicated that principals more frequently critiqued the district’s values around decision-making and their lack of support, which could explain the differences in the perceptions of organizational culture and organizational learning. These results indicate that principals and central office staff have different perspectives on the districts’ capacity for organizational learning and overall organizational culture, which, we argue, suggests that organizational learning did not happen across all groups in this district. Since organizational learning is a collective process (Argyris & Schön, 1978; Levitt & March, 1988), and shared values and beliefs foster organizational learning (Popper & Lipshitz, 2000), the group differences in perception of organizational culture and learning suggest it would be challenging to implement new policies and processes to improve schools and education for all students.
There are some limitations of the study. Since it is a case study, our findings cannot be generalized (Stake, 1995; Yin, 2018). Instead, our findings yield a “refinement of understanding” (Stake, 1995, p. 7). Also, this study focused on ideas from research evidence as understood by the participants. The participants may have accessed ideas based on resources other than research evidence. Further, our methods do not determine causality or even directionality of effects. Still, our quantitative findings provide evidence for the relationship between restructuring and fluctuation and changes in social structures, organizational culture, and organizational learning. These findings are supported by the qualitative analysis of the open-ended prompts. Finally, the qualitative data response rate was relatively low, with 62% and 41% in Years 1 and 3, respectively. Thus, our qualitative analyses might be biased due to non-response bias.
Conclusion
Efforts to improve educational systems and a call for increased research evidence use for better student outcomes are widespread. In directing these improvement efforts, district and school leaders play a crucial role (Finnigan & Daly, 2014). As our data show, restructuring and leadership churn might inhibit such efforts. This study has examined longitudinal survey and social network data to better understand the relationship between restructuring and churn in a district’s leadership team and organizational learning, culture, and underlying social structures around research evidence. We found that leaders’ perception of organizational learning and culture within school sites statistically significantly decreased throughout the study. However, the change was not significant for organizational culture and organizational learning within the district. Additionally, there were differences in the perception of organizational culture and learning between school leaders and district leaders. Furthermore, our findings suggest that leaders’ average amount of interaction partners around research evidence decreased throughout the study, and the leadership network became less connected. While central office staff kept being more central than school leaders in distributing ideas from research across the district, their overall capacity to disseminate ideas from research evidence tended to decrease during this time. Also, school leaders’ capacity to access and share ideas from research evidence tended to decline. Conversely, the staying central office staff could, on average, increase their in-degree.
Our study has implications for leadership in school districts undergoing a restructuring and experiencing churn. While restructuring might be necessary for enhancing effectiveness, this study emphasizes the importance of focusing on the social side during a district reorganization. Then principals may perceive environmental changes as threats, which may result in “a downward spiral that promotes a threat-rigid response […] coupled with a decreased sense of efficacy” (Daly et al., 2011, p. 194), thus inhibiting change and improvement. First, district leaders should put in place structures and processes that allow building and maintaining relationships, especially during churning times. As such, it is crucial to connect site and district leaders, as well as staying and new leaders to foster collective values and beliefs and counter division. Towards this end, strengthening the trust within the district should be placed at the forefront. Productive and collaborative relationships need time to develop but are fundamental for organizational learning. Finally, our study has implications for research. For example, questions remain regarding the processes mediating churn and restructuring and changes in capacity for organizational learning, and vice versa. Additionally, future research could shed some additional light on the effectiveness of the ways leaders support positive organizational culture and learning in an environment informed by churn and restructuring.
Supplemental Material
Supplemental Material - The Churning of Organizational Learning: A Case Study of District and School Leaders Using Social Network Analysis
Supplemental Material for The Churning of Organizational Learning: A Case Study of District and School Leaders Using Social Network Analysis by Anita Caduff, Alan J. Daly, Kara S. Finnigan, and Christina C. Leal in Journal of School Leadership
Footnotes
Declaration of Conflicting Interests
The author(s) declared no potential conflicts of interest with respect to the research, authorship, and/or publication of this article.
Funding
The author(s) received no financial support for the research, authorship, and/or publication of this article.
Supplemental Material
Supplemental material for this article is available online.
Notes
Author Biographies
References
Supplementary Material
Please find the following supplemental material available below.
For Open Access articles published under a Creative Commons License, all supplemental material carries the same license as the article it is associated with.
For non-Open Access articles published, all supplemental material carries a non-exclusive license, and permission requests for re-use of supplemental material or any part of supplemental material shall be sent directly to the copyright owner as specified in the copyright notice associated with the article.