
Abstract
Background
Climate change poses increasing risks to occupational health and safety, yet systematic tools for assessing employees’ awareness of climate-related workplace risks remain limited.
Objective
This study demonstrates the development of a scale to measure awareness of the risks posed by climate change.
Material and Method
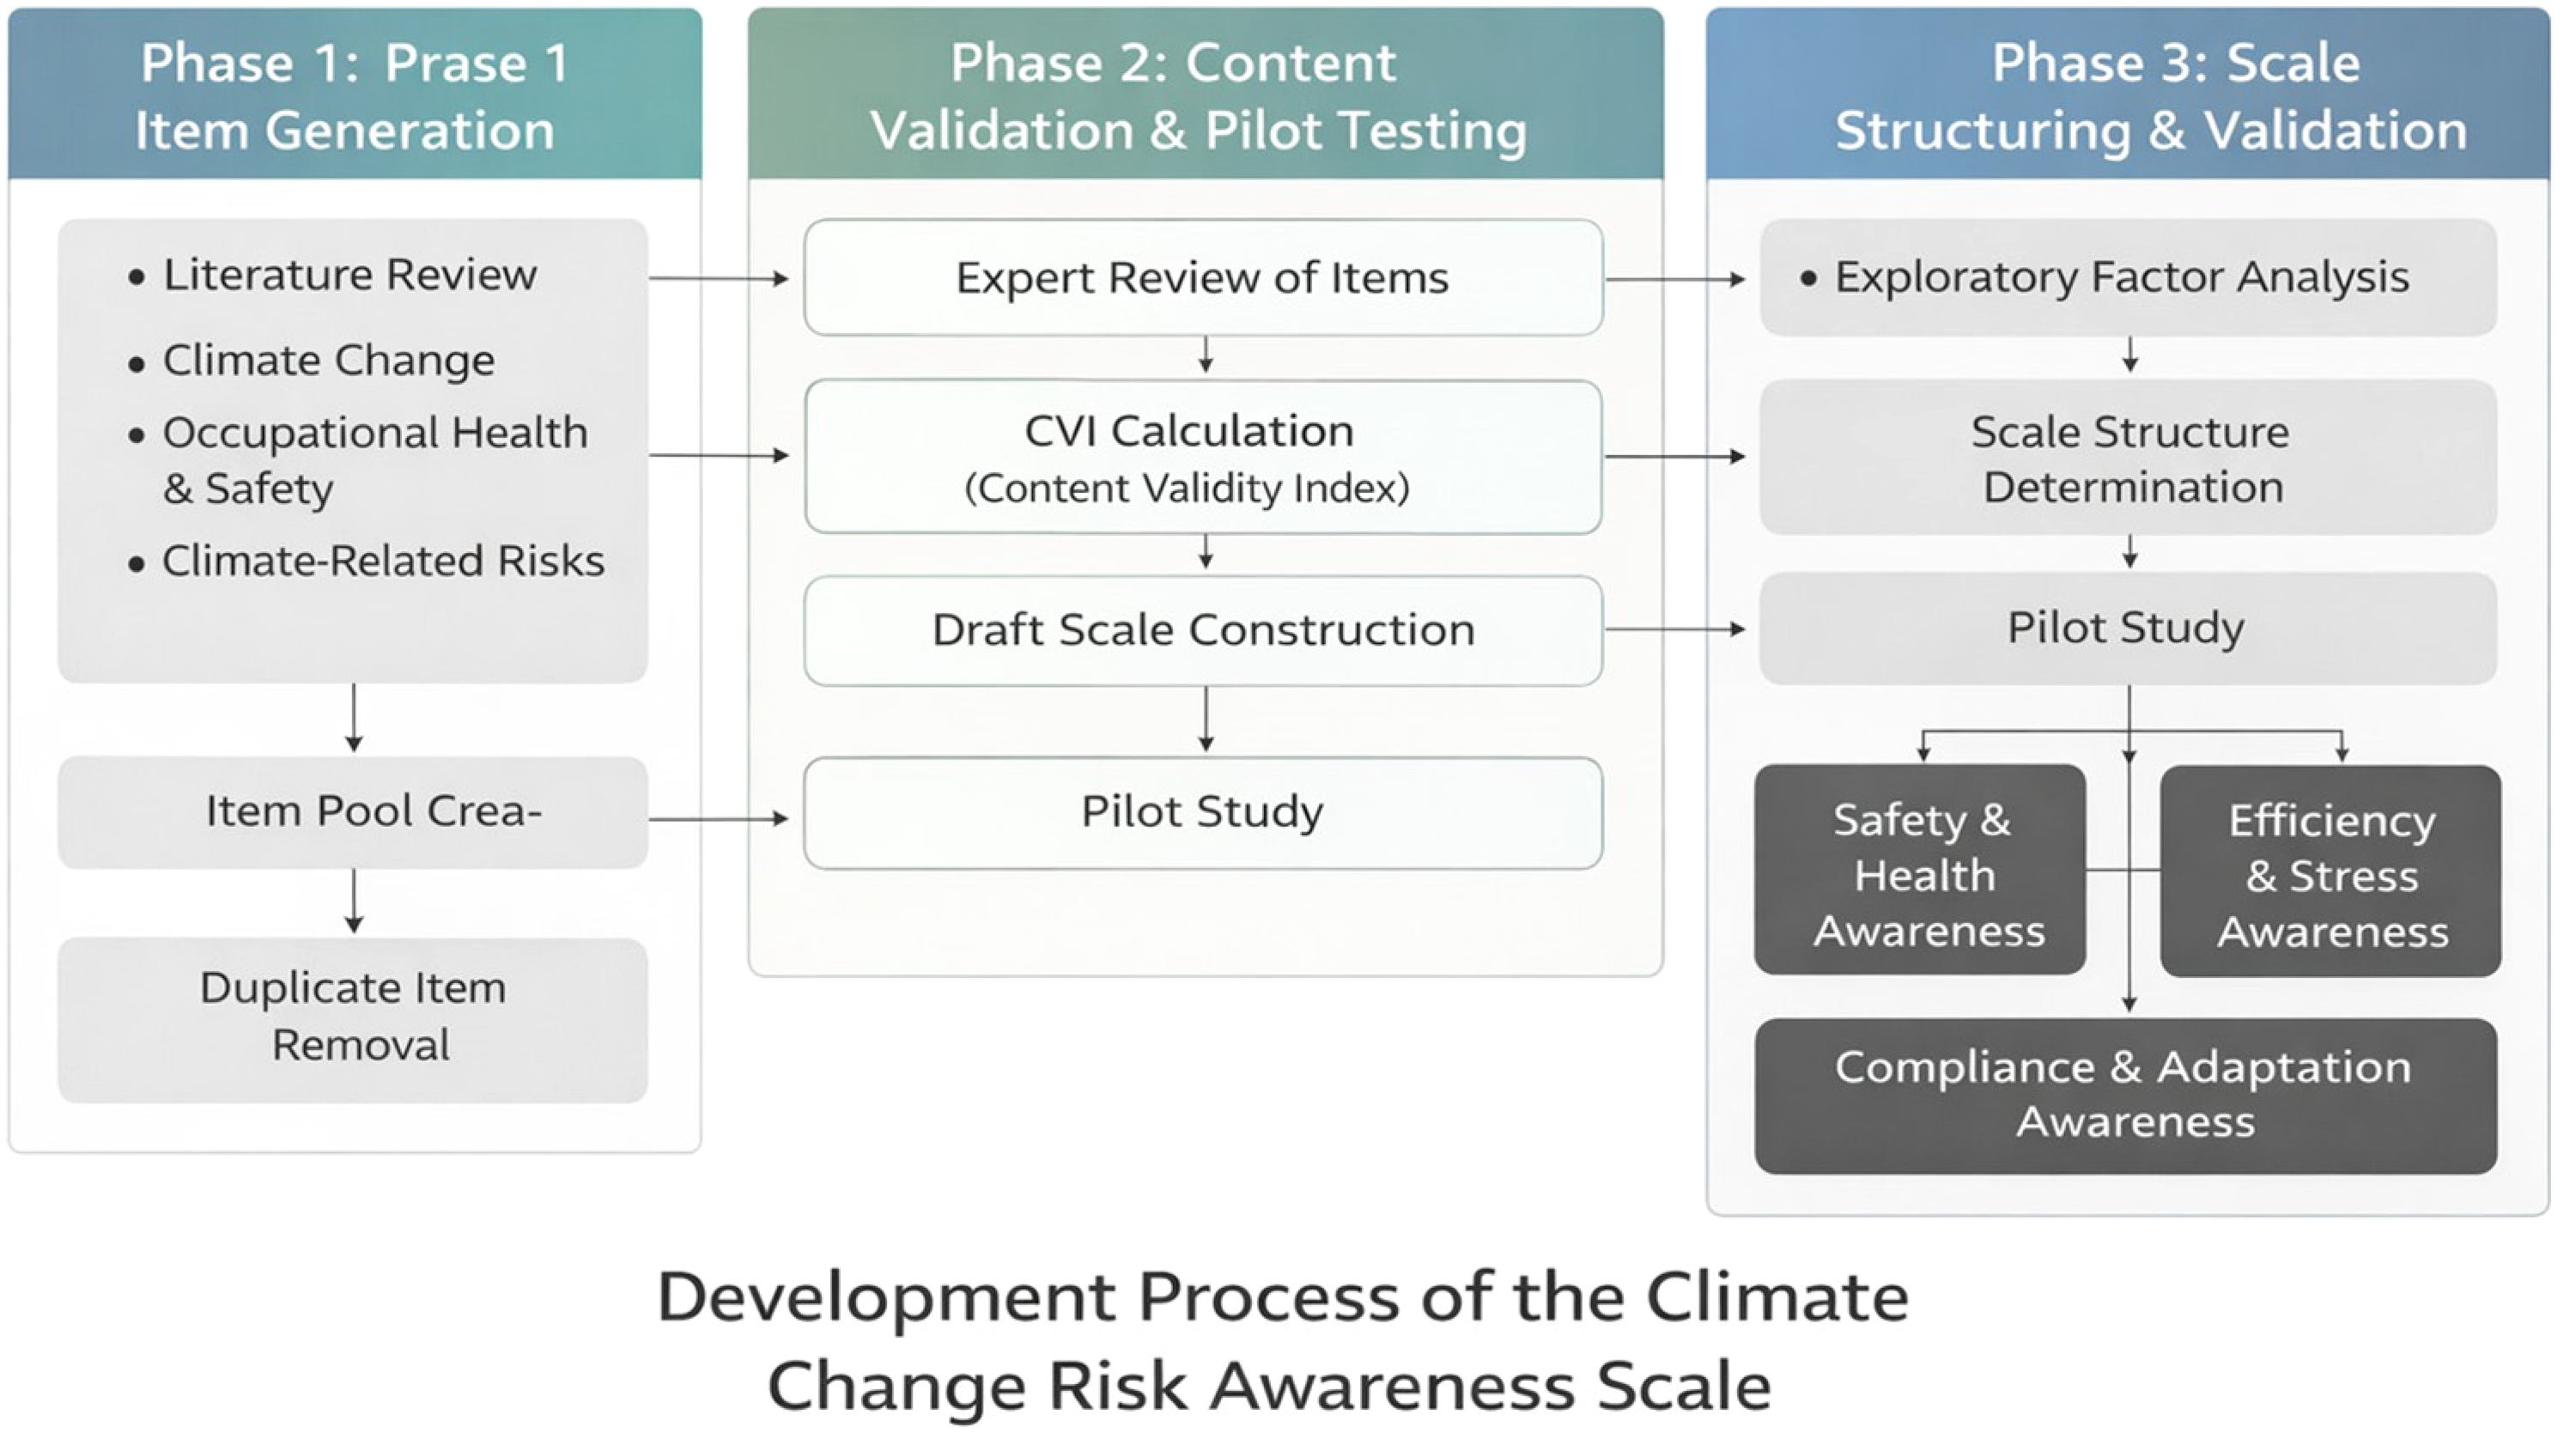
The scale was developed by researching the literature on climate change and generating a question pool. The produced question pool was first eliminated independently and then offered to experts for feedback. The number of questions was reduced to 24 based on expert feedback. The survey included employees aged 18 to 65 in Türkiye.
Results
The constructed scale had a Kaiser-Mayer-Olkin value of 0.933 and a significant Bartlett Sphericity Test result. The scale, which had a normal distribution in the normality test and was acceptable for factor analysis, underwent Explanatory Factor Analysis (EFA) and Confirmatory Factor Analysis (CFA), with items with low factor loadings being deleted. As a result of the reliability test, the Cronbach's Alpha score was 0.918. The Goodness of Fit Indexes also indicate that the study is suitable for further investigation. The scale was designed with 21 items and three factors in a four-point Likert structure.
Conclusion
Within the framework of the analyses performed; this study has produced a scale with approved validity and reliability to measure climate change risk awareness for different occupational groups between the ages of 18–65.
Keywords
Introduction
Climate change is the long-term change in the global average temperature and is a major threat to human beings. Due to human activities that strengthen the greenhouse gas effect, the temperature in the Earth's atmosphere is increasing day by day and supports climate change.1–3
Tyndall (1861) first noticed the greenhouse gas effect and emphasized that the change in the components of greenhouse gases could cause climate change, while Arrhenius (1896) mentioned that the increase in carbon dioxide levels could increase the greenhouse gas effect and increase temperatures.4,5
Previous studies indicate that climate change has accelerated in recent years. The acceleration of climate change indicates that the dangers we expect in the future are approaching. Negative effects are expected especially in the field of Occupational Health and Safety, and it is thought that many sectors and occupational groups will be affected and the frequency of many diseases will increase.6–9
It is important to combat climate change because the effects it creates cause problems on human health. While increasing temperatures pose problems for outdoor workers, they will also become a problem for indoor workers. In addition, cooling indoor spaces requires serious economic investments. With increasing temperatures, the use of personal protective equipment becomes more difficult. This situation causes greater efforts to be made when responding to emergencies and the team to tire more quickly. 10
Recent multidisciplinary research emphasizes that risk awareness is not a static cognitive state but a dynamic capability shaped by continuous learning, organizational capacity building, and adaptive behavior. Studies by Farooq and Salam (2021, 2024, 2025) demonstrate that awareness-driven learning capabilities play a critical role in shaping responsible organizational behavior, innovation orientation, and sustainable production practices. In particular, organizational learning capability enables individuals and institutions to interpret environmental risks, reassess priorities, and translate awareness into actionable strategies. From this perspective, climate change risk awareness can be conceptualized not merely as knowledge acquisition but as a learning-based mechanism that fosters adaptive responses and environmentally responsible decision-making in workplace contexts. Therefore, developing a valid and reliable scale to measure climate change risk awareness is essential to understand how awareness supports behavioral change, cleaner production practices, and sustainability-oriented actions within organizations.11–13
Despite the growing body of literature on climate change awareness, existing measurement tools often focus on general environmental attitudes or knowledge levels and fail to adequately capture the risk-oriented, behavioral, and occupational dimensions of climate change awareness. In workplace contexts, particularly within occupational health and safety frameworks, there remains a lack of validated instruments that systematically assess climate change risk awareness as a multidimensional and action-oriented construct. Therefore, the objective of this study is to develop and validate a Climate Change Risk Awareness Scale that measures individuals’ awareness of climate-related risks, their adaptive readiness, and their capacity to translate awareness into environmentally responsible behavior within work environments.
Material and method
The study was conducted on an online platform, a broad explanation section was created, and data collection began with the approval of the participants. An arrangement was made to end the study without moving on to the questions if the participants did not approve. While sharing the link, it was stated that our basic requirement was volunteering. The universe of the study consisted of 368 individuals between the ages of 18–65 who agreed to work. The sample of the study consisted of Engineers and Occupational Safety Specialists working in the Energy Production Sector in the Izmir/Aliağa region, physicians and health professionals working in the Education and Research Hospital in Bursa, and Academicians working as academicians in Istanbul. The sample size of the study was found to be a minimum of 291 people at a 95% confidence interval. 14 This sample size calculation also takes into account a 5% margin of error. Accordingly, the data collection process was carried out and analyses were performed on 368 data points. After removing outliers that violated the assumption of normal distribution, analyses were conducted on 363 valid data points. This sample size is considered sufficient for applying advanced statistical methods such as factor analysis and structural equation modeling.In this study;
Inclusion criteria:
being between 18 and 65 years of age, being actively employed in a profession, giving voluntary consent to participate in the study.
Exclusion criteria:
incomplete or inconsistent questionnaire completion, outliers that disrupt the normal distribution.
In cases where the exact population size is unknown, the sample size was calculated using the p = 0.5 assumption, as suggested in the literature. This approach maximizes variance and represents the highest sample size requirement. Based on a 95% confidence level (Z = 1.96) and a 5% margin of error (d = 0.05), the theoretical sample size was found to be 384. Considering the minimum sample size recommended in scale development studies, the data collection process was carried out, and after removing outliers, analyses were performed on 363 valid data points. This sample size is considered sufficient for the factor analyses and structural equation modeling performed. 14
The sample size was calculated using the p = 0.5 assumption, as suggested in the literature for cases where the population size is unknown. This assumption represents the highest sample size requirement by maximizing variance and provides a reliable estimated sample size. Sample equation is below:
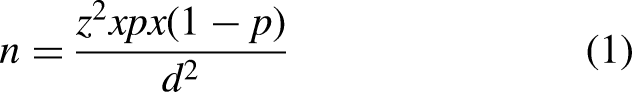
The sample size calculation for this study is as follows:
When the values are substituted:
Z = 1.96 (95% confidence level)
p = 0.5
d = 0.05 (margin of error)
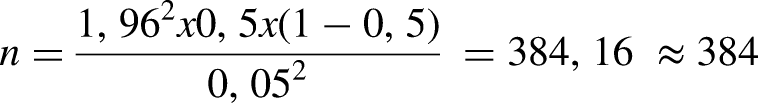
As a result of this calculation, the theoretical minimum sample size was found to be 384.
Development of the scale
When looking at the literature, it is understood that the stages of scale development differ.15,16 The model developed by DeVellis was preferred as a roadmap in this study. 17
Determination of measurement structure
As the first stage, problems and deficiencies were tried to be observed in the field, literature was reviewed and based on this, the structure and factors of the scale (3 Factors) were determined;
Safety and Health Awareness (SHA): Under this factor, it was aimed to measure the awareness of general occupational health and safety risks that climate change may cause. As the factor value increases, awareness will be evaluated as high.
Efficiency and Stress Awareness (ESA): Under this factor, it was aimed to measure the awareness of productivity and stress disorders that climate change may cause. As the factor value increases, it will be understood that awareness is high.
Compliance and Adaptation Awareness (CAA): In this factor, it was aimed to measure the employee's adaptation and adaptation awareness to climate change. As the factor value increases, awareness will be evaluated as high.
For the scale, it was decided to be a 4-point Likert scale based on expert opinions and suggestions. It was thought that statements such as “neither agree nor disagree” or “undecided” located in the middle of the 3,5-, and 7-point Likert scales would allow participants to mark the questions without reading them. 18
Item pool development
During the item-generation process, each item was written to reflect a specific climate-change-related occupational risk identified in the literature. For example, items under the “Safety and Health Awareness” factor included statements addressing heat stress, dehydration, and increased accident risk due to extreme temperatures (e.g., “Rising temperatures increase the risk of occupational accidents”). Items under the “Efficiency and Stress Awareness” factor focused on decreased work performance, fatigue, and psychological strain caused by climate-related working conditions (e.g., “Extreme weather conditions negatively affect my work efficiency”). The “Compliance and Adaptation Awareness” factor included items related to institutional preparedness, adaptation measures, and individual compliance behaviors (e.g., “My workplace has adequate adaptation strategies for climate-related risks”). This approach ensured that each item was conceptually grounded and aligned with its corresponding factor.
Content validity of the scale
Content validity is a prerequisite. 19 The most frequently preferred method among the methods used is to benefit from expert opinion. 20 For content validity, first of all, the measurement tool must contain comprehensive items related to the value to be measured. 21 Davis Technique was preferred for Content Validity. In Davis Technique, at least 3 and at most 20 experts in the field should be determined for the number of experts. 6 Academicians, 5 Occupational Safety Experts and 1 Psychologist who are experts in their fields were determined as experts and for each question in the draft scale, they were asked to evaluate as follows: (a) The item represents the quality (Item Appropriate), (b) The item should be slightly revised, (c) The item should be seriously revised, (d) The item does not represent the quality (Item Not Appropriate). In addition, a suggestion field was created so that each expert could take notes if they had a suggestion. For the calculation of the Content Validity Index (CVI), items a and b were added up after the expert opinion and divided by the total number of experts. If the CGI was above 0.80, the item was accepted, and 13 items that did not have this value were removed from the scale.22,23
Pilot study
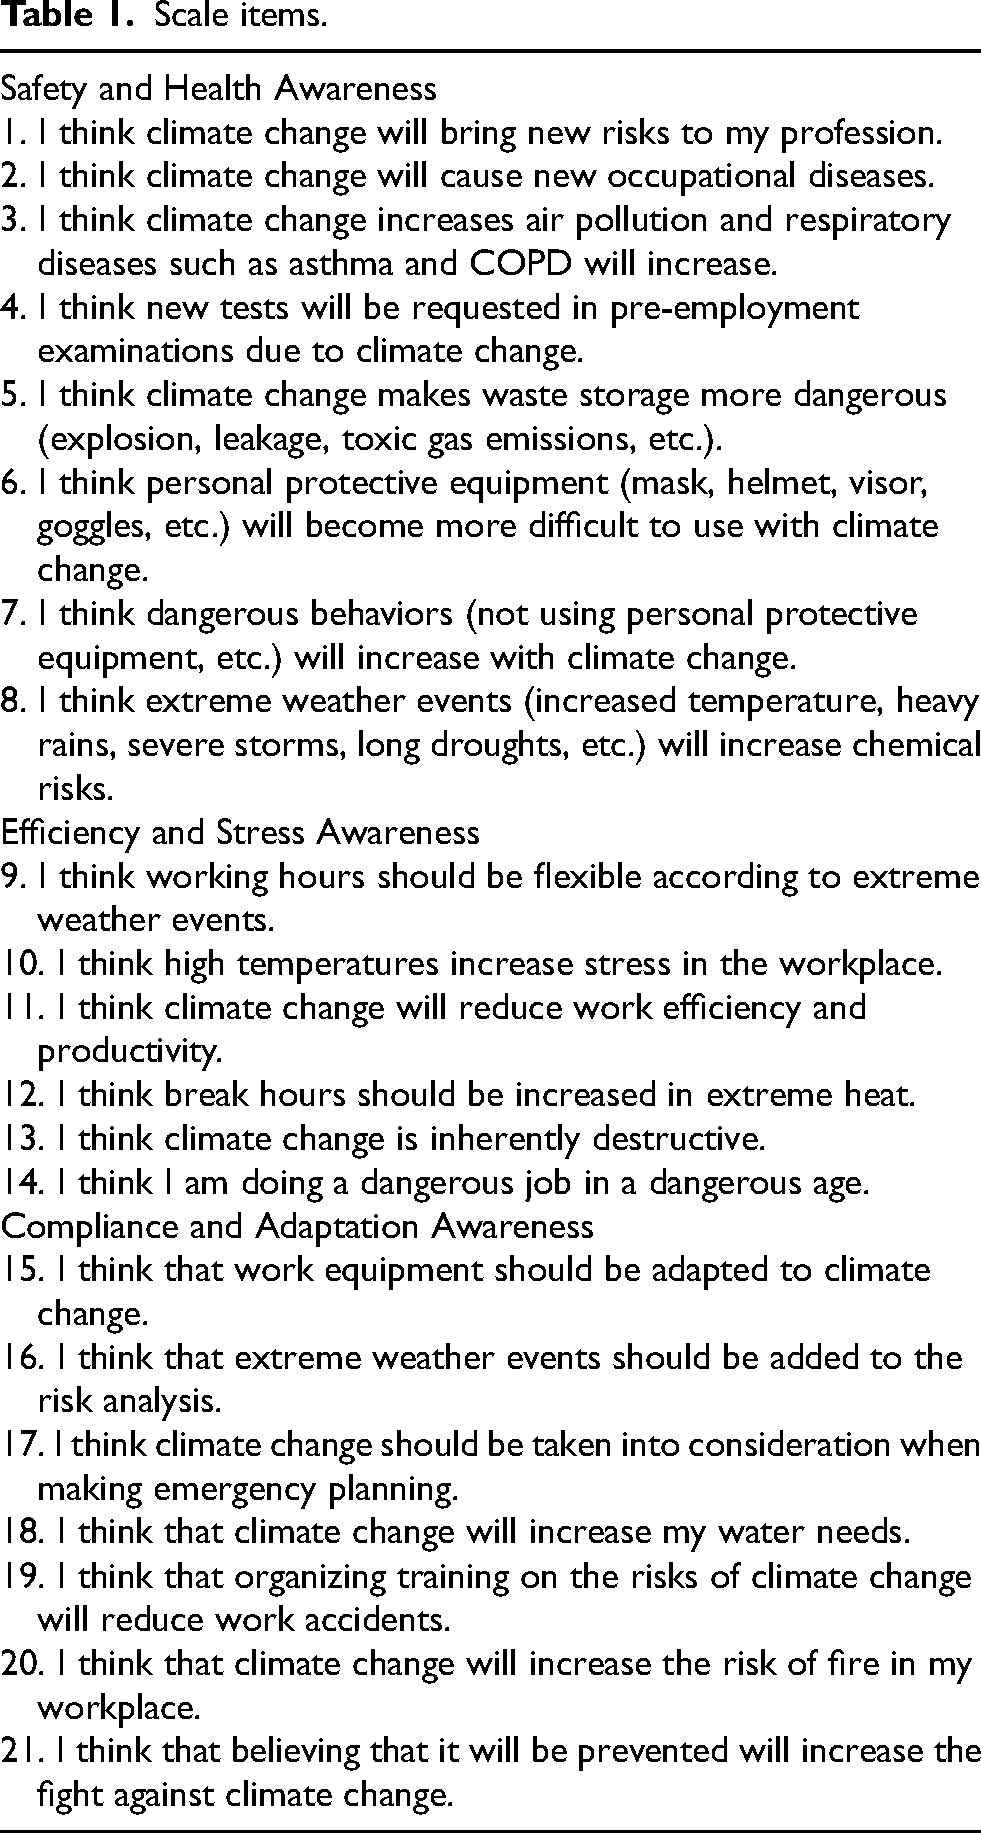
After calculating the content validity index, a pilot study was conducted. There are different opinions in the literature for a pilot study. While Evci and Aylar (2017) argued that a study covering 5% of the target audience would be sufficient, Şeker and Gençdoğan (2014) argued that a representative range of 30–50 people would be sufficient. Connelly (2008) stated that the pilot study universe should be created in a way that corresponds to 10% of the universe size.24–26 A pilot study was conducted with 30 people for a study with a universe of 300 people. After collecting the data for the pilot study; reliability studies were conducted and it was decided to remove the questions with a correlation score lower than 0.4. All sub-dimensions of the scale consisting of 3 factors were subjected to reliability studies separately, and exploratory factor analysis was applied. As a result of the pilot application, it was created in 3 dimensions as “Safety and Health Awareness” (8 statements), “Efficiency and Stress Awareness” (6 statements), “Compliance and Adaptation Awareness” (7 statements). The created items were added to the end of the study as Table 1.
Scale items.
Data collection process
Within the framework of the scale to be developed, 368 data were obtained between August and September 2024.
Findings
Data analysis process
The collected data were first subjected to a normality test, and the data deviating from the normal distribution were determined with an outlier test and removed from the survey. The analyses were continued with the remaining 363 data, and the data were found to be in the normal range when the kurtosis and skewness values were between −2.0 and +2.0. 27
Validity and reliability analyses
At this stage, analyses were applied at a 95% confidence interval. The factor structures of the measured dependent variables were tested separately with Explanatory Factor Analysis (EFA), Confirmatory Factor Analysis (CFA) and Structural Equation Model (SEM). The purpose of these tests is to check the structural validity of the scale.28–30 Detailed information about the tests is provided in the next section. (Figure 1)
Research model.
Factor analysis
Explanatory factor analysis (EFA)
This analysis, also known as Exploratory Factor Analysis, is used to reveal the factors hidden under the observed factors in a scale development study where the factor structure has not yet been determined. This method, which is widely used in scale development studies, is the first step of factor analysis.28,31 Exploratory Factor Analysis was applied to determine the factor structure of the scale. 32 Prior to the analysis, the Kaiser–Meyer–Olkin (KMO) sample adequacy test and the Bartlett Sphericity Test were conducted, and the results showed that the data was suitable for factor analysis (KMO = 0.933; Bartlett test p < 0.001). 33 Exploratory Factor Analysis resulted in three factors with eigenvalues greater than 1. Items with factor loadings below 0.40 were excluded from the analysis. The factors and items included in the final scale are as follows:
Safety and Health Awareness (SHA): Items 1–8
Efficiency and Stress Awareness (ESA): Items 9–14
Compliance and Adaptation Awareness (CAA): Items 15–21
Confirmatory factor analysis (CFA)
CFA, which is one of the analysis methods frequently used in scale development studies, is preferred to check the validity of the model obtained after the EFA application. There should be migration assumptions for CFA. It is used to test the accuracy of the created model. CFA can also be used alone in scale development studies, but the possibility of error is higher.25,29,30 For this reason, EFA was applied first in this study. The created CFA diagram is shown below as Figure 2.
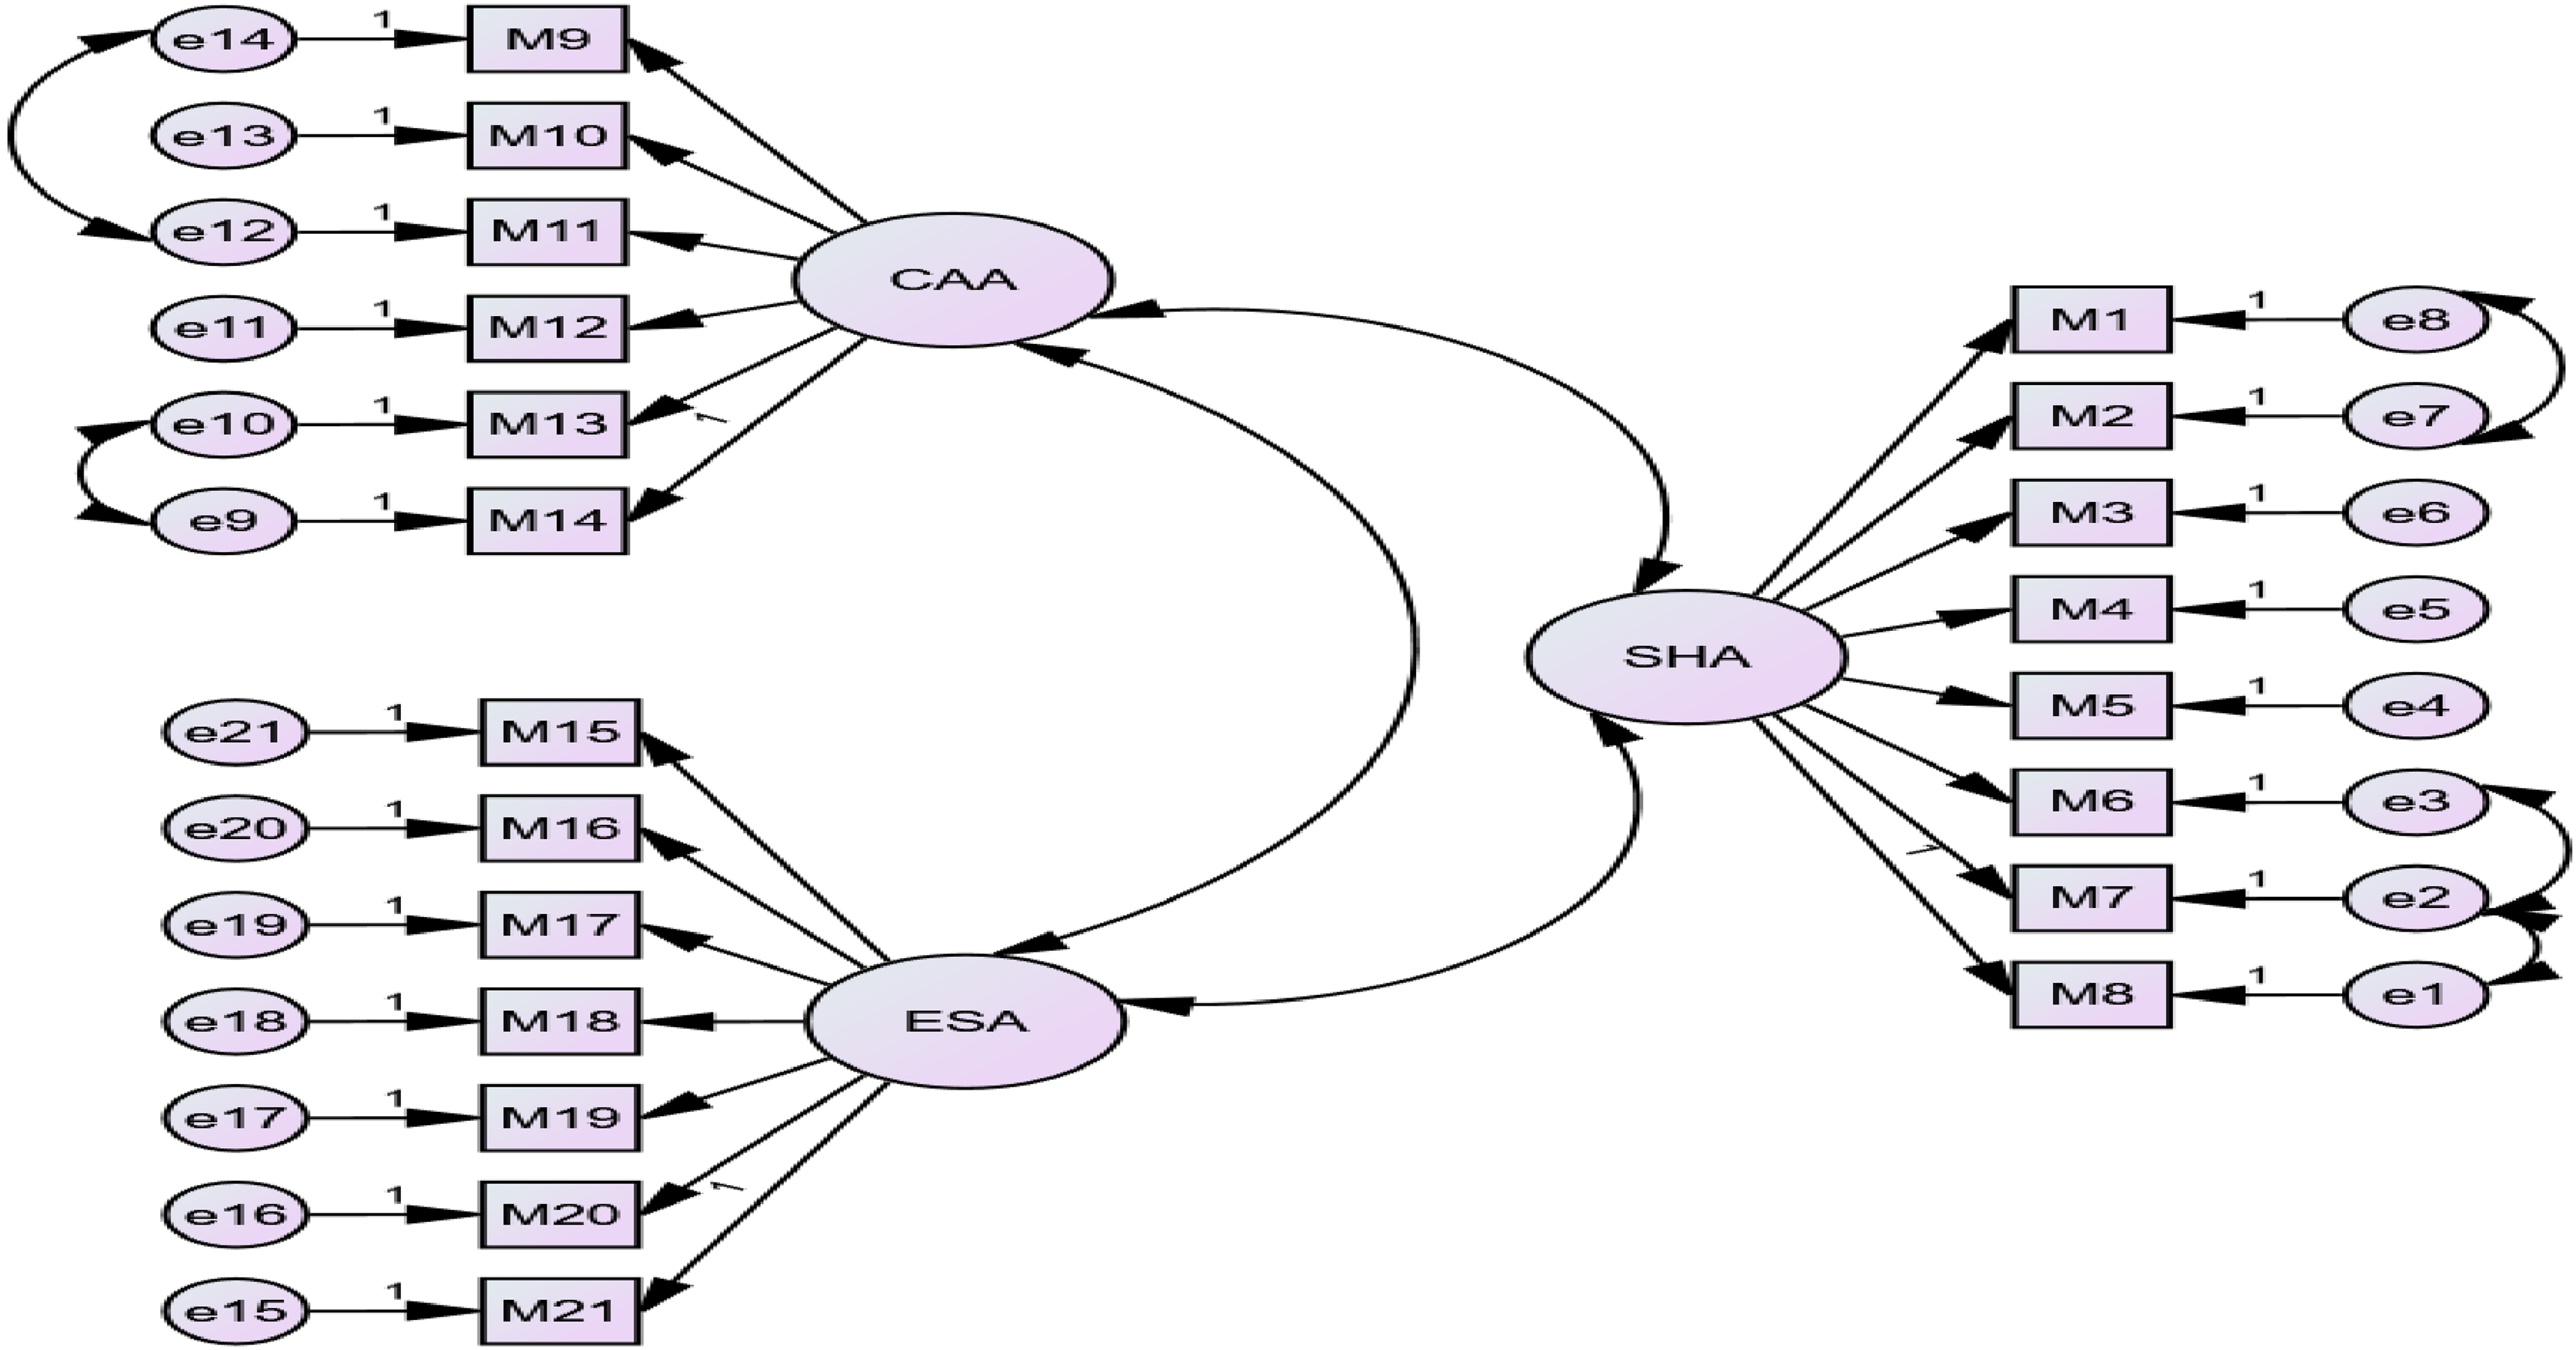
Confirmatory factor analysis.
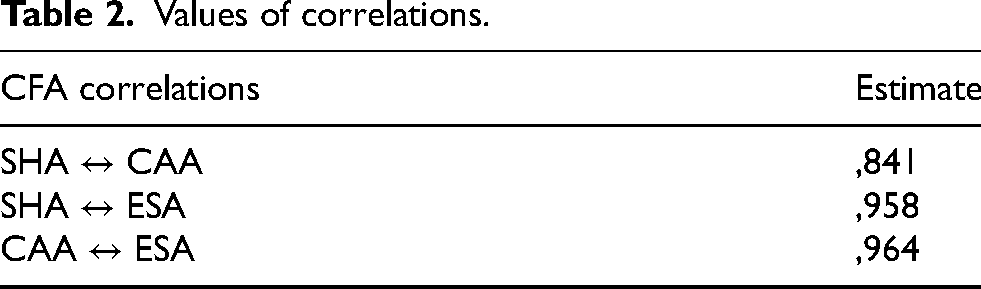
Correlation expresses the relationship between variables. When measuring the distribution between two different series, it is evaluated in the range of −1 to +1. As the absolute value approaches 1, the fit increases. When the value approaches −1, it can be interpreted as an inverse relationship. The value range between 0.70 and 0.90 is considered to have a strong relationship, and a value greater than 0.90 is considered to have a very strong relationship.34–36 The values of the correlations established in the CFA diagram created for the scale are shown in Table 2. When the values in the table are analyzed, the relationship between the factors is consistent.
Values of correlations.
Structural equation model (SEM)
Path analysis
Path analysis is used in the analysis of more complex models compared to other types of analysis. With this analysis method, the connection between variables is examined and the importance and magnitude of the relationships assumed to exist between variables are estimated and assumptions are made. The interpretation of Path Analysis varies depending on the diagram established. Therefore, it is necessary to make sure that the diagram is well established. As in other analysis methods, path analysis should also be indexed to the cause-effect relationship.37–40 Equation 2 used to calculate the Path Coefficient is shown below.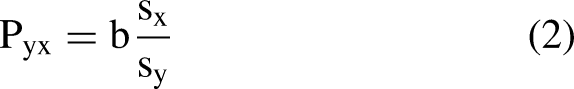
BM SPSS AMOS Version 26.0 was used to test, evaluate, determine and perform factor analysis of the structure suitability of this study. Figure 3 for Path Analysis is shown below.
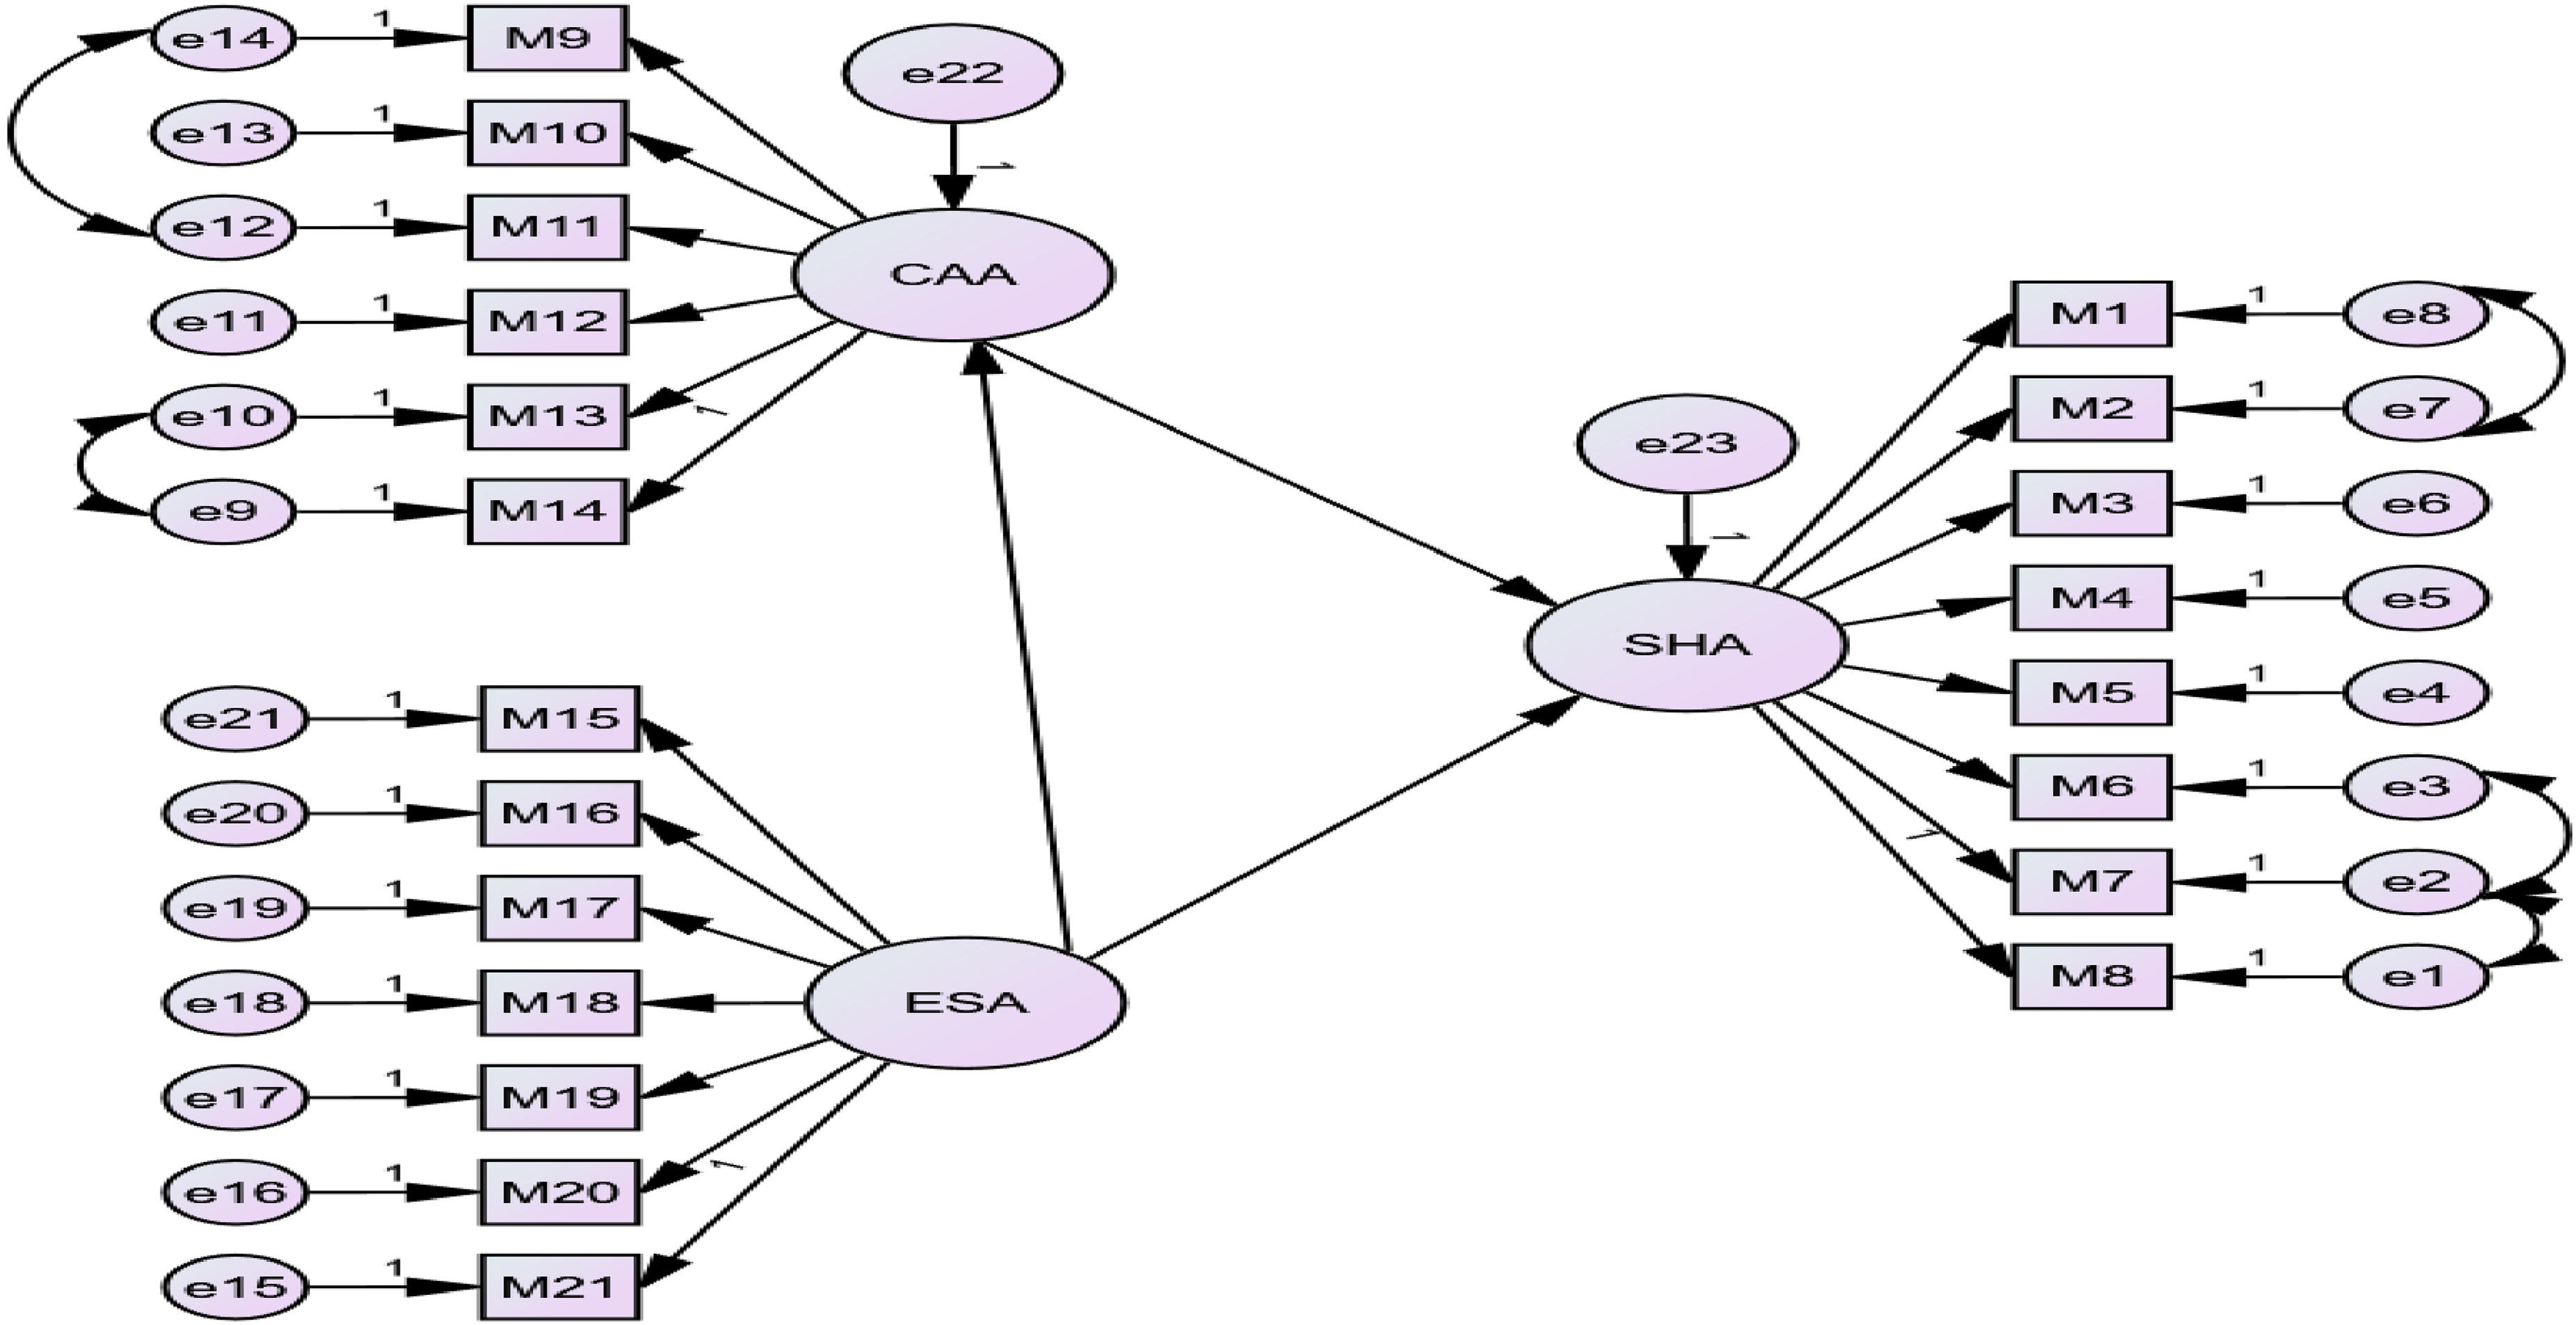
Path analysis.
Compliance and Adaptation Awareness has a direct relationship with both Efficiency and Stress Awareness and Safety and Health Awareness. Compliance and Adaptation Awareness has a direct relationship with Safety and Health Awareness. Direct relationships affect Safety and Health Awareness when the awareness of the factor in which it is located decreases or increases.
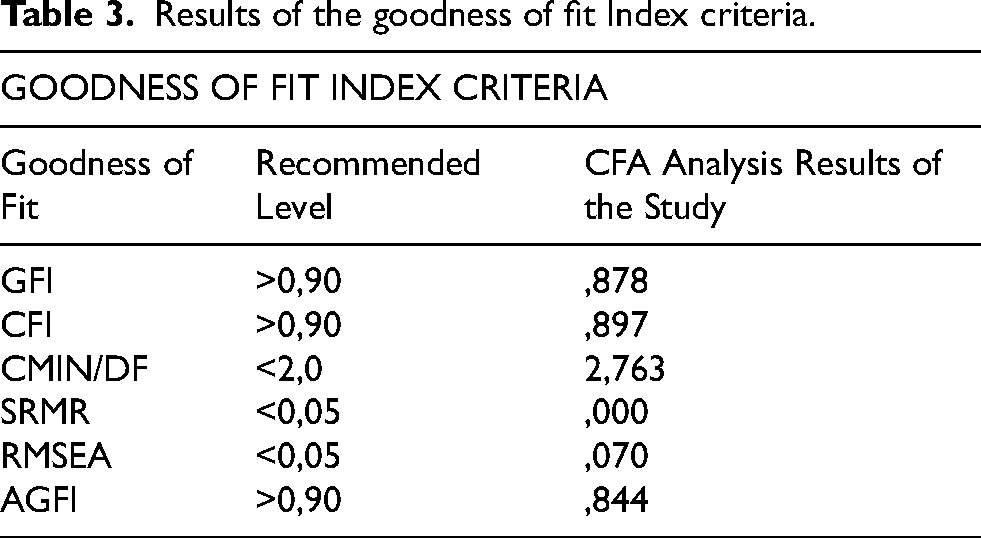
Goodness of fit criteria analyses
Chi-Square (x2) analysis
Chi-Square, the most basic test method of goodness of fit measurement, provides significant results in measurements with large samples. Due to the sensitivity between Chi-Square and sample size, the (χ2 /df) ratio between Chi-Square and degrees of freedom is preferably used. The acceptance range of the (χ2 /df) value is specified as 2–5.41,42 The sample size standard is determined as N ≥ 200. 43 Chi Square is a test of significance and provides statistics in this context. Since the analysis results it provides are rich in statistics, it enables the interpreter to obtain detailed information. 44 The Chi-Square value of this study was measured as 500.060.
GFI Index
The fit indices are not interpreted alone. More than one fit indices examine the fit on the models. The Goodness of Fit Index (GFI) is used to calculate the minimum misfit required to provide superior fit under the maximum possible condition. The expected value for GFI is in the range of 0 < GFI ≤ 1.41,45 The GFI value of this study was measured as .878. The GFI calculation is shown in equation 3 below.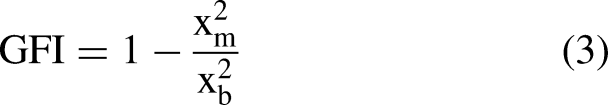
CFI Index
Comparative Fit Index (CFI) is one of the important outputs of factor analysis and is frequently used. It measures the consistency between the data and the model, and the superiority of the open covariance matrix over equivalent models. It takes a value between 0 and 1. There is more than one opinion in the literature about the interpretation of the value. A value between 0.90 and 0.95 indicates that the model is usable, and a value of 0.95 and above indicates a perfect fit.
41
In some studies, it has been concluded that values above 0.80 are acceptable.
46
The CFI value of this study was measured as .897. The CFI calculation is shown in equation 4 below.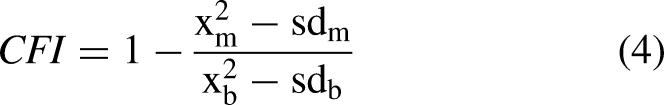
The root mean square error of approximation (RMSEA)
It expresses the root mean square error of the approach. The purpose of the measurement tool is to provide balance between the complex structures in the model and the sample size. It is the most popular measure for model fit.
47
It is interpreted in three different value ranges;
- If RMSEA ≤ 0.05, it is considered very good, - If 0.05 ≤ RMSEA≤0.08, it is considered good, - If 0.08 ≤ RMSEA≤0.10, it is considered mediocre, - If RMSEA≥0.10, it is considered unacceptable.
45
In this study, the RMSEA value was measured as 0.07 and is within the acceptable fit range. Table 3 shows the results of the goodness of fit index criteria.
Results of the goodness of fit İndex criteria.
Cronbach's alpha
Cronbach's Alpha was developed in 1951 to measure consistency.
48
It is used to measure the reliability of scale groups with multiple items and to create a definition. It is widely used today and is included in most statistical programs and provides objective measurement.
49
Cronbach's Alpha calculation is shown in equation 5 below.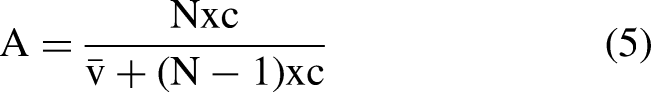
N = Number of Data,
c̅ = Covariance Between Elements,
v̅ = Item Variance.
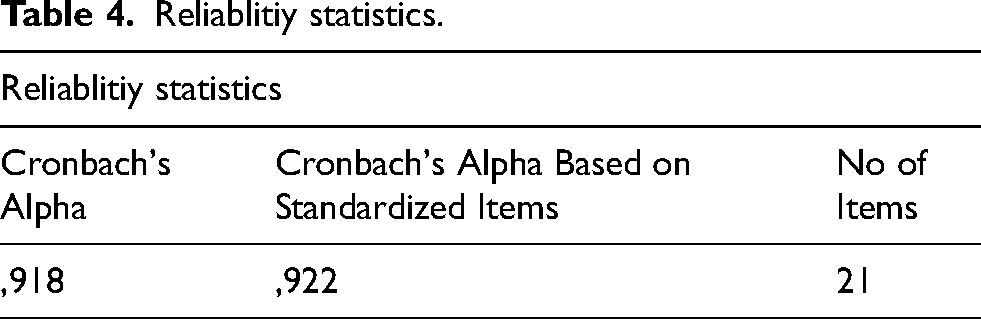
When the reliability coefficients are examined, the scale is interpreted as unreliable if it is in the range of 0.00 ≤ R2 ≤ 0.40, as low reliability if it is in the range of 0.40 ≤ R2 ≤ 0.60, as reliable if it is in the range of 0.60 ≤ R3 ≤ 0.80, and as highly reliable if it is in the range of 0.80 ≤ R4 ≤ 1.00.50,51 Cronbach's Alpha (α) test was applied to determine the reliability of this scale. Cronbach's Alpha value was found to be .918 and the number of variance explained was seen as 74.649. Cronbach's Alpha test was applied for the sub-dimensions respectively and the findings were found to be in the reliable range. The alpha value for Safety and Health Awareness (SHA) was (.845), for Efficiency and Stress Awareness (ESA) (.751), and for Compliance and Adaptation Awareness (CAA) (.803). All of the values found are reliable within the acceptable range. Table 4 shows the reliability statistics results.
Reliablitiy statistics.
A total of 368 people participated in the study, 175 (48%) of whom were female and 193 (52%) were male. Of the participants in the study, 255 (61%) were married, 130 (35%) were single, and 12 (3%) were divorced. When their professional years were evaluated, 110 people (30%) had 1–5 years of experience, 105 people (29%) had 6–10 years of experience, and 153 people (42%) had 11 years or more of experience. The distribution among professional groups was as follows: 60 people (16.6%) were physicians, the professional group with the highest participation in the study was health professionals with 100 people (47.5%), 40 people (11.1%) were engineers, 17 people (4.7%) were academicians, and the remaining 64 people (17.7%) were lawyers and technicians working in the energy sector, which are outside of our 5 professional groups. Occupational Safety Specialists were the occupational group with the highest participation with 11 people (3%).
When the average scores of the items are examined, the highest score with 3.58 points was received by Item 17, “I think climate change should be taken into consideration when making emergency planning.” This can be interpreted as employees expecting climate change to create emergencies and wanting to be prepared for possible situations. The item with the lowest average score is Item 14, “I think I am doing a dangerous job in a dangerous age.” The reason for this low score is that employees may have become accustomed to the situation they are in due to being constantly exposed to similar dangers.
T-Test and one way ANOVA analysis
Both tests are applied to measure whether there is a difference between the sample groups.48, 52 Since there are 2 different options, t-test was applied to the variables “Gender, Occupational Disease History and Work Accident History”. No significant effect of Gender and Work Accident History on awareness was found. A serious harmony was observed between Occupational Disease History and Adaptation Awareness. It was interpreted that people who had an occupational disease adapt to changes faster and therefore will be in a more advantageous position in taking precautions.
ANOVA test was applied for our variables with multiple options. As the level of education increases, the level of awareness increases. It was observed that doctoral and master's degree graduates differ positively from high school graduates. Among the marital statuses, it was observed that married people have higher Safety and Health Awareness compared to single people. It was understood that age has no significant relationship with the difference and it was concluded that Professional Groups and Year of Profession have no effect on awareness.
Discussion
The “climate change” that was first mentioned in the 1860s has continued to the present day with increasing intensity. The increase in greenhouse gases since the industrial revolution reveals how much the human factor contributes to climate change. In a study that discusses the obstacles to combating climate change, the author addresses the following as the main obstacles: not feeling anxious or concerned about climate change, not being informed about climate change, and being afraid of being stigmatized by society in participating in climate action.2,53
With climate change, new dangers are emerging for every occupational group. These new dangers create risks such as productivity, stress, and adaptation on employees. In this context, identifying the risks that may develop due to climate change is important for employers and employees. 54
Michele Ochsner (2018) mentioned in her study that climate change will cause socioeconomic and ecological changes and emphasized that employees will be negatively affected. The effects of climate change affect the entire population. 55 However, employees are more affected by these effects. Because employees have to work to make a living even though they know they will be exposed to these effects. 56 In this case, new standards should be regulated that will allow employees to avoid exposure. 57 When the processes written in the literature are examined, the first two items of the scale are determined as “I think climate change will bring new risks to my profession.” “I think climate change will cause new occupational diseases.” Ruth M. Doherty (2017) examined the effects of climate change on air quality and stated that it will have effects on health accordingly. 58 Accordingly, the item “I think climate change increases air pollution and respiratory system diseases such as asthma and COPD will increase.” was created.
When looking at the literature, there are studies that mention that climate change aggravates the picture of mental illnesses. It is predicted that with the increasing temperature, there will be disruptions in sleep patterns and the effects of psychoactive drugs will decrease. Again, with the temperature increases; it is expected that there will be an increase in suicide cases, violence, murder, substance use, and psychopathological findings such as post-traumatic stress disorder.59–62 When looking at this side of the literature, it is thought that climate change will have effects on productivity and stress, and that there will be problems of compliance and adaptation in this process. The items of the scale were created to create and measure awareness focused on this issue. The developed scale enables public and private sector organizations to identify climate change-related risks at an early stage. Within the framework of public-private partnerships (PPP), this scale can provide data-driven contributions to the development of sustainable occupational health and safety policies.
This study aimed to develop the Climate Change Risk Awareness Scale and to calculate its validity and reliability. The scale development study was carried out with 363 data obtained from different professional groups. Although there is no definitive information about the sample, studies in the literature were taken as examples and a minimum of 291 people were found with a 95% confidence interval and the data collection process was carried out in this context.14,63
With expert opinion, the Devis Technique was applied to calculate the Content Validity Index and the items of the scale were tried to be created. 23 The draft scale was examined by examining the pilot study suggestions in the literature and a pilot study was carried out with 30 people.24–26 In the light of the obtained data, Cronbach's Alpha reliability analysis was performed on the scale with results in the range of 0–1 and the Normality Test was applied to the study with a confidence interval close to 1. Data that disrupted the normal distribution were determined with the Outlier Test and were removed from the study. First of all, KMO and Bartlett's Sphericity Test were applied to the remaining data and as a result of the results being suitable for factor analysis, factor analysis was started and EFA, CFA and SEM analyses were performed and 3 questions with low factor loadings were removed and it was decided to continue the study, which started with 24 items, with 21 items.64,65 The Fit Indexes of the study are within an acceptable range. In light of all the results obtained as a result of the analyses, it was concluded that the developed scale could be used to measure awareness of climate change risks in different occupational groups between the ages of 18–65.
The findings of this study are consistent with prior research emphasizing the role of awareness as a precursor to adaptive and responsible behavior. Farooq et al. (2021, 2024, 2025) argue that awareness becomes effective only when it is embedded within learning processes that enhance individuals’ capability to respond to complex and evolving risks. In line with this perspective, the multidimensional structure of the Climate Change Risk Awareness Scale reflects not only risk perception but also the cognitive and behavioral readiness required for adaptation. The validated factors identified in this study support the notion that climate risk awareness contributes to environmentally responsible behavior by facilitating continuous learning, informed decision-making, and proactive engagement with sustainability challenges in work environments. Thus, the present findings extend existing literature by empirically operationalizing climate risk awareness as a measurable construct linked to adaptive capacity.11–13
Limitation
A key limitation of this study is that it primarily addresses the physical and psychological health dimensions of climate change risk awareness. While these aspects are critical, climate change also involves a wide range of additional risks, such as vector-borne diseases, flood-related hazards, and ultraviolet (UV) radiation exposure, which may vary significantly across regions and occupational groups. Addressing all these dimensions within a single measurement tool could result in an overly lengthy instrument and may reduce response accuracy. Therefore, future research may benefit from developing region- and occupation-specific scales that focus on distinct climate-related risk domains, enabling more targeted risk assessment and more effective risk planning strategies.
Conclusion
Within the scope of the research conducted; It has been concluded that the “Climate Change Risk Awareness Scale” consisting of 21 items and 3 dimensions (Safety and Health Awareness, Effiency and Stress Awareness, Compliance and Adaptation Awareness) that allows measuring the climate change risk awareness of employees between the ages of 18–65 is valid and reliable. This research is an important component in order to measure and create awareness of employers and employees, to develop policies against new risks for employers, and to encourage employees to participate in risk reduction activities and adapt to new policies.
The fact that Cronbach's Alpha analysis was applied to all factors separately and reliable results were obtained has led to the conclusion that they can be independent scales.
Each occupational group carries different risks and needs risk planning with different approaches in their internal dynamics. It is evaluated that new studies that apply the Climate Change Risk Awareness Scale separately for each occupational group and present it to the literature can be a reference. Future studies suggest applying the developed scale to different sectors and regional contexts, as well as integrating it with artificial intelligence and decision support systems. This approach will contribute to a more proactive management of occupational risks related to climate change.
Within the scope of this research, the findings indicate that the Climate Change Risk Awareness Scale, consisting of 21 items and three dimensions (Safety and Health Awareness, Efficiency and Stress Awareness, and Compliance and Adaptation Awareness), is a valid and reliable instrument for assessing climate change risk awareness among employees aged 18–65. This age range was selected to reflect the active working population, for whom occupational exposure, organizational policies, and workplace adaptation strategies are most directly applicable.
The results suggest that the scale provides a valuable framework for increasing awareness among both employers and employees, supporting the development of organizational policies addressing emerging climate-related risks, and encouraging employee participation in risk reduction and adaptation initiatives. Reliability analyses demonstrated satisfactory internal consistency across all dimensions, indicating that each subscale may be used separately when specific dimensions of climate change risk awareness are of interest.
Given that occupational groups are exposed to climate-related risks in different ways, future studies applying the Climate Change Risk Awareness Scale across specific occupational sectors may contribute further to the literature by enabling sector-specific risk planning and targeted preventive strategies.
Beyond its psychometric contribution, this study provides a conceptual foundation for understanding climate change risk awareness as a driver of responsible behavior and sustainable practices in organizational settings.
As emphasised by Rehman et al. (2018), it is stated that in the process of developing climate change awareness, it is not sufficient to place responsibility solely on public authorities; 66 comprehensive approaches that involve cooperation between the public and private sectors are important for the creation of sustainable systems. In this context, it is thought that the Climate Change Risk Awareness Scale, developed as an assessment tool that can be used in both public and private sector applications, can contribute to the planning of joint policy development and risk reduction strategies.
Consistent with prior research emphasizing the role of learning capability and adaptive orientation, the developed scale offers a practical tool for assessing how awareness can inform organizational interventions, policy development, and sustainability strategies.11–13 Future research may utilize this scale to examine the relationship between climate risk awareness, responsible technology adoption, and decision-making processes in modern work environments. Additionally, cross-cultural validation studies are recommended to further explore the generalizability of the scale across different socio-economic and organizational contexts.
Footnotes
Acknowledgements
The authors would like to thank all experts consulted within the scope of content validity for sharing their field experience and valuable contributions. The authors also express their sincere gratitude to Psychologist Berkan KIRNAK for his support in the field of psychology.
Ethical approval
This study was approved by the Ethics Committee for Non-Interventional Research in Health, Social and Entrepreneurial Sciences of Istanbul Yeni Yüzyıl University (dated 08.07.2024; decision no: 2024/07-1284) and was conducted in accordance with the principles of the Declaration of Helsinki.
Informed consent
Written informed consent was obtained from all participants.
Author contributions
All authors contributed equally to this study.
Funding
The authors received no financial support for the research, authorship, and/or publication of this article.
Declaration of conflicting interests
The authors and their household members do not have any membership, consultancy, expertise, or company partnership that could potentially cause a conflict of interest related to this study.
Data
The excel table of the data obtained for the study was added to Mendeley Data and made available as open access. A number is assigned for each data and the meaning of each number is explained under the title of the data. doi: 10.17632/9y7x95kcyn.1