
Abstract
Background
Conceptual links between economics and modern data science pose challenges for students and lecturers alike. The present article aims to enhance education and training of students and practitioners by integrating modern empirical research skills into their economic competencies.
Aim
This paper introduces a classroom game designed to simulate real-world economic scenar- ios, enhancing understanding of procurement markets and regulatory roles within society. In addition, the paper provides supporting teaching material in order to implement the game. The incorporation of this classroom game can contribute to the preparation of the next generation of professionals to be better equipped to address challenges in the era of big data.
Method
Participants’ success in the game’s first two parts hinges on their comprehension of market dynamics. In the third part, drawing from recent literature on machine-learning-based cartel detection, participants analyze whether bid patterns are indicative of collusive (cartel) behavior. In this part of the game, the success of the participants now role-playing as employees of an antitrust authority, depends on data-science skills.
Results
The classroom game introduced in the present article was implemented with a class of ten students, serving both as a proof of concept and as a means to gain practical insights. The game proves to be a suitable tool for social-science educators to incorporate the interdisciplinary nature of modern economics into their curricula. It is suited for participants with varying levels of data-science expertise. Moreover, it demonstrates how key lessons from scientific articles can 1 be taught in an application-oriented manner, enhancing participants’ ability to apply theoretical knowledge in real-world contexts.
Conclusion
Incorporating the classroom game presented in this paper into educational curricula supports students in effectively integrating data-science skills with economic reasoning.
Introduction
Ever since the advent of game theory in the mid-20th century and George Stigler’s ”The Theory of Oligopoly” (Stigler, 1964), the study of cartels has been an integral component of any economics curriculum. Cartels, which cause prices to increase and/or the quality of products and services to decrease, not only intrigue researchers but are of utmost importance to policymakers, who have to make sure that public funds are used in an efficient manner. Moreover, cartel formation is illegal in most countries worldwide, and firms must expect high sanctions when a conspiracy is detected.
In recent years, the erstwhile predominantly theoretic field of industrial organization has gradually shifted towards empirical research. One contributing factor is the increasing potential to harness large data sets for scrutinizing markets and identifying patterns indicative of cartel presence (see, e.g., Harrington, 2008), an indispensable first step in fighting cartels. According to the OECD (2022), in the past years, the literature on cartel screening has primarily focused on the utilization of machine learning.
From the students’ and practitioners’ point of view, such developments pose a challenge, as modern data-science skills are suddenly required in addition to understanding (imperfect) markets. The added complexity may hinder their ability to translate motivation into action, a gap that educationalists sometimes propose narrowing through the use of ”edutainment” (see, e.g., Prensky, 2003). As Alsawaier (2018) summarizes, this can be achieved either by adding game elements and mechanics to the educational environment (”gamification”) or by simulating content using actual games (”game-based learning”). We follow the second approach by incor- porating a game with defined learning outcomes (Plass et al., 2015), following the argument games motivate learners to stay engaged over a long period through a series of motivational game features. However, we also consider Folmar’s cautionary note, who argues that classroom games carry the risk of short-lived engagement and motivation, ending with the game (Folmar, 2015). To address this, we break the game into several parts and integrate it with other teaching elements, such as theory inputs. Overall, our study contributes to the growing field of game-based economic education (see, among others Picault, 2015; Duzhak et al., 2021) by introducing a tool that bridges economics with modern data science.
The virtual setting of our classroom game is the procurement procedure in the construction sector, an industry particularly prone to collusion, as cartel formation is more likely with a small number of firms, little or no entry, repetitive bidding, and stable demand (see, e.g., Ken Danger, 2009). In public-sector contracting, procurement agencies invite firms to submit bids for projects put to tender (for Switzerland, see, e.g., Wallimann et al., 2023). Therefore, a procurement agency announces future contracts and deadlines for bid submissions. Moreover, the agency provides interested firms with relevant information for the contract. Then—if interested—construction firms prepare and submit their bids. After a pre- announced date, the procurement agency proceeds with a detailed examination of the firms’ bids. When it comes to awarding contracts, an array of criteria come into play, encompassing references, quality, environmental considerations, and more. Among these, the pivotal criterion, especially in the field of road construction (and civil engineering in general), pertains to the offered price (or bid). The thing to notice is that in some markets, there exist traits conducive to cartel formation (Harrington, 2006) whereby firms conspire to raise prices (or lower the qual- ity of goods and services).
In the first two parts of our classroom game, participants take on the role of construction companies that can collude—or not. They can earn victory points as an analogy to the profits that firms obtain, both lawfully and illicitly. In the final part of the game, they take on the role of staff members within an antitrust authority applying machine learning algorithms in order to flag cartels. In this sequence, participants’ victory points are modified depending on their success in applying the relevant data-science techniques, drawing an analogy to the recognition and career opportunities for antitrust professionals. Depending on the requirement level of the course or training sequence, this can involve sophisticated approaches, such as training models and selecting algorithms, or more accessible options, including purely visual analysis.
The rest of our paper is organized as follows. In Section 2, we offer a concise summary of the relevant literature. In Section 3, we specify the classroom game by describing the setting and parameters, along with detailing the game mechanics. This includes the bidding and awarding procedure of the first two parts of the game and the cartel-flagging mechanism of the final part.
To support lecturers, we also provide an illustrative example on how to compute victory points. In Section 4, we discuss the implementation of the classroom game in different settings with an emphasis on skill requirements. We conclude in Section 5, and provide supporting teaching material in the Appendix.
Related Literature
Our proposed classroom game relates both to recent advances in cartel detection as well as game-based learning in economics.
As stated in the introduction, our game is situated within the evolving landscape of economists’ tasks, particularly the increasing integration of machine-learning techniques for detecting cartel behavior. The use of statistical methods to screen markets to detect patterns of a cartel was proposed, among others, by Porter and Zona (1993) and Harrington (2008). Following many machine-learning applications (see, e.g., Imhof & Wallimann, 2021; Harrington & Imhof, 2022; Huber & Imhof, 2019; Rodríguez et al., 2022; Silveira et al., 2022), we use behavioral screens as predictors in supervised models to detect collusive behavior: These are simple descriptive statistics that analyze data (such as price bids) for unusual or “suspicious” patterns, aiming to identify red flags. The application of machine-learning algorithms for this purpose has aroused the interest of economists in recent years (see, e.g., Varian, 2014; Athey & Imbens, 2019).
Cartel detection tools that do not rely on external sources (e.g., whistleblowers) are essential for competition authorities, as cartels continue to form despite a tremendous growth in cartel cases and convictions in the last decades (Harrington & Imhof, 2022). Some markets are par- ticularly prone to collusion because they exhibit traits that facilitate cartel formation. These market characteristics include, for instance, a small number of firms, and excess capacity (Harrington & Imhof, 2022). As discussed in more detail in Section 3.2, where the classroom game’s parameters are motivated, a limited number of competitors within a supplier’s sphere of action makes it easier to establish agreements. Conversely, excess capacity can create an incentive to “flood the market”, which undermines the stability of collusive agreements.
An industry where several cartel-supporting traits are present is the construction sector (Harrington, 2006), which serves as guiding example of the classroom game. That the construction sector is particularly susceptible to collusion, have been confirmed on several occasions (see, e.g., Bergman et al., 2020; Imhof et al., 2018; Ishii, 2014, for examples from Sweden, Switzerland, and Japan, respectively).
Cartel screening has a range of beneficiaries: By definition, it is relevant for competition authorities. An example is the application of screening methods in Switzerland, where the Swiss Competition Commission opened an investigation of road construction companies due to suspicious results (Imhof et al., 2018). In this case, the screening results were the only source of information, and there was no prior evidence of collusion. The conducted house searches in 2013 proved collusion and led to the conviction of the involved firms in 2016. However, screening methods are also relevant to companies using auction settings among their input suppliers. Recent applications include the use of these methods by the German railway company Deutsche Bahn (Beth & Gannon, 2022) and the Swiss Federal Railways (Wallimann & Sticher, 2023).
Game-based learning and classroom experiments are increasingly attracting attention in eco- nomics education (Holt, 1999; Picault, 2019; Platz, 2022). An example is the paper of Dobrescu et al. (2015), assessing and discussing a video game in a standard Microeconomics introductory undergraduate course. Another example is the Chair the Fed online simulation. This video game, developed by the Federal Reserve Bank of San Francisco and discussed by, e.g., Duzhak et al. (2021), teaches on the Fed’s dual-mandate goals of stable prices and low unemployment. As a non-digital example, Parrondo et al. (2021) present the board game Sustainable Sea, developed for educational purposes, wherein participants assume the roles of fishermen to learn about resource economics concepts asso- ciated with the sustainable management of fishing resources. A closely related study to our proposal is presented by Correa et al. (2016), which employs a role-play scenario to teach the strategic behavior of a cartel, with participants acting as member countries of the Organization of Petroleum Exporting Countries (OPEC). Additionally, Picault (2015) introduces a classroom experiment to assess strategic interactions and collusion among producers in a market.
Classroom Game
The classroom game is divided into three parts. Participants act as construction firms submitting bids to a procurement agency in the first two parts. In Part 1, they act as an oligopoly, with no coordination allowed. That is, they submit bids based on the known distribution of costs as well as on the known value of their own cost. In Part 2, this procedure is repeated, with the difference that explicit coordination among each other is now allowed. In Part 3, the participants switch sides and apply their data science and economics knowledge to flag conspiracies by taking on the role of employees of an antitrust authority. In the following, we will use the term ”firms” to denote participants in Parts 1 and 2 and ”employees” to refer to them in Part 3. Other roles of the classroom game, such as the procurement agencies and the antitrust authority’s board of directors, remain unallocated to participants. Instead, these roles adhere to the game’s rule set, overseen by the lecturer. Figure 1 illustrates the classroom game’s action. In Appendix A, we suggest a suitable groups allocations depending on the class size. Parts of the classroom game.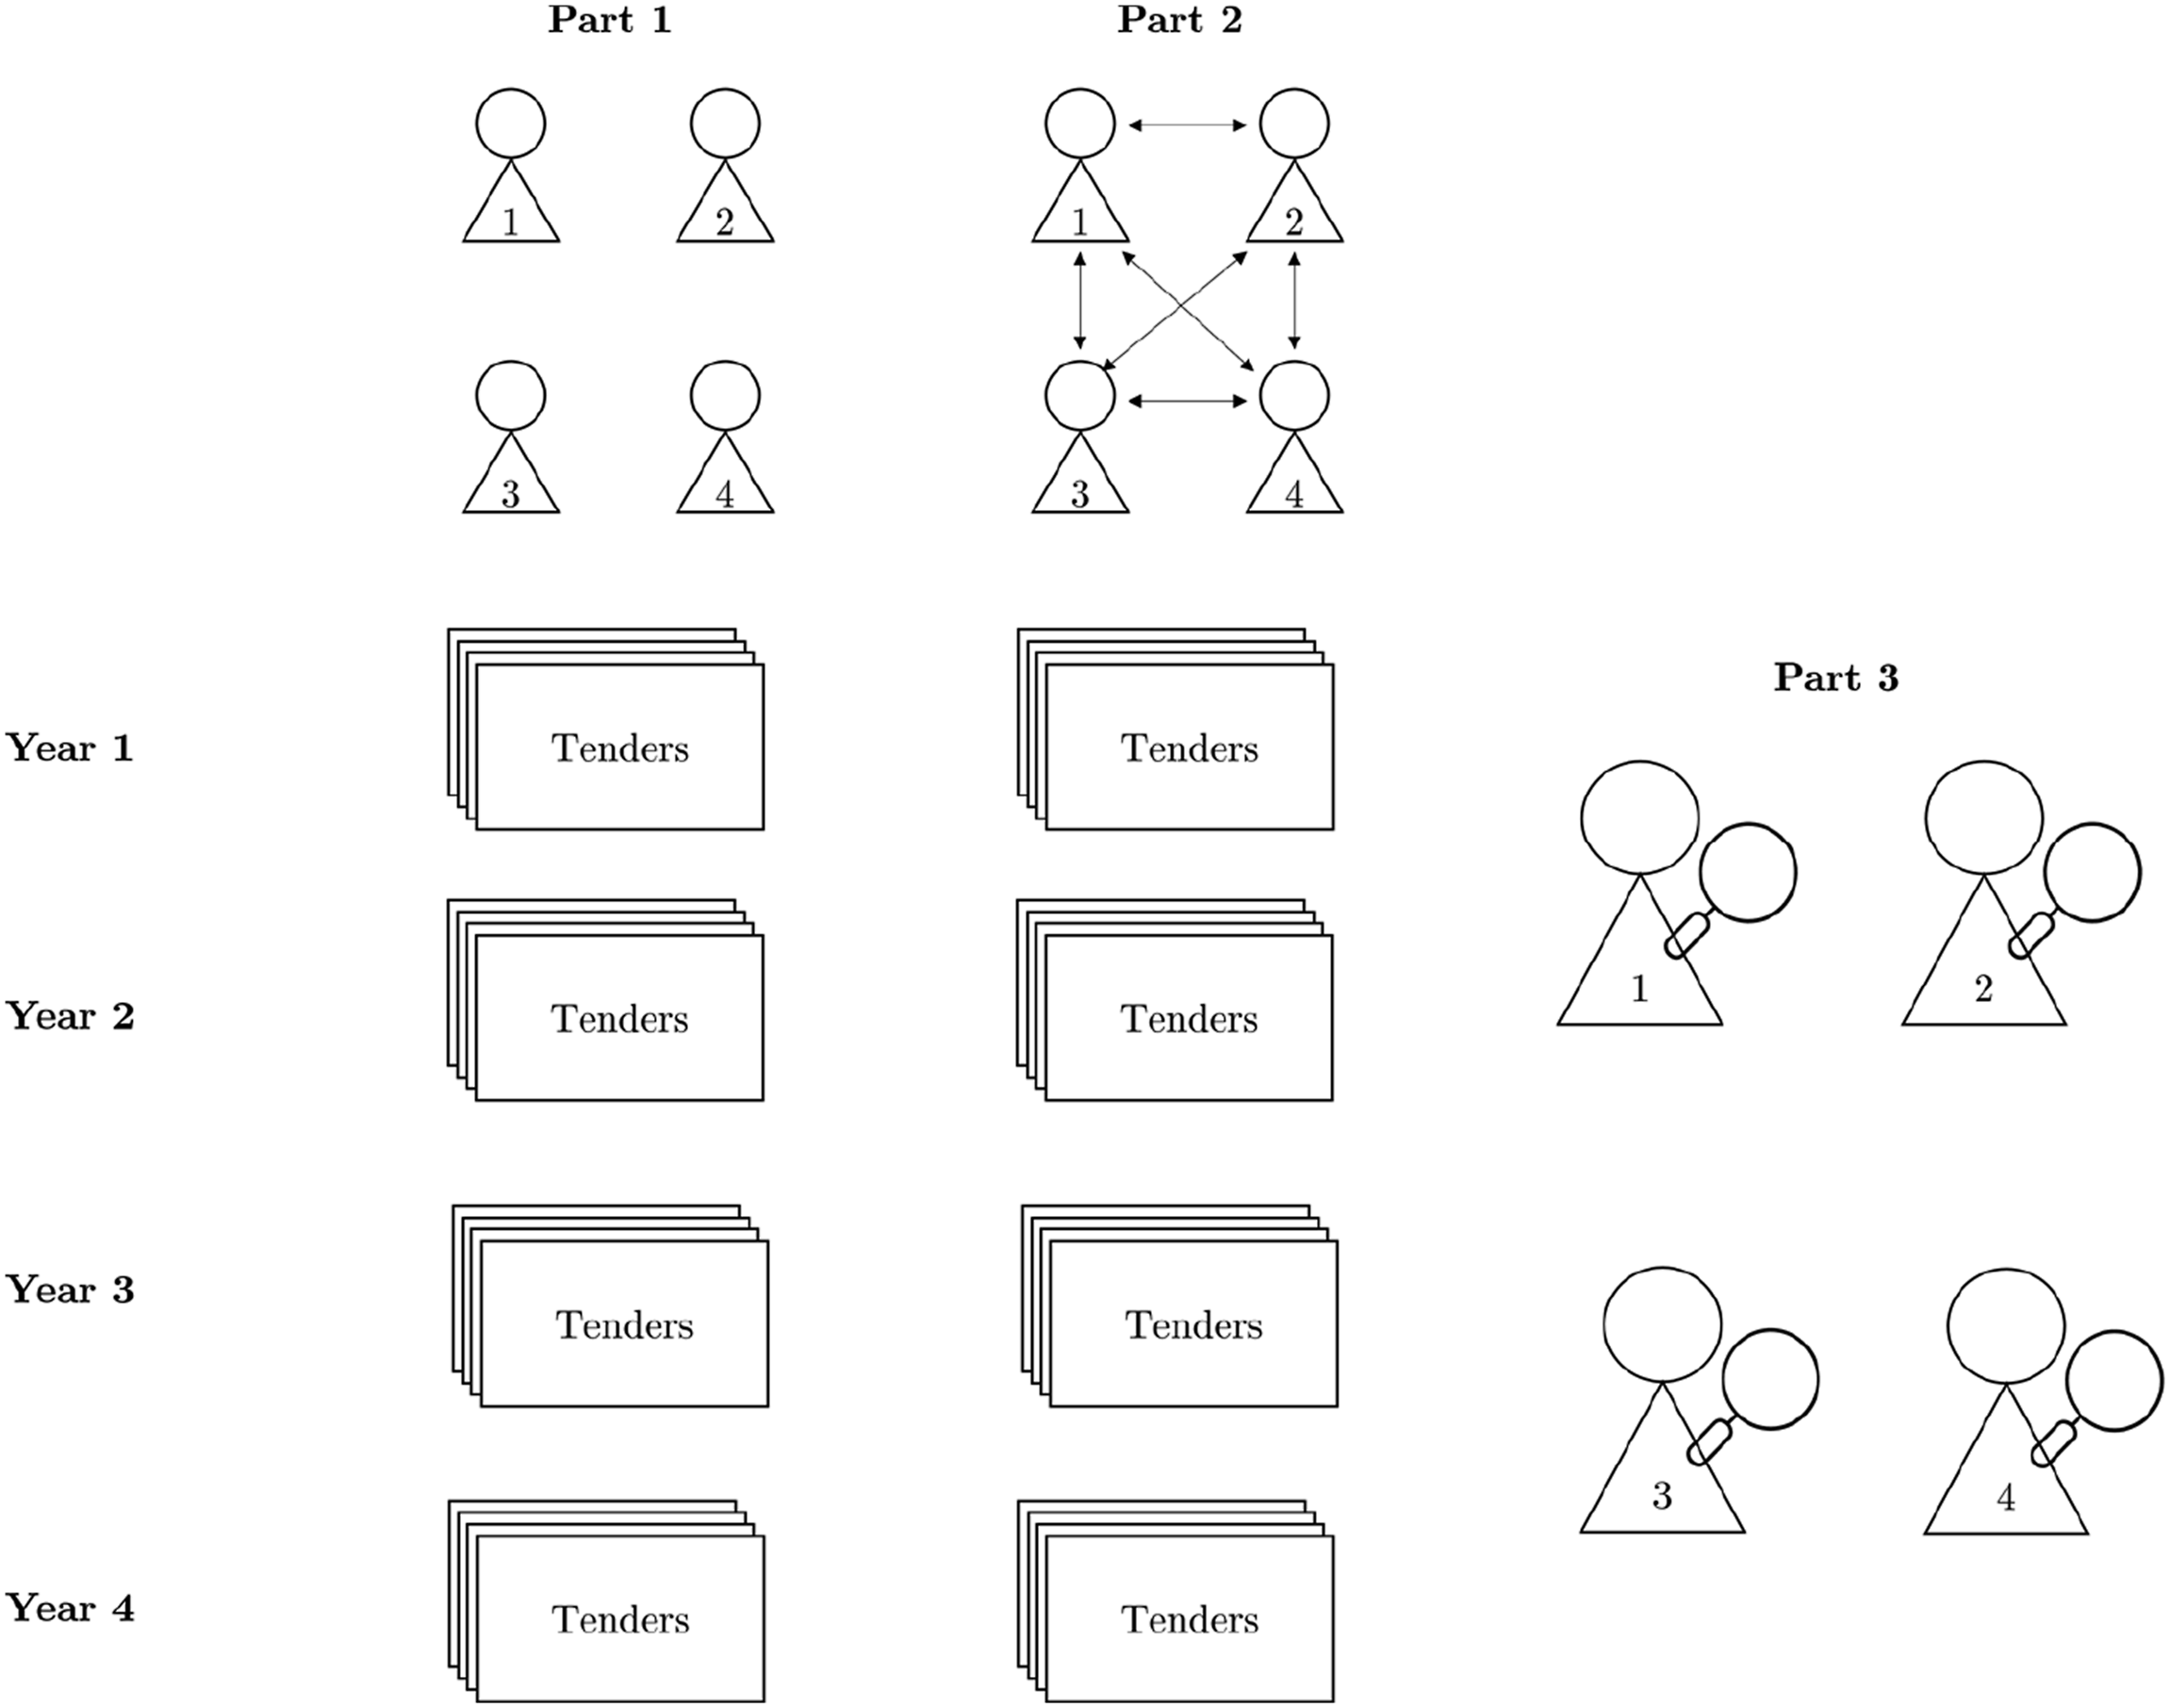
In the following, we first explain the setting in greater detail. Second, we show how firms calculate their costs for a single project (being relevant in Parts 1 and 2). Next, we explain the bidding and the awarding procedure of Parts 1 and 2. Fourth, we explain the machine learning application to screen for cartels in greater detail (Part 3). Finally, we present a concluding example.
Setting
Revisiting Figure 1, we observe that Parts 1 and 2 each contain four years, and each year contains four projects put to tender by a procurement agency. The mentioned procurement agency pertains to the fictional region of ”Tetravale” (see Figure 2). Each year, the project locations of the four tenders are ”North Village”, ”East Village”, ”South Village”, and ”West Village”. All participants are divided into groups of three or four—represented by the four game pieces in Figure 1. Accordingly, firms apply for all projects at every location. The fictional region of Tetravale.
Calculation of the Costs (Parts 1 and 2)
For each project, firms know their costs while bidding. The first cost component is ”fixed costs”, which range from 50 to 100. Fixed costs are different for each tender but the same for all firms. However, three superimposed factors also influence the firms’ costs.
The first factor is the geographical location of the firm. As the distance between a firm’s location and the place of the planned construction site increases, the firm’s cost also increases. This is because the location of a project impacts the logistics of construction work, such as the availability of materials, and transportation. Moreover, the companies need heavy machinery and are therefore limited in their radius of action (see, e.g., Wallimann & Sticher, 2023). Finally, location plays an important role for contract allocation among cartel members (see, e.g., Imhof, 2019). As an example of how this factor is implemented in the classroom game, consider the procurement of a construction site in North Village. East Village’s Firm 2 is located 5 km apart (cp. Figure 2). Accordingly, we assume that Firm 2’s cost to fulfill the contract in question increases by 5 percentage points of the fixed costs, as we record in Table
Cost Increase in Percent Relative to the fix Costs.
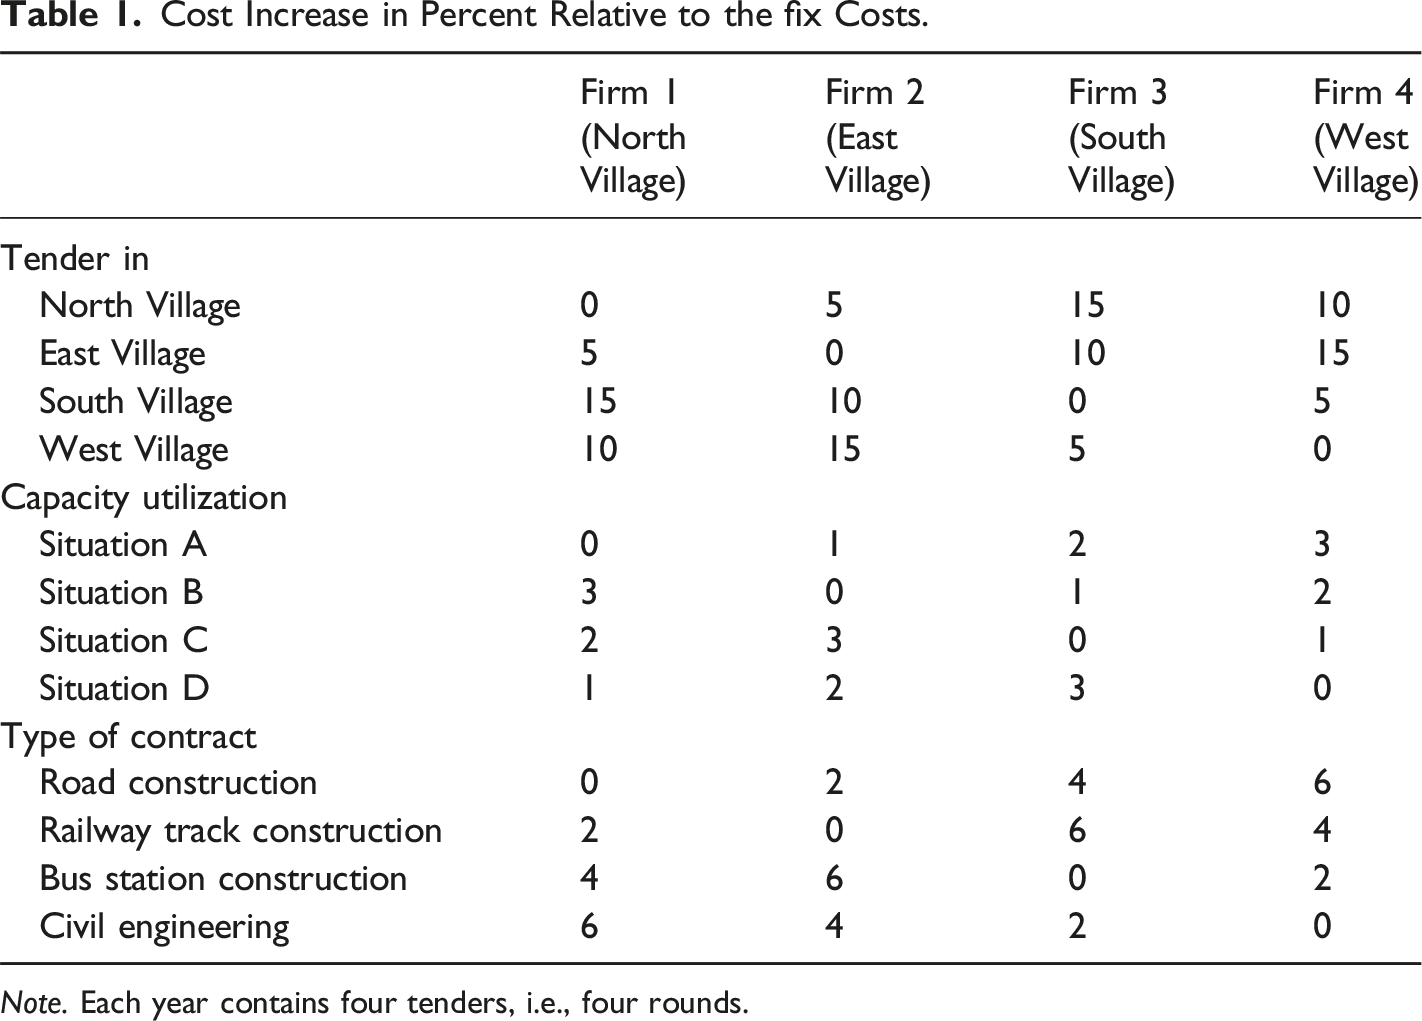
Note. Each year contains four tenders, i.e., four rounds.
The second cost-driving factor is capacity utilization, which can be influenced by factors such as projects from private clients. As demonstrated theoretically in the classical work of Edgeworth (1925) and empirically validated, for instance, by Porter and Zona (1993), job backlog and capacity can affect bids in public procurement significantly. With a low utilization rate— indicating excess capacity—competition becomes imperative, and a firm’s bids are lower than usual; conversely, when operating at full capacity, bids tend to be higher. Again, capacity is also a criterion playing a major role in allocating contracts within a cartel (see, e.g., Imhof, 2019), as firms may “expand the pie” by distributing contracts according to their comparative advantages. Within our classroom game, we simulate dynamic fluctuations in capacity utilization across rounds. Firms experiencing high capacity utilization, e.g., Firm 4 in Situation A (see Table 1), can only implement the project at increased costs. The rationale behind this is twofold. First, working at full capacity necessitates the temporary hiring of additional personnel, resulting in administrative obligations. Second, the cost increase can also be attributed to implicit expenses (opportunity costs). In certain scenarios, the assumption of a contract may lead to postponing potentially lucrative projects.
In reality, firms’ bidding behavior is influenced by many criteria. These encompass non- monetary elements such as the inclination to engage in projects with societal and environmental aspirations. Additionally, there may be long-term considerations, such as evaluating a project’s impact on the firm’s portfolio and reputation. Again, each cartel participant’s specialization also affects cartel contract allocation (see, e.g, Imhof, 2019). For simplicity, we distill these multi- faceted considerations into simple proxies in the shape of additional firm-specific cost increases. Consistent with existing literature (see, e.g., Wallimann et al., 2023), we assume comparatively small differentials in the firms’ evaluations of these factors. To illustrate this point in the classroom game, we introduce a third influencing factor. We assume the existence of four distinct project types: ”road construction”, ”railway track construction”, ”bus station construction”, and ”civil engineering”. Each firm is specialized or at least inclined towards the execution of a specific type. As exemplified by Table 1, when a road-construction project is put up for tender, the costs of Firms 1, 2, 3, and 4 experience increases of 0, 2, 4, and 6 percentage points, respectively, over their fixed costs.
To summarize, let us consider an example regarding Firm 1, situated in North Village: In Round 1, the procurement agency of West Village is tendering for the construction of new tracks (railway track construction), Firm 1’s capacity utilization is low (Situation A), and all firms’ fixed costs are 100. The costs of Firm 1 amount to 100 × (1 + 0.1 + 0+ 0.02) = 112. Next, in Round 2, the procurement agency of East Village puts a civil-engineering project to tender, Firm 1’s capacity utilization is higher (Situation C), and all firms’ fixed costs are 75. In this case, the costs of Firm 1 amount to 75 × (1 + 0.05 + 0.02+ 0.06) = 84.75 (see Table 1).
As implied by this example, the combination of a project’s location, a firm’s capacity utiliza- tion, and the type of the contract are introduced with an element of randomness. Throughout the progression of the four rounds, competitiveness is balanced across all participating firms (whether there are three or four firms associated with the tender, confer to Supplemental Table A1 in Appendix A). Note, however, that instances may arise where a firm’s competitive advantages or disadvan- tages concentrate within specific scenarios.
Bidding and Awarding Procedure (Parts 1 and 2)
Each year, the firms simultaneously receive tenders for four projects. They prepare and submit their bids, drawing upon their self-calculated cost structures as well as their expectations of competitors’ actions. Enabling a dynamic, albeit tacit, interaction, the firms receive information about the allocation of contracts, as detailed out below. This process repeats four times in both Part 1 and Part 2. In Part 1 of the classroom game, the participants are not allowed to communicate with each other, while in Part 2, they get an opportunity to talk to each other before bidding. However, they are advised to be careful when doing so: The digital trail they leave behind could raise red flags with the antitrust authority. Without going into specifics, the firms are informed that such circumstances could necessitate the reimbursement of profits derived from the implicated tender.
Following each year (encompassing each four tenders) in Parts 1 and 2, the procurement agencies allocate contracts to firms with the lowest bids and inform them accordingly. All participants are informed about the winner (player) but not the winner’s bid. Additionally, the winner is notified on the profit margin, computed as the difference between his or her cost and bid. This margin is directly translated to victory points. Firms that do not secure contracts receive zero victory points. Note that in the tenders of Part 2, the awarding of victory points is of a temporary nature, as detailed below. The point-assignment process applies across all 32 tenders within each group (four tenders per year and four years per part over the course of two parts).
Flagging Cartels (Part 3)
In the final part of the classroom game, participants take on the role of staff members within the antitrust authority tasked with overseeing Tetravale’s markets. They comprehensively evaluate the pooled tenders presented in Parts 1 and 2, scrutinizing them for potential cartel activities. Then, they advise their board of directors to decide which cases merit more in-depth investiga- tions. As we explain below, successful advice leads to recognition, later converted into victory points.
To clarify the awarding process, note that after the screening of tenders (which can be done as a homework assignment in more advanced classes or as an in-class activity in less detailed courses), each employee classifies each tender as either “suspicious” or “non-suspicious”. To do so, the antitrust authority arranges the tenders in a random way. As a result of the rearrangement of the tenders, employees can no longer (or, at least, hardly) recognize their own tenders from Parts 1 (actual value non-suspicious) and 2 (actual value suspicious). By applying code as provided in the example in Appendix C, the employees are then able to prepare a data set with every tender as an observation containing an ID variable and the screens as predictors in separate columns of the data set (this can also be done by the instructors and not the participants). Next, they can develop their machine-learning-based codes. To this end, following Wallimann and Sticher (2023), the antitrust authority provides the employees with data from the three cartels from Switzerland See-Gaster, Grisons, and Ticino, previously also introduced by Imhof et al. (2018) and Wallimann et al. (2023).
Based on this data, the participants estimate their models. Depending on their level of data- science knowledge, prepared code can be distributed or participants may the freedom to choose algorithms and code (see Section 4). In the baseline proposal of our classroom experiment, we suggest an analysis using ready-made ”behavioral screens”(see Section 2). Screens are descriptive statistics of bids describing bidders’ behavior in a tender. As predictors for our binary outcome variable—which takes on the value 1 when firms collude and the value 0 when they compete—, we use the coefficient of variation (CV), the spread (SPD), the difference between the two lowest bids (DIFFP), the relative distance (RD), and the normalized distance (NORMRD). For example, a low CV value is a red flag because it indicates that price bids are very similar, suggesting potential bid coordination among firms. We formally introduce the screens in Appendix B.
Applying such screens, participants should be enabled to capture distributional changes due to a cartel’s coordination of bids in the labeled data sets, meaning that it is known whether a cartel is active or not. Having developed their models, the participants then classify the (unlabeled) tenders of Parts 1 and 2 as suspicious (potential cartel) or non-suspicious (potential competition).
The incentives for the participants are as follows: In Part 3, no additional victory points can be accrued. Instead, the points obtained in Parts 1 and 2 are considered and modified to determine the winner over the course of the three parts. As members of the antitrust authority, the participants’ primary goal is to accurately classify as many tenders as possible. Therefore, to determine the winner of the competition, only participants in the top half of Part 3 are considered. Specifically, to be eligible to win, a participant’s ”correct-classification rate” (com- prising true-positive and true-negative classifications) must meet or surpass the median of the correct-classification rate of the class.
Furthermore, to address the significance of false-positive accusations, which the antitrust authority aims to minimize for reputational reasons (also in light of the heavy legal consequences of a firm being flagged as a potential cartel participant), each incorrect labeling of a ”suspicious tender” results in a 5% reduction of the a participant’s victory points.
Before this deduction takes place, it is important to note that the points awarded in Part 2 are provisional: Once at least 75% of the antitrust authority’s staff members classify a tender as suspicous, it is deemed ”unequivocal suspicious”. This initiates a more extensive investigation, including key-witness interviews and raids, to provide a vivid illustration. In cases where a tender was actually a cartel (i.e., a tender of Part 2), the victory points provisionally awarded in Part 2 are revoked.
Concluding Example
The classroom game concludes with the unveiling of the victory point progression. As an il- lustration, consider a scenario involving a class composed of twelve participants, leading to the formation of three groups, each comprising four firms. Focus on Participant A’s firm and its markups during the four years of competition and collusion, respectively: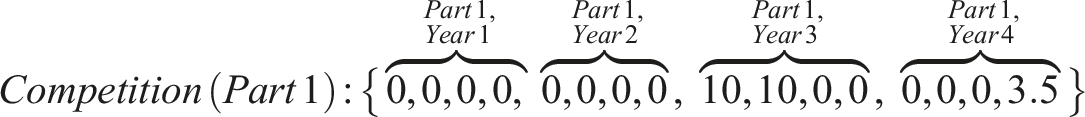
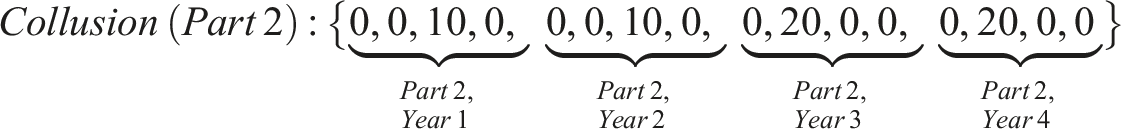
Switching sides in Part 3, all participants submit their lists of suspicious and non-suspicious tenders. The antitrust authority subsequently scrutinizes all tenders classified as suspicious by at least 75% of the participants. In this context, assume that all tenders within Years 3 and 4 of Participant A’s group fall within this category of unequivocal suspicious tenders. Consequently, A forfeits 40 of the 60 victory points gained in Part 2.
Before considering her performance as a staff member of the antitrust authority, A’s victory points total 23.5 + (60 − 40) = 43.5.
Now, assume that A also ranks among the top half of the class in terms of the correct- classification rate in Round 3. Furthermore, suppose that she mistakenly labels eight competitive tenders from Round 1 as suspicious. In this case, A remains eligible to win but experiences a 40% reduction of her victory points, corresponding to the eight incorrect classifications at 5% each.
In total, across Parts 1 to 3, Participant A accrues 43.5 × 60% = 26.1 victory points, posi- tioning her as a contender for the main prize, as predetermined by the lecturer. We recommend considering a symbolic prize, perhaps a luncheon voucher, to underscore the intrinsic motivation associated with winning the game.
Didactic Recommendations
The integration of machine-learning techniques will become increasingly important in social sci- ences in the future. The research on cartel screening serves as a typical example of this trend.
This shift in research methods presents challenges for both students and practitioners, as indi- viduals may excel in either economics or data science but less frequently in both. Our classroom game serves as an example of how social-science educators can incorporate the interdisciplinary nature of modern economics into the classroom without overstraining the participants’ capaci- ties. More generally, it demonstrates how key lessons from scientific articles can be taught in an application-oriented manner.
In the following, we summarize considerations for implementation, emphasizing different settings, participant compositions, and states of knowledge, respectively. Thereupon, we discuss our findings from an initial in-class realization. In the appendix, we provide further information on how teaching material can be used and supplemented.
Recommendations Based on Data-Science Knowledge
One challenge of embedding data science in (economics) lessons is the question of the partici- pants’ knowledge of data science and machine learning. We categorize participants with respect to their knowledge according to three groups: i. Participants with advanced data-science knowledge, ii. participants with basic data-science knowledge, iii. participants with no (or hardly any) data-science knowledge.
Participants from the advanced group can train models themselves using algorithms and statistical markers of their choice. In instances with even better trained participants, they could even apply unsupervised machine-learning algorithms (see, e.g., Silveira et al., 2023).
In the second case, i.e., when preexisting knowledge is limited to the basics, it is advisable to specify specific algorithm-training processes. As an example, the code in Appendix C demonstrates the application of the random-forest algorithm. The utilization of predefined code has the advantage that the analysis can be carried out in the classroom even when time is limited. However, this approach also has two disadvantages: First, the uncritical adoption of existing code contributes less to the understanding of the subject. Second, all participants will obtain identical results. (There are only deviations if participants use different ”random seeds”—or if they make mistakes). To alleviate these issues, participants can be encouraged to modify the critical value for the variable ”cartel probabilities” (variable ”threshold” in the code of Appendix C). This adjustment influences the random-forest algorithm’s classification of a bid, indicating the presence of a cartel. In doing so, participants who recognize that ”false positives” can have particularly severe consequences in the cartel-flagging process (see Subsection 3.4) have the op- portunity to distinguish themselves by classifying potentially collusive bids more conservatively. As this choice entails the risk of not achieving a sufficiently high ”correct-classification” rate, the additional degree of freedom introduces an engaging new tradeoff in addition to gaining a deeper understanding.
Finally, in the third case, i.e., when the group has little or no data-science knowledge, a practical approach involves visual or benchmark-based screening (see, e.g., Imhof, 2019). For instance, empirical evidence suggests that colluding firms often submit bids that are closely aligned (see, e.g., Imhof et al., 2018). While more advanced groups incorporate this insight by integrating the statistical markers into the algorithm’s training, the same pattern can be discerned through visual representations of bid distributions (utilizing scatterplots) in widely available statistical software like Microsoft Excel. Also when examining other markers introduced in Appendix B, conspicuous values can be identified visually: Low values of the coefficient of variation (CV) link to collusion. The spread (SPD) assumes high values when the lowest and highest bids diverge substantially. DIFFP represents the difference between the two lowest bids. The relative distance (RD) and normalized relative distance (NORMRD) scale the difference between the two lowest bids relative to the variation of the losing bids and the differences between any bids, respectively. In class, the lecturer can either present scientific evidence on these markers or engage students in a discussion about patterns that may raise suspicion. The subsequent classification within needs to necessarily involve graphical representations of the bid distribution. Participants could also classify tenders based solely on the numerical values of the bids.
Being best equipped to assess the proficiency of their classes themselves, lecturers have the flexibility to tailor our suggestions to meet the unique needs of the participants. Even in classes with advanced data-science knowledge, incorporating visual analysis may prove worthwhile. It not only acknowledges and rewards participants for their intuitive understanding of the subject, which may capture nuances in the bids distribution ”overlooked” by an algorithm. The possibility of overwriting machine-learning-based classifications also introduces greater heterogeneity in the cartel-flagging process, fostering additional game strategies and thereby adding excitement.
Be aware that introducing the setting, especially in Part 3, may be time-consuming. While Parts 1 and 2 of the game are intended for in-class play, Part 3 can be structured as homework assignments. This allows for a brief discussion of Part 3 during the following class (alongside awarding the winner). Furthermore, this assignment has the potential to enhance participants’ competence acquisition, given that the task can be completed at individual paces.
Insights from an Initial Implementation
In this section, we present the findings of an initial implementation in spring 2024 with ten students enrolled in a mobility-focused program at the Lucerne University of Applied Sciences and Arts, with one of the study’s authors serving as the instructor. About six hours of class time were dedicated to the game over the course of three weeks. The winner received a Swiss Federal Railways voucher worth 50 Swiss francs. The primary objective of this initial implementation was to establish a proof of concept, specifically to assess the compatibility between Parts 1 and 2 and Part 3. Moreover, it aimed to generate initial insights for future applications. Feedback from the students was gathered orally on an ongoing basis. Overall, when contacting the students a few months later, the majority of participants found the game enjoyable (response rate: 50%). When asked to rate their agreement with the statement „I enjoyed the game“ on a scale from 1 („strongly disagree“) to 5 („strongly agree“), the average rating was 4.6. When asked to rate the statement „The game has improved my understanding of data science in cartel screening“ using the same scale, the average rating was 4.2, demonstrating a good alignment with the goal of the classroom game.
An initial learning is that students require sufficient time to calculate the costs based on fixed costs, geographical location, capacity utilization, and type of contract. This primarily applies to the first tenders in Year 1 of Part 1. During these assessments, students must comprehend the concept of cost calculation. It is advisable to provide students with a printed copy of Table 1.
Descriptive Statistics of Initial Implementation in Spring 2024.
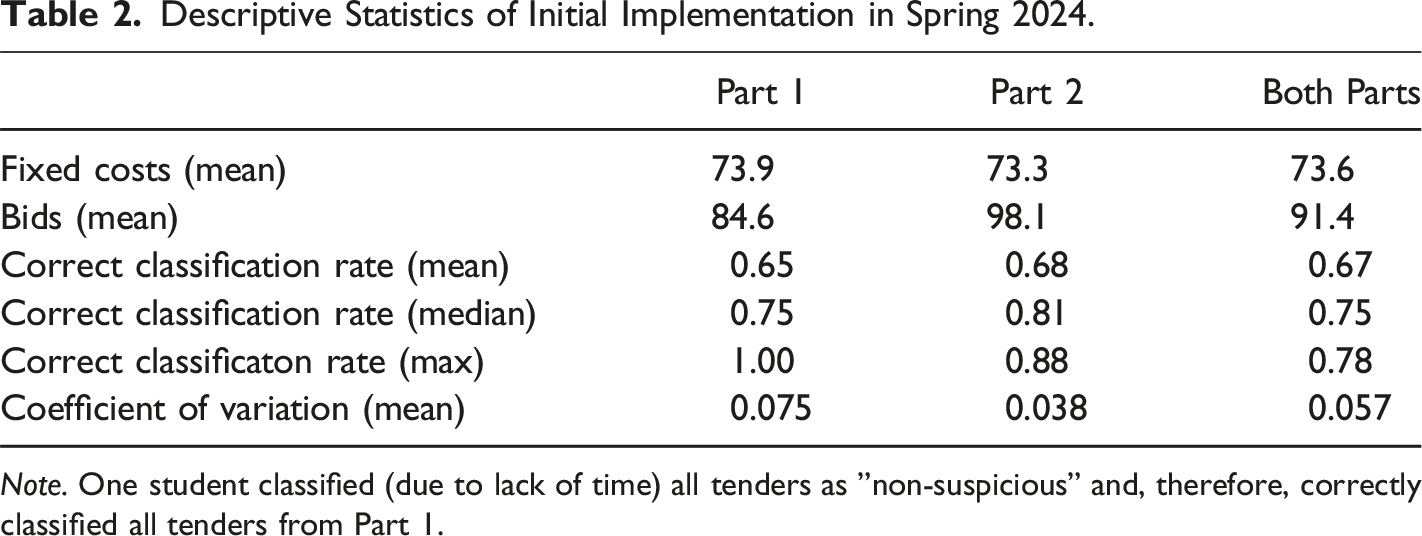
Note. One student classified (due to lack of time) all tenders as ”non-suspicious” and, therefore, correctly classified all tenders from Part 1.
Upon the availability of adequate classroom space, we recommend a restructuring of the classroom during Part 2 to reinforce the setting change for the students (i.e., employees of firms with the opportunity to collude their bids). Moreover, it is advisable to set time limits in Part 2, as some groups tend to discuss extensively, while others finish more quickly.
Note that the classroom game can be played with an interactive tool in the .xlsm format (Microsoft Excel documents with macros) provided alongside this paper (see Appendix D for some basic instructions). This tool facilitates participant and lecturer interactions and automates computations associated with ”non-playable characters”, such as procurement agencies and the antitrust authority. In the event that a firewall restricts the use of Microsoft Excel documents with macros simple Excel files could be processed (e.g.) via OneDrive using a R script for data preparation. We used the latter for the initial implementation. In Part 3, participants take on the role of employees of an antitrust authority and apply their data science knowledge. As the class had advanced data science knowledge, we provided labeled data of the Swiss cartel cases Ticino, Graubünden, and See Gaster (Wallimann & Sticher, 2023). The students had a free choice of algorithms or to use the benchmarking method by Imhof et al. (2018), also introduced in class. The suggested benchmarking method employs, among other things, the coefficient of variation, with thresholds derived from past cartel cases. As discussed in Section 3.4, values of the coefficient of variation below a pre-defined threshold indicate the presence of a cartel. Despite the straightforward applicability of the benchmarking method, all students applied various machine-learning techniques and submitted their classifications before a pre-announced deadline, enabling them to finish Part 3 as a homework assignment (except one, who was unable to finish the work and, therefore, classified all tenders as non-suspicious). On average, students correctly classified 67% of the tenders. The median of correct classifications amounted to 75% and the maximum to 78% (see Table 2). These high accuracy rates suggest that, for the most part, the screening worked as intended—as is expected, provided the mean coefficient of variation was indeed smaller in the “colluding” Part 2 (0.038) than in Part 1 (0.075).
The external validity of trained models based on historical data of cartel cases (also called generalizability), such as those of See-Gaster, Ticino, and Graubünden cartel cases presented above, can be compromised in markets affected by collusion due to potential differences, e.g., in bid distributions. However, in this initial implementation, the issue did not arise as the accuracy of correct predictions nearly reached 80%, suggesting that external validity was maintained.
Note that even a simple benchmarking or visual approach (e.g., the approach presented by Imhof et al., 2018) could have worked using the data generated in Parts 1 and 2, as, the average coefficient of variation was distinctively lower in Part 2 than in Part 1 (see Table 2), see Section 4.1. In summary, the proof of concept shows the efficacy of the classroom game’s design, i.e., that Part 1 and Part 2 (economics) are compatible with Part 3 (data science).
A final observation is that the class’s advanced knowledge in data science knowledge, students strongly focused on training the models to optimize out-of-sample predictions. In our initial application, students independently applied and coded (inter alia) the Random Forest classifier, AdaBoost, and KNeighborsClassifier. On the other hand, the role of false-positive classifications does not seem to have been a major consideration, as both the mean and the median of the correct-classification rates have been higher in Part 2 than in Part 1 (see Table 2).
Conclusion
In this study, we showcased how game-based learning can be deployed to address the challenges arising from the multidisciplinary nature of modern economics. To do so, we presented a class- room game that integrates economic theory with the application of machine learning. The first two parts involve participants acting as firms in an oligopoly, submitting bids for construction projects. Communication is restricted in Part 1 and enabled in Part 2. In the third part, partic- ipants assume the role of employees in a competition authority, pursuing the goal of detecting illegal collusion in bid patterns. The classroom game’s design, breaking it into three parts and combining it with theoretical inputs, addresses concerns about potential short-lived engagement raised by critics of classroom games. This approach supports the contribution of the learn- ing objectives in that participants remain motivated throughout the entire learning experience. Moreover, a focus of our paper lies within Section 4, where we provide educational suggestions inter alia for groups with different data science knowledge. Moreover, in the Appendix, we added teaching material tailored to the classroom game.
Our classroom game serves as a practical and engaging approach to address the evolving landscape of cartel detection in the context of economics and data-science education. Through the three parts of our game, participants not only gain insights into the dynamics of collusion in markets, illustrated by the construction sector, but also develop skills in utilizing data-science techniques for cartel detection by examining bid data for suspicious patterns. As the use of machine learning in cartel screening becomes increasingly prominent in industrial organization—both in academics and in the professional world—our classroom game provides a platform for students and practitioners to acquire relevant skills in this evolving field. Incorporating this classroom game into (multidisciplinary) economics education can contribute to preparing the next generation of professionals to be better equipped to address the challenges posed by cartels in the era of big data.
Supplemental Material
Supplemental Material - How to Use Data Science in Economics – A Classroom Game Based on Cartel Detection
Supplemental Material for How to Use Data Science in Economics – A Classroom Game Based on Cartel Detection by Hannes Wallimann and Silvio Sticher in Simulation & Gaming
Supplemental Material
Supplemental Material - How to Use Data Science in Economics – A Classroom Game Based on Cartel Detection
Supplemental Material for How to Use Data Science in Economics – A Classroom Game Based on Cartel Detection by Hannes Wallimann and Silvio Sticher in Simulation & Gaming
Footnotes
Declaration of Conflicting Interests
The author(s) declared no potential conflicts of interest with respect to the research, authorship, and/or publication of this article.
Funding
The author(s) disclosed receipt of the following financial support for the research, authorship, and/or publication of this article: This work was supported by the swissuniversities, P-11 Doppeltes Kompetenzprofil.
Supplemental Material
Supplemental material for this article is available online.
Author Biographies
References
Supplementary Material
Please find the following supplemental material available below.
For Open Access articles published under a Creative Commons License, all supplemental material carries the same license as the article it is associated with.
For non-Open Access articles published, all supplemental material carries a non-exclusive license, and permission requests for re-use of supplemental material or any part of supplemental material shall be sent directly to the copyright owner as specified in the copyright notice associated with the article.