
Abstract
Background. The amount of
Method. We build agent-based models in NETLOGO to simulate the outcomes of different Battle Royale formats.
Results. Our results consistently forwarded that outcomes from Battle Royale are only weakly aligned with actual player skills.
Conclusion. Our findings suggest that many forms of Battle Royale involve substantially more
The structure of Battle Royale combat is as simple as it is popular. Since the times of gladiator fights in the Roman Colosseum the rules simply state: Everybody enters but only one leaves the arena. Nowadays, Battle Royale games experience huge popularity again (Choi & Kim, 2018) either in the form of videogames (e.g., FORTNITE; PUBG) or on the cinema screen (e.g., the ‘HUNGER GAMES’ series, and ‘BATTLE ROYALE’ which contributed the name to the popular video game genre). The survivor of the everybody-against-everybody combat is crowned the winner, admired by the masses, and often rewarded generously (e.g., with their freedom in ancient Rome). While losers in modern Battle Royale might not have to fear for their lives anymore, stakes remain high. The prize pool of a single FORTNITE tournament recently reached a hundred million dollars (Pommerenke, 2019; vastly exceeding traditional sports or other e-sport championships), and winners can expect fame and lucrative business opportunities. Amateur players can also compete for money in Battle Royale video game tournaments. FORTNITE tournaments, for instance, are hosted regularly on https://gamebattles.majorleaguegaming.com/, with rule sets differing between competitions. On this platform, a popular setup is placing competitors, who paid money to enter a tournament, in a fully public match (i.e., including players who are unaware of the tournament) and the competitor who survives the everyone-vs-everyone gun fights the longest (or performs better on a tournament specific metric) wins. In 2018, Tyler Belvins (‘Ninja’), earned close to 10 million dollars by streaming his FORTNITE games online (Cuthbertson, 2019). Given that Battle Royale is commonly seen as a tournament mode to find the most skillful competitor and given the historically high stakes involved, we set out to test how reliable different forms of Battle Royale games are. That is to say, how much do the final results reflect the skills of the participants and how likely is the most skillful competitor to survive? Although Battle Royale video games are already extremely popular in tournaments, their e-sport scene is still in its infancy: In 2018, the lead director of PUBG, one of the most successful Battle Royale games and fifth best-selling video game ever (50 million copies; Tassi, 2018), admitted not to be e-sports-ready yet and announced a five-year roadmap to further develop (Jones, 2018). The need for such a development phase reflects our general question about Battle Royale’s ability to accurately rank competitors of different skill levels.
The Reliability of Different Tournament Modes
Within sports sciences, researchers have long been interested in the question: How does the structure of a competition affect the predictability of the results? McGarry and Schutz (1997) conducted a widely cited simulation study, investigating which tournament mode ranks competitors in a way that is most representative of their skill level. They found that the most accurate player rankings are produced by round-robin tournaments, in which all players face each other at some point during the competition. Many sports and e-sports tournaments therefore follow this ‘league play’ format. However, various other modes exist, such as Knockout (K.O.) modes in which defeated players are eliminated from further competition. Through computer simulations, the authors found that final rankings obtained in a K.O. system are more strongly affected by chance than round-robin tournaments. Ryvkin and Ortmann (2008) replicated these findings, and additionally observed that ‘contests’ (i.e., every competitor is judged on a single performance) can be even less reliable than K.O. modes. In order to satisfy both a high result reliability and stay within reasonable time constraints, many real tournaments employ modifications and mixed designs, such as an incomplete league play followed by multiple K.O. rounds. Many of these modes have been investigated through simulations in regard to their predictability (e.g., Clarke & Dyte, 2000; Koning & McHale, 2012; Marchand, 2002). Here, we add another, very popular form of tournament to the literature: the Battle Royale, in which players encounter and battle each other in no predetermined order.
The cited studies examining different tournament modes usually investigate how closely tournament results are aligned with the participants’ actual abilities (we call this relationship ‘result reliability’). This phenomenon can be quantified in different ways (Scarf et al., 2009). The most straightforward metric to assess result reliability is to quantify the relative frequency with which the best player wins a tournament in repeated simulations. A higher relative win frequency of the best player is interpreted as a higher result reliability, and a relative frequency of 100% would make the tournament win a perfectly diagnostic event. However, this metric evidently prioritizes a single player over the whole field of competitors, whose rankings do not affect the reliability score. To obtain a metric that also considers whether less successful competitors are ranked correctly, researchers frequently employ rank correlation coefficients, most prominently a spearman correlation, which quantifies how strongly the skill ranking of players is in line with their result ranking. If there is a perfect (positive) monotone relationship between skills and placings (i.e., each player places higher than all weaker competitors and lower than all stronger competitors) the spearman correlation has a value of 1. A perfectly negative relationship would entail a score of -1 (implying that the best player always finishes last and the worst always wins). If there is no association between both rankings (e.g., when tournament results are fully determined by chance) the spearman correlation coefficient becomes 0. Naturally, higher values ascribe higher result reliability to tournament modes. Other metrics (most notably Kappa; e.g., McGarry & Schutz, 1997) and extensions (e.g., likelihood of specific players to advance to a certain point in a tournament; Koning et al., 2003) are also informative but were not used in our studies below.
The Current Study
Here we set out to test how reliable results from Battle Royale games are and which factors affect the reliability of Battle Royale games. Importantly, we acknowledge that Battle Royale is attracting many casual players (Choi & Kim, 2018), who might perceive a low reliability (i.e., a strong involvement of situational luck) as less bad than competitive players would. In fact, we agree with Ahn (2017) that a certain degree of uncertainty while playing the game elicits a thrill that is partly responsible for attracting masses of casual players. Still, we wanted to investigate how much uncertainty is actually at play in Battle Royale games and which game features affect the level of uncertainty.
The method we chose for simulating a variety of different Battle Royale games is agent-based modeling (for introductions see e.g., Bonabeau, 2002; Yilmaz et al., 2006). This method is specifically suited to simulate group-level phenomena (here: the reliability of tournament rankings) which emerge from individual level interactions (here: individual combats between players). Further, this method is well suited to investigate how macro level factors (e.g., features of the game) affect individual-level interactions, which in turn result in the group-level outcome of interest. Thus, it matched well with our targeted research objective. Ethics approval was given by the ERB of the first author’s institution.
Method
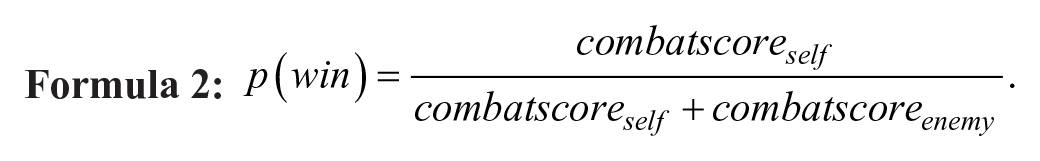
There are many different forms of Battle Royales with diverse features. Ancient gladiator games share only very broad characteristics with current Battle Royale video games. As game features are very likely to affect result reliabilities, it is not possible to forward a single quantification of result reliability for Battle Royale games. Rather, we simulated various formats of Battle Royale games, ranging from very basic to more feature-rich versions. Thus, the purpose of the simulation model was to investigate the spread of results across different formats of Battle Royal games, and test how different features affect the games’ result reliability. To implement the agent-based models we used NETLOGO (Wilensky, 1999), a language specifically developed for agent-based modeling. Individual agents in our model represented individual competitors in the Battle Royale. Each competitor had a general skill score (scaled between 0 and 1) which described how good they are at playing the game. This skill score can also be interpreted as a linear combination of specific skill facets (e.g., speed and strength), but below we only worked with the aggregate score for simplicity. In every format of the game, agents had at least two capabilities: moving and fighting. Each game spans a sequence of time units. In each time unit, agents could consider to move and fight competitors that appear in their reach. When two agents met, they fought, and one of them died. Similar to real life, agent behaviors were actually never occurring in the exact same time. Two independent fights could never end at the exact same time, as this would prevent a relative ranking of the eliminated parties as undertaken in actual tournaments. Thus, we ensured that fights occurring in different parts of the arena ended one after the other in random order. The probability of winning a fight wasdetermined by:
For each played game format, we computed Spearman rank correlations (ranging from -1 to 1) between final tournament ranking and actual skill ranking. Additionally, we report the relative frequency with which the most skillful player actually ended up winning/surviving the competition. We ran each simulation 10,000 times (random seeds 1 to 10,000) to generate estimates of the average and spread of results for each Battle Royale format. All described effects are statistically significant (given the N of 10,000 per simulation) and so we focus on reporting effect sizes. In the last subsection, we report how many repeated games would need to be played of a certain format to find the most skillful competitor most of the time.
Methods of Analysis
For ease of reading, we generated and report results in three stages:
Basic survival: We simulated result reliabilities of the simplest form of Battle Royale games: A restricted arena in which competitors encounter and kill each other in a non-determined order until one player is left. Here, we also contemplated different skill distributions among the competitors.
Shrinking arena: We extended the simple structure of Stage 1 by introducing a very common feature of Battle Royale video games: A slow shrinking of the combat arena, which forces participants to fight each other (Ahn, 2017). We implemented this feature by restricting the arena’s radius by 0.5 distance units every other time that all competitors had the chance to move and fight. For reference, competitors can move up to 3 distance units in this time frame, thereby easily outpacing the shrinking arena. Another basic feature examined at this stage was the number of competitors and its effect on result reliability.
Advanced features: We introduced more advanced features, which affect players’ chances to win individual combats. First, we implemented a diverse landscape, which can be exploited by skillful players to increase their chances of survival. Second, we varied the importance of exploiting the environment over pure combat skill, as in some formats combat skill is much more important (e.g., gladiator fights in the Colosseum), whereas in other formats the terrain plays a substantial role (e.g., Hunger games in the jungle). Third, we introduced resources that can be accumulated and skillfully utilized. The effect of these resources is that they add to players’ battle skill score, which is used to compute the probabilities of winning fights. Each player starts with the same resources but can obtain additional resources from their competitors by defeating them in combat. Importantly, resources can also be negative (i.e. detract from battle skill scores) as players can obtain injuries or material damage from fights. Fourth, we implemented varying degrees of advantage for stationary over moving players. The reasons are that stationary players are familiar with the surroundings, that approaching players can be heard and therefore noticed ahead of time, and that stationary players have the opportunity to set up defenses or establish an advantageous combat position.
Notice that this set of features can be extended to be more closely in line with specific video games or other Battle Royale formats. This can be done with relative ease and only few lines of code in the interactive web version of our Battle Royale simulator from which the annotated source code can also be downloaded. The simulator can support replication attempts and boundary checks of our results (c.f., Seagren, 2015) and is accessible here: https://bit.ly/2kiXucw.
Results
We present the results from the three stages in order of increasing complexity. All data and scripts can be retrieved from https://osf.io/enz6g/.
Stage 1: Basic Survival
We let 100 competitors roam an isolated, rectangular area (e.g., island) while randomly encountering and fighting each other. In this format, the survival ranking is only marginally representative of the participants’ skill ranking. Table 1 shows the reliability coefficients under different skill distributions among the players.
Reliability of Combat Results in Reference to Actual Player Skills.
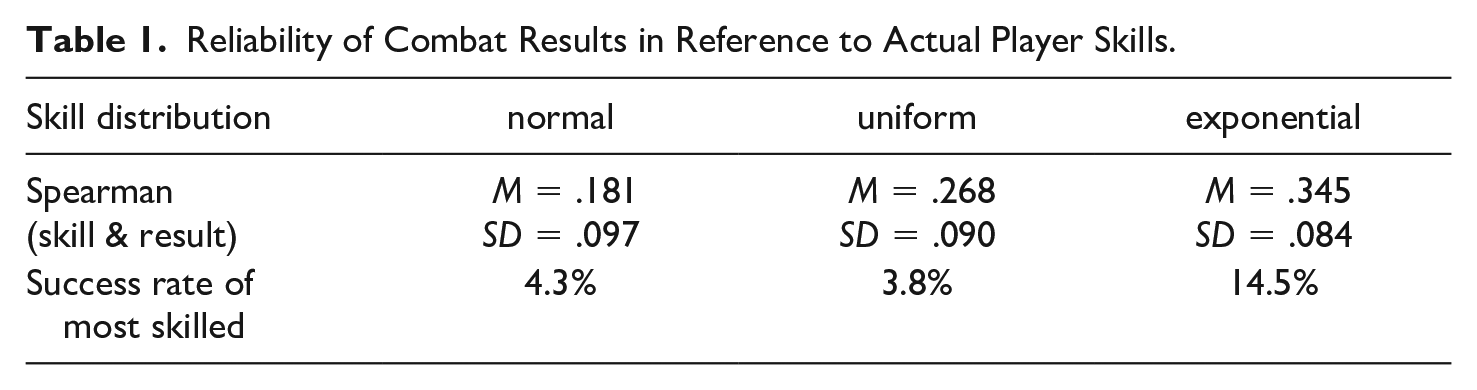
It is obvious that an exponential distribution of skills among the players led to the most reliable outcomes. An exponential distribution of skill means here that there were many players with a skill level that is substantially lower than that of a dominating elite. In other words, there was a small group of players with relatively very high skill. The reason why this distribution led to a higher winning probability for the most skilled competitor is intuitive: The best player was likely an outlier in the distribution and only few competitors posed a danger in individual combats. Thus, long periods of survival were likely. The success rate of these outliers (14.5%) are closely in line with the success rate of top-performing PUBG players (≈15%; PUBG, 2019). We did not anticipate the finding that the spearman correlation between skill and placing is also higher when skills are distributed exponentially. After examining the data, we found that the lower skilled players were responsible for the high spearman correlations under exponential skill distributions. When skill is distributed exponentially, there are many players with a relative skill score close to zero and over the first rounds of the game these players die, thus reliably occupying the lower ranks. Accordingly, when removing the 50% least skilled players, exponential skill distribution does no longer entail higher spearman correlation than other skill distributions, but remains more reliable in terms of the most skillful player winning with relatively high frequency (see supplemental materials). Naturally, exponential skill distributions might not occur very often in real Battle Royale competitions, but these results do align with niche scenarios such as professional players dominating games when they join casual players.
Stage 2: Shrinking Arena
We extended the upper analyses by letting the size of the arena shrink continuously, which forces players to encounter and fight each other. The immediate and intuitive consequence was that the battles were over much faster than in Stage 1. A snapshot from a single battle simulated in NETLOGO is provided in Figure 1.
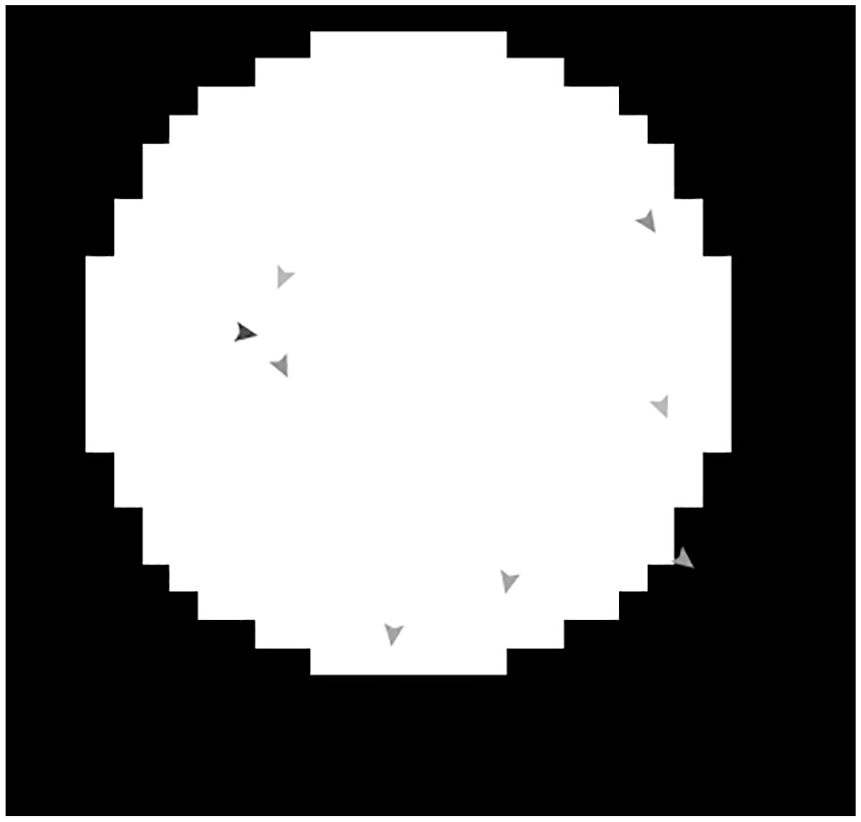
Battle between 8 remaining players of different skill levels. The black square defines the original arena, while the shrinking white circle forces players towards each other.
Additionally, we investigated how a smaller number of players (10) and a larger number of players (1000) affect the result reliability. The outcomes are depicted in Figure 2.
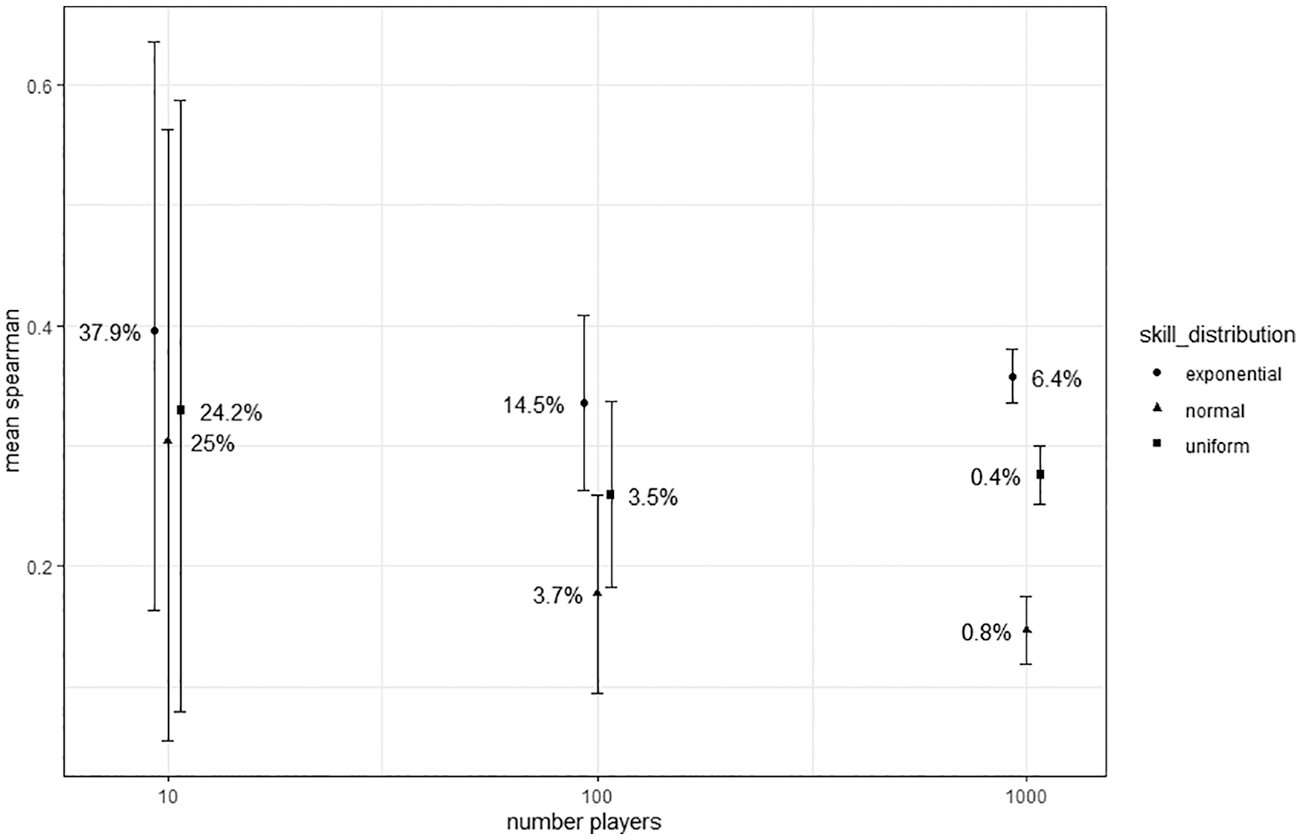
Each point/symbol represents a different version of the Battle Royale game characterized by the number of players and the distribution of their skills. The percentage labels indicate how frequently the most skilled player survived. The whiskers reach from the 20th percentile value to the 80th percentile value for the spearman correlation accumulated across the 10,000 iterations. Standard errors are smaller than the radius of the points.
The results for the success probability of the best player are intuitive: The chance of the most skillful player to survive were substantially larger when the field of competitors was relatively small. Similarly, spearman correlations were larger with smaller numbers of competitors, which can be explained by larger differences in skill between competitors with adjacent skill ranks.
Stage 3: Advanced Features
So far, the outcome of the simulated Battle Royale games was only marginally representative of players’ actual skill ranking. However, in the simulations above, players’ skill only affected how likely they were to win individual combats. In most forms of Battle Royale games players can heighten their chance of survival by other means such as strategic positioning or resource management. Thus, in this final form of the simulation model we introduced four advanced features mentioned above. Details of these implementations are as follows:
1. Terrain: The simulated battle advantages inherent to specific positions within the arena ranged from zero to one and were randomly set alongside players’ initial position at the start of each game. This local advantage score was integrated into the formula that computes each player’s probability of winning fights against their encounters (see point below).
2. Importance of combat skill over terrain: While in some Battle Royales (e.g., Colosseum or wrestling) positioning in the given terrain is less important than pure combat skill (e.g., physical power or speed) other Battle Royales (e.g., FORTNITE, PUBG) are strongly determined by strategic use of the environment. Thus, local advantage scores had to be integrated into the formula of winning individual combats depending on the importance of terrain. We thus implemented two variables: importanceskill and importanceterrain, which took on values between zero and one adding up to one. These variables were multiplied with a player’s skill and their current position’s advantage score respectively, and both products were added up. The result functions as a player’s combat score and the player’s chance of winning a battle is computed as
Naturally, skillful players could be more likely to maneuver to advantageous positions, especially if they are familiar with the environment. Thus, we also varied whether players find the best position in their environment depending on their skill. More precisely, in formats where skill did not affect positioning, players followed a random trajectory through the arena. In simulations in which skill did affect positioning, players’ probability to find the most advantageous position in their environment was set by their skill level (i.e., if a player has a skill value of 0.9, there was a 90% chance at every step that this player maneuvers to, or stays at, the best surrounding position instead of a random one).
3. Resources: During most Battle Royale games, participants utilize resources to gain advantages in combats. Typically, these could be weapons, armor, or even medical equipment. We introduced positive as well as negative resources (e.g., injuries) that could be obtained from combats. Positive resources added to players’ skill score (up to a new skill score of one), whereas negative resources subtracted from a player’s skill score (down to a minimum of zero). It is reasonable to assume that skillful players are more effective in obtaining resources (e.g., using loot to build armor) and preventing negative resources (e.g., injuries). Thus, we also varied whether skill affected resource management. When skill did not affect resource management, the obtained resources were of random sign and size. When skill was set to affect resource management, the probability of obtaining positive as opposed to negative resources was equal to the player’s skill (cf. skill affecting positioning).
4. Movement penalty: In many Battle Royales, a player that enters an area in which another player is situated is at a disadvantage in the confrontation. Naturally, the size of this disadvantage varies across different forms of Battle Royale and some in some cases there might not be any movement penalty at all (e.g., increased momentum or surprising nature of incoming players). Thus, we also varied this parameter across simulations. In mathematical terms, the combat score of the moving player (see Formula 2) is multiplied with a penalty term (1 = no penalty, 0 = no chance of winning).
By varying the factors described above, we obtained 96 different versions (i.e., design points; Lorscheid et al., 2012) of a Battle Royale game (each simulated 10,000 times). In Table 2, we classify the varying factors as independent variables (of primary interest) and control variables (of secondary interest) to provide guidance for this section.
Features of Different Battle Royale Games.
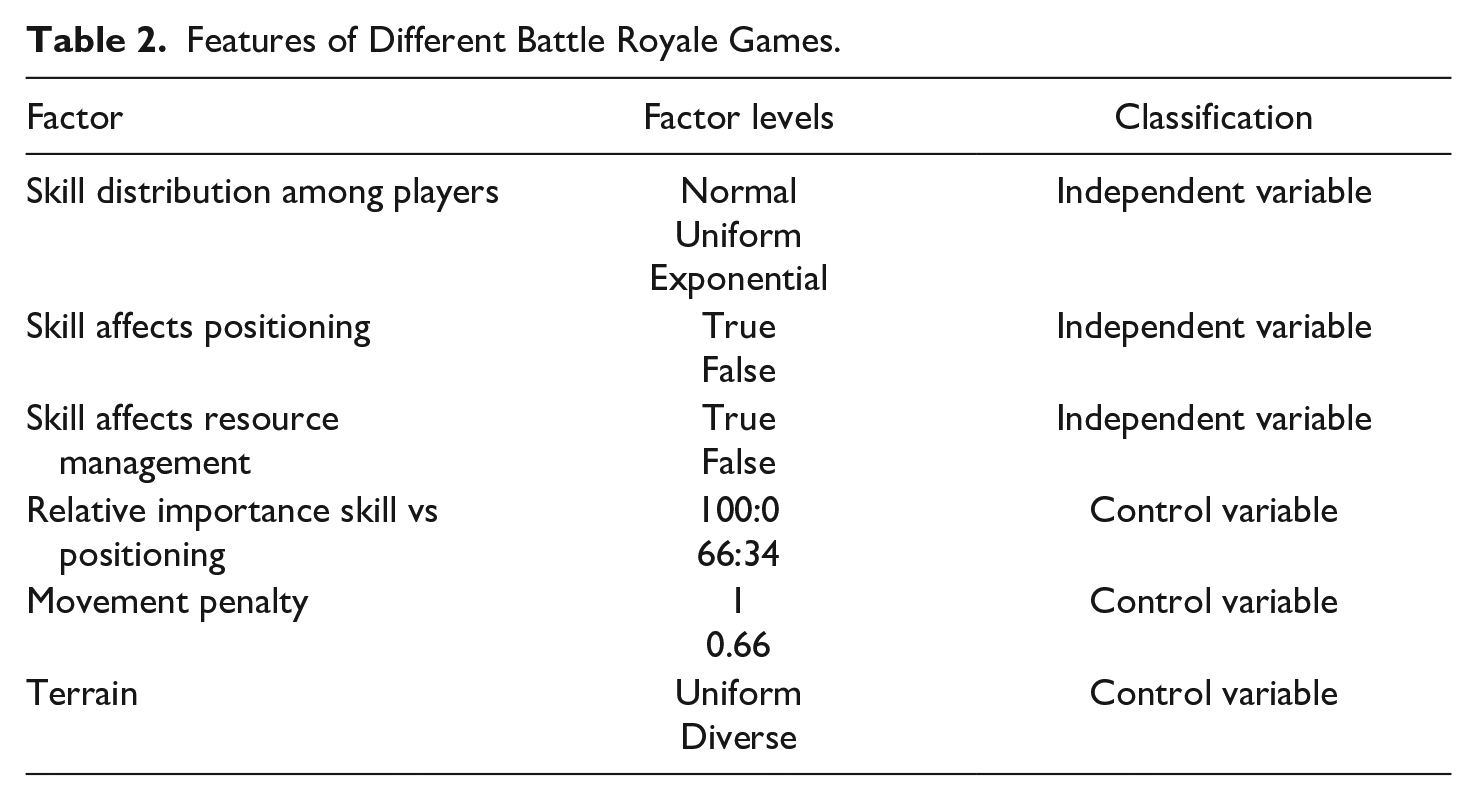
For all formats, we implemented a shrinking arena (as it is very common in most Battle Royale video games) and set the number of competitors to 100 (as this number is used in the most popular games including FORTNITE, CALL OF DUTY BLACKOUT, and PUBG). The rest of this section is structured around the independent variables (see Table 2) by consecutively describing their effect on the game’s result reliability. Where noteworthy, we add brief descriptions of interaction effects with the control variables. All results for the 96 factor combinations are included in the supplemental materials.
In Figure 3, readers can see the spread in reliability across all 96 versions and specifically the effect of exponential skill distributions that was observed in stage 1.
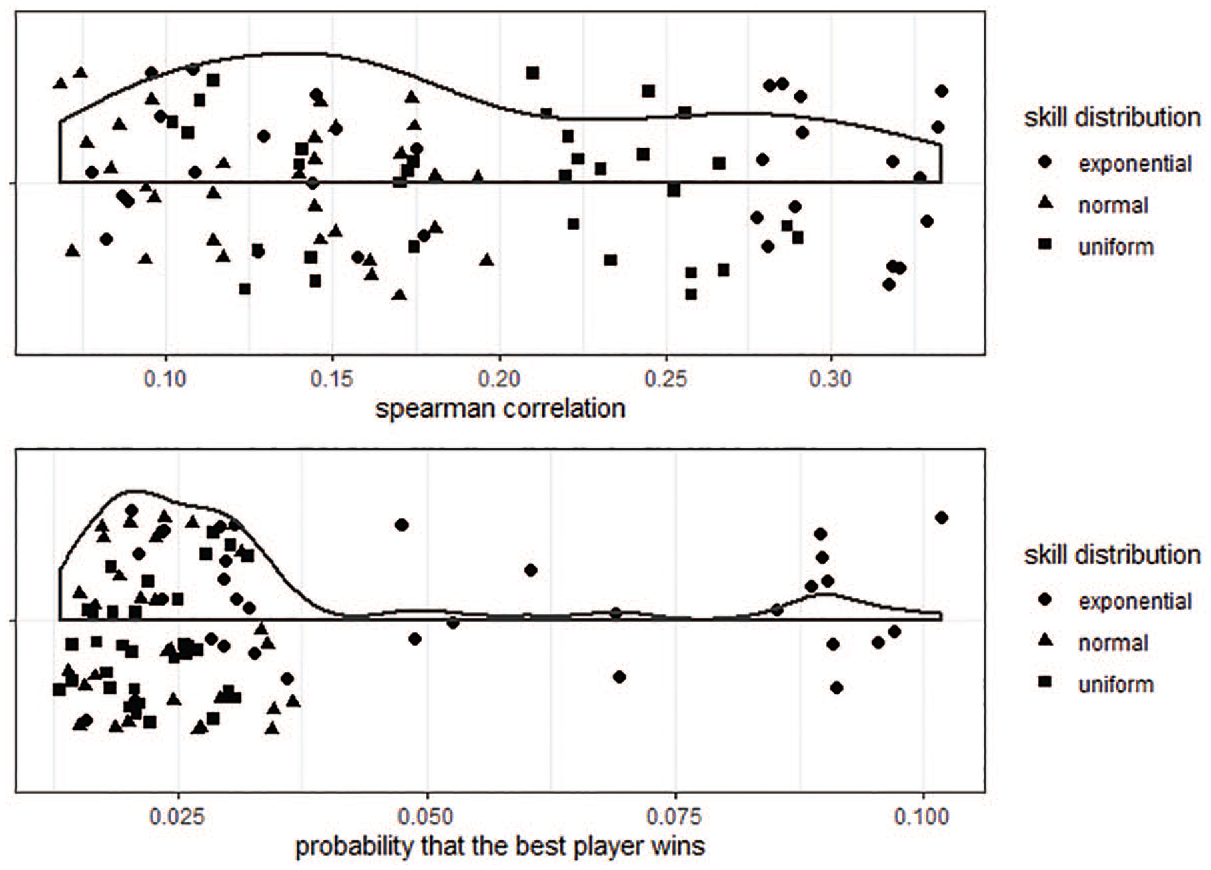
Result reliability of all Battle Royale versions that emerge from different combinations of game features.
Overall, the range of reliabilities was similar to the ones obtained in the simpler Battle Royale simulations in Stage 1 and Stage 2. As before, the most influential factor appeared to be the distribution of skills among the competitors. The most accurate tournament outcomes were obtained with an exponential distribution of skills (i.e., when a few players clearly dominated the field). In less reliable game versions (for instance when skill only contributed 66% to the combat score and players’ current positioning contributed the remaining 34%), skill distributions mattered less and uniform skill entailed marginally higher reliabilities than exponential distributions. Next to the aforementioned spread of skill among the participants, it was important whether positioning was affected by players’ skill level (e.g., previous knowledge of the terrain). When skillful players were relatively good at navigating their surroundings, the outcome reliability was relatively high. In the same way, when skill contributed to the amassing of resources (e.g., obtaining beneficial resources from opponents), outcome reliability was relatively high (see Figure 4).
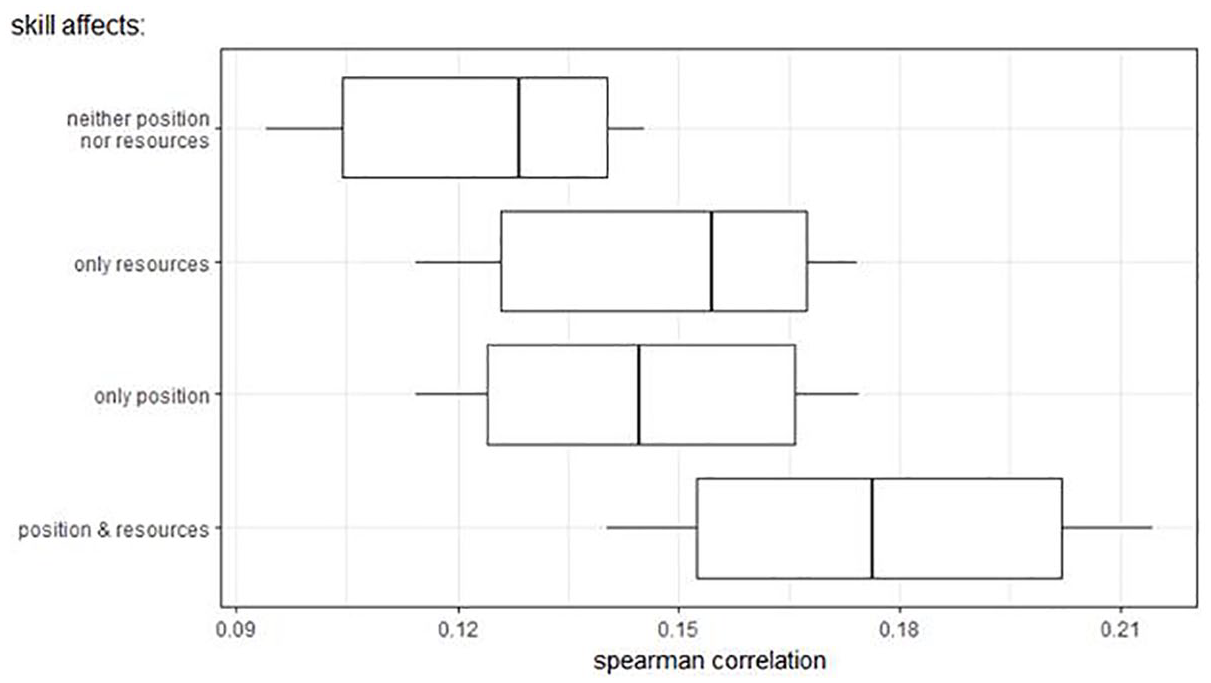
Being able to exploit game features through skill affects result reliability.
This does not imply that the mere introduction of new features increases the outcome reliability per se. For instance, the beneficial effect of skillful movement is slightly more pronounced, first, in a diverse terrain, and second, when positioning directly contributes to players’ combat scores. Further, the net effect of advanced features, like a diverse terrain, on ranking reliabilities depends on how much more effectively skillful players can exploit these features in comparison to their opponents. This is apparent in a comparison between the results of stage 1 and stage 3. The very simple Battle Royale format from stage 1 led to equally high result reliabilities as the most optimal combination of advanced features in stage 3. Still, it is not impossible to heighten result reliability through advanced features. For instance, when skillful players did not just find, but also utilized advantageous battlefield positions better, and when skillful players were able to mitigate the disadvantages of running into stationary players (e.g., through increased awareness), result reliabilities reached marginally higher maxima. However, even after the introduction of these additional skill multipliers into the formula for combat scores, the result reliability was only 0.013 higher than in the most optimistic simulation in Stage 1 (i.e., a jump from .345 to .358).
Repeating Games
While the most dramatic of Battle Royales are only fought once (repetition is impossible because all but one competitor perished), modern video game tournaments often repeat individual Battle Royales and aggregate the outcomes to determine the final winner. This procedure naturally enhances the result reliability, which grows asymptotically towards perfect reliability as the number of repetitions grows towards infinity. In this section, we produced some first estimates about the required number of repetitions for finding the most skillful player with high certainty.
We repeated Battle Royale games, but unlike in the simulations above, the same competitors reentered the competition on each iteration. We kept repeating the competition until the most skilled player had the best overall result. The best overall result is computed by averaging the ranks of the played games.
For the most optimistic scenario described above, we had to repeat the game 12 times to correctly identify the most skilled player 50% of the time and 163 times to correctly identify them 90% of the time. For the basic 100-player Stage 2 scenario with normally distributed skill, we needed to repeat the game 79 times to find the most skilled player 50% of the time and more than 500 times (simulation end) to find them 90% of the time.
Conclusions
We set out to simulate how strongly the results of Battle Royale contests are in line with the skills of the competitors. Both simple models and more complex models suggested that results are only weakly aligned with player skills. That is, there is a high degree of outcome uncertainty in a Battle Royale. When comparing our findings for the Battle Royale tournament format to similar simulations of other tournament modes, it is apparent that even our highest estimates for result reliability lie substantially lower. For instance, results from work on robin-round competitions consistently led to higher spearman correlations (e.g., two to three times higher than our highest estimates: Mendonca & Raghavachari, 2000), as do simulations of mixed-design tournaments (e.g., one to two and a half times higher than our highest estimates: Scarf et al., 2009).
When enriching the current simulations with elements commonly found in Battle Royales such as variation in terrain, movement, and resources, we again observed relatively low reliabilities (never exceeding r = .4). We also observed that the inclusion of additional elements (e.g., enhanced movement through a diverse terrain) can heighten the reliability of results, if players can exploit them to a degree strongly determined by their skill. While introducing more features to our simulations could still heighten the observed reliabilities, we showed that even under very optimistic assumptions, Battle Royale remains far more steered by luck than traditional tournament modes. In short, the examined Battle Royale formats give first evidence to the public claim that the popular tournament mode is mostly a game of luck (e.g., Pommerenke, 2019).
Future research may be done to find ways of increasing fairness and reducing the amount of luck in the game by taking inspirations from other e-sports games. For instance, in MOBA (multiplayer online battle arena) games such as League of Legends, teams of players are positioned at opposite ends of nearly symmetric and meticulously balanced maps 1 where the outcome of a game is not affected by random positioning or randomly distributed loot over the terrain. This would also increase the importance of the players’ knowledge of the map and allow for detailed strategizing. However, such measures will generally not address a core random factor inherent to the Battle Royale genre: The fact that achieving a single good outcome rank is often much easier for one player compared to another due to encountering less or weaker players. This is likely the reason it proved very difficult in our simulations to substantially heighten tournaments’ outcome reliability through advanced game features. Conversely, the simple step of repeating games and aggregating outcomes for a final score greatly enhanced result reliability and actual tournament organizers already started utilizing this strategy. Further, tournament organizers started experimenting with more complex scoring metrics that no longer only reflect players’ period of survival, but also factor in their success in individual combats. Such a remodeling of tournament characteristics (rather than game characteristics), might be a pathway towards more reliable player rankings, and poses an interesting avenue for future research.
We again want to mention that a high involvement of luck is typically regarded as a negative thing in competitive sport or e-sports tournaments. However, a high level of short-term uncertainty as in, for instance, Poker games, offers increased excitement, which in turn fosters players’ motivation to keep playing (Wood et al., 2007; Zaman et al., 2014). Thus, there is no universal optimum for result uncertainty/reliability in terms of popularity or quality of entertainment and our results should not be seen as a criticism of the Battle Royale genre, but rather as a characterization. It is likely that the Battle Royale genre will succeed to establish itself in the e-sports scene long-term, due to its enormous popularity. On the streaming platform Twitch, FORTNITE matches alone amassed over 2 billion hours of watch-time in the last two years (Yosilewitz, 2019), possibly creating a niche for itself in gaming, where the line between raw entertainment and e-sports competition is blurred.
We hope that game developers can use our simulation tool to test hypotheses about the effect of introducing new game features (cf., Grüne-Yanoff, 2011). The model settings that we applied can be extended to be more closely in line with specific games and models can be empirically validated with gaming data from online Battle Royale games, which is unfortunately sparsely available to the public. To conclude, quantifying result uncertainty in Battle Royale games and experimentally optimizing it for either casual or competitive consumers is a challenging goal, but computer simulations can guide both analysts and game developers towards better understanding and design.
Software Notes
We utilized NETLOGO version 6.1.0 (Wilensky, 1999) for the game simulations and RSTUDIO R-version 3.5.0 (RStudio Team, 2015) for the analyses. More specifically, we used the R packages ‘data.table’ (Dowle, 2019), ‘dplyr’ (Wickham et al., 2018), and ‘ggplot2’ (Wickham et al., 2019).
Footnotes
Authors’ Note
Chuck Norris is a martial arts fighter and actor. He is often portrayed as a virtually unbeatablecompetitor.
Declaration of Conflicting Interests
The authors declared no potential conflicts of interest with respect to the research, authorship, and/or publication of this article.
Funding
The authors received no financial support for the research, authorship, and/or publication of this article.
Notes
Author Biographies
Contact:
Contact:
Contact: