
Abstract
This study investigated participatory roles in high-performing (HPG) and low-performing (LPG) groups in collaborative learning, and how groups encountered challenges and regulated their learning. Participants, pre- and in-service teachers, (n = 30) in groups of three were videotaped for analysing socially shared regulation of learning (SSRL). Social network analysis (SNA) was used for the analysis. The results showed that in both HPG groups and LPG groups, one group member remained peripheral. SNA revealed that HPG members engaged in more diverse interactions than LPG members. The study has theoretical and methodological implications for research on socially shared regulation of learning.
Keywords
Introduction
In recent decades, collaborative learning approaches have been widely used in different educational systems around the world. Learning to collaborate is considered an essential skill for success in the twenty-first century (Ferreira et al., 2024; Häkkinen et al., 2017). Research on collaborative learning has shown that successful collaborative learning is a multifaceted phenomenon that includes interaction processes that embed sociocognitive, socioemotional and motivational elements at the core of collaboration (Borge et al., 2018; Ludvigsen, 2016). Despite instructionally well-designed collaborative settings, collaborative learning poses a range of challenges (Järvelä et al., 2008; Järvenoja et al., 2019; Näykki et al., 2014; Ucan & Webb, 2015). Research has shown that, in general, students may experience sociocognitive challenges in terms of their task understanding (Li et al., 2023); socioemotional challenges, such as negative emotional experiences (i.e. frustration, anxiety and annoyance) (Huang et al., 2024; Rojas et al., 2022); and motivational challenges, such as lack of interest and self-efficacy to work as a group (Melzner et al., 2020; Zhang & Liu, 2019). Therefore, to succeed in collaborative learning by resolving the challenges, research emphasises that learners should purposefully engage in socially shared regulation of learning (SSRL), defined as initiating joint efforts to regulate sociocognitive, socioemotional and motivational learning at the individual and group levels (Hadwin et al., 2018; Järvelä & Hadwin, 2013). This is important for group members to be able to stay on task even when facing different types of challenges.
Collaborative learning relies on group members’ interactions in learning. For instance, learners in successful groups think aloud; provide explanations or build, rectify and challenge the previous contributions of others; create group awareness; and coordinate joint efforts to regulate their collaborative learning processes (Rojas et al., 2022; Schnaubert & Bodemer, 2022; Zhang et al., 2021). This study focuses particularly on collaborative learning in virtual simulations. Although virtual simulation environments offer affordances to support collaborative learning (Zheng et al., 2018), benefits such as user interactivity and group members’ participation are difficult to fully optimize due to a range of challenges (Tang et al., 2023; Zheng et al., 2018). Chang et al. (2017) contended that there is still uncertainty about the nature of the challenges experienced and how learners optimise their collaborative learning processes to counter these challenges when engaging as a group in virtual simulation environments. Therefore, studies have recommended that collaborative group members actively interact by explaining their developing understanding and communicating to set their shared goals, negotiate various perspectives and develop shared mental models about the given joint task (Hadwin et al., 2018; Jeong & Hmelo-Silver, 2016; Saqr et al., 2020). Moreover, learners also need to optimise and regulate their interactions and share responsibility for the common product of their collaborative work (Jeong & Hmelo-Silver, 2016).
Research has shown that learners in groups often experience dissatisfaction when there is unequal participation, unfair organisation of group members’ responsibilities, ineffective inter-subject interaction or an incohesive learning environment (Aggarwal & O’Brien, 2008; Capdeferro & Romero, 2012; Le et al., 2018; Peñarroja et al., 2017). For example, in some studies, learners’ self-reports highlighted that they expected all group members to contribute equally to joint tasks because unequal participation was perceived as unfair (Capdeferro & Romero, 2012; Freeman & Greenacre, 2011; Price et al., 2006). Dissatisfaction causes less space for group interaction that may benefit knowledge co-construction, collaborative coordination, regulation of learning and social cohesiveness (Strauß & Rummel, 2021). Moreover, it may also lead to the emergence of less equal participatory roles (i.e. active, less active or peripheral; Strijbos & De Laat, 2010). In such a situation, social responsibility, reciprocity of group interaction and group equity are challenged (Strauß & Rummel, 2021). As a consequence, those group members who position themselves as peripheral may also reduce their effort, meaning that they participate less in the collaboration. Challenges may emerge if those group members, in both active and less active roles, do not initiate inclusive behaviour towards the peripheral group members. In such a collaborative learning environment, learners may drop out of the group or the entire study course (Levy, 2007), and even more challenges may be confronted in terms of sociocognitive, socioemotional and motivational challenges (Channa et al., 2023; Järvelä et al., 2008; Järvenoja et al., 2019; Kreijns et al., 2013; Näykki et al., 2014; Näykki et al., 2021). Therefore, to gain insights into group learning mechanisms that support collaborative learning processes, it is essential to investigate participatory roles (i.e. active, less active and peripheral) in relation to the different types of challenges and the socially shared regulation of learning in collaborative learning settings.
Theoretical Framework
Collaborative Learning
Collaborative learning is conceptualised in this study through the theoretical framework of the sociocognitive approach, which emphasises meaningful interactions among group members and technological tools/environments (Garrison et al., 2001; Woo & Reeves, 2007). The interactive nature of collaborative learning reflects how learners build on, rectify and challenge the previous contributions of other group members to clarify ideas for moving forward with the task (Weinberger & Fischer, 2006). It also shows how learners negotiate to build knowledge as a whole group and internalise that knowledge as individual learners (Kreijns et al., 2013).
In collaborative learning, the development of a joint understanding of a task involves articulating and sharing ideas through interaction (Stahl, 2004). In addition, interaction also establishes coordination and regulation processes, which are considered key factors to success in collaborative learning (Strauß & Rummel, 2021). For instance, Kwon et al. (2014) found that successful collaborative groups began coordination at an early stage of their group task, constantly maintained socioemotional interactions and regulated their collaborative learning processes effectively. Therefore, group members need to interact with each other to coordinate their joint efforts to establish a sense of community, regulate their learning processes and construct knowledge by contributing equally to their shared task.
However, the literature on collaborative learning shows that learners’ unequal participatory behaviours tend to pose challenges with regard to group cohesiveness (Aggarwal & O’Brien, 2008; Peñarroja et al., 2017; Strauß & Rummel, 2021) and task progress. In collaborative learning situations, when group members interact and share ideas, research has shown that the participatory roles of group members emerge without ‘interference by the teacher or researcher’ (Strijbos & De Laat, 2010, p. 496). These roles have been defined on the basis of participation, interactions with group members and contributions to the joint learning task (Strijbos & De Laat, 2010).
When participatory roles emerge in collaborative learning, they provide opportunities for researchers to analyse collaboration processes (Marcos-García et al., 2015). The analysis of these roles provides insights into how learners engage, lead or mediate in the collaborative space. Earlier research defined different participatory roles based on the participative behaviours of group members (Knowlton, 2005). For instance, the participatory roles that may take place during collaborative learning include leader, active member (Jahnke, 2010; Wenger, 2002), central actor (Aviv et al., 2019), coordinator (Daradoumis et al., 2006), animator (Lee, 2000), peripheral member (Daradoumis et al., 2006), peripheral participant (Wortham, 1999), less active member (Jahnke, 2010), missing member (Bento et al., 2005), outsider (Wenger, 2002), and peripheral actor (Daradoumis et al., 2006). Drawing on these earlier studies, the participatory roles in this study are defined as (a) active (i.e. leaders), which refers to members who actively interact with other group members and also aim to engage peripheral ones (Jahnke, 2010; Wenger, 2002); (b) less active (i.e. moderators), which refers to members who typically interact less with other group members (De Wever et al., 2010); and (c) peripheral (i.e. disconnected), which refers to members who seldom interact with other group members and make negligible contributions to the joint learning task (Cocciolo et al., 2007; Daradoumis et al., 2006; Strijbos & Weinberger, 2010).
Socially Shared Regulation of Learning in Collaborative Learning
Theoretically, socially shared regulation of learning (SSRL) posits that learners should purposefully initiate sharing of their prior knowledge, beliefs and understanding of the group task and its content to take strategic control of, monitor and evaluate individual as well as collective learning processes in terms of cognition, emotion, motivation and behaviour (Järvelä & Hadwin, 2013; Järvelä et al., 2015). SSRL takes place at the individual and group levels. Prior to sharing knowledge and beliefs, each group member first develops their own understanding of the task. This individual reflection enables the group to plan and negotiate strategies to regulate their learning (Hadwin & Oshige, 2011; Järvelä et al., 2019).
Achieving success in collaborative learning necessitates that learners have the critical skills to regulate various aspects of learning processes at the individual and group levels. In terms of the sociocognitive aspects of learning, learners need to negotiate, develop and apply strategies while establishing joint task perception (Näykki et al., 2017). Regarding socioemotional regulation, learners need to monitor and direct their emotional experiences and responses to optimise their learning processes to attain their shared learning objectives (Järvenoja & Järvelä, 2009). For instance, if a group faces challenges while executing the task, members may feel frustration or stress. By recognizing these emotions and regulating them through re-appraising (Näykki et al., 2014), creating group awareness and encouragement (Järvenoja et al., 2019), and seeking support (Järvenoja & Järvelä, 2009), they can maintain engagement in the task, resolve conflicts and continue collaboration to attain their joint learning objectives, thereby optimizing the overall learning processes. In terms of motivational regulation, learners need to offer support to their group members, appreciate each other’s contributions to the task, demonstrate interest and employ strategies to enhance their joint learning as a group while minimising off-task interactions (Järvelä & Järvenoja, 2011; Melzner et al., 2020; Ucan & Webb, 2015).
The theoretical framework of SSRL asserts that in high-performing groups, learners engage in and execute regulatory processes that include planning, monitoring and controlling their joint learning while promoting understanding and constructing mutual harmony (Järvelä & Hadwin, 2013). For example, planning serves to negotiate strategies for advancing the task, build a shared understanding of the task and articulate joint learning goals (Hadwin et al., 2018; Panadero et al., 2013). Moreover, monitoring enables learners to check the group’s progress and performance to meet the goals and standards of the task, thereby ensuring shared understanding (Haataja et al., 2022; Kempler-Rogat & Linnenbrink-Garcia, 2011). Controlling involves strategically managing the thought process and taking actions to guide and optimise group learning processes to achieve joint learning goals (Järvelä & Hadwin, 2013).
High- and Low-Performing Groups in Collaborative Learning
Research has shown that, according to the learning tasks and context of collaborative learning, collaborative groups’ responses and actions vary (Khosa & Volet, 2014; Zheng et al., 2019). For instance, the regulatory patterns of learners in face-to-face computer-supported collaborative learning (Channa et al., 2023) vary from those of learners who collaborate in asynchronous collaborative learning settings (Zhang et al., 2021). In addition, pedagogical approaches employed in collaborative learning settings also influence the regulatory behaviour of learners (Hadwin et al., 2018; Järvelä & Hadwin, 2013; Zhang et al., 2021). In order to provide support tailored to a particular context many recent studies have categorised collaborative groups into high- and low-performing or successful and unsuccessful groups to investigate how learners vary in their behaviours to initiate regulatory processes before proceeding with tasks (Chang et al., 2017; Channa et al., 2023; Paans et al., 2019; Schoor & Bannert, 2012; Zheng et al., 2019). For example, Chang et al. (2017) employed lag-sequential analysis and found that successful and unsuccessful collaborative groups differed in their regulatory behaviours. Successful groups developed sequential connections between “exploring and understanding” and “representation and formulating” as well as “monitoring and reflecting,” whereas unsuccessful groups demonstrated a sequential connection between “monitoring and reflecting” and “planning and executing.” Chang et al.’s (2017) study highlighted the differences between unsuccessful and successful groups by revealing that successful groups organised their learning through a cyclical process of planning, executing, monitoring and reflecting while unsuccessful groups were strong in “monitoring and reflecting” but fell short in initiating “planning and executing.” In their study, Zhang et al. (2021) applied epistemic network analysis to examine regulated learning in high- and low-performing groups. The researchers found that both groups had similar sequential relationships involving planning, monitoring and evaluating. However, compared to the low-performing groups, the high-performing groups established a stronger sequential relationship between monitoring and socioemotional regulation. Su et al. (2018) applied content analysis and sequential analysis to students’ chat logs. The authors found that, compared to low-performing groups, high-performing groups manifested patterns of regulatory behaviours in “content monitoring,” “social regulation,” “social-emotional regulation,” and “evaluating.” This indicates that, unlike low-performing groups, high-performing groups participated in establishing constant coordination to monitor their performance and achieve social cohesiveness. By employing process mining methods, Channa et al. (2023) found that, while encountering cognitive challenges, high-performing groups developed stronger sequential transitions between cognitive regulation and emotional/motivational regulation than low-performing groups. Rather than using one type of regulatory process, high-performance groups employed more cognitive, emotional and motivational regulatory processesthen low-performing groups, resulting in greater collaborative learning success (Channa et al., 2023). To conclude, the empirical evidence indicates that high-performing and low-performing collaborative groups differ in their behaviours when responding to different types of challenges and regulation. What remains understudied is whether the emergence of participatory roles in collaborative learning influences group participation and affects the regulation of learning.
Social Network Analysis (SNA)
Social network analysis (SNA) is one of the key methods in the field of network science (Saqr et al., 2020) and is widely employed in educational research. Networks are employed, for example, to explore interactions among collaborative groups and other types of relationships between different actors. For instance, the connections (i.e. edges or relationships) between collaborative groups can determine the behaviours of actors, the dynamics of interactions and the spread of knowledge in a network (Borgatti et al., 2009; Burt et al., 2013). Moreover, as collaborative learning processes are complex, adaptive and dynamic in nature, SNA methods can help researchers reveal insights into collaboration, participation, students’ engagement, interactions and other relationships that can be modelled in terms of networks (Saqr et al., 2020).
In collaborative learning research, nodes within a network can be assigned to collaborators (learners), instructors, artefacts (i.e. online posts) and digital platforms or resources used to proceed with a task, depending on the research aims and questions (Dado & Bodemer, 2017). A one-mode network involves nodes of the same type such as learners, where the edges (relationships) indicate interactions between learners. In contrast, a two-mode network involves two distinct types of nodes, such as learners and activities, where the edges represent interactions between different entity types (i.e., a learner participating in an activity). In collaborative learning, SNA results are interpreted based on the definitions of nodes and the relational links between them.
SNA has techniques to identify the participatory roles of collaborative group members. It can aid in visualising group interactions and revealing key insights, such as identifying important actors in group interactions, pinpointing peripheral members, highlighting groups with dense interactions and identifying those with sparse interactions that may require additional support (Saqr & Alamro, 2019). In addition, it can reveal the active group moderators who actively participate and engage with group members, shedding light on the extent and nature of their interactions within the network. This can all be done by analysing and quantifying interactions, the positions of interacting group members in a network of collaborative groups and the structural properties of the network (Capuano et al., 2014; Marcos-García et al., 2015; Saqr et al., 2020).
Some researchers have applied SNA to focus on learners as nodes and interactions between learners as relationships (edges) in the network; that is, modelling interaction-driven networks (Ouyang, 2021; Saqr et al., 2020). Others have employed SNA to investigate the temporality of discourses, considering the learners’ discourses as nodes and representing interactions among individual discourses as links (Swiecki et al., 2020; Zhang et al., 2021). Still others have applied SNA to investigate patterns of action transition in collaborative problem solving (Li et al., 2022).
Following the current trend of employing SNA methods in collaborative learning settings (Saqr & Alamro, 2019; Saqr et al., 2020), our study treats each collaborative group member as a node and their interactions as relationships (edges). This enables us to visually represent interaction patterns (i.e. research variables), analyse them quantitatively using SNA centrality measures (explained in the methodology section) and examine the engagement levels of active, less active and peripheral group members in each categorised high- and low-performing collaborative group. Additionally, two-mode networks were employed to explore the relationships between group members and the types of interactions (i.e. research variables such as challenges and regulation). In this representation, one set of nodes corresponds to the group members while the other set represents interaction types, with edges indicating how frequently each member engaged in these interactions. This two-mode approach provides deeper insights into participation dynamics across high- and low-performing groups, enabling a more nuanced investigation of interaction patterns.
The rationale behind this approach is to address some of the major questions in education research, such as why some collaborative groups (HPGs) succeed while others (LPGs) do not; how high-performing collaborative groups interact with each other, develop interpersonal relations and form roles to progress in a task; and whether high-performing groups participate equally, take responsibility to maximise their learning outcomes and utilise their agency to resolve challenges by initiating regulatory processes.
Research Aims and Research Questions
The aim of this study is to investigate the emergence of participatory roles (active, less active and peripheral) through interactions exchanged within high-performing and low-performing groups. The study also aims to explore how participatory roles in high-performing and low-performing groups encounter different types of challenges (i.e. sociocognitive, socioemotional and motivational) and resolve them through running regulatory processes (i.e. sociocognitive, socioemotional and motivational). Due to the dearth of empirical studies in this area, our aim is to compare the participatory roles and interactions exchanged between each triadic high-performing and low-performing collaborative group.
This study addresses the following research questions:
RQ 1: How do participatory roles (active, less active and peripheral) differ in terms of frequency of interactions in high- and low-performing collaborative groups?
RQ 2: How do participatory roles in high-performing and low-performing groups differ in their interactions with each other to address different types of challenges through regulatory strategies?
RQ3: How do high- and low-performing groups differ in terms of each group member’s network position and connectedness to the types of group interaction?
Methodology
Participants and the Task
This study consisted of 10 collaborative groups of three: five high-performing groups and five low-performing groups. These groups were categorized after-the-fact based on their performance in the simulation tasks. In the high-performing groups (mean age = 32.92 years; SD age = 10.80 years; female = 12, male = 3), nine members (i.e. three groups) were university students enrolled in different teacher education programs and exchange programs the University of Jyväskylä and six (i.e. two groups) were in-service teachers. All 15 participants in the low-performing groups (mean age = 48.23 years; SD age = 9.22 years; female = 13, male = 2) were in-service teachers.
Each collaborative group of HPGs and LPGs was given two Labster simulation tasks (https://www.labster.com/) to work on jointly. The first task was “Newton’s Second Law of Motion: Speed and Acceleration Virtual Lab,” and the second was “Vectors and Scalars: Guide Two Astronauts on a Mission to Mars Virtual Lab.” Figure 1 shows the simulation environment of the first task, and Figure 2 shows the user interface of the LabPad (i.e. a virtual tablet). The rationale behind choosing these tasks was that they simulate a problem-solving scenario and trigger different types of interactions, such as sociocognitive, socioemotional and motivational. In the first task, the collaborative groups were to assist Newton in recalling his second law of motion through experimentation involving forces and masses while observing their influence on acceleration and velocity in the virtual laboratory. In the second task, the collaborative groups were to assist two astronauts in their survival on the Martian surface. It was necessary for the collaborative groups to solve problems related to vector and scalar quantities. This involved identifying the magnitude and direction of vectors using the Cartesian coordinate system. The current study provides a video data analysis of both tasks.
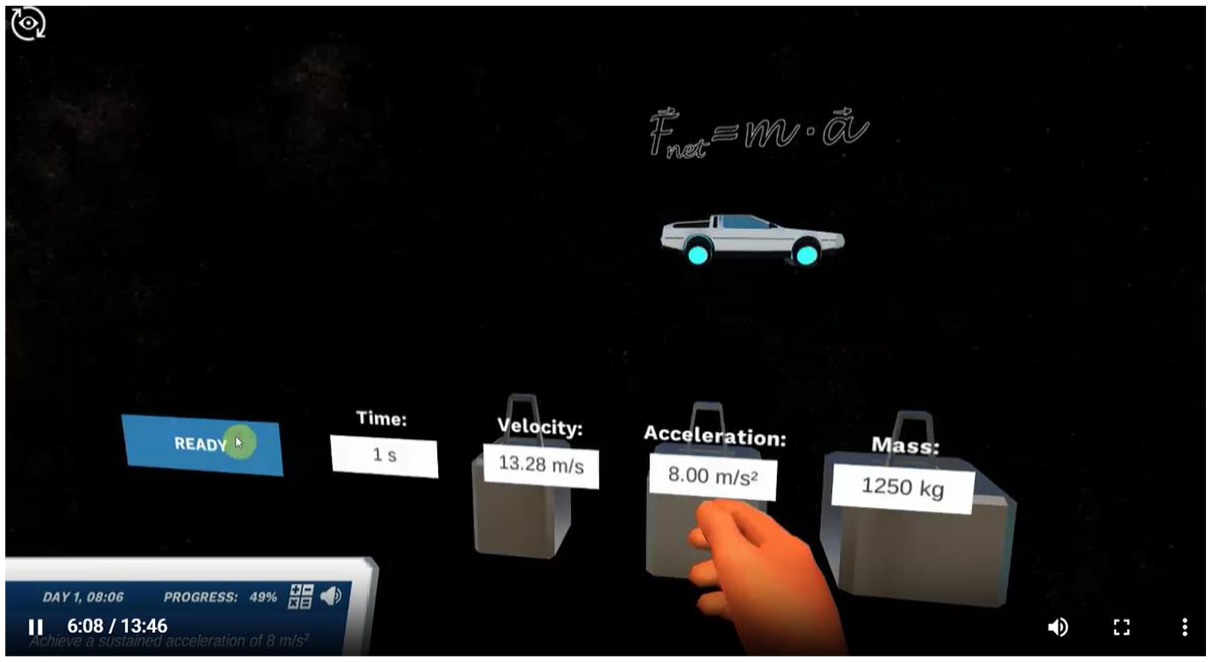
Virtual simulation environment of task 1.
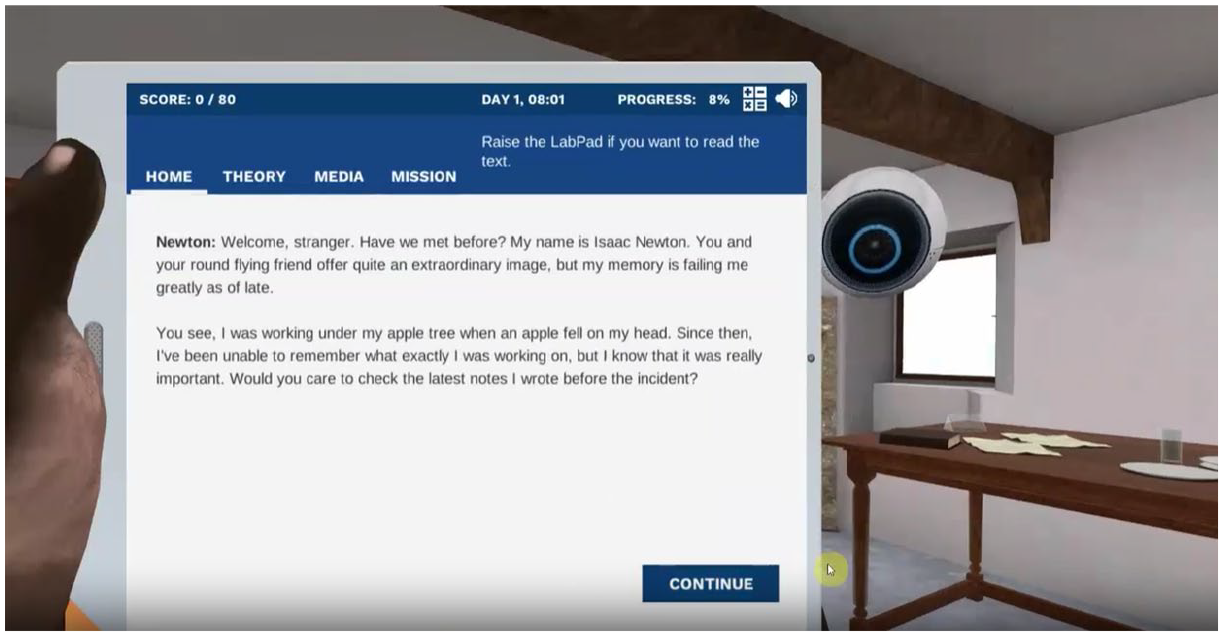
Virtual simulation interface showing the LabPad.
Data Collection
The first author visited classes in the university’s teacher education programmes to recruit pre-service teachers. During international teaching training at the University of Jyväskylä, in-service teachers were recruited.
The participants were asked to volunteer for the study by completing and signing a consent form. Collaborative learning groups were created randomly by considering the participants’ availability while ensuring diversity in terms of sociocultural and educational backgrounds. Ethical considerations and principles were adhered to according to the university’s guidelines and the regulations outlined in the EU General Data Protection Regulation.
Upon arrival at the computer lab, the participants were instructed to form groups of three and position themselves in front of desktop computers. To reduce disturbance and capture high-quality audio and video of group interactions, each group was separated by panel sheets in the computer labs. Professional video recording cameras with excellent built-in microphones were placed behind each computer screen to ensure that each group member was effectively captured in the video recording frame. Figure 3 shows one of the groups engaged in collaborative learning activities in the simulation environment.
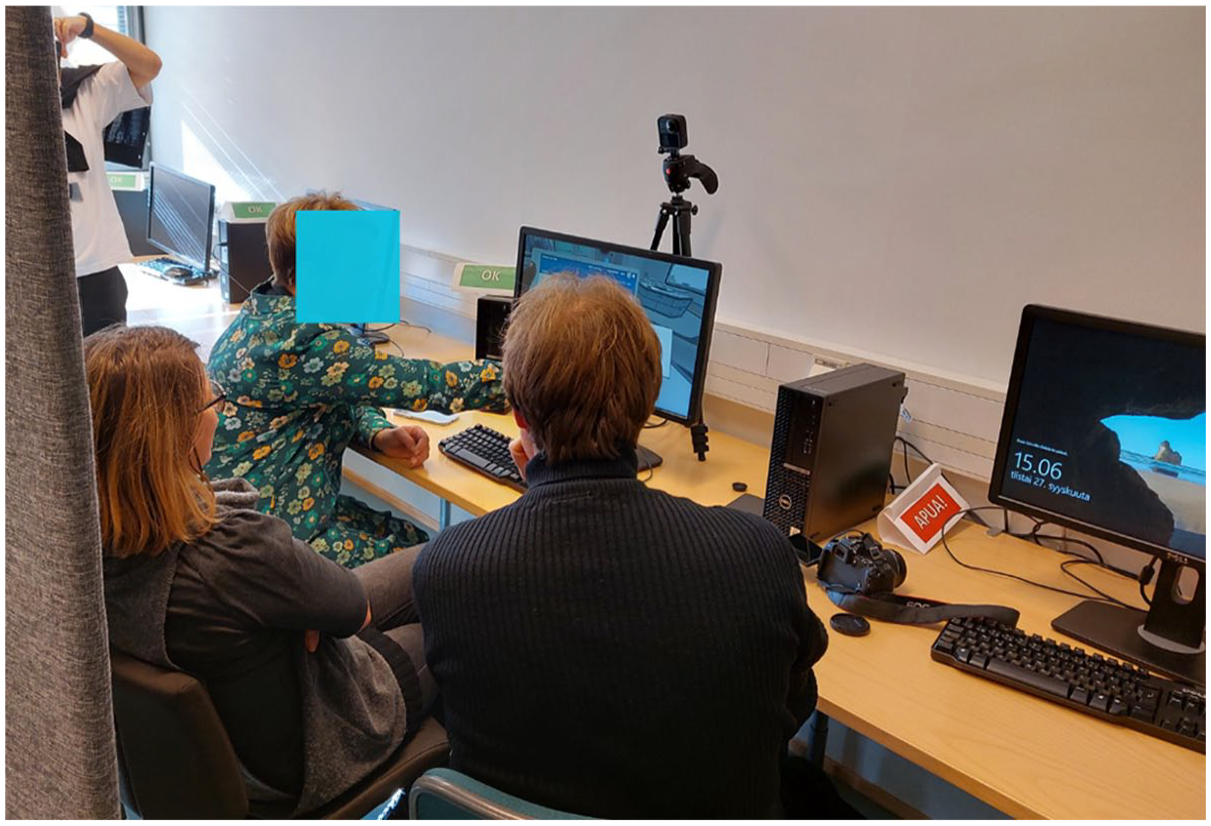
A collaborative group engaged in collaborative learning on virtual simulation tasks.
Once the group members were comfortably situated in front of the computer, the first author of the study provided instructions from a prewritten script that outlined the tasks and their objectives in the virtual simulation environment. Each simulation also provided clear instructions on how to interact with it and carry out the assigned tasks. After instructions were provided, the video recording began.
The first task aimed to acquaint the groups with the simulation environment. Hence, each group was given a maximum of 35 min to complete the first task. However, no specific time limit was imposed for completing the second task. On average, the high-performing groups took 64.2 min (SD = 7.04) to complete both tasks, while the low-performing groups took 71.6 min (SD = 12.11) on average to complete the tasks. Each group was individually recorded on video during both simulation tasks. The video recording was stopped once the participants had completed the tasks and had logged out of the simulation interface.
Data Analysis
Categorization of High- and Low-Performing Groups
Labster simulation tasks automatically assign grades based on the quiz questions asked when completing the tasks. Depending on the length and complexity, each simulation task contains a different number of quiz questions. The score awarded for each quiz question depends on the number of attempts the learner makes to answer it correctly. If the answer is correct on the first attempt, a score of 10 is awarded. If the answer is correct on the second attempt (i.e. after one incorrect answer), a score of 8 is awarded. Similarly, if the answer is correct on the fifth attempt, two scores are rewarded. For more details visit https://help.labster.com/instructors/collections/2553606/articles/1350457-understanding-labster-simulations-scoring-system/.
The maximum scores in the first and second tasks were 80 and 100, respectively. To obtain the maximum score for both tasks, the collaborative groups had to answer all questions correctly on the first attempt. We categorised the groups into HPGs and LPGs based on their scores from the two tests. Groups who scored 76% or higher out of a total possible score of 180 from both tests were categorised as HPGs, while those who scored between 50% and 60% were classified as LPGs. In short, the top five were categorised as HPGs and the bottom five were categorised as LPGs.
Qualitative Analysis of the Video Data
All 10 groups’ interactions during the tasks provided approximately 12.06 hours of video data. To analyse the video observation data, we adopted a theoretically-driven coding scheme (see Table A1) guided by the SSRL theoretical framework. Specifically, prior research on SSRL informed the coding categories as follows: Sociocognitive challenges: These refer to difficulties in understanding a task or its content (Li et al., 2023). Socioemotional challenges: These involve negative emotions (annoyance, frustration, and anxiety) or challenges affecting group cohesion, trust and respect (Huang et al., 2024; Näykki et al., 2021; Rojas et al., 2022). Motivational challenges: These refer to low self-efficacy, lack of task interest, and low interest in collaboration (Melzner et al., 2020; Zhang & Liu, 2019).
For other coding categories related to socio-cognitive regulation, we considered SSRL’s theoretical propositions that learners must initiate various regulatory processes. These include: Planning: Negotiating strategies to understand tasks, develop joint understanding and articulating learning objectives (Hadwin et al., 2018; Panadero et al., 2013). Monitoring: Learner’s purposeful efforts to ensure common understanding of the task and tracking their progress and performance to achieve their joint learning goals (Haataja et al., 2022; Kempler-Rogat & Linnenbrink-Garcia, 2011). Controlling: Actions taken by learners to employ strategies that optimize learning processes (Järvelä & Hadwin, 2013; Melzner et. al., 2020).
Finally, we also adopted the coding categories of SSRL strategies related to socioemotional regulation and motivational regulation.
· Socioemotional regulation: This entails learners’ efforts to express positive emotions, expressing awareness of negative emotions, creating trust and sense of community within the group (Järvenoja et al., 2019; Näykki et al., 2014). · Motivation regulation: This refers to learner’s deliberate strategies to encourage one another, recognize each other’s contributions, and enhance the group learning experience Melzner et al., 2020; Ucan & Webb, 2015).
Collaborative learning processes are complex and take place in a cyclical manner. It has been argued that episodes of different types of challenges and regulatory processes need to be observed through a fine-grained approach to systematically capture meaningful episodes from video data of group interactions and analyse them precisely at the micro level (Heirweg et al., 2020). Hence, we adopted a fine-grained approach to video observation, as compared to time-based segmentation (Heirweg et al., 2020). This fine-grained approach is a systematic method for identifying meaningful episodes from video data (i.e. the utterances of the participants) and capturing them at the micro level. This approach was useful for us as it enabled us to capture all the important episodes. Each captured episode was regarded at the group level (Channa et al., 2023).
Inter-Rater Reliability
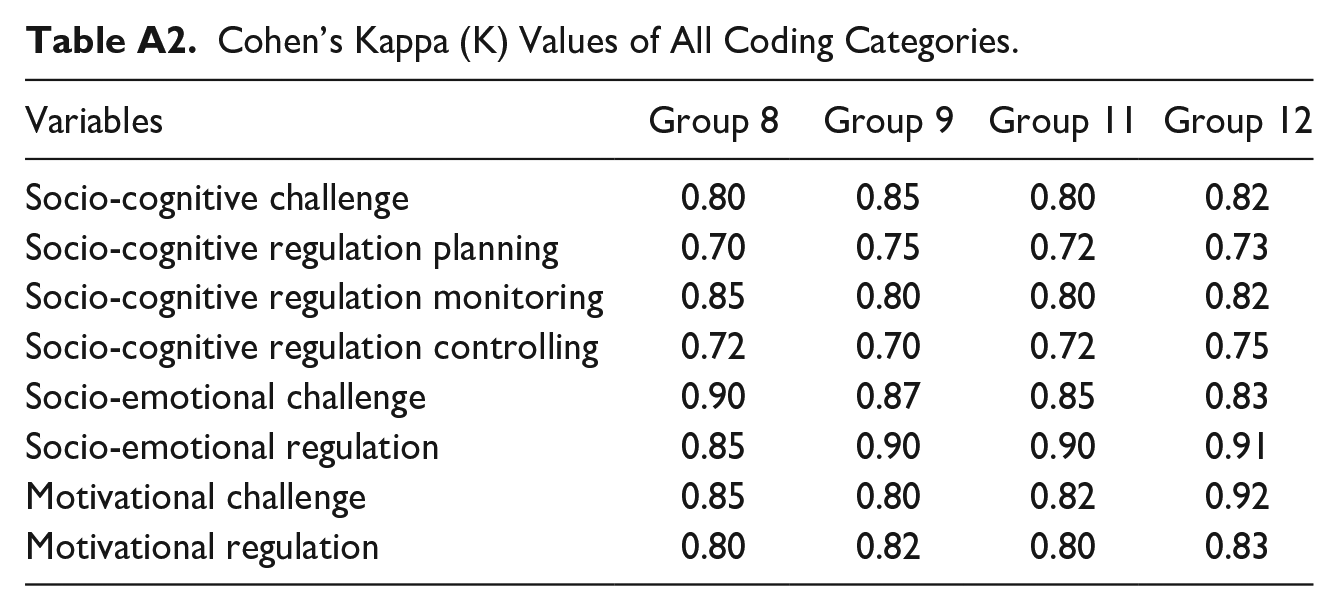
A systematic procedure was adopted to ensure the reliability of the video data analysis. First, the coding scheme and the criteria for capturing research variables from the group interaction (i.e. utterances) with examples were discussed in detail by the research team, which included the authors and a subject matter expert in the SSRL theoretical framework. After the first author and the expert agreed on the criteria and coding scheme, the first author analyzed the video data using the coding scheme (as detailed in Table A2). To confirm the consistency of coding video data, another researcher who had a sound understanding of the SSRL framework, including the challenges and regulation of learning in collaborative learning settings, coded data from four random groups (16.6% of the total dataset). To measure the inter-rater reliability between the two researchers, we calculated Cohen’s kappa (K) values for the four random groups. The first round of reliability analysis achieved acceptable Cohen’s kappa (K) values for all coding variables (Fleiss, 1981; see Table A2).
Comparison of HPGs and in LPGs in terms of the Absolute Frequency of Each Coding Category
To compare HPGs and LPGs, we first conducted a descriptive analysis of the absolute frequency values of each coding category. This enabled us to calculate the statistical metrics of the minimum, maximum, mean and standard deviation of the different types of challenges and regulations. The absolute frequency values for each coding category were considered when conducting Mann–Whitney U tests. These tests were employed to assess whether there were statistically significant differences between HPGs and LPGs concerning the frequencies of each coding category of challenges and regulation. To compare the small sample group sizes of both the HPGs and the LPGs, we opted for non-parametric Mann–Whitney U tests.
Video Data Encoding
To investigate how each collaborative group member contributed to the joint learning tasks, we meticulously observed the interaction of each member in the video data. When a group member originated or initiated interaction—in other words, uttered meaningful words that contributed to the tasks—the member was coded as a sender. Another group member who responded or replied to the sender, even with a single uttered word such as “yes,” was coded as a receiver. We did not code the receiver in some situations in which the sender responded to their own utterances. These episodes of utterances were not counted in the social network analysis. In addition, receivers were not identified in a few utterances, when group members did not respond for quite a long time and new utterances were initiated. All utterances that received no response or had no receivers, for whatever reason, were not calculated in SNA.
Social Network Analysis
Along with types of interactions (i.e. challenges and regulation), each code of the sender and receiver was observed and saved in Microsoft Excel sheets. The data were run through the Igraph package in the R programming language for both visualisation and network quantitative analysis using centrality measures (Csardi & Nepusz, 2006). The types of interactions (i.e. coding categories; see Table A1) were considered edges (links), and the sender and receiver were considered nodes (actors). Due to the group formation (three in one group) and structure, two networks were created: (a) triadic networks of each collaborative group in high- and low-performing groups (see Figure 4) and (b) two-mode networks of high- and low-performing groups (see Figures 8). We conducted two types of analysis: SNA visualisation and SNA mathematical analyses.
The triadic network of each collaborative group member.
SNA Visualisation Analysis
This provides insights into the network’s topology and the interactions among its actors. This approach can reveal the central, active and peripheral group members in a learning network. Importantly, it condenses a high volume of interactions into an informative visualisation (Borgatti et al., 2009).
SNA Mathematical Analysis
Mathematical network analysis provides a quantitative assessment of both the overall network properties and the individual centrality measures of its actors (Borgatti & Halgin, 2011).
SNA Centrality Measures
Centrality measures are metrics that quantify the connectedness of individual actors in a network. These measures provide numerical assessments of factors, such as the number of interactions, relationships with others and positions within the network (Borgatti & Brass, 2019; Liao et al., 2017). The notion of connectedness or importance can be measured in various ways. For instance, one way to consider a student as central in a social network is if they frequently contribute to group discussions, which indicates a high outdegree. On the other hand, a student is considered central if they consistently receive replies, highlighting their role in stimulating other students to respond. Hence, different centrality measures are employed to capture different aspects of an individual’s importance and connectedness in a social network (Saqr et al., 2022). The following are brief explanations of the centralities employed for SNA mathematical analysis, considering this study’s data format and structure.
Degree Centrality
This is the sum of connections (i.e. interactions, edges or links) that a node has in a network. In the context of computer-supported collaborative learning, it indicates the learner’s influence, importance in knowledge sharing, prominence, communicative engagement, social presence and activities and integration in the network (Cadima et al., 2012; Hernández-García et al., 2015; Joksimovic et al., 2016; Reychav et al., 2018).
In directed networks, two types of degree centrality are considered: indegree centrality and outdegree centrality. Indegree centrality indicates the overall number of interactions or links (i.e. edges) that an actor (node) has received from others (Borgatti & Brass, 2019; Liao et al., 2017). In CSCL research, this implies an indicator of popularity, prestige and influence (Saqr et al., 2018). Outdegree centrality indicates the overall number of outbound interactions or links (i.e. edges) originating from an actor (i.e. node) to other actors within the network. In CSCL, it has been regarded as a measure of activity, social positioning, contributions, effort and externalisation (Saqr et al., 2018). In the context of our study, a higher outdegree suggests that certain nodes (group members) are engaged in more interactions, which could signify the importance or value of their contributions. This assumption is based on the idea that some of their interactions are worth responding to by other group members, as interactions are only coded from sender to receiver when the receiver responds.
Centralisation
This measure calculates how centrality measures are distributed within the group, usually based on the variation in the centrality values of each node relative to the possible maximum. In a collaborative learning context, centralization is especially important, as it measures the diversity of centrality values between group members. A highly centralized network indicates the importance of few nodes such as highly active participants. Two key measures of centralization, indegree and outdegree, were examined in this study. Indegree centralization shows the degree to which different nodes receive interactions. A network with high indegree centralization is dominated by one or a few members who are the main recipients of interactions. Outdegree centralization shows the variability in outgoing interactions. A network with high outdegree centralization is led by a few participants who initiate most of the interactions.
As we were interested in individual- and group-level analysis to investigate how each group developed their collaboration on the tasks, we first conducted basic network analysis to visualize the network of each group (see Figure 4) and quantify the interactions exchanged between each member of the groups.
Results
Participatory Roles in High- and Low-Performing Collaborative Groups
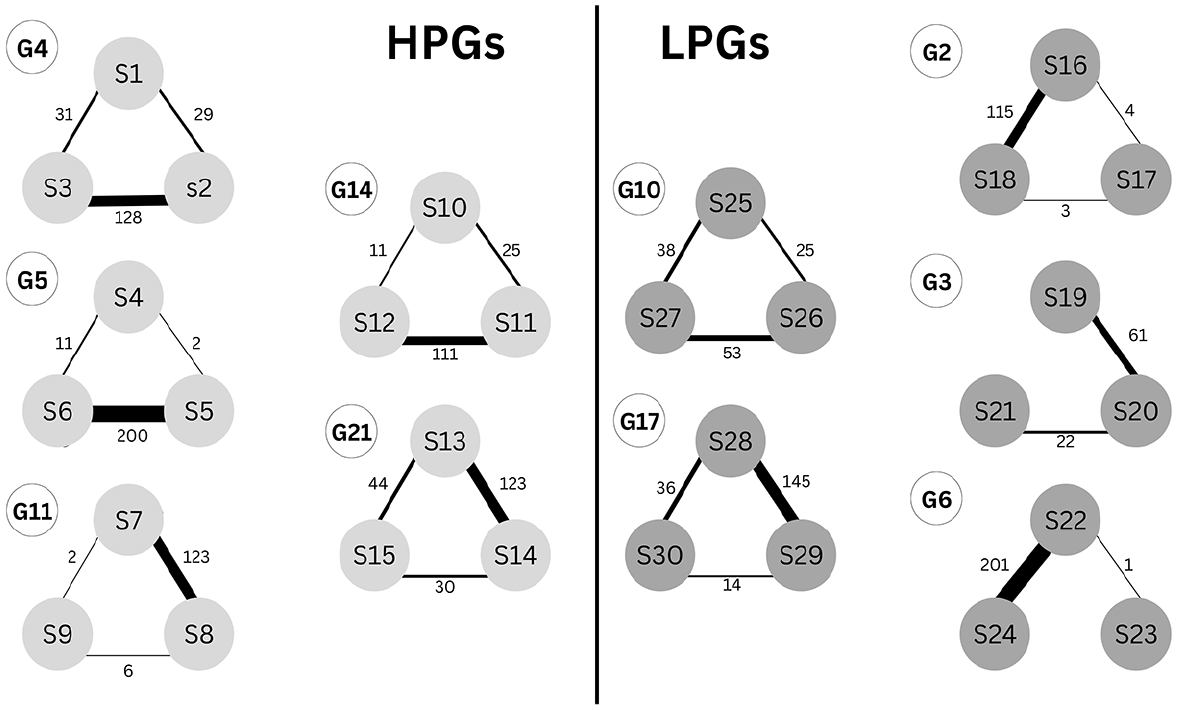
We were interested in identifying participatory roles (i.e. active, less active and peripheral) in high- and low-performing collaborative groups. The second round of social network analysis resulted in the identification of participatory roles by quantifying the frequency of interactions received and sent by each group member in each collaborative group of HPGs and LPGs. Figure 5 shows the bi-directional triadic network of each collaborative group in HPGs (left) and LPGs (right). Overall, in both groups, one group member was seemingly peripheral from the other two members. In other words, one group member could not effectively contribute to the joint tasks, indicating that they sent and received significantly fewer interactions in terms of frequency.
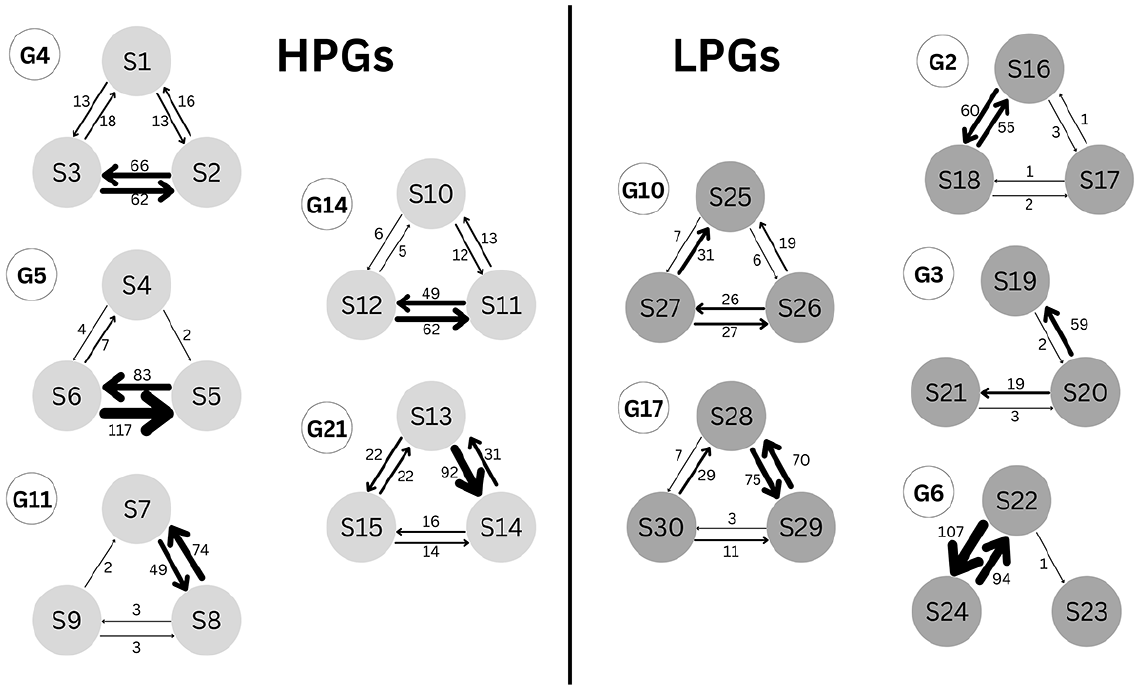
Triadic Bi-Directional Networks.
We further determined numerical values of interactions sent and received by each member in HPGs and LPGs to calculate the percentage of contributions of each group member. Table 1 shows a considerably lower percentage of contributions from peripheral group members in each categorised group. For instance, in the HPG G5 group, S4 sent and received fewer interactions in terms of frequency. Hence, the members could be considered peripheral during the collaborative task. A similar instance was also found in the LPG G6 group, in which group member S23 was considerably peripheral from other group members.
Numerical Values of Interactions Sent and Received by Each Member.
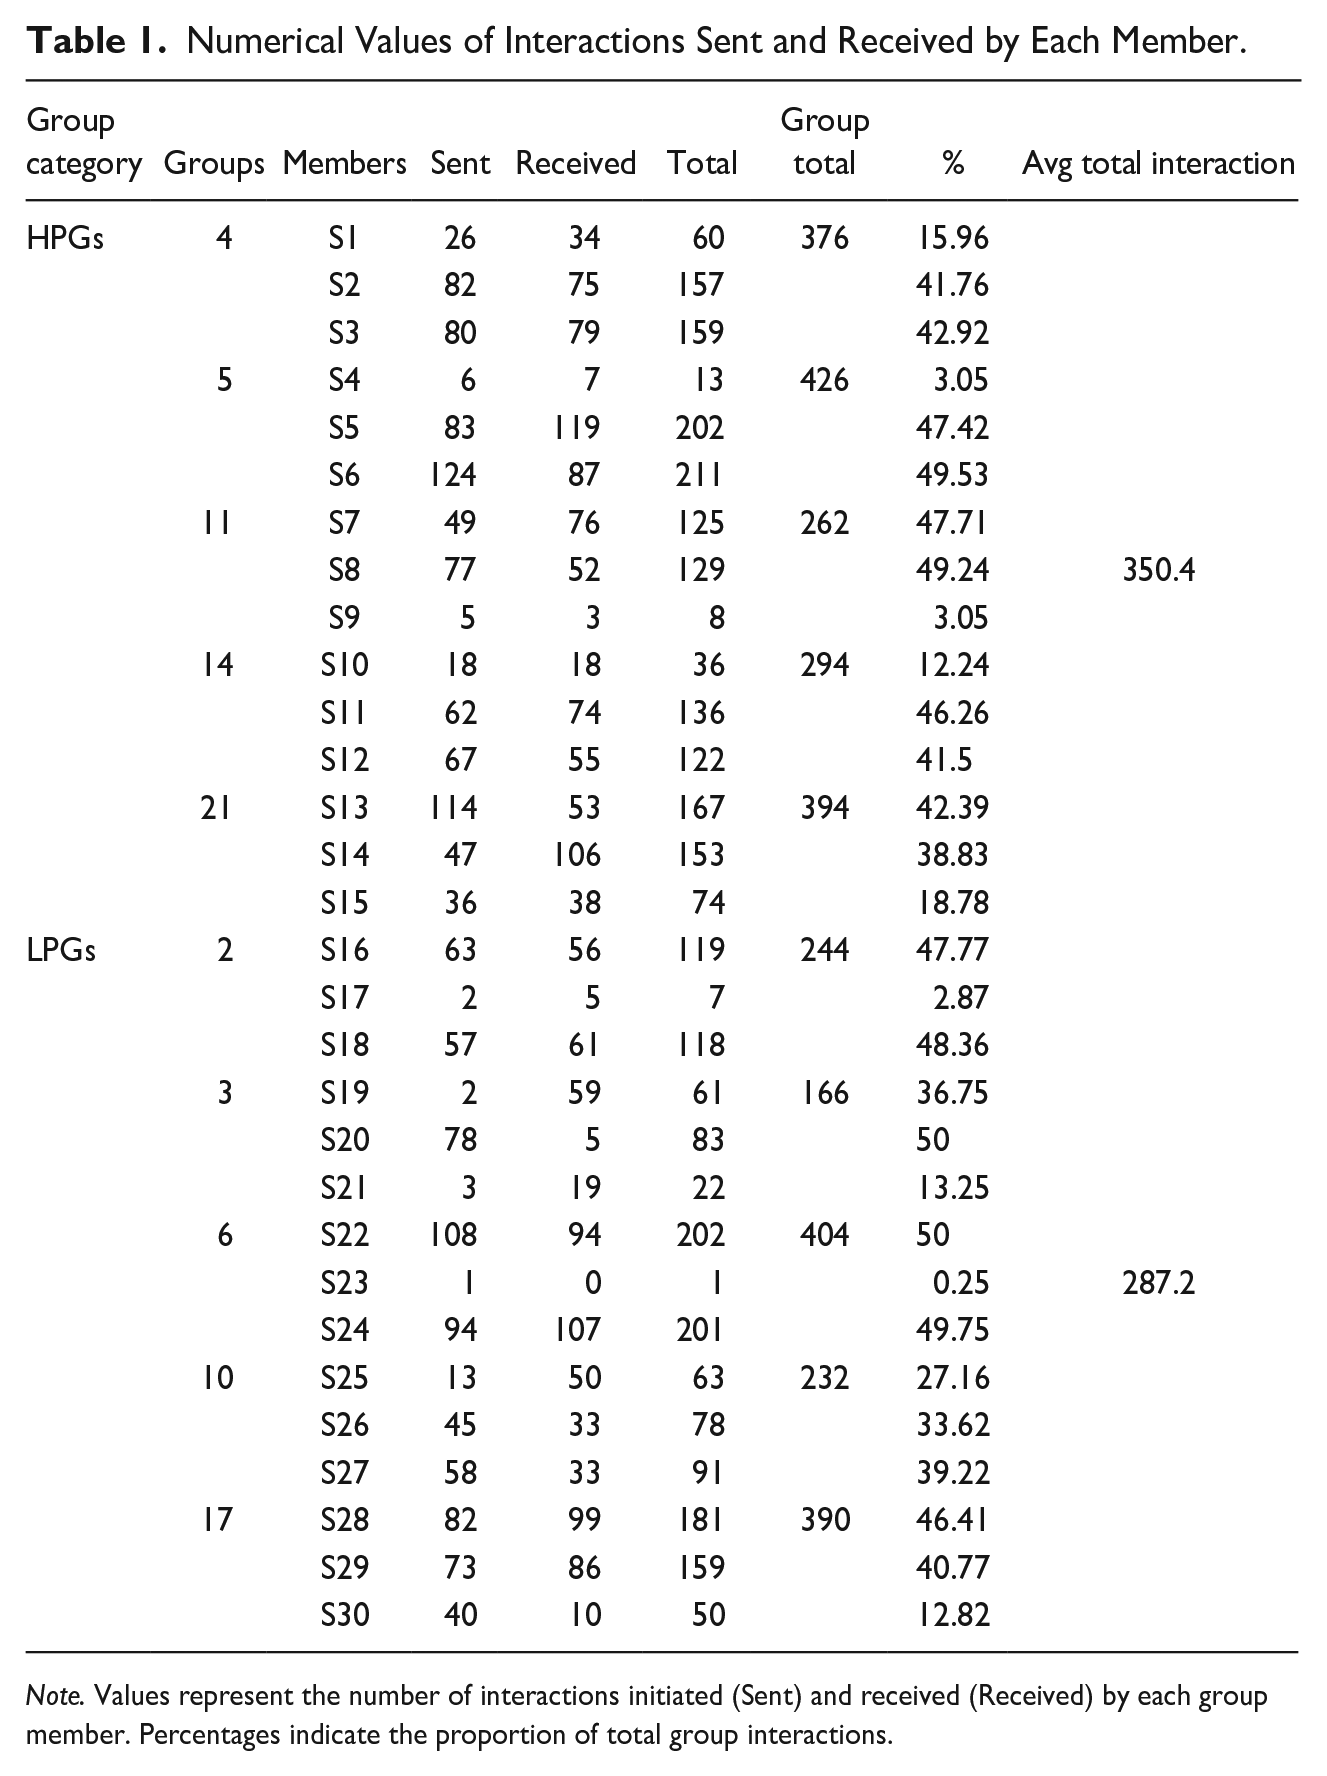
Note. Values represent the number of interactions initiated (Sent) and received (Received) by each group member. Percentages indicate the proportion of total group interactions.
We calculated the average total number of interactions in HPGs and LPGs (see Table 1). It was found that active and less active members of HPGs frequently received and sent more interactions to each other compared to their counterparts in LPGs. To further our analysis, a Mann-Whitney U test was conducted to compare the total interactions in HPGs and LPGs. Although the mean rank of HPGs (6.60) was higher than that of LPGs (4.40), the difference was not statistically significant (U = 7.000, Z = −1.149, p = .251), suggesting that there is no significant difference in interaction totals between HPGs and LPGs. Moreover, Mann-Whitney U tests were also conducted to determine statistically significant differences based on the absolute frequency value of each interaction type (i.e., coding categories). None of the tests resulted in statistically significant differences between the categorized groups. Lastly, a one-way ANOVA was conducted to compare the total interactions between HPGs and LPGs. The results showed no statistically significant difference between the two groups, F(1, 8) = 1.266, p = .293. This suggests that the total number of interactions does not significantly vary between HPGs and LPGs.
Difference Between High-Performing and Low-Performing Group Interactions When Encountering Challenges
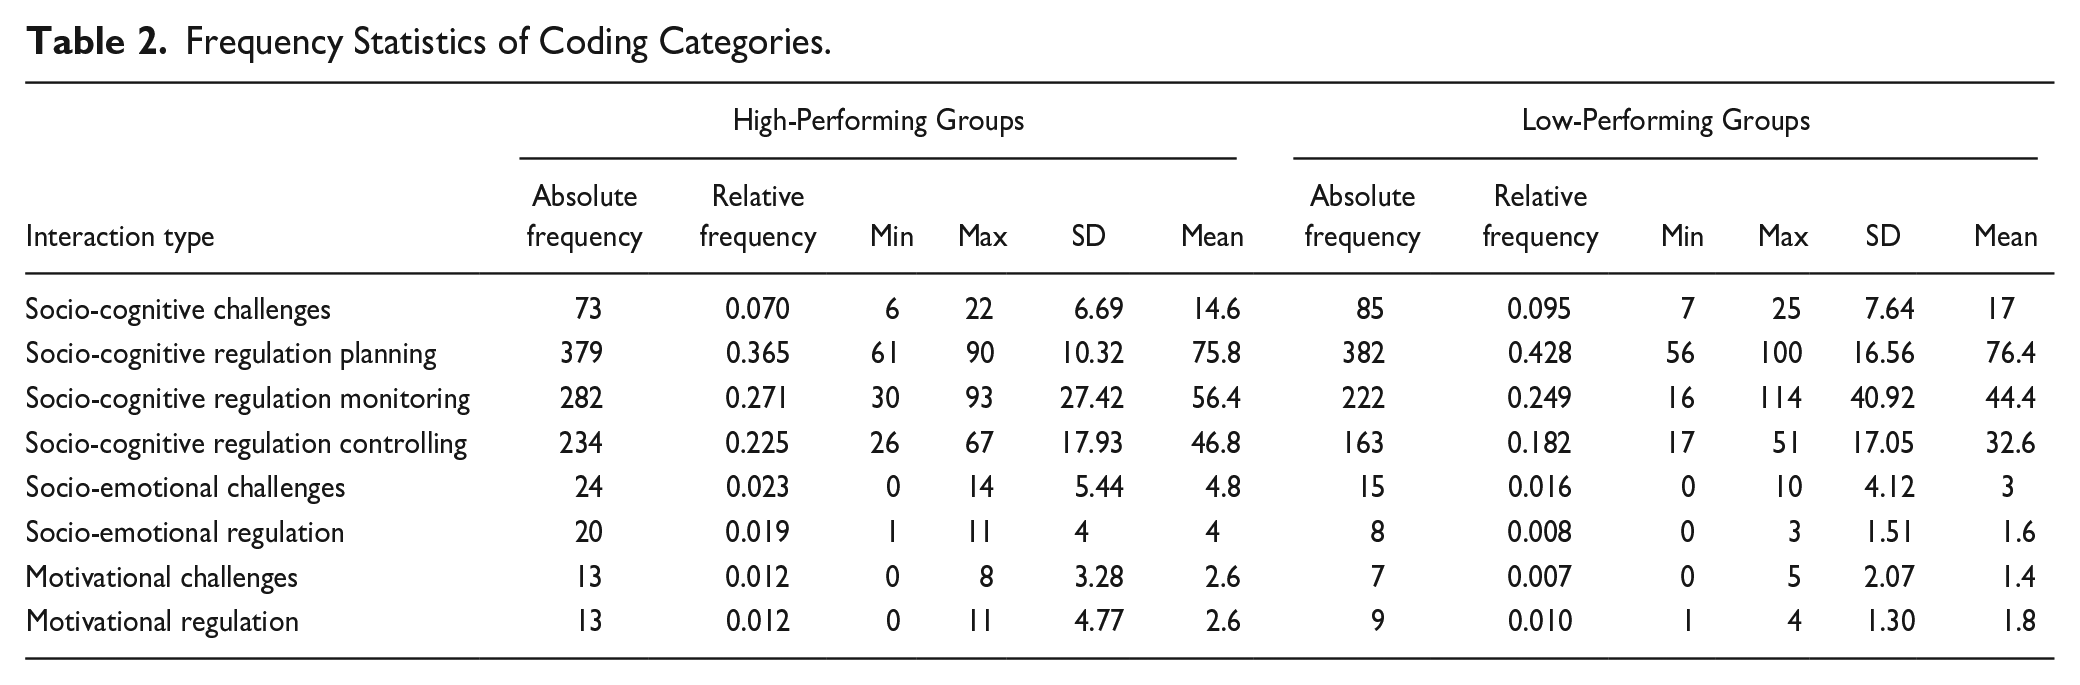
Information on the descriptive analysis of how high-performing and low-performing groups experienced challenges and employed regulatory processes during their virtual simulation learning tasks is shown in Table 2. We compared the group interactions of each group in the high-performing and low-performing groups by taking account of coding categories (i.e. challenges and regulation). Figure 6 shows interactions related to sociocognitive challenges and sub-categories of sociocognitive regulation (planning, monitoring and controlling) exchanged between each group member in HPGs (left) and LPGs (right). Overall, the figure demonstrates that both categorised groups manifested similar behaviours when encountering cognitive challenges and initiating the regulatory process of planning. Although the triadic network graphs of HPGs visually suggest stronger regulation of monitoring and controlling compared to LPGs, Mann-Whitney U tests did not yield statistically significant differences in the interaction frequencies (U = 8.000, Z = −.940, p = .347). Table 2 shows that both categorised groups encountered a similar frequency of sociocognitive challenges (HPGs: f = 73, LPGs: f = 85). Similar results were also found for planning (HPGs: f = 379, LPGs: f = 382).
Frequency Statistics of Coding Categories.
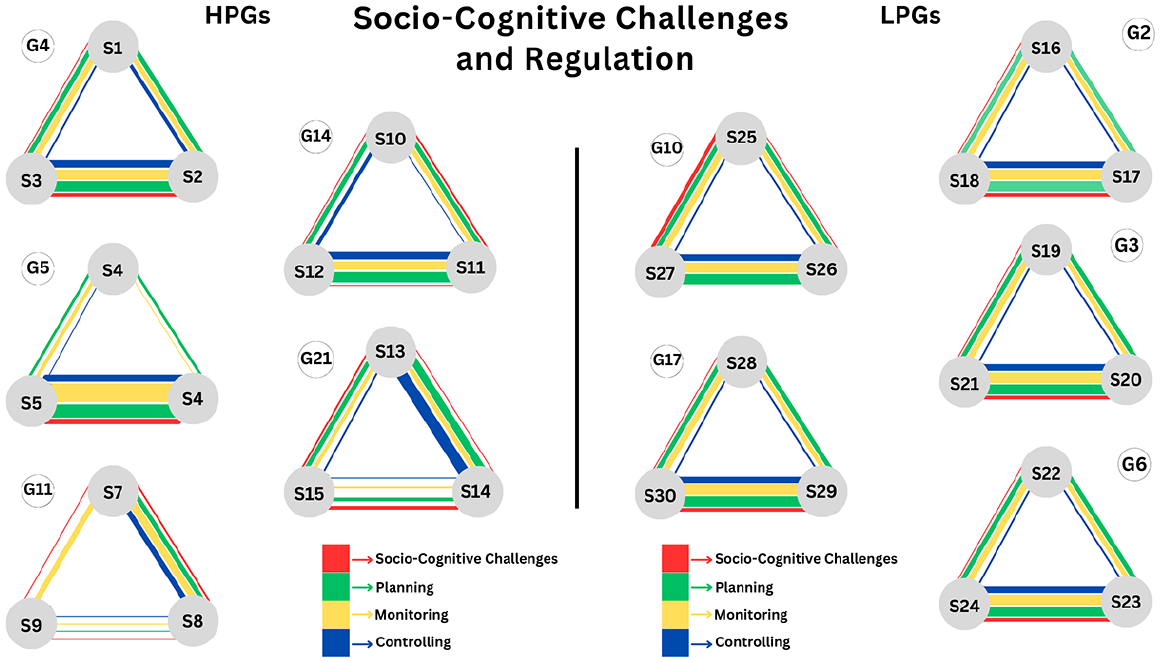
The triadic network showing sociocognitive challenges and regulation.
However, HPGs manifested a higher frequency of monitoring (f = 282) than LPGs (f = 222). Through the theoretical lens of regulation of learning, this implies that HPG members ensured that their progress and performance met the objectives of the group task more often than LPG members did. Moreover, LPGs showed a considerably lower frequency value of controlling (f = 163) than HPGs (f = 234).
Figure 7 shows interactions related to socioemotional and motivational challenges and regulation exchanged between each group member in HPGs (left) and LPGs (right). While the triadic network graphs show that HPGs exchanged more interactions of socioemotional challenges, motivational challenges, socioemotional regulation and motivational regulation than LPGs, the results of Mann-Whitney U tests did not show statistically significant differences between these two categorized groups. Specifically, the results were as follows: socioemotional challenges (U = 9.000, Z = −0.745, p = .456), socioemotional regulation (U = 7.500, Z = −1.085, p = .278), motivational challenges (U = 10.000, Z = -0.541, p = .589), and motivational regulation (U = 8.500, Z = −0.859, p = .390).
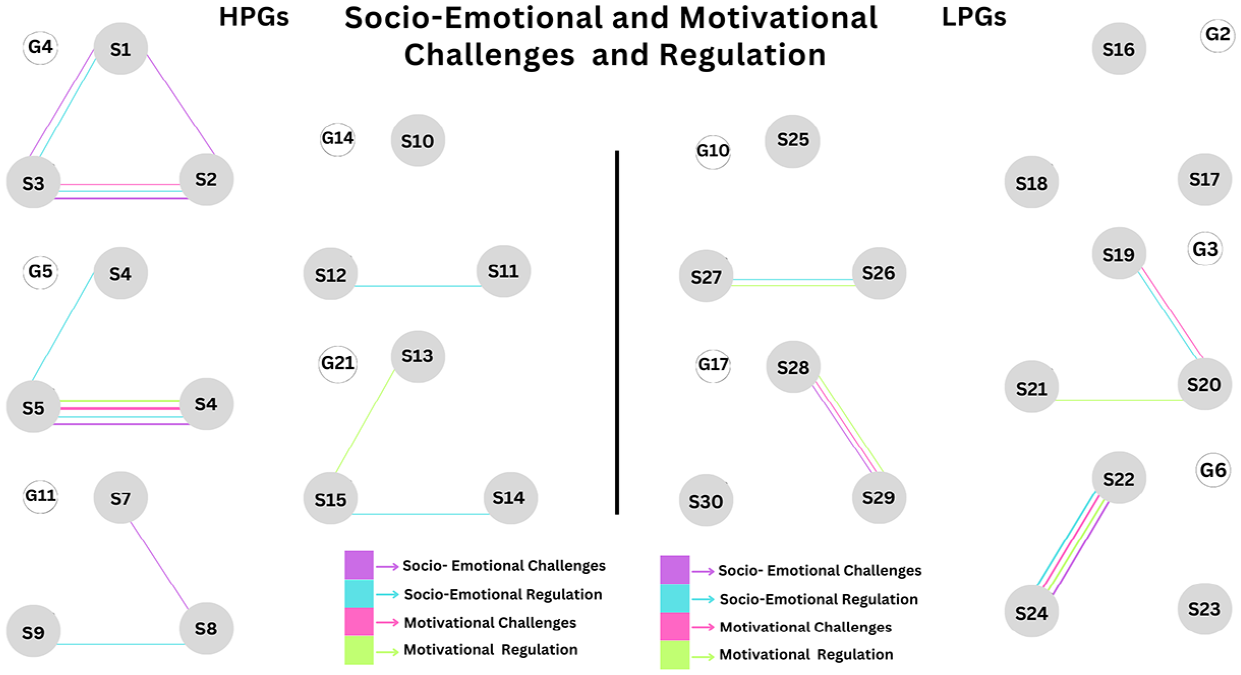
The triadic network showing socio-emotional and motivational challenges and regulation.
Difference Between High- and Low-Performing Group Members’ Network Position and Connectedness in terms of Group Interactions
We analysed a two-mode network to investigate how each group member in the high- and low-performing groups differed in terms of their network position and connectedness with regard to the types of group interactions. These two-mode networks, where nodes include both group members and interactions, enabled us to visualise how each group member in both types of groups demonstrated different types of challenges and regulation. Figure 8 shows that sociocognitive challenges and planning, monitoring and controlling were the most common interactions exchanged between many group members in both types of groups. The findings indicate that both types of groups engaged more in the sociocognitive aspects of their group learning than socioemotional and motivational aspects.
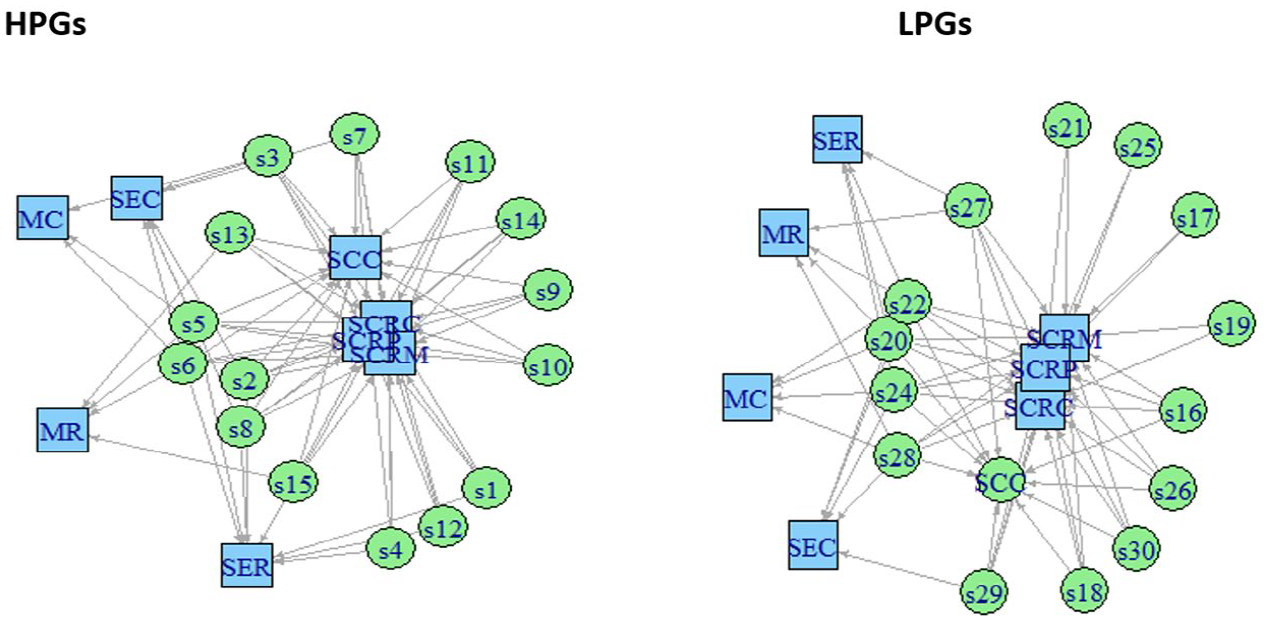
Networks of high-performing groups and low-performing groups demonstrating interaction dynamics.
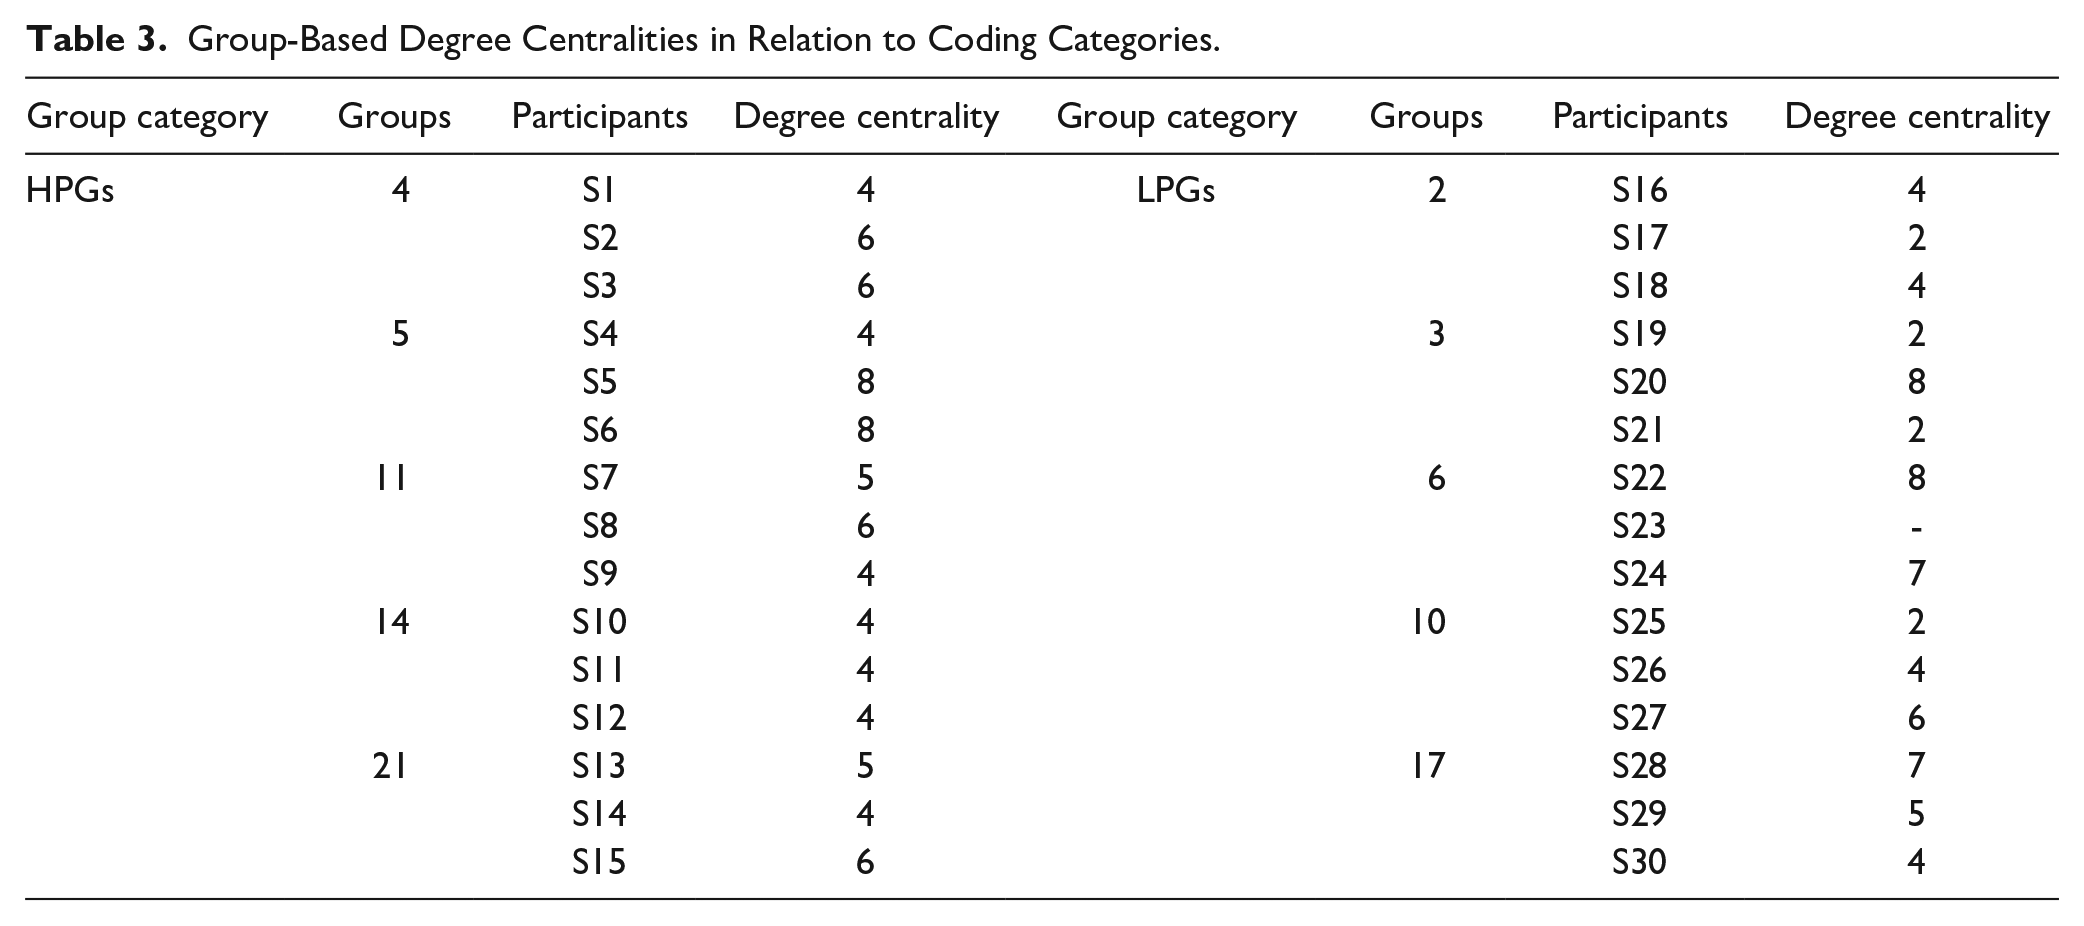
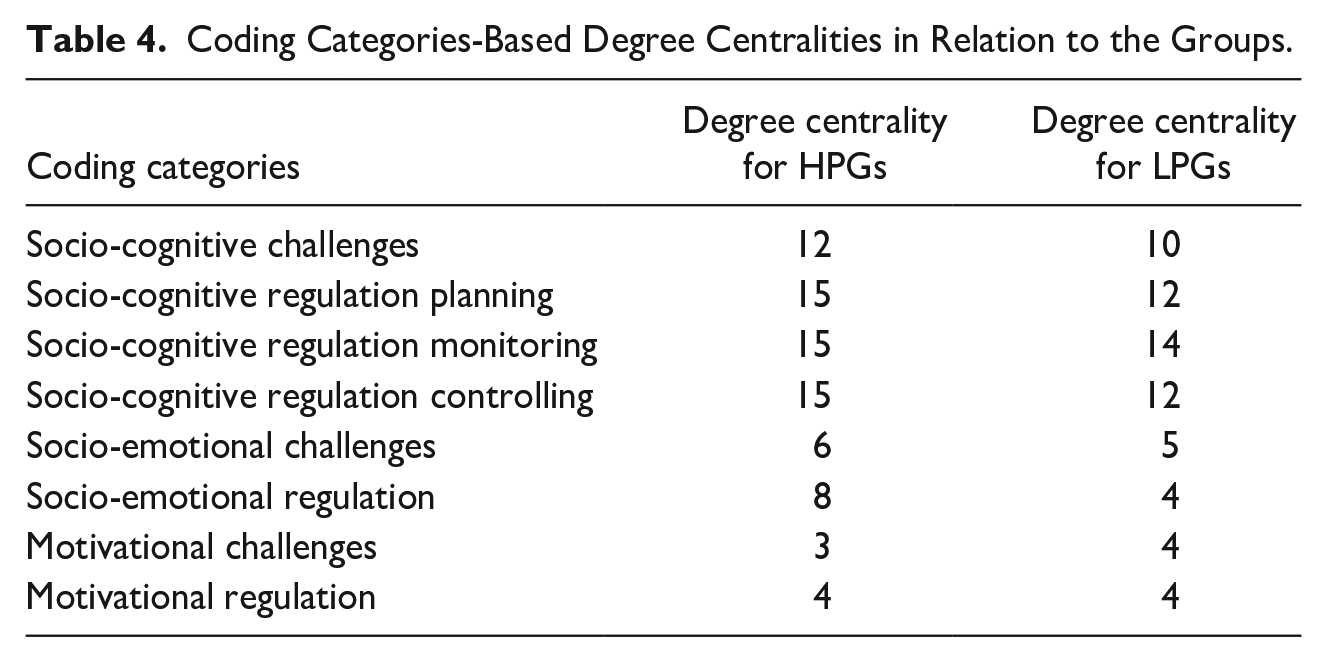
In terms of degree centrality measures, we calculated group-based degree centralities in relation to the coding categories (see Table 3) and coded category-based degree centralities in relation to the categorised groups (see Table 4). Overall, compared to the group members of LPGs, many members of HPGs had higher degree centrality values. Although this indicates that group members of HPGs experienced more diverse interactions (challenges and regulation) than those in LPGs, a Mann-Whitney U test on the outdegrees of all members from both HPGs and LPGs did not reveal statistically significant differences between them (U = 90.500, Z = −.913, p = .361).
Group-Based Degree Centralities in Relation to Coding Categories.
Coding Categories-Based Degree Centralities in Relation to the Groups.
We calculated degree centralization to explore how different types of interactions were distributed among group members (outdegree centralization) and how focused group members were on certain types of interactions (indegree centralization). The findings revealed that HPGs had an outdegree centralization value of 0.2094, compared to 0.2402 for LPGs, indicating a slightly more concentrated distribution of interactions in LPGs, where fewer members tended to lead certain interactions. The indegree centralization values for HPGs (0.5276) and LPGs (0.5259) were almost the same, indicating that both categorised groups tended to focus on a similar number of interaction types. This highlights a shared structural feature across groups, despite differences in performance.
To further explore the relationships between different interaction variables, a Pearson correlation analysis was conducted. The results revealed strong interrelationships among socio-emotional and motivational variables, such as socio-emotional regulation significantly correlating with motivational challenges (r = 0.855, p < .01) and motivational regulation (r = 0.839, p < .01). Similarly, socio-emotional challenges exhibited significant positive correlations with motivational challenges (r = 0.967, p < .01) and motivational regulation (r = 0.870, p < .01). These correlations highlight the interconnected nature of socio-emotional and motivational interactions in collaborative groups, underscoring their potential role in fostering group cohesion and collaboration. In contrast, socio-cognitive variables (e.g., planning, monitoring, and controlling) did not exhibit statistically significant correlations with socio-emotional or motivational variables. For instance, socio-cognitive challenges were not significantly correlated with planning (r = 0.063, p = .862) or controlling (r = 0.109, p = .765). However, monitoring showed moderate correlations with motivational challenges (r = 0.857, p < .01) and motivational regulation (r = 0.605, p = .064, marginally non-significant). These findings suggest that while socio-cognitive interactions are integral to task-related performance, socio-emotional and motivational interactions may play a crucial role in shaping internal group dynamics and collaborative behaviors.
Discussion
This study explored the participatory roles and interaction dynamics in high-performing (HPGs) and low-performing (LPGs) groups during collaborative learning. Within each group, participation was unequal, with peripheral members contributing less than their peers, even though statistical tests did not reveal significant differences between the categorized groups. These peripheral participants exchanged fewer interactions with their group members. Prior research has indicated that unequal group behaviour (i.e. peripheral behaviour) may be due to various interpersonal or intrapersonal reasons, such as a lack of group members’ sense of sharedness (Dindar et al., 2022), a lack of shared perception of the task condition (Gijlers & de Jong, 2009) or a lack of shared learning goals (Hadwin et al., 2018), or, in general, group members’ personal reasons or the ways of communicating within groups. In addition, peripheral group members may not realise their shared responsibility for the collective product of their group work (Jeong & Hmelo-Silver, 2016).
When comparing the participatory roles of active and less active members across HPGs and LPGs, HPGs demonstrated higher interaction frequencies than LPGs. However, these differences were not statistically significant. Prior research has indicated that frequent interaction fosters better collaboration (Saqr et al., 2020; Vaquero & Cebrian, 2013). In particular, high-performing students often build “rich clubs,” where they interact closely and reciprocally, enhancing their collective performance. These trends, though noteworthy, should be interpreted cautiously given the lack of statistical validation.
HPGs were observed to engage more frequently in SSRL strategies, particularly emphasizing reciprocity in their interactions. This is consistent with the findings of Isohätälä et al. (2018) and Volet et al. (2009), who demonstrated the role of reciprocal interactions in fostering effective collaboration. Our analysis revealed that reciprocity in SSRL strategies facilitates group cohesion and collaborative success. While these observations are consistent with the broader understanding of SSRL, the lack of statistical significance necessitates careful consideration of these findings as preliminary insights rather than definitive conclusions.
The theoretical framework of SSRL posits that the regulatory process of planning is vital to broadening understanding, clarifying learning conditions and perceptions towards a task and designing a roadmap to attain joint learning goals (Kempler-Rogat & Linnenbrink-Garcia, 2011; Malmberg et al., 2017). In terms of the number of episodes of planning, we noted that HPGs and LPGs confronted sociocognitive challenges and planning quite similarly. This finding is somewhat contradictory to the results of Channa et al. (2023), who evidenced that HPGs demonstrated stronger sequential relationships between cognitive challenges and planning than LPGs. However, in this study, only the HPGs developed a sequential relationship between cognitive challenges and planning. A sequential relationship between cognitive challenges and planning did not manifest in the LPGs.
HPGs also appeared to engage more consistently in monitoring and controlling processes compared to LPGs. Although statistical tests did not reveal significant differences, visualizations of triadic networks and descriptive trends indicated stronger regulatory behaviors in HPGs. Malmberg et al. (2015) and Zhang et al. (2021) reported that high- and low-performing groups engaged in similar regulatory activities. The divergence in findings could stem from differences in methodological approaches, sample characteristics, or task structures. For example, this study’s focus on triadic groups in virtual simulation tasks may have accentuated differences in regulatory strategies not captured in other contexts.
This study extends the conversation by highlighting that even when statistical differences are not observed, descriptive trends and qualitative data such as network visualizations can reveal meaningful behavioural distinctions between high- and low-performing groups. These findings suggest that while statistical parity in regulatory activities may exist in some studies, the nuanced patterns of interaction and regulation observed here emphasize the importance of examining group-level dynamics more closely.
Correlation analysis provided additional insights into these interactions. Strong positive correlations were observed between socio-emotional regulation and motivational challenges and between motivational regulation and socio-emotional challenges. These findings point to a close interrelationship between socio-emotional and motivational aspects, suggesting that they might work in close connection to shape collaboration dynamics, even though these patterns were not reflected in statistically significant group-level differences. This raises the possibility that socio-emotional and motivational regulation could be playing a foundational role in group collaboration. They might even compensate for weaker cognitive regulatory processes. For example, a group that doesn’t engage heavily in cognitive regulation could still collaborate effectively if strong socio-emotional and motivational skills are present to bridge the gap. This interplay might be key to understanding how groups manage to stay cohesive and productive under varying conditions.
Studies have shown that cognitive aspects of learning are more dominant in group interaction compared to socioemotional and motivational aspects (Channa et al., 2023; Järvenoja et al., 2019). Both categorised groups in this study engaged in a higher frequency of sociocognitive challenges and regulation (i.e. planning, monitoring and controlling) than socioemotional and motivational challenges and regulation. However, the correlation analysis revealed that socio-cognitive variables (e.g., challenges, planning, and controlling) were not significantly correlated with socio-emotional or motivational variables. This independence suggests that socio-cognitive interactions may serve distinct functions in collaborative tasks, focusing more on task-oriented goals rather than group cohesion or motivation. Interestingly, monitoring—a cognitive regulatory process—did show a moderate correlation with motivational challenges and motivational regulation. These findings suggest potential interplay between cognitive monitoring and motivational regulation, indicating areas for further exploration into how these dynamics shape collaboration. To succeed in collaborative learning, as in the case of HPGs, the findings of this study maintain that, along with cognitive aspects of learning, learners should engage in socioemotional and motivational aspects. This finding corroborates the results of Zheng and Yu’s (2016) study, which revealed that high achievers initiated different regulatory processes, such as monitoring, controlling and goal setting, to attain their collaborative learning goals.
The Mann–Whitney U tests did not find statistically significant differences in the frequency of research variables between HPGs and LPGs. Nevertheless, correlation findings and descriptive trends suggest valuable relational dynamics. For example, the strong correlations among socio-emotional and motivational variables indicate their importance in fostering group cohesion. Similarly, the interplay between monitoring and motivational regulation highlights complex interaction patterns that go beyond group-level differences. These findings demonstrate the need for complementary approaches alongside traditional hypothesis testing to fully capture the complexity of collaborative group interactions.
Limitations and Future Work
The present study has some limitations that need to be acknowledged. First, all five LPGs consisted of in-service teachers with a mean age of 48.23 years. The HPGs had three groups of pre-service teachers and two groups of in-service teachers. This non-uniformity of group formation might have affected the results. For example, considering the mean age of the LPGs, many of the group members might have lacked experience in collaborative learning in virtual simulation tasks, which in turn might have affected their group interactions. Future studies should take this element into account to form more heterogeneous groups in terms of educational backgrounds and work experiences.
This study used only video data for the analysis. Future studies might aim to use additional datasets to complement video data analysis. In this regard, it could be fruitful to explore participants’ own interpretations of their collaborative learning to seek information on group challenges and regulation (Näykki et al., 2014). Moreover, physiological data could be used to obtain more information on the cognitive and affective processes involved during group interactions (Cornejo et al., 2017; Dindar et al., 2020; Pijeira-Díaz et al., 2019). Another acknowledged limitation relates to social network analysis. Due to the collaborative learning setting in this study, we could only develop triadic networks to identify participatory roles (active, less active and peripheral). Future studies could consider group formation to analyse participatory roles in larger networks of learners. Finally, temporal analysis of participatory roles, challenges and regulation could provide more granular and insightful information about the learning processes involved in HPGs and LPGs (Järvelä & Bannert, 2021; Järvelä et al., 2019).
Conclusion
The present study explored participatory roles (i.e. active, less active, and peripheral) in high- and low-performing groups by analysing sociocognitive, socioemotional, and motivational challenges and regulation during virtual simulation tasks. This study marks one of the early attempts to explore a comparative analysis of the roles in categorised groups using SNA. It contributes to the understanding of participatory dimensions in group interactions and the socially shared regulation of learning.
We argue that success in collaborative learning should not be measured solely based on the frequency values of the research construct. Nevertheless, the findings broaden our theoretical and methodological understanding by showing the need to investigate participatory roles in collaborative learning by taking into account challenges and regulatory processes. Hence, this study contributes to the advancement of our understanding of the theoretical framework of group interactions, participatory roles, challenges, and regulated learning through the lens of sequential analysis.
Moreover, the study offers insights into CSCL in the context of virtual learning environments by focusing on the importance of regulatory processes in achieving learning outcomes. It provides pedagogical, theoretical, methodological, and practical implications. As a practical/pedagogical implication, we want to highlight the role of the teachers or instructors in providing specific instructions at the beginning of a collaborative task to foster a sense of sharedness, shared responsibility, and shared goals so that peripheral roles may be minimised and all group members can participate equally and engage in their joint task. Second, the findings suggest the potential value of scaffolding collaborative groups and encouraging them to employ SSRL strategies to regulate their challenges and potentially maximise their learning outcomes. Furthermore, the practical implications for designing collaboration-driven learning content are highlighted. This type of content can foster multi-layer interactions and facilitate the regulation of the social aspects of learning.
Finally, the findings of this study in relation to categorised profiles (i.e. high- and low-performing groups) provide guidance for developing profile-driven tasks so that tailored support is provided to scaffold groups to initiate regulatory processes. It is important to note that while this study provides valuable insights into the dynamics of high- and low-performing groups, the interpretations are limited by the non-significant statistical differences observed in several comparisons. Future research with larger sample sizes and additional methods is needed to corroborate these trends.
Footnotes
Appendix
Cohen’s Kappa (K) Values of All Coding Categories.
| Variables | Group 8 | Group 9 | Group 11 | Group 12 |
|---|---|---|---|---|
| Socio-cognitive challenge | 0.80 | 0.85 | 0.80 | 0.82 |
| Socio-cognitive regulation planning | 0.70 | 0.75 | 0.72 | 0.73 |
| Socio-cognitive regulation monitoring | 0.85 | 0.80 | 0.80 | 0.82 |
| Socio-cognitive regulation controlling | 0.72 | 0.70 | 0.72 | 0.75 |
| Socio-emotional challenge | 0.90 | 0.87 | 0.85 | 0.83 |
| Socio-emotional regulation | 0.85 | 0.90 | 0.90 | 0.91 |
| Motivational challenge | 0.85 | 0.80 | 0.82 | 0.92 |
| Motivational regulation | 0.80 | 0.82 | 0.80 | 0.83 |
Acknowledgements
We would like to thank Dr. Kristof Fenyvesi and Dr. Takumi Yada for their support in data collection.
Declaration of Conflicting Interests
The author(s) declared no potential conflicts of interest with respect to the research, authorship, and/or publication of this article.
Funding
The author(s) received no financial support for the research, authorship, and/or publication of this article.