
Abstract
This article presents a novel, simple, low-cost, and fast method for strain-based collision monitoring of plate-like mechanical structures using line-type strain sensors – particularly, elasto-resistive wires. These properties make the method valuable for application to vulnerable structures in automotive industry, where economic requirements are high. As case example the composite sandwich under-body protection plate of the battery box of an electric car is considered. The article shows that elasto-resistive wires provide balanced sensitivity along their longitudinal extent and can thus monitor larger areas than a conventional strain gauge with comparable sensitivity. The presented monitoring method for plate-like structures requires at least three wires attached on the surface. Determined transfer functions relate the measurement signal with the location and magnitude of the quasi-static assumed collision load. Position, geometric extension, and orientation of the wires are optimized. Coordinates and magnitude of unknown collision loads are determined by minimizing the error between the evaluation database (represented by predetermined transfer functions) and the strain measurement values. The proposed strain-based collision monitoring method is verified and validated by both, numerically simulated and experimentally measured data. The results show that the method can be efficiently realized by determining the required transfer functions with finite element models.
Keywords
Introduction
The ever increasing demand to reduce weight of lightweight structures constantly calls for novel technologies. Structural health monitoring (SHM) with its ability to continuously provide information on the structure’s condition helps to address this demand by reducing uncertainties regarding the current integrity of the structure. This can be exploited to, for example, reduce structural weight by less conservative design assumptions, change from scheduled to condition-based maintenance or elongate the operational lifetime of structural components. Thus, SHM can make lightweight structures more efficient and sustainable in terms of deployment of resources and can reduce costs for the operator (Bond et al., 2014; Büchter et al., 2022). However, the development of SHM methods and systems, the required equipment and its installation is typically cost intensive. As a consequence, the application of SHM is predominantly considered where failure can have catastrophic consequences, as in, for example, civil, power, aerospace and aircraft industry (Farrar and Worden, 2012; Giurgiutiu, 2015; Glisic and Inaudi, 2007; Ma and Chen, 2019; Yuan, 2016). In automotive industry where economic aspects are predominant, SHM has not fully arrived yet. So far, research was often dedicated to the monitoring of the condition of the power train (Bland et al., 2006; Elfarra, 2020; Li et al., 2018; Sharma and Parey, 2017; Yang et al., 2017). But the recent trend of electro-mobility with its heavy and high-voltage batteries brought both, lightweighting and safety issues to the forefront. The monitoring of load carrying components of automobiles with integrated sensors is little investigated to date. Only a small number of academic research investigations name mechanical structures of automobiles as potential applications for SHM (Haingartner et al., 2021; Savastru et al., 2019). However, the readily growing interest of the automobile industry can be identified by the increasing number of patents with respect to the health monitoring of an electric vehicle’s battery box. Proposed patented methods are, for example, pressure sensitive foils inside the base panel that trigger an alarm when a certain threshold is exceeded (Zacher, 2018), spatially distributed capacitive, inductive, optical or conductive sensors that detect deformations on the under-body protection plate when exceeding a threshold value (Aktas and Yurtseven, 2019), or an under-body protection plate that is monitored by means of a single electrical resistance based deformation sensor (Allgeiern, 2017).
Furthermore, there is a vast number of research results from other industrial sectors which is based on generic structural elements, and thus, is easy to adapt to comparable automotive structures (Bergmayr et al., 2021; Di Sante, 2015; Goossens et al., 2019; Kralovec and Schagerl, 2020).
Compared to the aviation industry, the requirements for SHM systems in automobiles might be lower. As a workshop check is cheaper the demand to accurately localize and quantify structural damages is lower. Moreover automobile manufacturers are facing high cost pressure on the vehicle’s marked price combined with short development times of 3–5 years (Bhogil and Shinde, 2021). As a consequence, robust SHM methods with high technology readiness level and low sensor and instrumentation costs are in demand. Strain-based SHM methods might meet these demands. Strain measurements by strain gauges have a long history and are state-of-the-art of many industrial applications (Viechtbauer, 2015). Strain gauges and the required measurement equipment are affordable and can be realized in a compact and lightweight design. Strain-based SHM methods can be classified into frequency and time domain techniques. To monitor slow varying loads and the caused slow varying deformation the quasi-static strain measurements are performed in the time domain. Classical time domain methods, as for example, rain-flow counting algorithms for fatigue assessment or local strain measurements at known hotspots, target on monitoring the loads (Farreras-Alcover et al., 2017). Novel strain-based SHM methods use distributed strain measurements to conclude on the loading and further the health state of the whole structure. Such a global evaluation of the damage state requires a network of strain sensors and a model to meaningfully fuse the measurement data. An efficient method for load localization is, for example, presented in Hiche et al. (2011). There the ratio of maximum strain values measured by a set of sensors on a composite plate is used to conclude on the location of a quasi-static load without much knowledge on the structure of interest. Today, this data evaluation is often realized by neural networks and machine learning algorithms (Lu et al., 2017). Huan et al. (2024), for example, successfully applied a backpropagation neural network model to localize low-velocity impact on composite tubes by a number of distributed strain measurement. Cooper and DiMaio (2024) used a finite element simulation trained neural network to identify static loads on a wing rib by strain measurements. For evaluation of a potential damage, for example, the differences between the estimated strains calculated from a model and the actually measured strain signals are evaluated (Bergmayr et al., 2023). However, the generation of training data is often challenging and high accuracy standards require dense sensor networks, and thus, a high cabling effort, for the monitoring a large and more complex structural component. Furthermore, the limited fatigue life of strain gauges might yield to sensor failure during the operational life of the structure. A solution for these issues can be the application of fiber optical sensors (FOS) for strain measurement. Advantages of FOS are high sensitivity, immunity to electro-magnetic interference, high durability, ability to multiplex and distributed sensing, and the potential to be embedded in structures made from composite laminates. Consequently, in 2001, 25% of SHM applications in aerospace engineering and 53% of SHM applications in civil engineering used FOS and both, scientific and industrial communities attribute the FOS technology the highest potential for continuous real-time monitoring of mechanical structures (Balageas et al., 2010; Di Sante, 2015). However, the integration of FOS during the manufacturing of composites structures is found to be very challenging due to the fragile nature of these sensors. A further drawback is that the optical interrogators needed for FOS strain measurement are comparatively bulky and heavy (Yuan, 2016) and cost intensive.
A strain sensor that may combine some of the advantages of strain gauges and FOS is a simple elasto-resistive wire that is attached to a structure of interest. Elasto-resistive wires of, for example, metallic alloys are flexible, robust, easy to repair, cheap and carry the possibility to be embedded in composite laminates. Furthermore, they can be allocated over large parts of mechanical structures at lowest cabling effort and are expected to have high fatigue strength when properly applied. The data acquisition is similar to strain gauges, and thus, devices are cheap, small and lightweight compared to a FOS system. This is mainly contrasted by the disadvantage that distributed sensing is currently not possible, that is, that the wire delivers a single integral strain signal. However, smart installation along dedicated positions and paths, as for example, along the neutral-axis of beam structures or zero-strain trajectories of plate structures (Bergmayr et al., 2021; Schagerl et al., 2015; Soman et al., 2018), and the combined application of a few elasto-resitive wires might overcome this disadvantage. The current research article presents a potential low-cost method using such elasto-resistive wires for collision monitoring of plate-like structural elements for automotive applications.
Considered case example
As an example of use the under-body protection plate of an automobile battery will be considered. Due to driving dynamics and the large volume required, battery boxes are typically located at the bottom of a modern electric car. Figure 1 shows an example for the placement of the battery box within a car-body.

Typical assembly situation of battery box of electric vehicle; case example: Volkswagen Showcar ID. CROZZ (copyright: Volkswagen AG (Volkswagen, 2017)).
High voltage, danger of inflammation and hazardous chemicals make the battery a very safety relevant component of the automobile. The battery and its protecting box structure face therefore strong certification requirements.
Critical load cases
The United Nations Economic Commission for Europe provides general regulations for certification of the battery of an electric vehicle (UNECE, 2015). Mechanical load cases to comply with are high impact and contact forces that may be present during a crash event. Beside such regulations the manufacturers often define additional design criteria to guarantee a reliable operation. This is particularly the case when using composite materials. These high performance materials can show complex failure modes that are often difficult to identify during standard inspections. Here, unpredictable and unavoidable smaller collision events are of major interest as they may result in undetected structural deterioration of the battery box.
The additional strength requirements are typically approached by conservative assumptions during the structural design. Against collisions from above or from the side the battery is well protected by the vehicle’s chassis. The driver usually notices such a collision and will consult the workshop, which then check the battery regarding damage. In contrast, collisions from the bottom directly affect the battery, and moreover, might not be noticed or taken seriously by the driver. To guarantee the integrity of the battery regarding a certain level of damage numerous quasi-static and dynamic tests need to be performed (Ruiz et al., 2018). Among those, one of the most challenging load cases for structural design are collisions of low velocity but high load at the vehicle’s under-body and their potential indentation into the battery. Gao et al. (2024) performed a comprehensive numerical and experimental study to show the nature of such low-velocity impact loads. These slow impacts may be well approximated by quasi-static loading scenarios (Abrate, 2011). Figure 2 shows a possible situation leading to such a critical low-velocity impact load case during operation. However, also smaller collision loads of higher velocity by, for example, a road stone or a hitch lost by a vehicle ahead can result in a critical damage of the battery bottom. These issues can be tackled by a very robust but, consequently, very heavy battery box, which makes the vehicle inefficient during operation and which can even be a factor in the purchase decision. For example, Chinese automobile purchase subsidies 2020–2022 are connected with the vehicle’s battery-energy-density, total mass and energy-consumption (Cui and He, 2020). An under-body protection plate can be an advantageous alternative to a very robust and heavy battery box. On the one hand, it significantly reduces direct collision loads from the bottom on the battery box, and thus, reduces the required battery box mass. On the other hand, such an under-body protection plate can be designed less conservative, as its damage does not necessarily lead to a critical situation.
High load collision of object with vehicle under-body.
Figure 3 shows a schematic representation of a vehicle battery box with an under-body protection plate. The considered under-body protection plate is an integral sandwich structure, that has a number of repeating rectangular-shaped uniform plate elements that are framed by a thicker sandwich layup. The framing sandwich part is located at the sectioning ribs of the battery box. The sandwich frame and battery ribs are thoroughly bolted to each other, and thus, create a very stiff and robust connection. In this way the protection plate elements span over the single battery sections which are the vulnerable locations of the battery. A certain distance to the battery box allows deformation of the plate elements, which provides protection of the battery during collision. However, damages reduce the stiffness of the under-body protection plate. If they are not perceived by the driver, the protective function of the plate is lost with time and collision triggered deformations can reach the battery. Here, the presented strain-based collision monitoring method using elasto-resistive wires shall ensure timely maintenance of the under-body protection plate before it loses its protective function.
Schematic representation of battery case with under-body protection plate and considered plate element.
Considered specimen
The considered specimen is a rectangular sandwich plate that represents a single framed element of the integral under-body protection plate schematically presented in Figure 3. The specimen was provided by an industry partner of the author’s research group to enable representative tests for real under-body protection plates which are under development. The sandwich plate was manufactured in an injection molding process. The plate’s dimensions in mm are
Proposed methods
The methodical approach comprises the application of elasto-resistive wires as strain sensors and the evaluation of at least three strain sensors for collision localization and force determination at a plate-like structure. Furthermore, this section presents a method for optimizing the required strain sensor system, which is then applied to the design of an experimental setup. The latter is not part of the current research focus. The topic is, however, included for sake of completeness.
Strain measurement by elasto-resistive wires
Conductive wires enable strain measurement due to their change in electrical resistance when mechanically strained. This effect results predominantly from geometric deformation and the elasto-resistive effect of the used material. For small strains and the typical strain gauge materials, for example, Constantan©, the change in resistance can be assumed proportional to the applied strain. The ratio between the change in electrical resistance
where
Equation (1) is also true for an unidirectional strain gauge, when l is small and the strain is assumed constant. However, these strain sensors show different behavior when applied for collision monitoring of structural elements. While a strain gauge measures strains very locally, an elasto-resistive wire of certain length averages the unidirectional strain along the application path. Assuming an equal gauge factor k for both, an elasto-resistive wire and a strain gauge, this difference in behavior shall be exemplary analyzed on hand of a simply supported beam having length L and loaded by a single transverse force F at position
Figure 4 presents the normalized bending moment
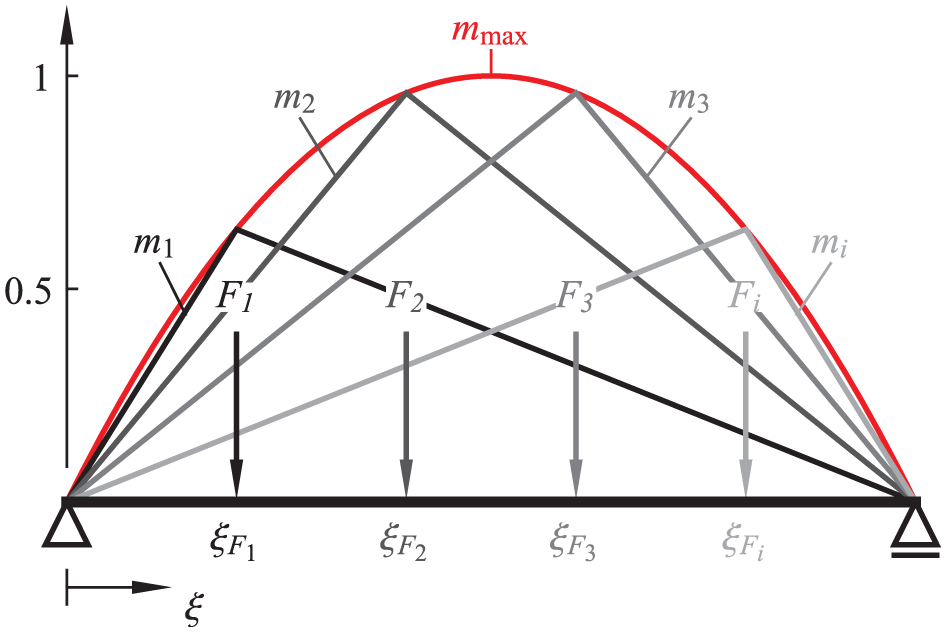
Simply supported beam of length 1 with normalized bending moments
Consequently, the exemplary plotted bending moments
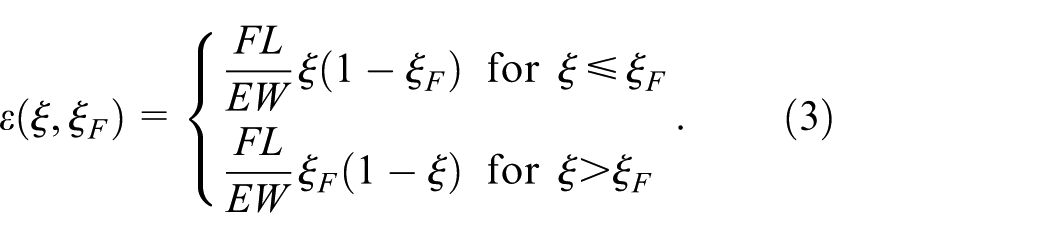
Let us first assume a strain gauge at a location
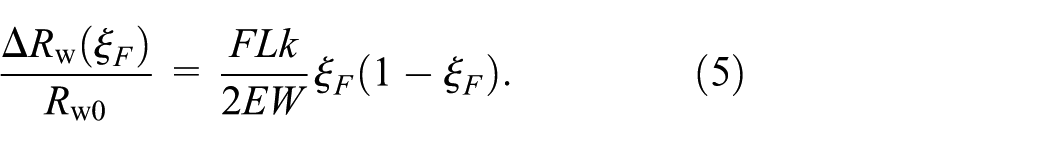
If, in comparison, an elasto-resistive wire located at the extreme fiber is spanned over the whole length of the beam, that is,
A strain gauge located at the load application point, that is
However, the strain gauge sensitivities vary stronger than the wire sensitivity when the load locations change. For a number of single strain gauges
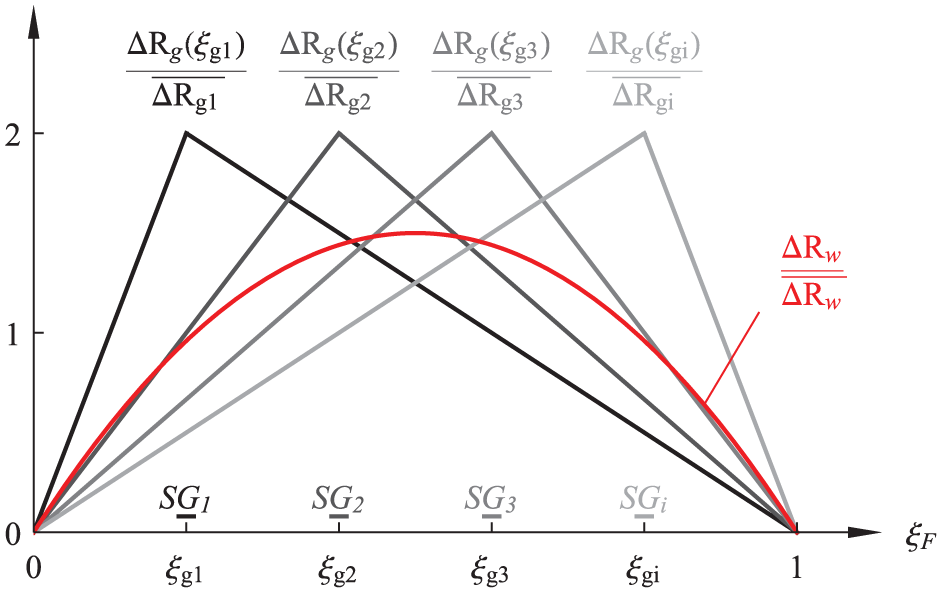
Normalized resistance change
The standard deviation of the resistance change from the mean value can be interpreted as the resulting sensitivity variation, which yields for all strain gauges the same value
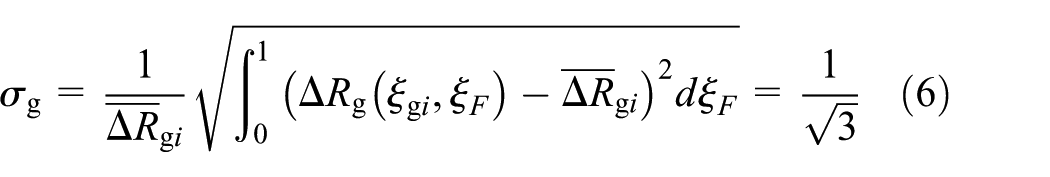
For the elasto-resistive wire the according value is
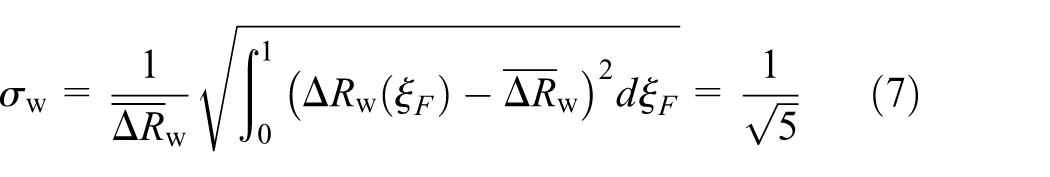
that is, lower. Thus, when the load application point is not specified, respectively unknown, the sensitivity of the elasto-resistive wire to mechanical strain is more homogeneously distributed than a single strain gauge located at a general position. Note that for clamping conditions other than simply supported the standard deviations will be different from the numbers in equations (6) and (7). However, due to the averaging effect of the line-type strain sensor the elasto-resistive wire will always yield a lower sensitivity variation than a local strain gauge.
Collision monitoring at plate-like structures by strain measurements
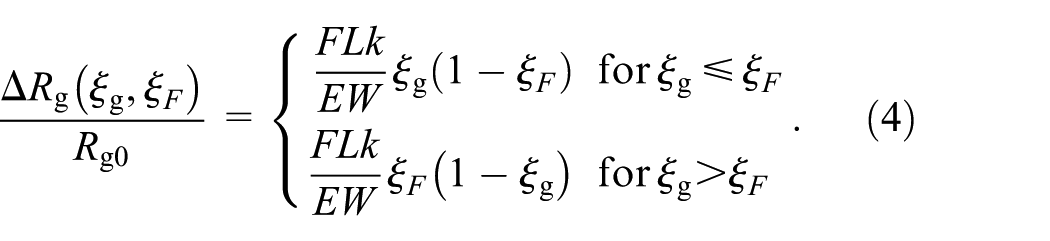
In the event of a low velocity but high load (i.e. quasi-static) punctual collision at a plate-like structure the determination of the position and the magnitude of the force requires at least three strain measurement values, and thus, three strain sensors. For every involved strain sensor j, the proposed method works with transfer functions
which is the relationship between a static force F acting on position
In a preparatory stage, these transfer functions have to be acquired at the considered pristine structure as base for evaluation. The transfer functions can be determined analytically or by interpolation of results gained from numerically simulated or from experimentally measured load cases. The calculation of the transfer functions is preferably done in a combinatorial way between these possibilities to gain optimal benefit from analytical or numerical models when considering a specific structure. In this case, the basic transfer function is formulated by numerical simulation results with nominal component data, followed by (a few) experiments to calibrate the model-based transfer function with respect to the specific structure. Analytical solutions can only be found for very simple geometries and boundary conditions. Therefore, in the current article, only numerically simulated and experimentally measured results are considered in order to present a general applicable procedure of the evaluation method. The proposed evaluation method is thereby presented in a general form. For graphical illustration specific simulation results are used.
Numerical model
The numerical model used in the present research is set up with the commercially available finite element analysis software Abaqus/Standard©, provided by Dassault Systèmes. The solver is implicit and does not take into account dynamic effects or geometric nonlinearity. The plate is modeled in the x-y-plane as a thin-walled laminated layup. The dimensions of the considered plate within the clamping are
Nominal mechanical properties used for the finite element model.
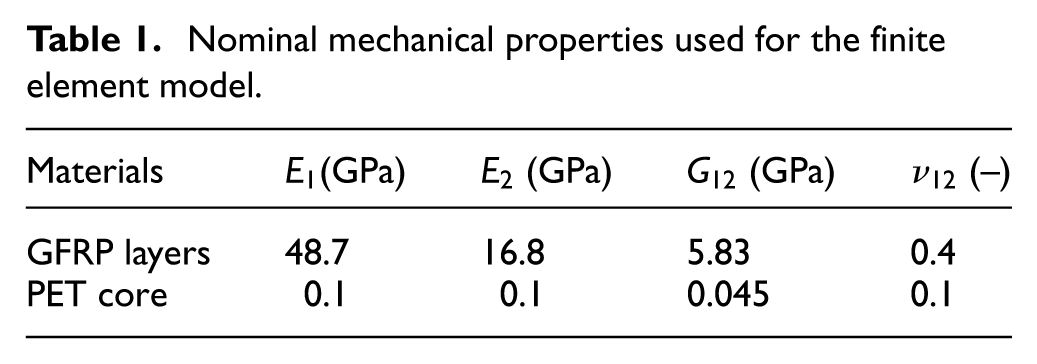
All degrees of freedom of the boundary nodes are fixed, that is, the plate is assumed to be perfectly clamped. Every load case simulated for learning the transfer function considers the same single unit load of 1 N that is located at one of the defined load application points
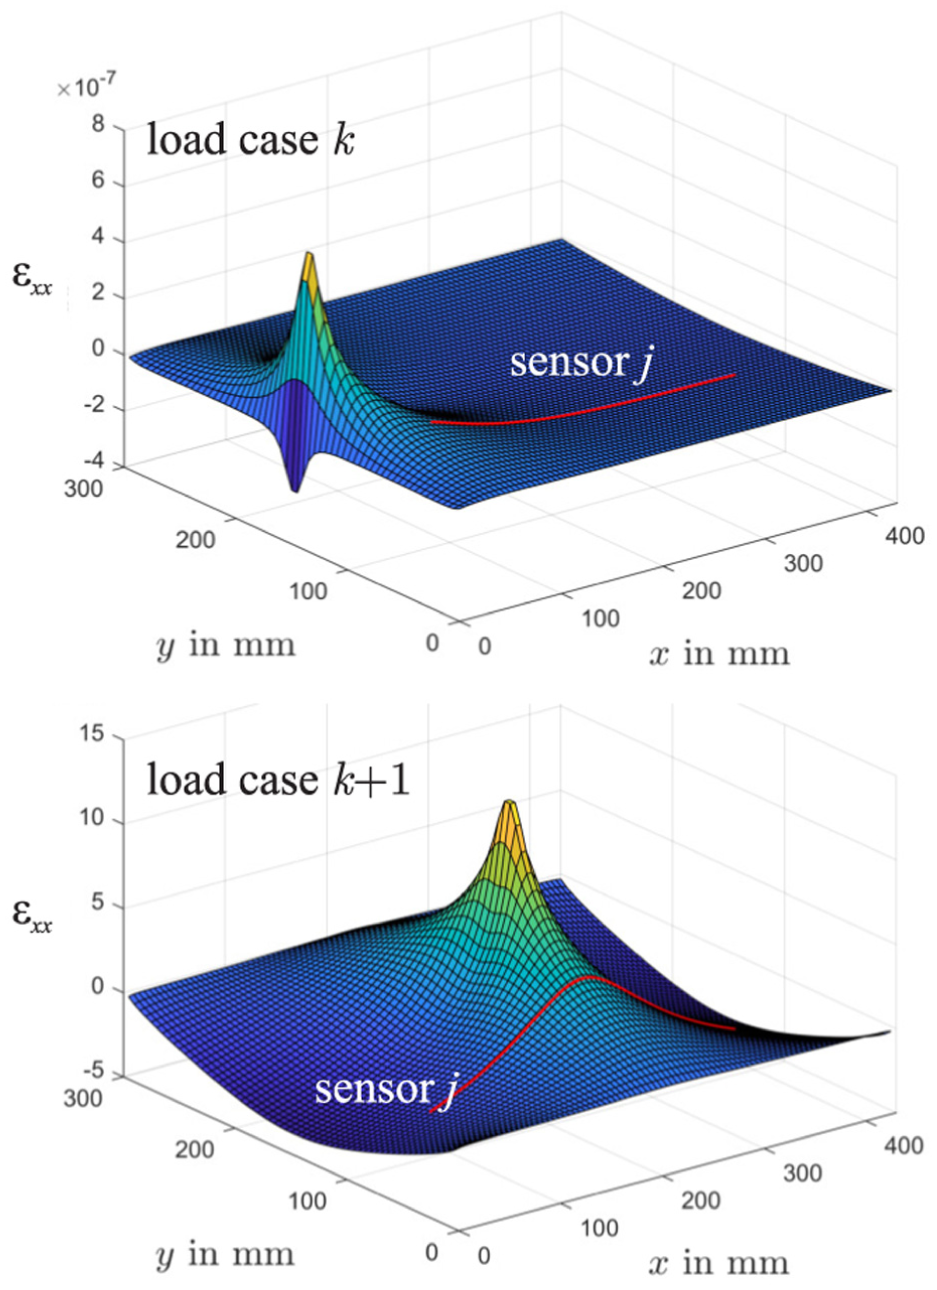
Mechanical strain
The exemplary strain sensor j (elasto-resistive wire) in Figure 6 is oriented in x-direction. Thus, it senses the average of the plotted
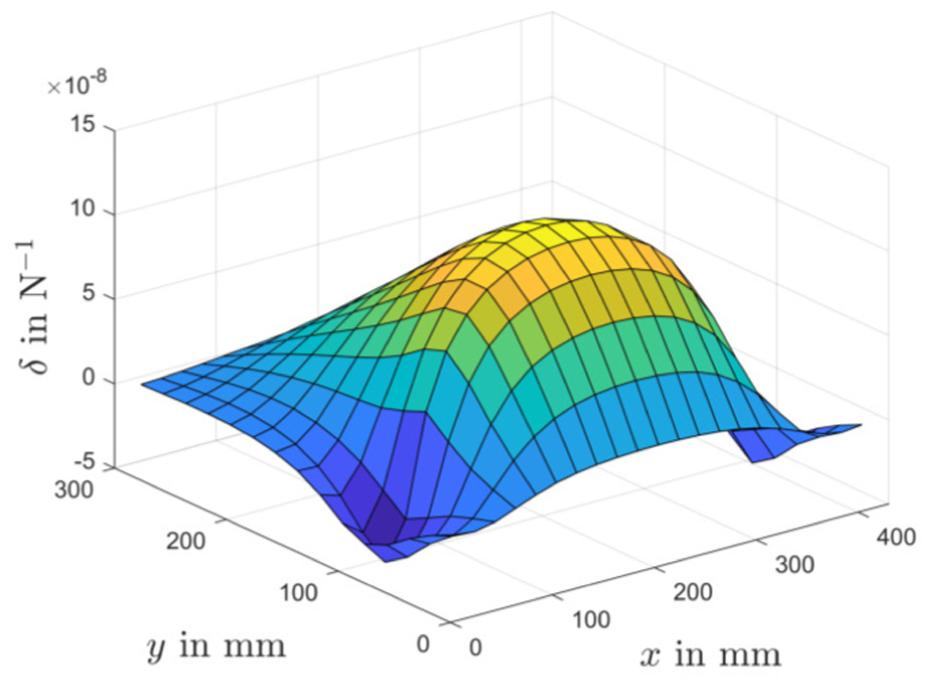
Transfer function
Load evaluation
In the evaluation stage, rapid identification of position coordinates and magnitude of an unknown collision load is achieved by minimizing the error between the evaluation database (represented by transfer functions
In the present research a single compressive load is considered for demonstration of the proposed localization and quantification method. The evaluation can be executed in a two-step or a one-step procedure, depending on the used cost function. An example of a two-step procedure is equation
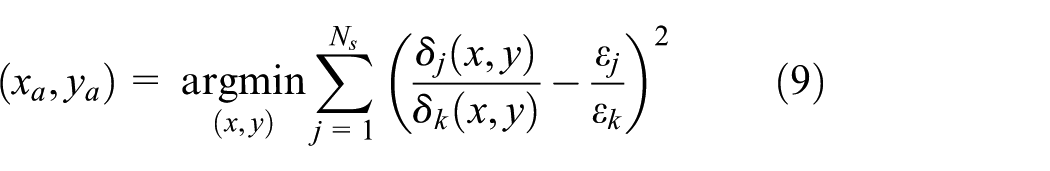
for the approximate identification of the coordinates
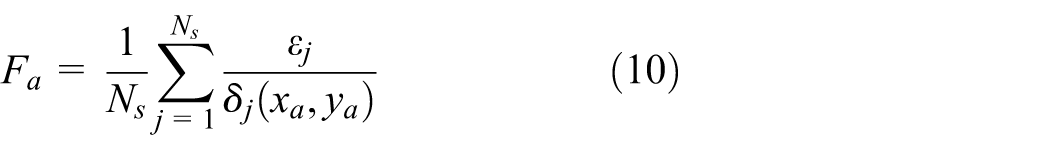
for the subsequent determination of the magnitude of the collision load
An example of an one-step procedure is
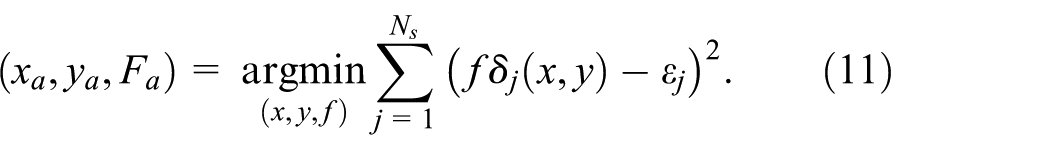
Here, f can be considered as a scaling factor for optimal fit of the transfer functions
Optimization of applied strain sensor system
The sensor system comprises location, extent and orientation of the strain sensors. These data are essential for the performance of the proposed collision load monitoring method. It is therefore highly recommended to optimize the strain sensor system for the given monitoring task. Furthermore, if the mechanical structure has symmetries (reflexive or rotational symmetry) with regard to the distribution of material properties, component geometry and boundary conditions, the strain sensor system can lead to ambiguous identification results.
In order to ensure a unique identification, the entire arrangement, consisting of the mechanical structure (with respect to the distribution of material properties, component geometry, and boundary conditions) and all strain sensors used (with respect to position, length and orientation), must not exhibit common symmetries. In other words, possible symmetries of the assembly of all strain sensors must not coincide with the symmetries of the monitored mechanical structure. Basically, this can be achieved by positioning strain sensors away from symmetry lines of the monitored structure. However, a strain sensor placed along a line of symmetry is uniformly sensitive to possible loads that are randomly distributed in the area of interest. If the advantageous positioning of individual strain sensors along lines of symmetry is therefore used, the remaining strain sensors must be arranged in such a way that all symmetries are broken. For illustration, Figure 8 shows examples of plates with homogeneous properties and boundary conditions that exhibit reflexive or rotational symmetries, and arrangements of three strain sensors (the integral strain measurement is performed along their lines), that do not and do allow unique load identification.
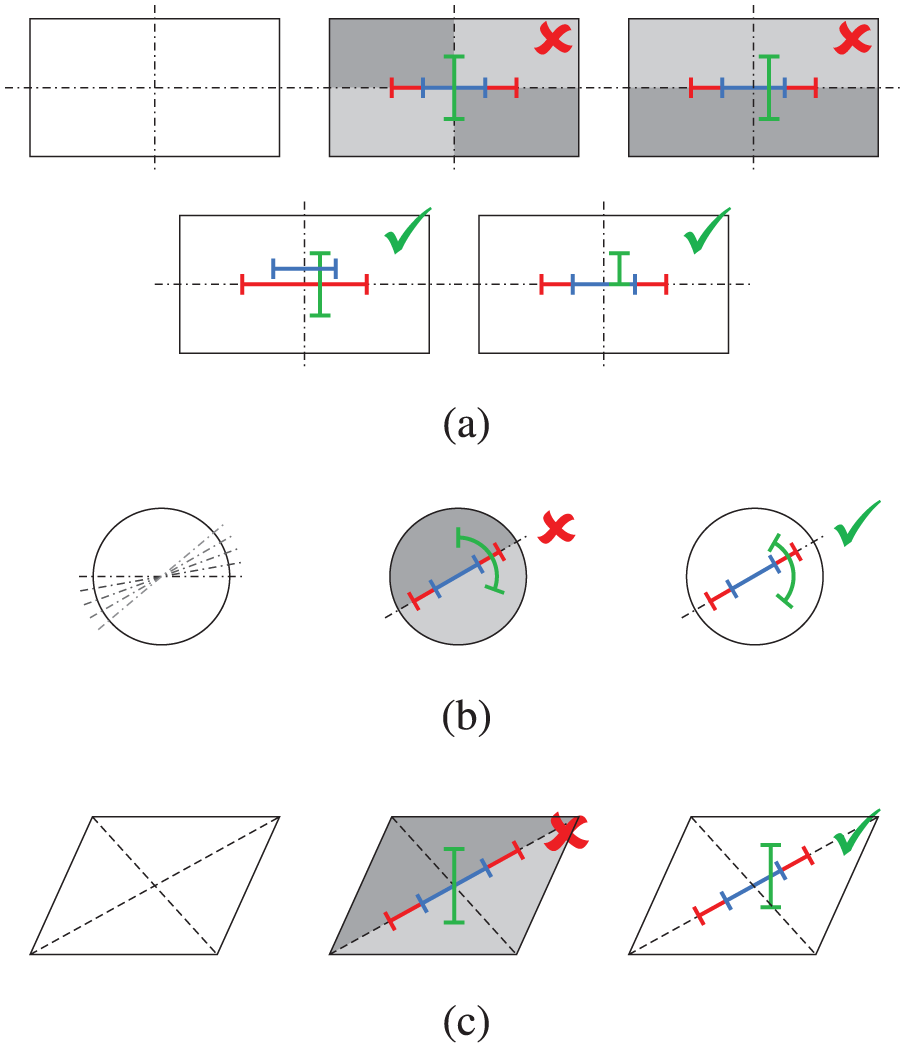
Examples of plates with (a and b) reflexive and (c) rotational symmetry (homogeneous component properties and boundary conditions) with three strain sensors (red, green and blue). The strains are measured along these lines. The left pictures show the plate’s shape and the considered symmetries, followed by pictures of sensor combinations that do not allow unique load identification (symbol ×) as the dark gray areas are symmetrical to light gray areas with respect to both, plate and strain sensors), and pictures of sensor combinations that do allow unique load identification (symbol ✓) (Kralovec and Schagerl, 2024).
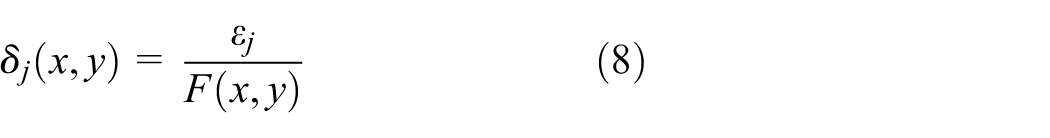
The optimization of location, extent and orientation of the strain sensors can be done by comparing the identification error of different sensor configurations for a number

is defined where
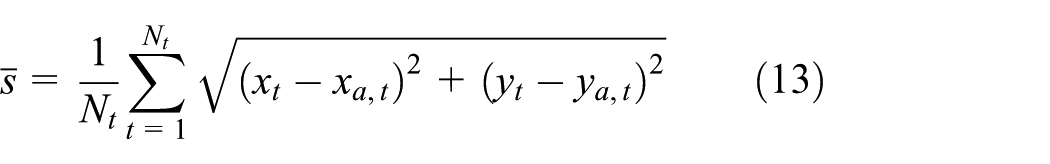
and where
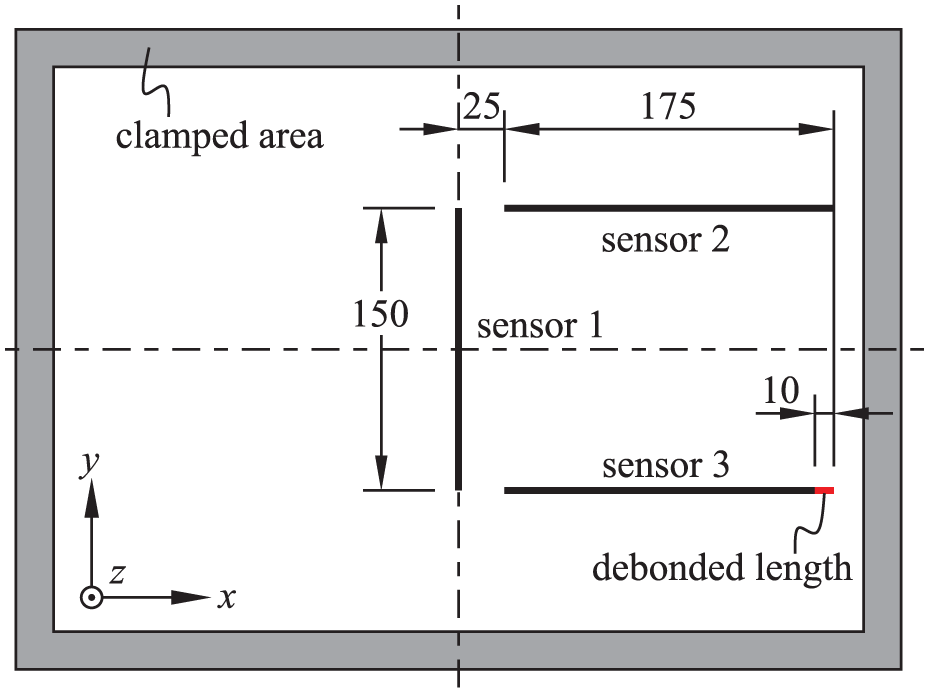
Sketch of the considered plate with applied elasto-resistive wires and debonded part of strain sensor 2; dimensions in mm.
Further details on the strain sensor system optimization see Thaller (2022) and Kralovec and Schagerl (2024).
Experimental investigation
The following experimental investigation demonstrates the proposed, and numerically verified and validated, strain-based collision monitoring method by means of physical tests. Elasto-resistive wires acting as strain sensors are attached with a cold-curing adhesive on the surface of a sandwich plate that was provided by an industrial partner (c.f. Section Considered specimen). An adequate strain measurement equipment is set up and a test rig for controlled mechanical loading is designed.
Then experimental data is generated for the two stages of the evaluation method, that is, the stage of preparatory determination of transfer function and the evaluation stage, as presented in the preceding Section on proposed methods.
Strain measurement setup
The mechanical strain (
Electrical circuit for strain measurement.
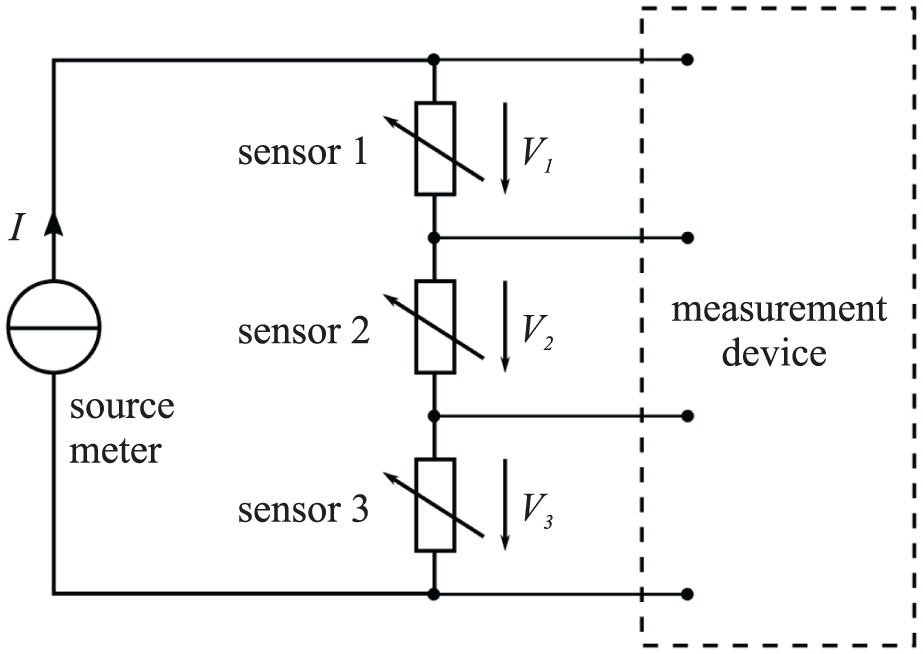
A Keithley 2450 source meter is used as a high-precision current source (DC, 5 mA). The three strain sensors are arranged in a series connection, thus a single current source is sufficient. The electric potential at the strain sensors is monitored by a HBM QuantumX MX840A measurement device (300 Hz sampling frequency; post-processing by moving average over 95 data values). Figure 11 shows a typical measurement signal of a quasi-static loading test after post-processing.
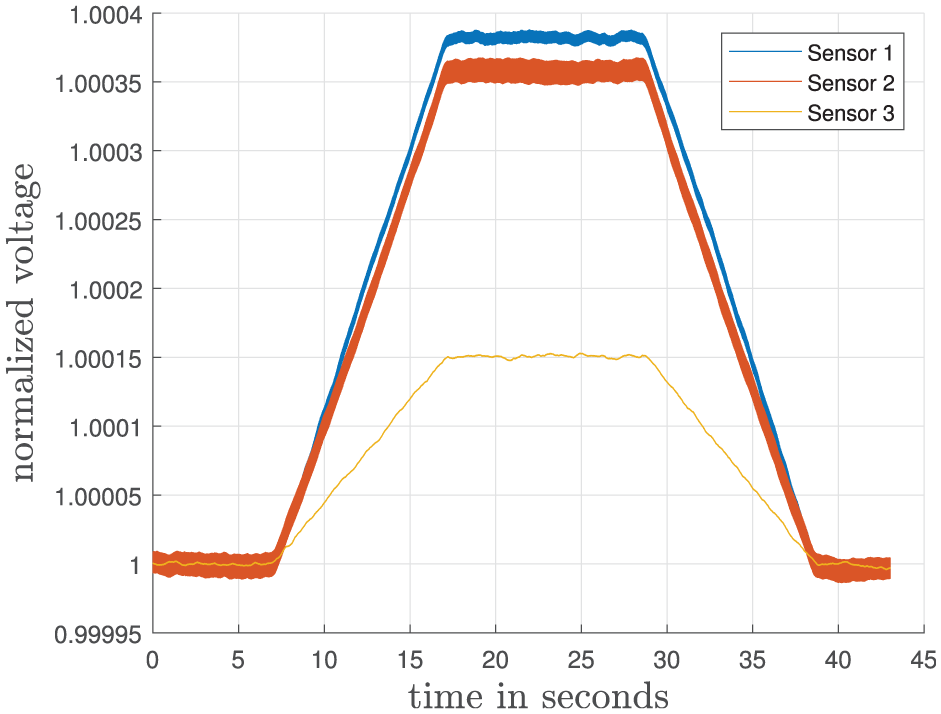
Typical measurement signals of the three elasto-resistive sensors during experimental loading (example: load location
The three strain sensors, that is, the elasto-resistive wires (0.1 mm diameter, 62.4 Ωm−1) are made from Constantan©, a copper-nickel alloy that is widely used for, for example, strain gauges and whose electrical resistance is only slightly temperature-dependent. Possible remaining temperature effects are neglected in the present study due to the constant laboratory conditions during the tests and the compensation due to the used floating evaluation base. To increase the sensitivity of the wires to strain, they are led in two loops along the paths indicated in Figure 9. The wires are bonded to the sandwich plate by Loctite EA 9466 adhesive. Before bonding, they were slightly tensioned for straight alignment. Then the plate surface was masked with a tape in a distance along the wires and an adequate amount of adhesive was applied to cover the wire completely. During curing, planar plates of several kilograms were placed on the wires (separated by Teflon© foil) to press them onto the sandwich face layer. After 12 h curing at room temperature, the tape was removed and the ends of the wires were connected by a strip terminal to the self-designed circuit board that closes the electrical measurement circuit. Figure 12 shows a photographic image of the tested sandwich plate with applied elasto-resistive wires and with the cabling to the measurement device and to the current source via the self-designed circuit board. The plate is mounted into a steel frame which provides clamped boundary conditions.
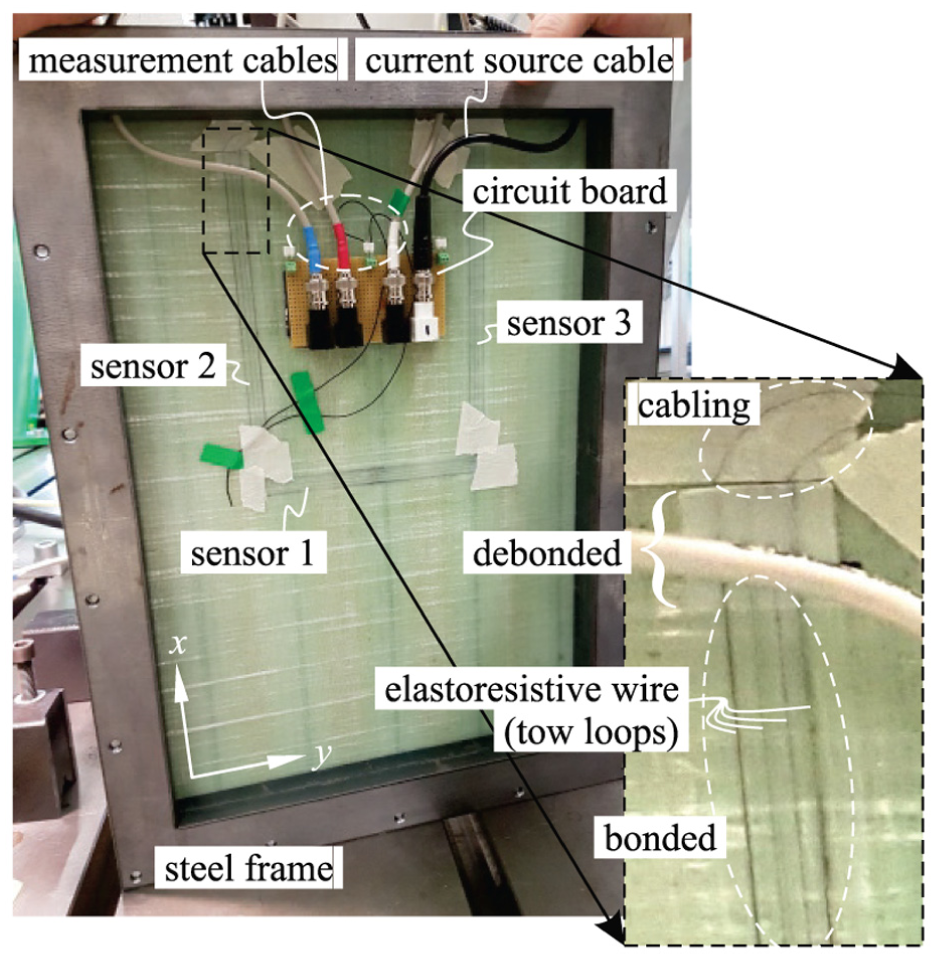
Tested plate in a steel frame with applied elasto-resistive wires and cabling.
Test rig
The test rig for the controlled application of perpendicular loads on the considered sandwich plate includes a massive steel frame that clamps the plate all around with 20 mm clamping width and that lies firmly on the test bed (but is not fixed), and a 25 kN servohydraulic cylinder (Zwick-Roell BPS-LH0025; force controlled by a CATS Control Cube system) with a load cell (Huppert 1010 -BPS-25 kN-5/8″) and a steel head (ball of 50 mm diameter) for load introduction. Figure 13 shows an overview image of the test rig, the specimen (the elasto-resistive wires are located on the unloaded underside), and the connected strain measurement system.
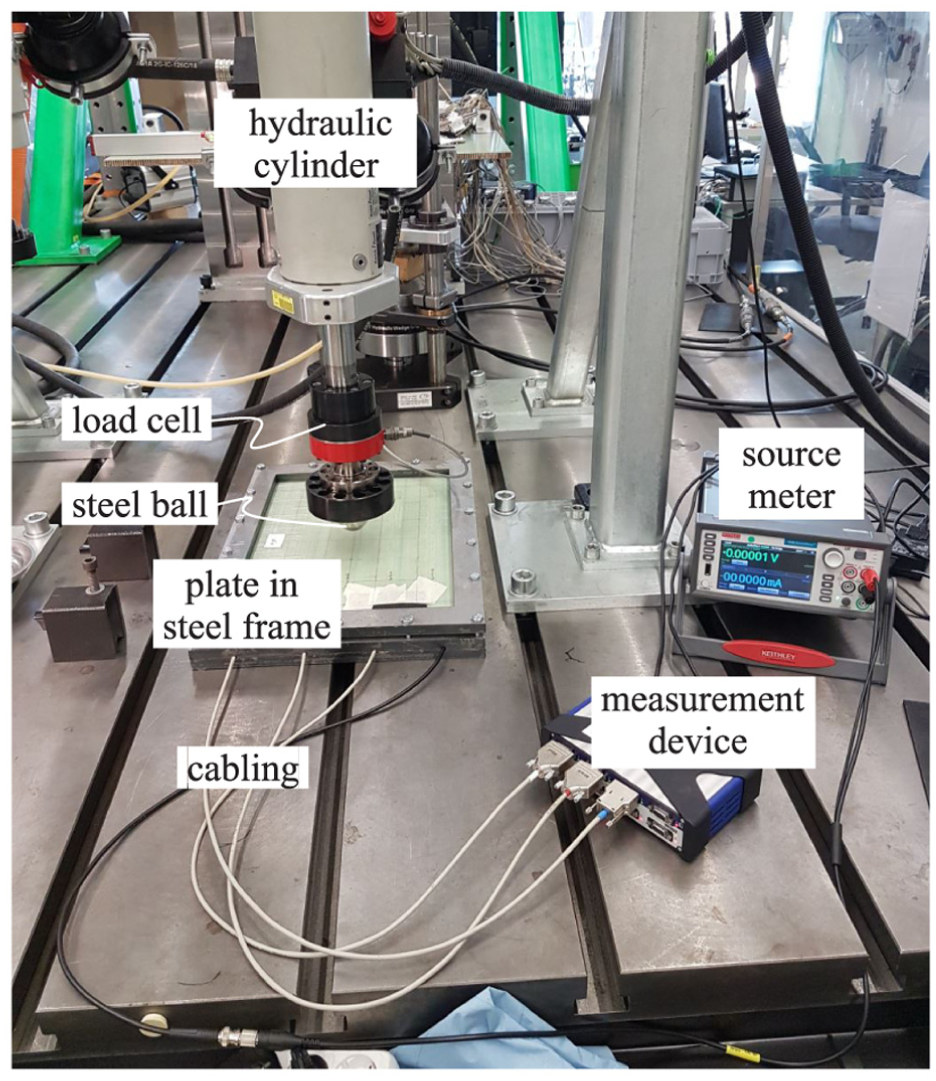
Overview image of test rig for controlled mechanical loading and of the strain measurement system.
Test procedure
The procedure for a single mechanical load test is (i) to position the plate with the defined load application point exactly under the servohydraulic cylinder by using a positioning mandrel, (ii) to exchange the mandrel by the steel ball for load introduction, (iii) to move the steel ball until contact with sandwich surface is given (which is determined by 10 N contact force), (iv) start the strain measurement, that is, the voltage potential measurement, (v) perform the mechanical loading program with a linear ramp up to 800 N in 10 s, hold the load for 10 s, and linear ramp down to 10 N in 10 s, (vi) wait 10 s, and finally (vii) stop the strain measurement.
This procedure is repeated for 35, in a
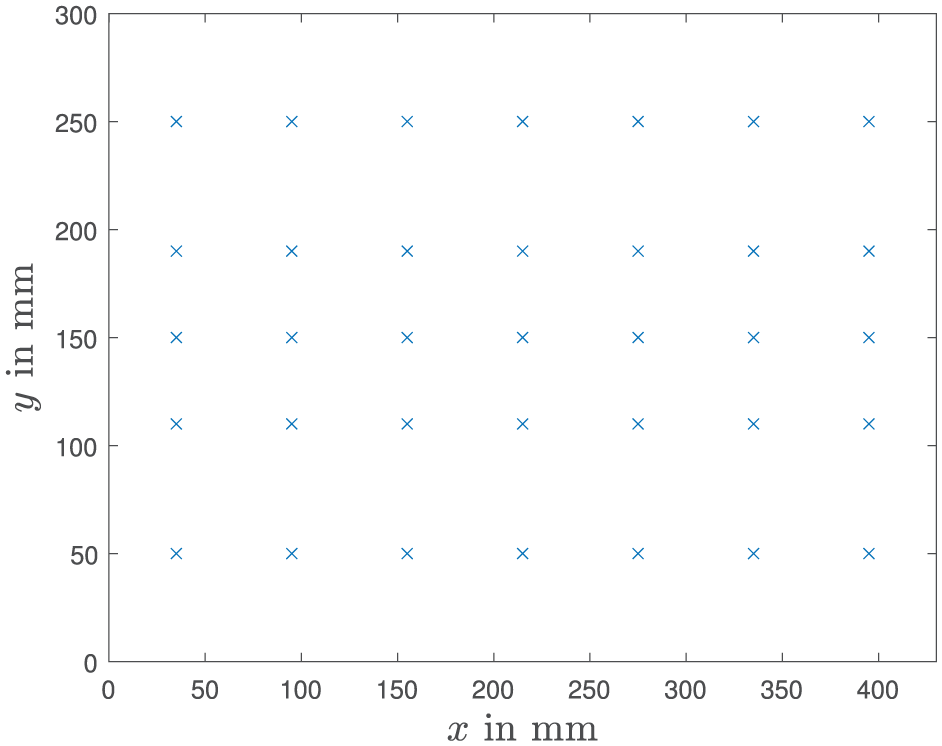
Grid of
Results and discussion
In the following, at first, the transfer functions are determined with specified load cases. The differences between transfer functions determined by simulations and by experimental measurements are discussed and the numerically found transfer functions are calibrated by means of the experiments. At second, the proposed evaluation method to locate and to determine the collision force is numerically and experimentally verified and validated by means of a-priori unknown test load cases.
Determined transfer functions
The three numerically and experimentally determined transfer functions for the three optimally applied elasto-resistive wires (see Figures 9 and 12) are presented in Figure 15(a) and (c), and e. The three numerically found transfer functions are calibrated to the experimentally found transfer functions by scaling factors and Figure 15(c), (d) and (f) show the remaining differences between them. The graphic mesh of both functions indicate the locations of the underlying load application grids. Between the grid nodes the functions are linearly interpolated with Matlab© for better display.
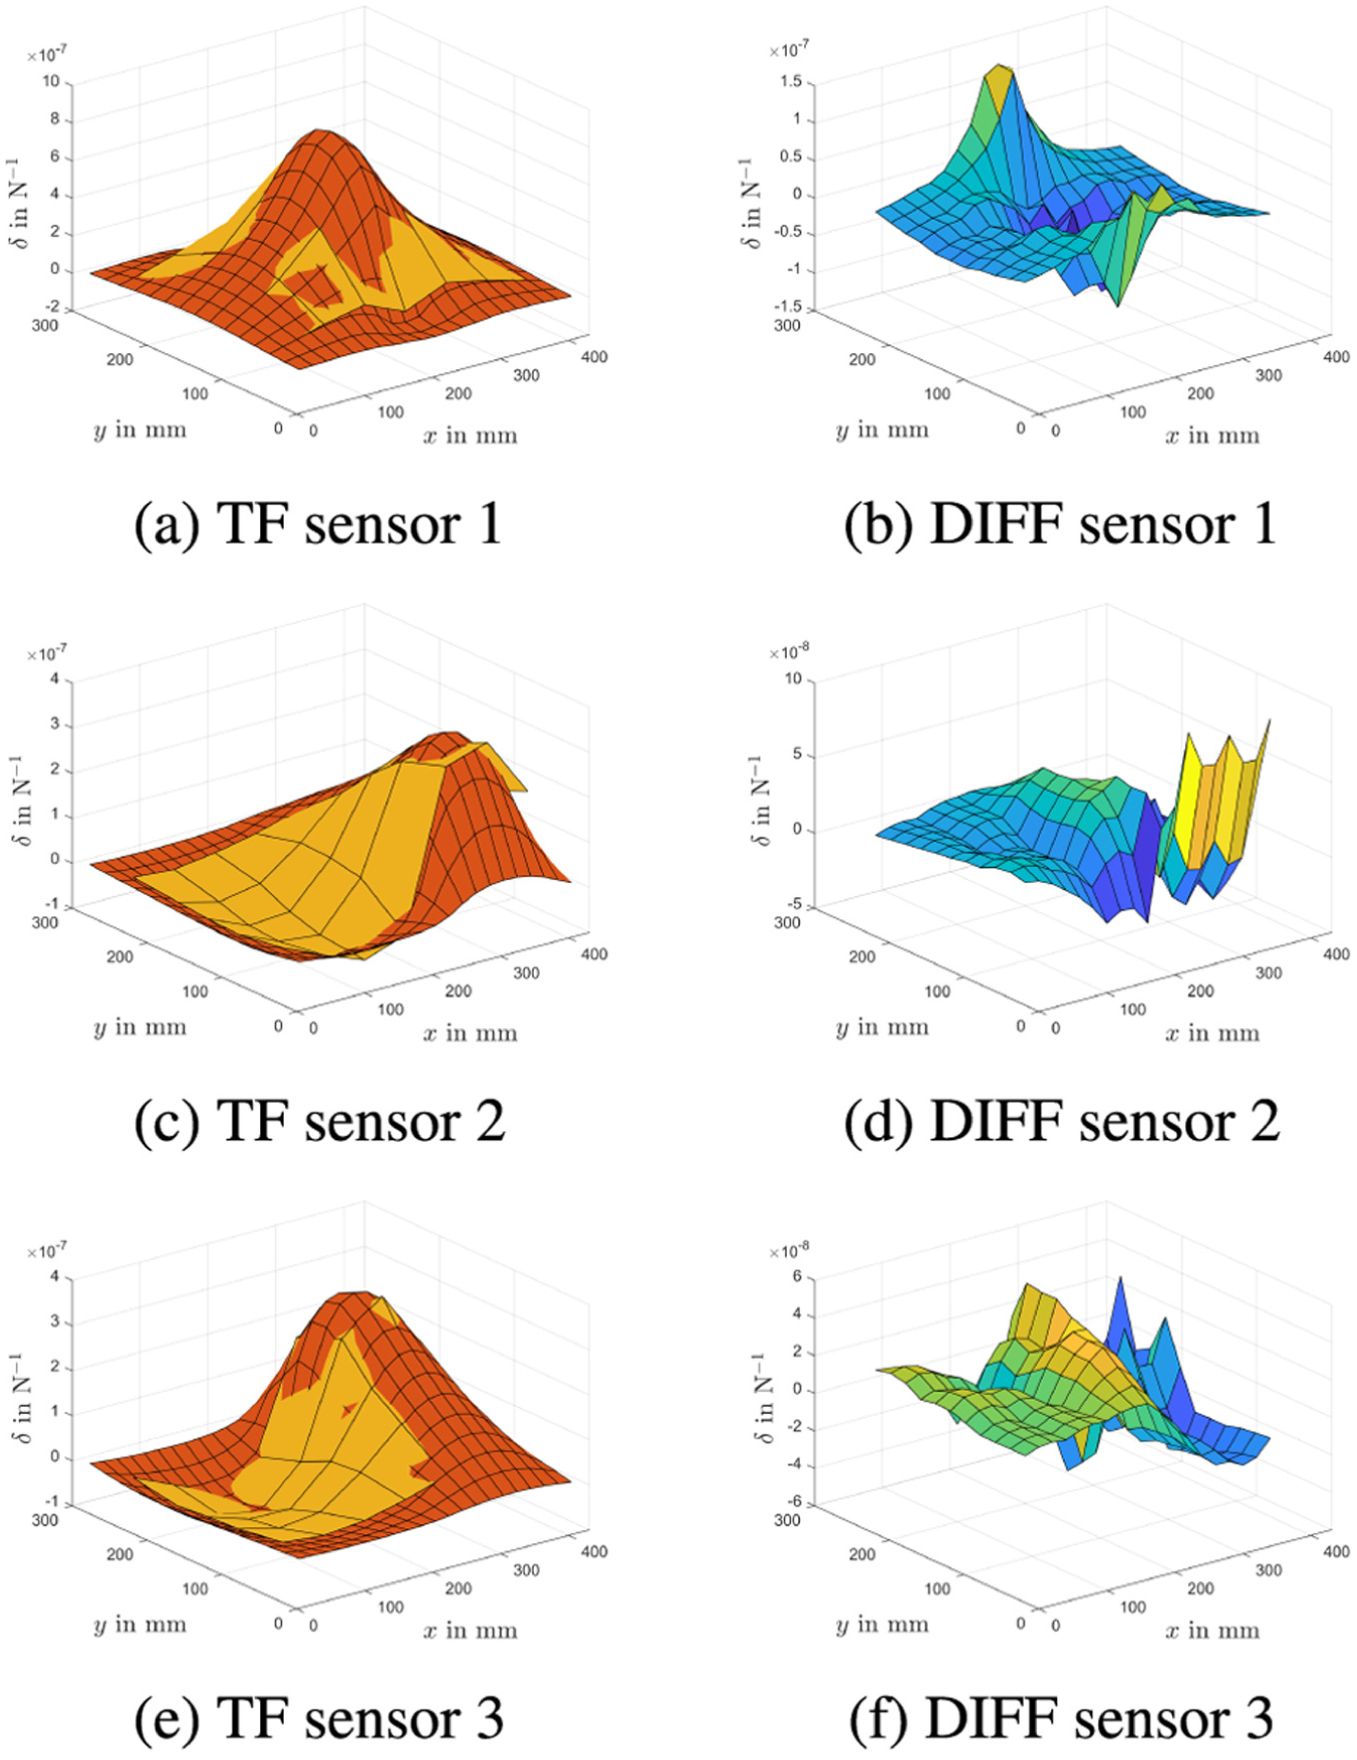
(a, c and e) Numerically found transfer functions (TF, red) calibrated to experimentally found transfer functions (TF, orange), and (b, d and f) difference (DIFF) between these transfer functions remaining after calibration. (a) TF sensor 1, (b) DIFF sensor 1, (c) TF sensor 2, (d) DIFF sensor 2, (e) TF sensor 3, and (f) DIFF sensor 3.
The calibration of the numerical results is necessary to consider the deviation between the nominal and the actual properties (regarding geometry, stiffness, conductivity, boundary conditions, etc.) of the computer model and the test specimen, respectively. As electro-mechanical problem is considered linear a single scaling factor should be sufficient. However, two scaling factors per strain sensor turned out to be appropriate (i.e. six factors in total); one for scaling the positive values and one for scaling the negative values. For this unexpected nonlinear behavior no verifiable reason can be given, but the authors strongly believe that it can be partly explained by the imperfect application of the elasto-resistive wires, that is, by undulation of the wires and by non-homogeneous bonding of the wires to the surface of the plate. The assumption of an imperfect bonding is supported, as during the removing of the masking tape about 10 mm of the adhesive (including the elasto-resistive wire) was accidentally pulled-off from the sandwich (see Figure 12). For the present work, the two scaling factors per strain sensor are calculated by matching the maxima and the minima of the numerically and experimentally determined transfer functions. Table 2 presents the calculated values.
Scaling factors for the transfer functions of the strain sensors for calibration to experimental results.
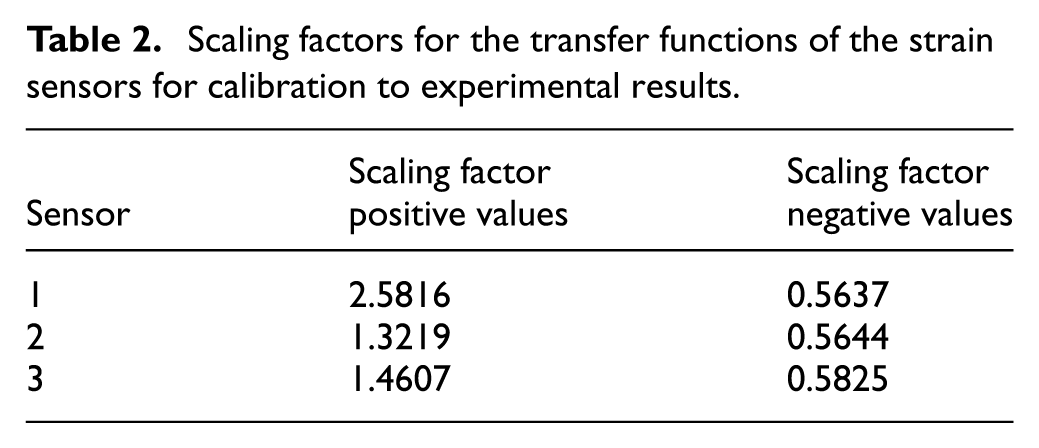
Both, numerically and experimentally found transfer functions clearly show that the sensitivity of the applied strain sensors increases if the load location is closer to the sensor. The maximum sensitivity of a strain sensors is given, if the load is located on the sensor. For strain sensor 1 located along the plate’s center line in y-direction (cf. Figure 9) maximum sensitivity is given if the load is acting at the plate’s center. These findings correlate very well with the analysis present in the introductory Section on strain measurement by elasto-resistive wires for a simple beam.
In principle, the numerically and experimentally found transfer functions show a very similar behavior. However, on a closer look, there are also relevant differences, as depicted in the difference plots in Figure 15(b), (d) and (f). Besides a systematic deviation that increases with the magnitude of the function, in boundary regions an additional strong deviation of the found transfer functions occurs – for strain sensor 3 in the upper sensing area and particularly for strain sensor 2 in the lower sensing area (with respect to y-direction). Examining the experimentally found transfer function in Figure 15(c) this deviation between numerical and experimental results is also clearly shown. One explanation for this result could be a possible sliding of the sandwich panel in the clamping of the steel frame. This can be assumed because the clamping depth of the plate is only 20 mm and the stiffness in thickness direction is low due to the core (cf. Table 1). During the tests, the authors also perceived noises emanating from the clamping due to loading. However, these shortcomings of the mechanical model and the experimental setup should be easily improved in future research and the currently found transfer functions are accurate enough to allow the demonstration of the proposed identification method in the following.
Load identification results
The load identification by the proposed evaluation method for localization and force approximation during collisions with a plate-like structure is verified and validated by simulated and experimentally measured test cases. To verify that the proposed method calculates the correct results and is thus able to identify applied loads, the load cases used to determine the basic transfer functions are evaluated. It can be confirmed for both, the simulated and the experimentally measured load cases, that all load locations and load magnitudes could be reproduced adequately.
For validation the evaluation method is applied to a-priori unknown and spatial randomly distributed test loads (off the load grid used for the determination of the transfer functions) whereby 20 simulated and 10 experimentally measured load cases are considered. The load magnitude in the simulations is always the same, as the absolute value does not affect the result (by cancellation due to the linear nature of model). The load magnitude in the experiments is always 800 N to reliably avoid deterioration or damage of the plate during testing. This load level was also selected in the previous Section for optimization of the applied strain sensor system regarding location, extent and orientation of the strain sensors. Preparatory experiments showed that below 3.5 kN no damage initiation takes place. As the signal-to-noise ratio increases with the loading, the experimental validation with a smaller load is conservative and the detection of relevant higher loads is guaranteed. Figure 16 presents the results of the approximate determination of the position and the magnitude of the loads for the considered numerically simulated and experimentally measured test load cases.
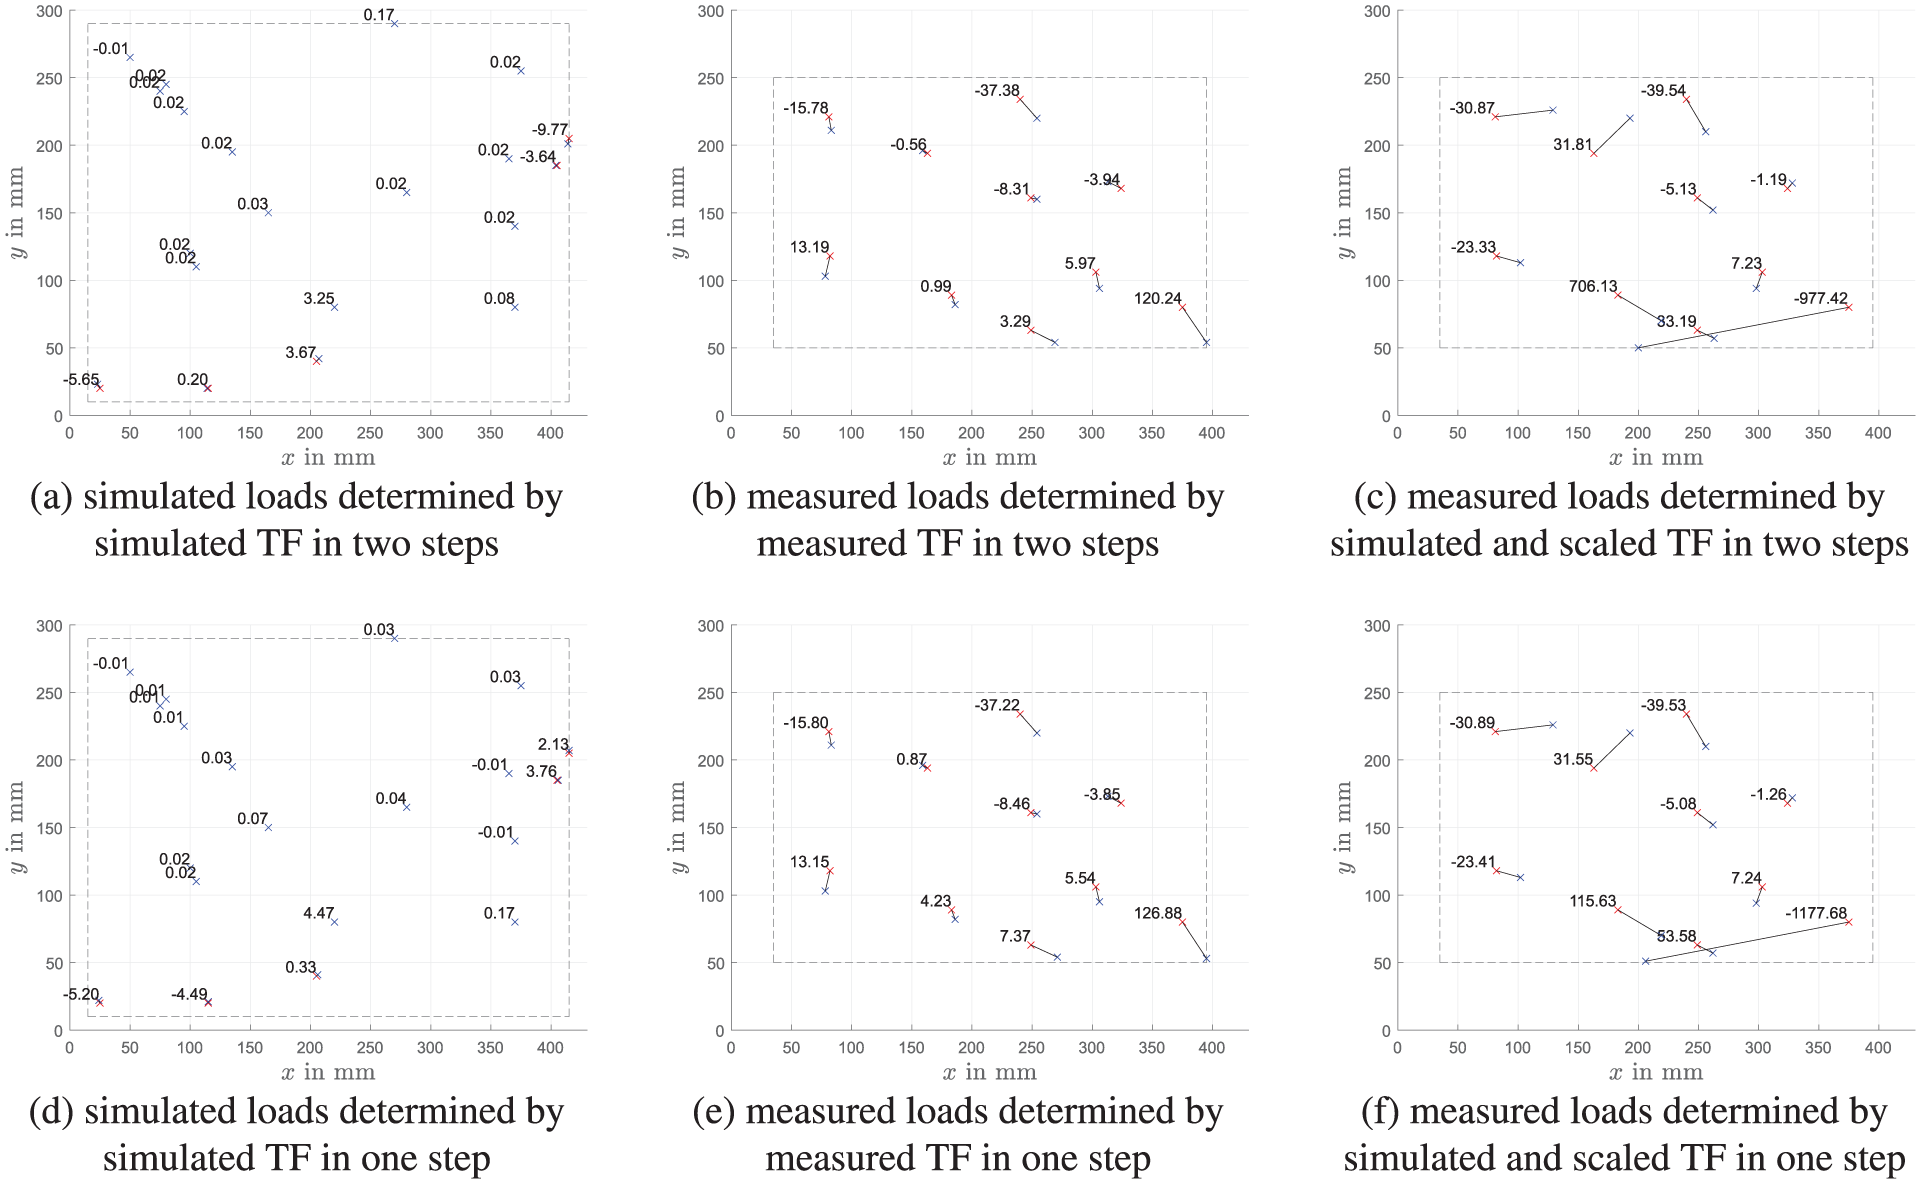
Approximate determination of position and magnitude of the considered test loads by the proposed one- and two-step procedures using differently determined transfer functions (TF). Red crosses mark the approximated positions, blue crosses mark the actual positions. The found and actual positions are connected by a black line indicating the localization error. The numbers indicate the relative error of the approximated forces. The dashed gray frame shows the area considered for load application. (a) Simulated loads determined by simulated TF in two steps, (b) measured loads determined by measured TF in two steps, (c) measured loads determined by simulated and scaled TF in two steps, (d) simulated loads determined by simulated TF in one step, (e) measured loads determined by measured TF in one step, and (f) measured loads determined by simulated and scaled TF in one step.
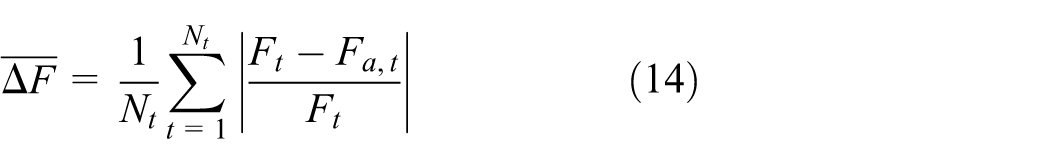
For data evaluation one- and two-step procedures are applied according to equations (9), (10) and (11), respectively. The 20 simulated test load cases are distributed over a large area as indicated by the yellow frame in Figure 16(a) and (d). The 10 experimentally measured test load cases in Figure 16(b), (c), (e), and (f) only allow for a smaller area due to the geometrical size of the experimental load introduction device and the clamping depth in the steel frame (cf. Figure 13). The 10 experimentally measured test load cases are evaluated based (i) on the measured transfer functions (see Figure 16(b) and (e)) and (ii) on the simulated transfer functions that were calibrated to the experimentally determined ones (see Figure 16(c) and (f)). The results in Figure 16 are summarized in Table 3 by the mean values of the localization and magnitude errors according to equations (13) and (14) and by the corresponding standard deviations. The mean
Summary of the load identification results in Figure 16 using the proposed one- and two-step procedures with differently determined transfer functions (TF).
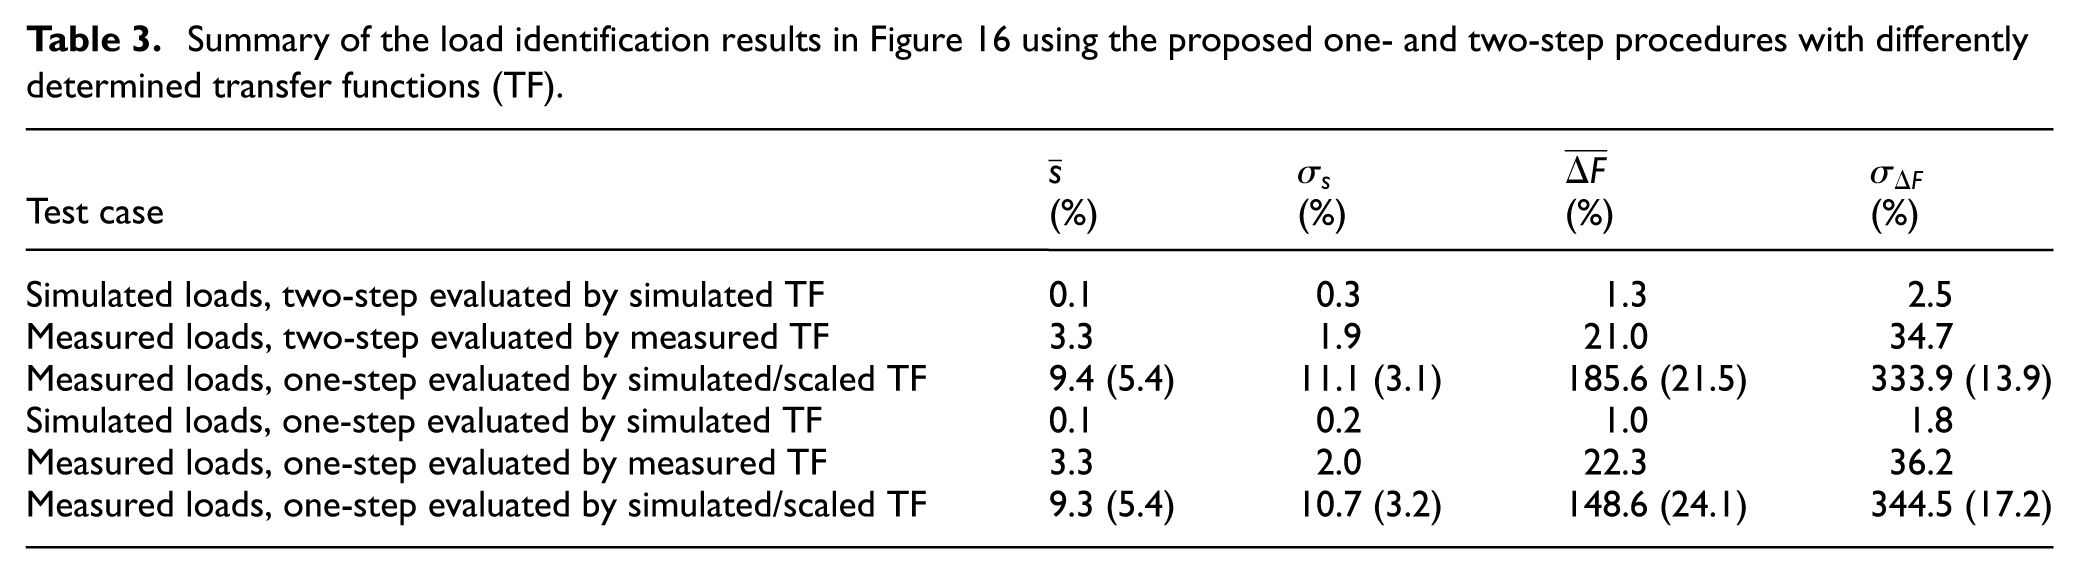
In general, the one-step procedures in Figure 16(a) to (c) and the two-step procedures in Figure 16(d) to (f) show very similar performance for both, load localization and load magnitude determination. The errors for the 20 simulated test load cases in Figure 16(a) and (d) are very small but tend to increase slightly if the load is applied closer to the plate’s boundary. This behavior could be due to the flat shapes and low values of the transfer functions in this area, which presumably have an effect when using the linear interpolation between the grid of the determination points. The results in Figure 16(b) and (e) of the 10 measured test load cases evaluated by measured transfer functions show larger errors for localization and magnitude determination (with a similar tendency to increase toward the plate’s boundary) when compared to the purely simulated data. The larger errors are expected, as measurement noise and other uncertainties (possible sliding in the clamping, imperfect load application, etc.) distort the experiments. Moreover, the mesh size of the load grid used to determine the experimental transfer function is three times as wide (see Figure 15). The results in Figure 16(c) and (f) of the 10 measured test load cases evaluated by simulated transfer functions that are calibrated to the measured transfer functions show a further loss in accuracy. Also this drop is comprehensible, as the simulation-based and the experimental measurement-based transfer functions deviate from each other – particularly near the boundary of the plate and particularly for strain sensor 1 and 2 (cf. Figure 15). However, in view of the already mentioned expectation that an revised model will significantly improve the approximation, the results are considered generally acceptable. Actually, only the two test loads near the boundary at
Conclusions
The current article presented a novel, simple, low-cost and fast method for strain-based collision monitoring of plate-like mechanical structures by means of elasto-resistive wires. These properties make the method a very valuable candidate for application to vulnerable structures in the automotive industry, where economic requirements are typically high. As case example the composite sandwich under-body protection plate of the battery box of an electric car was considered. This plate-like structure must be monitored for deflection and potential damage to guarantee the safe operation of the battery, and thus, of the vehicle.
The proposed method uses a few line-type strain sensors, arranged on the surface of the plate, and transfer functions to relate the measurement signal with the location and magnitude of the collision load. For plate-like structures at least three strain sensors are required to uniquely identify location and magnitude. With a proposed criterion the position, geometric extension and orientation of the line-type strain sensors can be optimized. Furthermore, it was elaborated that the assembly of the mechanical structure (with respect to its geometry and boundary conditions and distributed material properties) and the entity of all applied strain sensors (with respect to position, length and orientation) must not exhibit any common symmetries to ensure unique identification.
The strain sensors used in this research were comparatively long elasto-resistive wires made of a metallic alloy. These simple wires are very cheap, flexible, easy to repair, robust and their application can be integrated into the composite manufacturing process. The required data acquisition device is equivalent to the one used for standard strain gauges, and is thus readily available, affordable, lightweight, and very fast. On hand of the example of a simple beam under bending, it is shown that a elasto-resistive wire provides a balanced sensitivity along its longitudinal extent. Thus, a single line-type strain sensor can monitor larger areas than a conventional strain gauge with comparable sensitivity.
The coordinates and magnitude of the unknown low-velocity, high-magnitude (i.e. quasi-static) collision load are determined by minimizing the error between the evaluation database (represented by transfer functions) and the strain measurement values of the involved sensors. Two possible approaches are proposed, either in two steps using ratios of strain measurements to each other or in one step using the absolute values. The compilation of the evaluation database by means of numerical simulation is presented in detail with a finite element model of the considered under-body protection plate.
The proposed method is verified and validated by both, simulated and experimentally measured results. The verification is performed by identification of a-priori known load cases (which are the load cases that where used to determine the transfer functions). All known simulated and experimentally tested load cases are correctly identified.
The validation is performed by 20 numerically simulated and 10 experimentally measured loads that are a-priori unknown and whose application points lie off the grid used for the determination of the transfer functions. Summarizing all simulated test loads evaluated by simulation-based transfer functions, the mean localization error, that is, the mean position deviation with respect to the plate’s length is only 0.1%. The mean deviation of the identified load magnitude with respect to applied magnitude is 1.3%. For the experimentally measured test loads evaluated by experimentally determined transfer functions, the mean localization error is 3.3% and the mean error of the identified load magnitude is 22.3%. The loss of accuracy compared to the purely simulation-based validation can be explained by the five times smaller evaluation database (i.e. the load cases used to determine the transfer functions in the experiments), and furthermore by measurement noise and other experimental uncertainties. For the experimentally measured test loads evaluated by simulation-based transfer functions that are calibrated to fit experimental data, the mean localization error is 9.4%. The mean error of the identified load magnitude reaches the initially unsatisfactory value of 185.6%. This further significant loss in accuracy can be explained by the differences between the finite element model and the experimental setup. In particular, the assumed model of rigid clamping at the plate boundaries seems not to be applicable. This conclusion is supported by perceived noises emanating from the clamping during the experimental loading. However, as the accuracy drop is mainly driven by poor results of only two test loads (both located where the simulation-based and measurement-based transfer functions most deviate from each other) their neglect significantly improves the mean errors for position and magnitude to 5.4% and 24.1%, respectively.
Thus, the results show that the proposed strain-based collision monitoring method for plate-like mechanical structures can be efficiently realized with sufficient accuracy by determining the required transfer functions first by numerical simulation, and then calibrate these transfer functions to the specific structure by a few number of experimental measurements (e.g. at the positions of the maximum and minimum of the simulation-based transfer functions). The method’s performance can be easily improved by a larger evaluation database (density of load cases for transfer function determination) or by the application of more advanced models. In the current version, the proposed method is well applicable for quasi-static loads, as they are given for collisions with high loads on a vehicle under-body. In practical application the assessment of damage can be implemented by critical load magnitudes available from preceding structural strength tests, that is, if the identified load exceeds a certain predefined value a damage is assumed and the vehicle is send to a workshop for inspection. However, the method also includes the knowledge of structural deformation, the limitation of which is a requirement for under-body protection plates of electric vehicles and which offers the possibility to implement energy criteria. First evaluation results of tests with other intermediate-velocity impact loads on the structure under consideration – as could occur during fast driving – are very promising and should be easily improved with model-based compensation of dynamic effects. In view of this far-reaching application potential, the proposed method has recently been patented (Kralovec and Schagerl, 2024). Future research will improve the proposed method and the underlying simulation models so that dynamic impact loads and the corresponding deformations can also be determined accurately. In the course of these investigations, the robustness of the proposed method against environmental conditions such as temperature and moisture will also be further validated.
Footnotes
Funding
The authors disclosed receipt of the following financial support for the research, authorship, and/or publication of this article: The research received funding from the European Union’s Horizon 2020 research and innovation program under grant agreement No. 101006952. The financial support by the Austrian Federal Ministry of Labour and Economy, the National Foundation for Research, Technology and Development and the Christian Doppler Research Association is gratefully acknowledged.
Declaration of conflicting interests
The authors declared no potential conflicts of interest with respect to the research, authorship, and/or publication of this article.
Data availability statement
Data sharing not applicable to this article as no datasets were generated or analyzed during the current study.