
Abstract
The phase transformation of thermal shape memory alloys (SMAs) can be described by surfaces in a temperature-stress-strain space. A novel experimental technique for the thermomechanical characterization of thin SMA wires allows to scan these surfaces with high resolution. Each experimental run uses a sequence of experimental conditions to traverse the phase transformation surfaces on a different path from “full martensite” to “full austenite” and vice versa. At all times, stress and strain are kept within the limits specified for the use of the SMA wire in actuators. The wire is heated externally through a silicon oil bath, which ensures a controlled and homogeneous temperature of the specimen. The experimental setup is designed to minimize the impact of the large oil temperature variations on measurement results. Experimental results are shown for both mechanical contraction and electrical resistance, each of which forms consistent surfaces for the phase transformation. Measurements for external heating in the oil bath are compared to electrical heating in air.
Keywords
1. Introduction
1.1. Motivation
Nickel-titanium-based shape memory alloys (SMA) are easily deformed at low temperatures, but will recover their original shape when heated. The shape memory effect is due to a crystallographic reversible phase transformation between the low-temperature martensitic phase and the high-temperature austenitic phase of the material (Kumar and Lagoudas, 2008). SMA actuators are making their way into many application fields, such as automotive (Jani et al., 2014; Shreekrishna et al., 2023), aerospace (Costanza and Tata, 2020), robotics and medical devices (Auricchio et al., 2021; Motzki et al., 2019; Sohn et al., 2018), and consumer electronics (Kazi et al., 2018; Schwegler et al., 2022). Most actuators are based on SMA wires because of their high energy density, light weight, noise-free operation, and ease of miniaturization. SMA wires also change their electrical resistance with their shape, so they can be used simultaneously as actuators and sensors.
In recent years, there has been a general trend from simple “binary” SMA actuators moving between two distinct positions to more complex actuators for precise positioning (Honold et al., 2021; Raab et al., 2021; Williams and Elahinia, 2008). One of the main challenges when designing actuators for precise positioning is the highly non-linear and hysteretic behavior of the SMA material. To optimize actuator performance already early during development, models are needed that accurately describe the complex behavior. Accurate models are also required for model-based actuator control. The actuators will operate mainly in the transition regime between the martensitic and austenitic material phases, where large changes in strain and resistance can occur with minor variations of temperature and stress. Therefore, an accurate description of the mechanical contraction of the wire and its electrical resistance during phase transformation is required.
Clearly, models will only be as accurate as the experimental data to which they are calibrated. The dependence of wire contraction on temperature and stress is not simple, as the geometric shape of the hysteresis will not always be symmetric (Fumagalli et al., 2009) and may also vary with stress (Kazi et al., 2021). On the other hand, minor differences between SMA wires with different alloy compositions or heat treatments should be identified. Potential variations between different wire diameters, between and within production batches, and changes in wire characteristics over a lifetime are also of interest and should be quantified.
1.2. SMA characterization techniques
Shape memory alloys are characterized by subjecting test specimens to defined thermomechanical inputs while recording the material response. As the alloys have a non-linear and hysteretic behavior and experimental results depend on the load history, characterization will often involve sophisticated techniques and equipment. Hartl and Lagoudas (2008) describe a general process for characterizing key material parameters of SMA specimens. Differential scanning calorimetry (DSC) is used to identify transformation temperatures and latent heat under zero-stress conditions. An experimental condition varies strain at different constant temperatures to analyze Young’s moduli of the martensitic and austenitic material phases and the available transformation strain. A second experimental condition varies the temperature at two force levels to investigate the dependence of transformation temperatures on the applied stress. However, the identified material parameters provide only limited quantitative information on the mechanical contraction of an SMA wire for a given temperature and stress level.
Churchill et al. (2009a) suggest to explore the relationship between SMA wire temperature, stress, and strain in more detail with a larger number of experimental runs. They mainly rely on experiments conducted at constant wire temperatures. High test loads of up to 800 MPa are applied to achieve a complete stress-induced phase transformation. However, overloading an SMA wire may induce functional fatigue, thus changing its material parameters (Rao et al., 2015). Other research groups prefer to characterize the phase transformation by varying the temperature at different force levels (Fumagalli et al., 2009; Lynch et al., 2016). Yet, this approach also has limitations. At high-stress levels, the applied temperatures are often insufficient to achieve complete phase transformation to austenite. If the phase transformation to martensite starts from this point, inner hysteresis loops are characterized rather than the outer hysteresis loop. At lower wire temperatures, there is again a risk of overloading the SMA wire due to a combination of high stress and high strain.
1.3. Adjusting SMA wire temperature
Both Hartl and Lagoudas (2008) and Churchill et al. (2009a) employed commercial mechanical testing machines in their experiments. However, such devices are too coarse to test the thin SMA wires with diameters less than 200 µm typically used in SMA actuators. Experimental setups for the thermomechanical characterization of thin SMA wires are mostly custom-designed. The most basic concept decision for a custom-designed setup is how to adjust the SMA wire temperature.
A common way of adjusting the SMA wire temperature is electrical ohmic (Joule) heating (Furst and Seelecke, 2012; Nascimento et al., 2006; Song et al., 2011). However, it is not possible to directly measure the exact temperature of thin SMA wires, as attached thermocouples would significantly affect the temperature of the wires. It is also challenging to keep the wire temperature stable over time, as small changes in convection conditions can present a significant disturbance. Furst (2012) pointed out that heat conduction at the fixation points of the SMA wire will lead to a non-uniform temperature distribution over the length of the wire. Thus, at higher SMA wire temperatures, a mixture of phase compositions will be characterized rather than a single well-defined phase composition.
The SMA wire specimen can also be heated and cooled in an environmental air chamber (Iyer and Hubert, 2022; Prahlad and Chopra, 2003; Sahli and Necib, 2014). However, the thermal coupling between air and wire is relatively weak. When conducting experiments at a constant temperature, low strain rates must be maintained to ensure that latent heats will not cause undue heating or cooling of the wire during phase transformation (Churchill et al., 2010).
The most precise method to control SMA wire temperature is to immerse the specimen in a liquid bath (Schiedeck, 2009; Tsoi et al., 2004). As a result of the high heat capacity of the liquid, the SMA wire temperature will follow the liquid temperature closely. Silicone oils are well suited as liquids, as they can be heated well beyond 150°C. The main drawbacks of temperature control via an oil bath are the technical effort and the fact that heating and especially cooling of the oil may take long periods.
1.4. Objectives
This study aimed to develop an experimental method and setup for collecting high-resolution data on temperature, stress, strain, and electrical resistance of thin SMA wires during phase transformation. The temperature of the SMA wire was to be precisely controlled and uniform over the length of the SMA wire. Therefore, it was decided to control the SMA wire temperature through a silicone oil bath. The results from heating the SMA wire in an oil bath were to be compared with Joule heating in air.
Characterization experiments were to reflect all states that an SMA wire will typically encounter when used in an SMA actuator, with a particular focus on the hysteresis region. Experiments were to characterize a single SMA wire specimen, as even individual variations between SMA specimens from the same production batch may be significant (see experimental results shown by Hartl and Lagoudas (2008)). Empirical evidence in the authors’ laboratory indicates that a combination of high strain and high stress can not only lead to lengthening of an SMA wire, but may also change its other parameters such as transformation temperatures within very few loading cycles. Therefore, care had to be taken not to overload the SMA wire specimen during the experiments.
2. Experimental method
Already in 1990, Liang and Rogers (1990) described the phase transformation of shape memory alloys as a surface in temperature-stress-strain space. For the phase transformation from “full martensite” to “full austenite” (M2A), every point on the M2A surface describes a specific state the SMA wire can assume during this transformation. A second A2M surface can be drawn for the transformation from “full austenite” to “full martensite” (A2M; see Figure 1). Note that in the context of this article, the designations “full martensite” and “full austenite” do not refer to any crystallographic conditions, but to the extreme states that an SMA wire in an actuator may encounter during its operation.
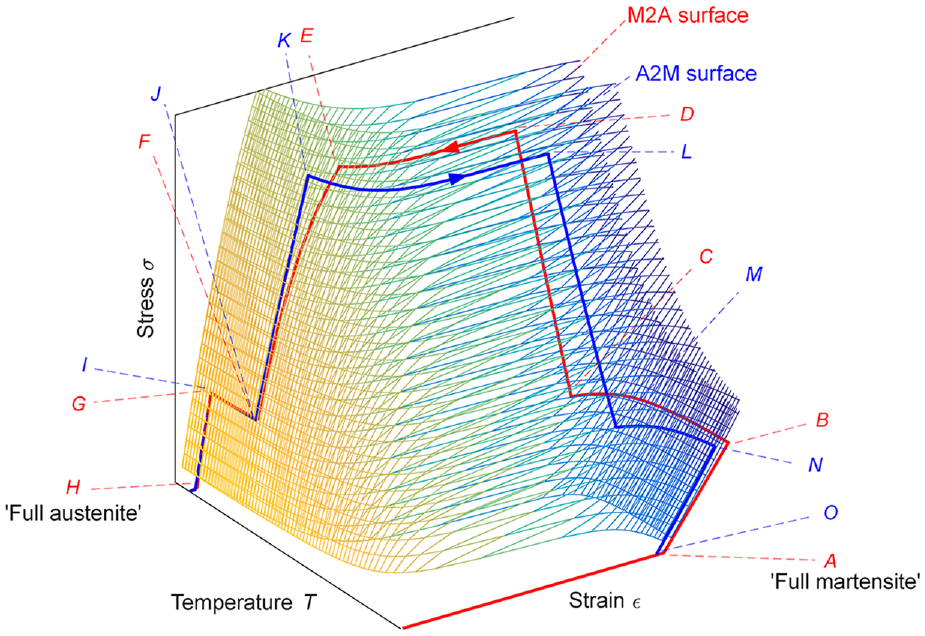
Three-dimensional surfaces describing the SMA phase transformation from “full martensite” to “full austenite” and vice versa. The solid lines illustrate the combination of experimental conditions in one experimental run (red: heating; blue: cooling).
Phase transformation surfaces contain comprehensive information not only on material parameters, but also on wire strain as a function of temperature and stress. This information is very useful for parametrizing and validating phenomenological SMA models, which typically incorporate mathematical expressions relating the martensic phase fraction to the stress and temperature of the wire. This relation can be directly derived from phase transformation surfaces obtained from characterization experiments by applying the inverse model of the stress-strain relationship (Kazi et al., 2021). Yet, phase transformation surfaces provide a quantitative overview of SMA wire behavior which is valuable beyond modeling: they can be used to compare and assess different SMA alloy compositions or heat treatment methods, variation between SMA wire production charges, variation of SMA wire behavior over its life time, etc.
The goal of the experimental method suggested in this article is to “scan” the phase transformation surfaces of an SMA wire systematically while avoiding overloading it. The method combines different experimental conditions in an experimental run to ensure a complete phase transformation from “full martensite” to “full austenite” and vice versa. Only for complete phase transformation can experimental data be expected to form consistent M2A and A2M surfaces. Several experimental runs are combined to scan the transformation surfaces at high resolution in specific regions of interest.
The experimental conditions used in the experimental runs are
(1)
(2)
(3)
The ConstL condition has rarely been used for characterizing SMA wires. Yet, it can provide valuable data, particularly on the hysteresis region, and it is instrumental to avoid overloading of the SMA wire.
The red path shown in Figure 1 illustrates how a complete phase transformation to austenite is achieved without overloading the SMA wire by combining the three experimental conditions:
Experiments start with a cold (i.e. martensitic) SMA wire in state “A”. The wire is placed under a small constant load so its contraction can be traced (ConstT until state “B”).
At a constant force, the temperature is now increased until the target strain is reached (state “C”). The experimental setup is now switched to ConstL mode. While the temperature increases further, the force of the wire will increase until a defined threshold stress is reached in the state “D”. The wire strain in “C” will have to be set so that at the target stress level in “D”, no overload of the SMA wire will occur.
In state “D”, the experimental setup switches back into ConstF mode. The temperature is further increased, and the contraction of the SMA wire is recorded until a threshold temperature is reached in state “E”. The SMA wire will now be largely austenitic—yet not fully—as transformation temperatures have increased due to the stress level in the material.
To achieve complete phase transformation to austenite, the wire stress needs to be reduced. The experimental setup is switched to the ConstT mode, and the wire tension is reduced until only a small force remains in state “F”.
If the threshold temperature in “E” is below the maximum temperature, the experimental condition will be switched back to ConstF. The temperature is increased further until the maximum temperature is reached in state “G”. The wire is then fully relaxed until “full austenite” is finally reached in state “H”.
The blue path in Figure 1 shows the reverse route from “full austenite” back to “full martensite” through a sequence of experimental conditions: ConstT (“H” to “I”), ConstF (states “I” to “J”), ConstT (“J” to “K”), ConstF (“K” to “L”), ConstL (“L” to “M”), ConstF (“M” to “N”) and again ConstT (“N” to “O”).
In the figure, every section of the experimental run from “A” to “H” explores a part of the M2A phase transformation surface. Every section from “H” to “O” will be located on the A2M phase transformation surface. All recorded data can be used to characterize the SMA wire. Thus, the approach also avoids unproductive test times – which becomes an essential factor in the face of the long periods required for heating and cooling of an oil bath. By modifying the threshold values for the strain in state “C”, the stress in “D” and the temperature in “E”, the path of the experimental run can be flexibly adjusted to explore different parts of the phase transformation surfaces. The length of the SMA wire specimen in state “H” can be compared with its length in subsequent experimental runs. If no lengthening is observed, this indicates that the SMA wire has not been overloaded during the experiment.
3. Experimental setup
3.1. Requirements
The experimental setup was designed to characterize thin SMA wires with diameters ranging from 50 to 200 µm. After a future reconfiguration, the experimental setup shall also characterize wire diameters down to 25 µm. The length of the SMA wire specimen directly impacts the required size of the oil bath and thus the times required for heating and cooling. An SMA wire length of 100 mm was considered a suitable compromise between oil bath size and expected contraction of the SMA wire.
To realize the experimental conditions specified in the preceding section, the experimental setup must work under temperature control, force control, and position control, and switch between these modes without becoming unstable. The relevant wire stress level for actuator operation ranges between 100 and 400 MPa. The required wire force was derived from a maximum stress level of 400 MPa in a large diameter (200 µm) wire. The maximum experimental strain of the SMA wire was to be 5%, which also defined the minimum stroke.
The relevant temperatures for the characterization of the SMA wires are defined by the transformation temperatures. Typical values for SMA actuator wires range from 55°C (Martensite finish “Mf” temperature at 100 MPa) to 125°C (Austenite finish “Af” temperature at 400 MPa) (see SAES Getters, 2020). Following the recommendation of the SMA wire manufacturer, the maximum oil temperature was limited to 150°C to avoid overheating. 30°C was defined as the minimum temperature of interest.
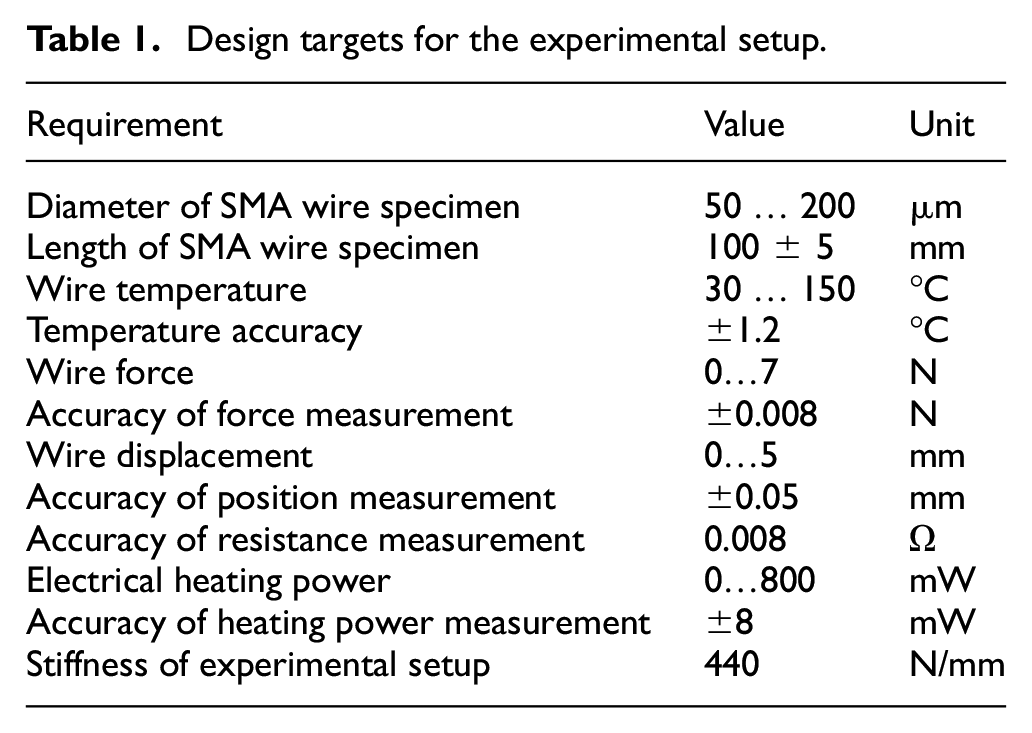
The specification of the measurement accuracy for wire temperature, stress, strain, and electrical resistance was not based on the maximum values of the respective variables in the setup. Instead, the expected variation for SMA wires in the specified diameter range was used as a basis, which produces more stringent requirements. An accuracy of 1% of the expected range of variation was considered adequate. The minimum wire diameter of 50 µm was considered to define the precision of force measurement. For the electrical resistance of the SMA wire, a specific resistance of 9 × 10⁻⁷ Ω m and a variation of 15% during phase transformation were assumed. For the precision of the resistance measurement, the maximum diameter of the SMA wire of 200 µm was considered. Table 1 summarizes the design targets for the experimental setup.
Design targets for the experimental setup.
This project focused on controlling the temperature of the SMA wire through an oil bath. However, comparing external heating to standard Joule heating of SMA wires in air was also of interest. Therefore, the experimental setup should provide means to perform experiments with both the SMA wire heated in an oil bath and electrically heated in air. For Joule heating, an existing custom-designed SMA power controller was to be used.
A final aspect concerns the mechanical stiffness of the experimental setup. Ideally, the stiffness of the setup should be several orders of magnitude higher than that of the characterized SMA wire so that it will not affect the experimental results. However, this is not a firm requirement, as a known stiffness can be compensated numerically in the measured data. The stiffness of the experimental setup was defined to be at least 20 times higher than the stiffness of a large austenitic diameter (200 µm) SMA wire with a Young’s modulus of approximately 70,000 MPa. At this level, potential second-order effects—such as minor variations of the stiffness with temperature—can be neglected.
3.2. Design
The main challenge in the experimental setup design was to minimize the influence of the large variations in oil temperature on the measurement results. This included avoiding thermal deformations and disturbance of sensor signals. The general layout of the setup placed sensors and actuators well above the oil bath (see Figure 2).
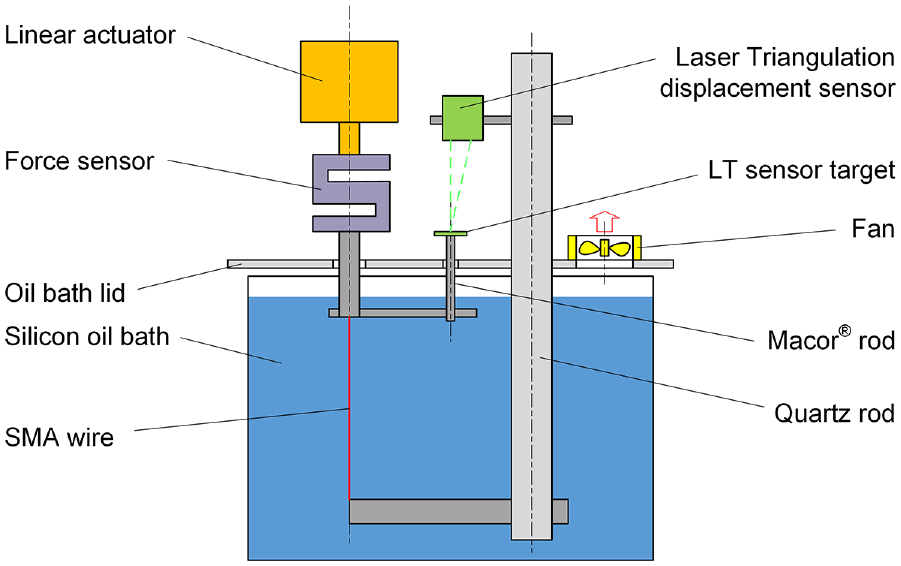
General layout of the experimental setup.
A commercial bath thermostat (Huber model CC-215B) was selected as an oil bath. 1 The heating bath covers a temperature range from 20°C to 200°C; the specified temperature stability is ±0.02 K. Water cooling was added to increase the cooling rate. A Nanotec LGA42 captive linear actuator adjusts the stress and strain of the SMA wire. The displacement of the moving upper end of the SMA wire is tracked by a Micro-Epsilon optoNCDT 1320 laser triangulation sensor. A sensor range of 25 mm simplifies the handling of SMA wire specimens of different lengths. Only 5 mm of the sensor range is used for the SMA wire characterization. According to the manufacturer, the specified nonlinearity of <±25 μm reduces to half if only the upper half of the sensor range is used and the sensor target is manufactured from a non-transparent plastic material.
As the forces exerted by the SMA wire specimen may vary significantly with the diameter of the wire, different force sensors are employed as needed. All sensors are of ME-Meßsysteme type KD40s, with nominal forces of ±2, ±5, ±10, and ±20 N. The sensor accuracy is 0.1% FS.
To keep thermal deformations to a minimum, materials largely insensitive to temperature variations were chosen for critical mechanical components. A quartz rod with a thermal expansion coefficient of 0.5 × 10⁻⁶/K serves as the central structural element of the experimental setup. It carries the fixed lower attachment point of the SMA wire and the laser triangulation sensor. The thin rod connecting the laser sensor target to the moving upper attachment point of the SMA wire also needs to have a low coefficient of expansion. It also has to be lightweight, as it will put a constant load on the force sensor. The initial plan to manufacture it from Invar could not be realized as no supplier would provide small quantities at a reasonable price. Therefore, it was made from Macor®, a machinable glass-ceramic material.
The upper part of the setup consisting of the oil bath lid, the quartz rod with attached LT displacement sensor, and the linear actuator with attached force sensor are mounted on a common base plate. The whole assembly can be manually raised and lowered with a gear crank. Figure 3 shows a photo of the experimental setup.
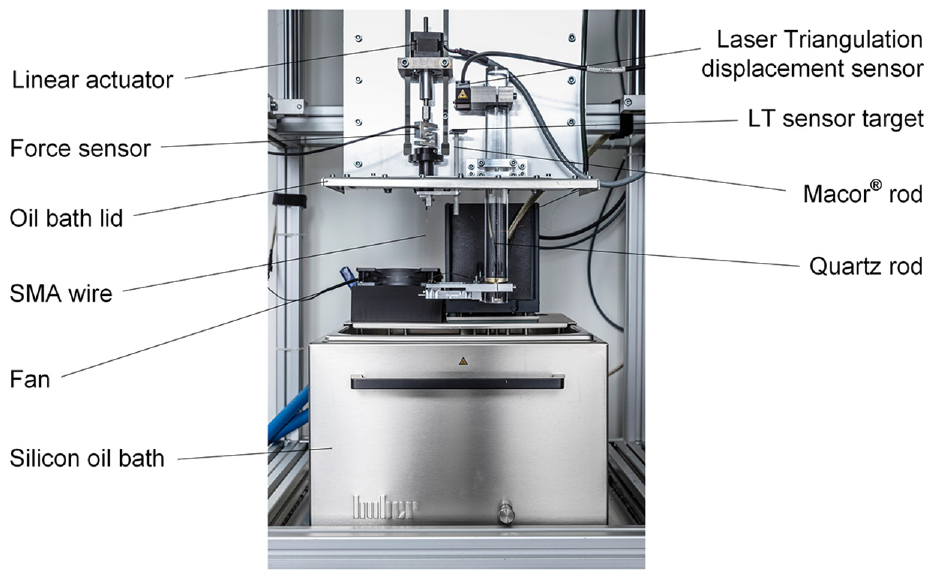
Experimental setup.
3.3. Control
Control and data collection in the experimental setup is performed by a dSPACE DS1104 Rapid Control prototyping system, running at a sample rate of 2000 Hz for an optimum performance of the control loops. The oil bath is equipped with a dedicated controller, which receives its temperature commands from the dSPACE controller via an RS232 interface. The temperature controller parameters were adjusted so that no overshoot would occur even for step changes in the commanded temperature.
The velocity of the linear motor is controlled by a Nanotec C5-01 motor controller. The velocity control acts as an inner control loop during both position control and force control. Position control uses a linear PI control law, while force control utilizes an impedance control scheme. The impedance control scheme computes the reference velocity
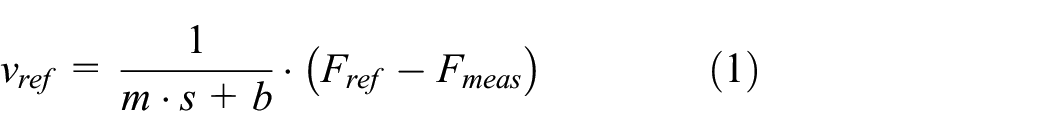
in which
During all experiments, the electrical resistance of the SMA wire specimen must be recorded. For experiments conducted with Joule heating of the SMA wire in air, the heating power provided to the wire specimen must also be controlled. Both tasks are covered by a custom-designed SMA power controller developed to cover a wide range of electrical resistances and heating power. To ensure the required accuracy, the resistance measurement is individually calibrated to two high-precision resistors (0.1%), reflecting the expected resistance variation of the SMA wire specimen at hand.
To reduce the volume of the recorded data and eliminate high-frequency sensor noise, all signals are averaged over 100 samples (i.e. 0.05 s) and then subjected to forward and backward filtering using a first-order low-pass filter with a filter frequency of 0.02 Hz.
3.4. Verification
Verification of the experimental setup evaluated the temperature distribution in the oil bath, the temperature stability of the force and position sensor readings, and the mechanical stiffness of the experimental setup. The tracking performance of the different control loops during the experiments will be analyzed in the section that discusses the experimental results.
The temperature in the oil bath proved to be sufficiently homogeneous due to the integrated pump that produces a continuous flow. The variation was less than 0.04 K when the temperature was measured at different locations throughout the oil bath.
The variation of the force sensor signal with oil temperature proved to be more critical. The data sheets of the force sensors allow operation at temperatures up to 70°C, and sensor temperatures were far below this at all times. However, the force sensors proved to be sensitive to internal temperature gradients, so the signals started to drift significantly, even at relatively low oil temperatures. A solution was found by implementing a forced airflow over the surface of the oil bath by an electric fan, which dramatically reduces the heating of the setup components above the oil bath. For an oil temperature of 150°C, the sensor temperature will remain below 30°C, and even the lid on the oil bath will not exceed 32°C. When the oil temperature was varied up to 150°C with no load applied to the 2 N force sensor, the measured force was stable within 3.5 mN (see Figure 4).
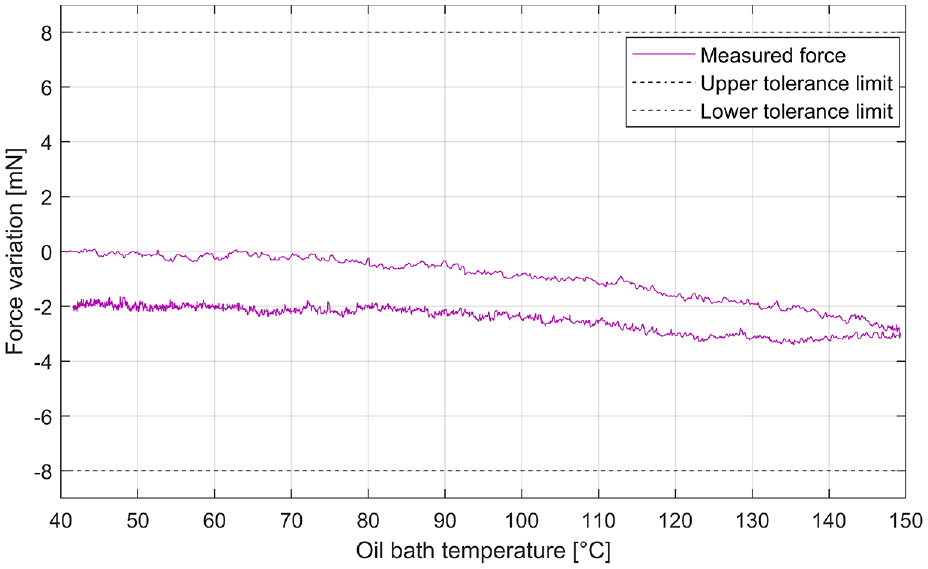
Variation of the measured force with the oil bath temperature.
The reading of the laser triangulation sensor measuring wire contraction will be determined not only by the properties of the sensor itself, but also by thermal deformations of the setup. To ensure that the material choice reduced thermal deformation to an acceptable level, the force sensor was disconnected from the upper fixation point of the SMA wire, and a rigid master reference rod manufactured from Macor® was mounted in place of the SMA wire. The signal of the laser triangulation sensor was recorded while the oil temperature was varied up to 150°C (see Figure 5).
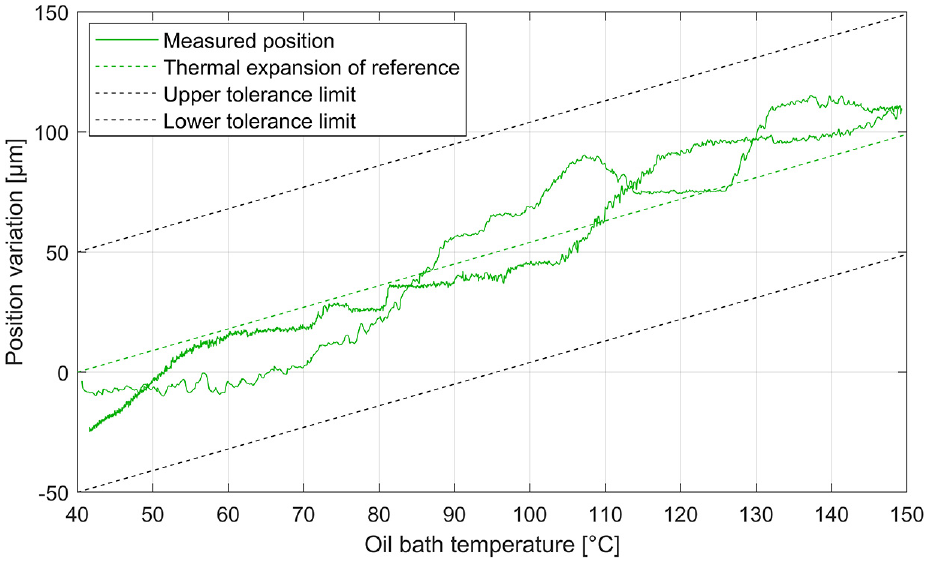
Variation of the measured position with the oil bath temperature. The dashed green line shows the expected thermal deformation of the reference rod mounted in place of the SMA wire specimen.
The position signal varied roughly linearly with oil temperature. A significant portion of the variation could be attributed to the thermal deformation of the Macor® reference rod (thermal expansion coefficient of 9.0 × 10⁻⁶/K). With the data corrected for the thermal expansion of the reference rod, the position variation was less than ±30 µm.
During the design of the experimental setup, a finite element analysis (FEA) had predicted a mechanical stiffness of 895 N/mm. Stiffness was also measured using the configuration described above. A force was applied to the lower fixation point of the SMA wire, while the signal from the laser position sensor was recorded. For an applied weight of 2 kg, the position sensor showed a displacement of 20 µm, indicating a stiffness of 980 N/mm. Therefore, the measurements confirmed that the stiffness of the experimental setup exceeds the required value by more than a factor of 2. Its stiffness is more than 40 times greater than that of an austenitic SMA wire specimen with the largest diameter of 200 µm.
It was concluded that the experimental setup satisfies the requirements and will provide sufficiently accurate data of the characterized SMA wire specimen. At the time of writing, the biggest limitation is the long time required for the oil to cool, particularly at low oil temperatures. This may be improved by installing a dedicated cooling unit, which would also allow temperature reduction below room temperature. Furthermore, the thermal expansion of the Macor® ceramics is still too large. The thin rod carrying the laser sensor target and the master reference exchanged for the SMA wire will be replaced by elements manufactured from a material with a lower coefficient of expansion. Another option is to replace the current force sensor based on standard strain gauge technology with a sensor less sensitive to thermal variations (e.g. capacitive). The experimental setup is subject to continuous improvement, and higher specifications may be realized at a later point in time.
4. Experimental procedures
4.1. Preparation of the SMA wire specimen
The goal of the experiments was not to characterize a specific type of SMA wire, but rather to verify that the experimental method and setup work well and can generate consistent temperature-stress-strain surfaces during the phase transformation of an SMA wire. The experiments used Smartflex® SMA wire (SAES Getters, Italy) of 76 µm diameter, as this is a standard wire type widely used in industrial applications. The wire specimen to be characterized was crimped with a free length of 96.46 mm (measured in austenitic state, i.e. at a temperature of 150°C with no load applied). The crimps had been photoetched from a 0.4 mm phosphorus bronze sheet. The larger holes in the crimps have a tight fit with stainless steel guiding pins in the setup, while the smaller holes are for the mechanical and electrical connection via M2 screws (see Figure 6).
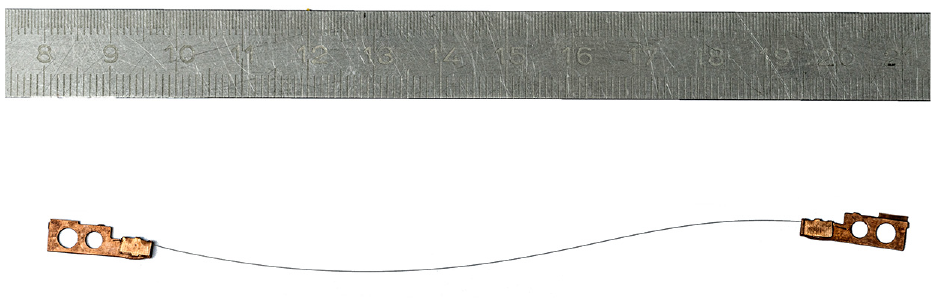
SMA wire specimen with custom-made crimps.
After a number of cycles, an SMA wire will typically develop a two-way effect. The SMA wire specimen was to be characterized in a somewhat used condition with a pronounced two-way effect rather than “fresh from the spool.” Thus, the wire specimen was subjected to a run-in procedure of 2500 cycles before being characterized, which was performed in a separate setup that used Joule heating in air. The SMA wire was subjected to a constant stress of 150 MPa through a mass at its free end. Over a 10 s period, the heating power was increased linearly from 0 to 400 mW and again reduced to 0 mW. The strain difference during cycling was approximately 4%.
After being run-in, the SMA wire was mounted in the experimental setup and loaded to a stress level of 400 MPa at an oil temperature of 150°C. Three consecutive times, the oil temperature was lowered to 100°C and then heated up to 150°C again. This procedure ensured that during the experiments, no slip of the SMA wire in the crimps would occur, and also allowed for settling of the wire specimen at its fixation points.
4.2. Operational limits during characterization
From the perspective of collecting as much information as possible, it is desirable to characterize SMA wires over the broadest possible range of operating conditions. However, overloading the SMA wire should be avoided, as this may change the characteristics of the SMA wire. Thus, the operational boundaries for characterization in this study were defined to fully cover, but not exceed, the operating conditions that an SMA wire will see when used in an actuator.
The number of activation cycles that an SMA wire will perform is directly related to the stress and the strain difference to which it is exposed (see Fumagalli et al., 2009). For Smartflex® SMA wires, this relation is shown graphically in the diagram in Figure 7. The red dotted line shows the operational stress-strain limit defined for the experiments.
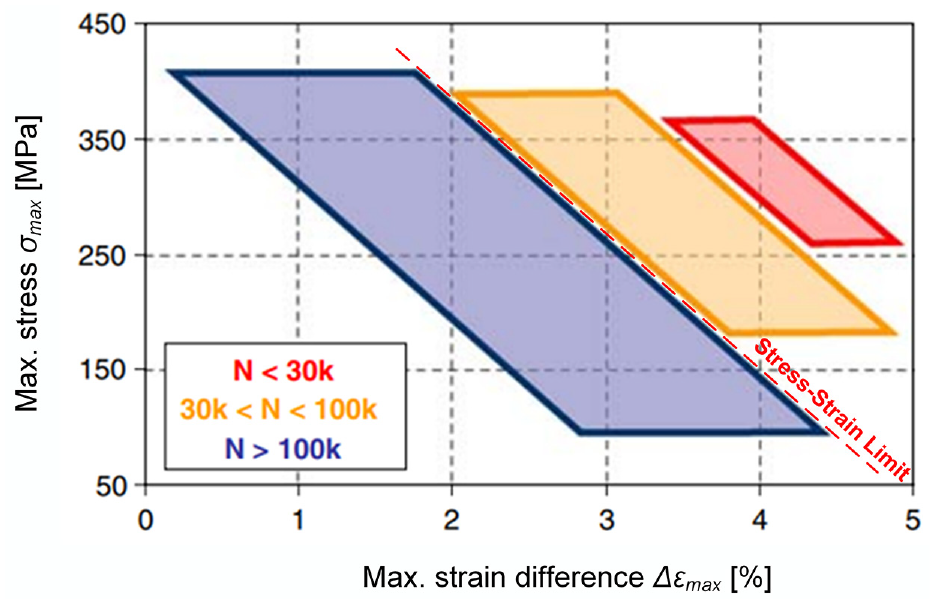
Relation between maximum stress, maximum strain difference, and activation cycles for Smartflex® SMA wire (modified from SAES Getters, 2020).
In practical SMA actuator design, the 100.000 cycles boundary between the blue and yellow areas in the diagram will often be chosen to define the limits for stress and strain difference. In this case, the relationship between the maximum stress

The maximum strain difference
With an estimated Young’s modulus of an SMA wire of EA = 70.000 MPa, this yields

In the different experimental runs, the combination of maximum stress and strain was limited according to equation (4).
4.3. De-twinning the martensite
The contraction of de-twinned martensite in the SMA wire during heating can provide information about the phase transformation to austenite. However, twinned martensite will not contribute to contraction. Thus, each experimental run should start with a de-twinned martensitic SMA wire.
The run-in procedure described above already builds up a relatively stable two-way effect. Thus, after cooling from the austenitic phase, a large fraction of the martensite will already end up in a de-twinned condition. Additionally, the martensitic SMA wire was mechanically stretched to a pseudoplastic deformation of 4.25%, resulting in a strain of 4.55% at a stress level of 100 MPa. Mechanical stretching also created a reproducible starting point before each experimental run. From a crystallographic point of view, the SMA wire may not be fully detwinned at this point—yet it will be as much detwinned as it will ever get in an actuator.
During the phase transformation from austenite to martensite, it also has to be ensured that de-twinned martensite is formed rather than twinned martensite. Experiments with SMA wire “fresh from the spool” had shown a martensite plateau of 90 MPa. Therefore, in general a minimum stress level of 100 MPa was maintained during the experimental runs.
4.4. Pattern of experimental runs
Each experimental run used a different ConstL condition that defined the maximum strain to which the SMA wire was subjected under load. The wire was heated until the stress threshold calculated according to equation (4) was reached. The ConstL phase was followed by further heating at constant stress (ConstF) up to a defined threshold temperature. The third experimental condition relieved the wire stress while maintaining a constant temperature (ConstT).
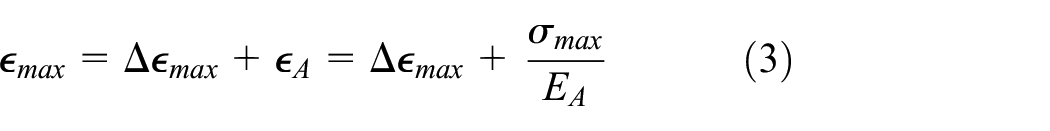
From the perspective of SMA actuator design, the main interest is in stress levels between 100 and 400 MPa. In this interval, the stress was tested in increments of 25 MPa. The combinations of threshold stress and strain of the different experimental runs define a grid for scanning the phase transformation portion of the M2A surface in strain-stress coordinates (the right plane in Figure 8). Between the experimental runs, the ConstF-condition halted at different threshold temperatures, thereby defining a grid for scanning the high-temperature portion of the M2A surface in temperature-stress coordinates (the left plane in Figure 8).
Combinations of threshold stress, strain, and temperature in the experimental runs. The letters in the diagram refer to the different states in Figure 1.
If the threshold temperature of an experimental run was defined below the maximum wire temperature of 150°C, the SMA wire was subsequently heated to 150°C at a stress level of 100 MPa in the subsequent experimental condition. This ensured that the wire would undergo phase transformation to “full austenite,” which was the starting point for exploring the A2M surface. The second half of the experimental runs explored the A2M surface with the reverse sequence of experimental conditions (ConstT, ConstF, ConstL), using the same threshold values for temperature, stress, and strain.
In addition to the 13 experimental runs described above, Run 14 was conducted at 50 MPa to cover the low-stress portion of the M2A and A2M transformation surfaces. This run saw a ConstF condition up to the maximum temperature of 150°C. However, a full detwinning of the martensite during cooling cannot be ensured at stress levels below 100 MPa. The strain data from the A2M part of Run 14 cannot be compared directly with the data collected on the other experimental runs.
The cooling of the oil bath becomes particularly slow at low temperatures. For a temperature interval of 40°C–150°C, the duration of an experimental run will be approximately 2.5–3 h. For a minimum temperature of 30°C, the duration of an experimental run will almost double. In the experiments, a minimum temperature of 40°C was considered sufficient to verify that the experimental method and setup will generate consistent temperature-stress-strain surfaces.
5. Discussion of results
5.1. Tracking performance during experiments
Each of the three experimental conditions (ConstF, ConstT, and ConstL) has two input variables (one constant, the other varied) and one output variable. This section looks closely at the input variables and analyzes the deviation from their commanded values.
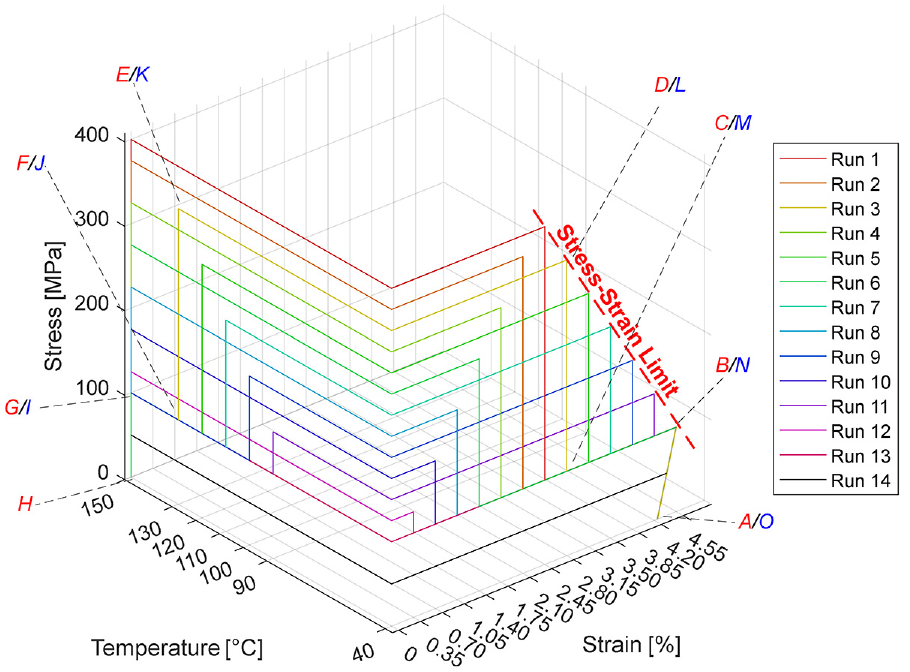
Figure 9 shows the measured stress versus temperature under ConstF conditions. The red lines show the experimental data for the M2A conversion (“heating”), while the blue lines show the data for the A2M conversion (“cooling”).
Measured temperature versus stress during the ConstF experimental condition.
The measured stress is generally close to the constant commanded value. Small “bumps” (e.g. at 110°C for a stress level of 350 MPa) occur during the rapid contraction of the SMA wire while heating. This deviation—typically less than 3 MPa—is caused by the limited bandwidth of the force control. The force deviation could be further minimized by reducing the heating rate in the relevant temperature range. However, it is considered non-critical, as the experimental path will nevertheless remain on the M2A transformation surface. Force deviations during cooling are smaller (typically <1.5 MPa), as the rate of temperature change is reduced.
Figure 10 shows the two experimental input variables, that is, temperature and wire strain, for the ConstT experimental conditions. The red lines show the data for the M2A conversion (“releasing the wire”), while the blue lines show the data for the A2M conversion (“pulling the wire”).
Measured temperature versus strain during the ConstT condition.
In the diagram, no deviation of the temperature is visible. Throughout the ConstT condition, the deviation of the SMA wire temperature from its commanded value was less than 0.1 K.
Figure 11 also shows the experimental input variables, that is, strain and temperature, for the ConstL conditions. The red lines show the data for the M2A conversion (“heating”), while the blue lines show the data for the A2M conversion (“cooling”).
Measured SMA wire strain versus temperature during ConstL condition.
Again, no deviation of the constant input variable is visible in the diagram. The difference between the measured strain and its commanded value was significantly less than 0.01% for most of the ConstL conditions.
5.2. Overview of phase transformation surfaces
This section plots the experimental results as three-dimensional phase transformation surfaces. Figure 12 presents the relationship between temperature, stress, and strain of the 14 experimental runs. The left: diagram shows the measured data for the M2A transformation, while the right diagram shows those for the A2M conversion.
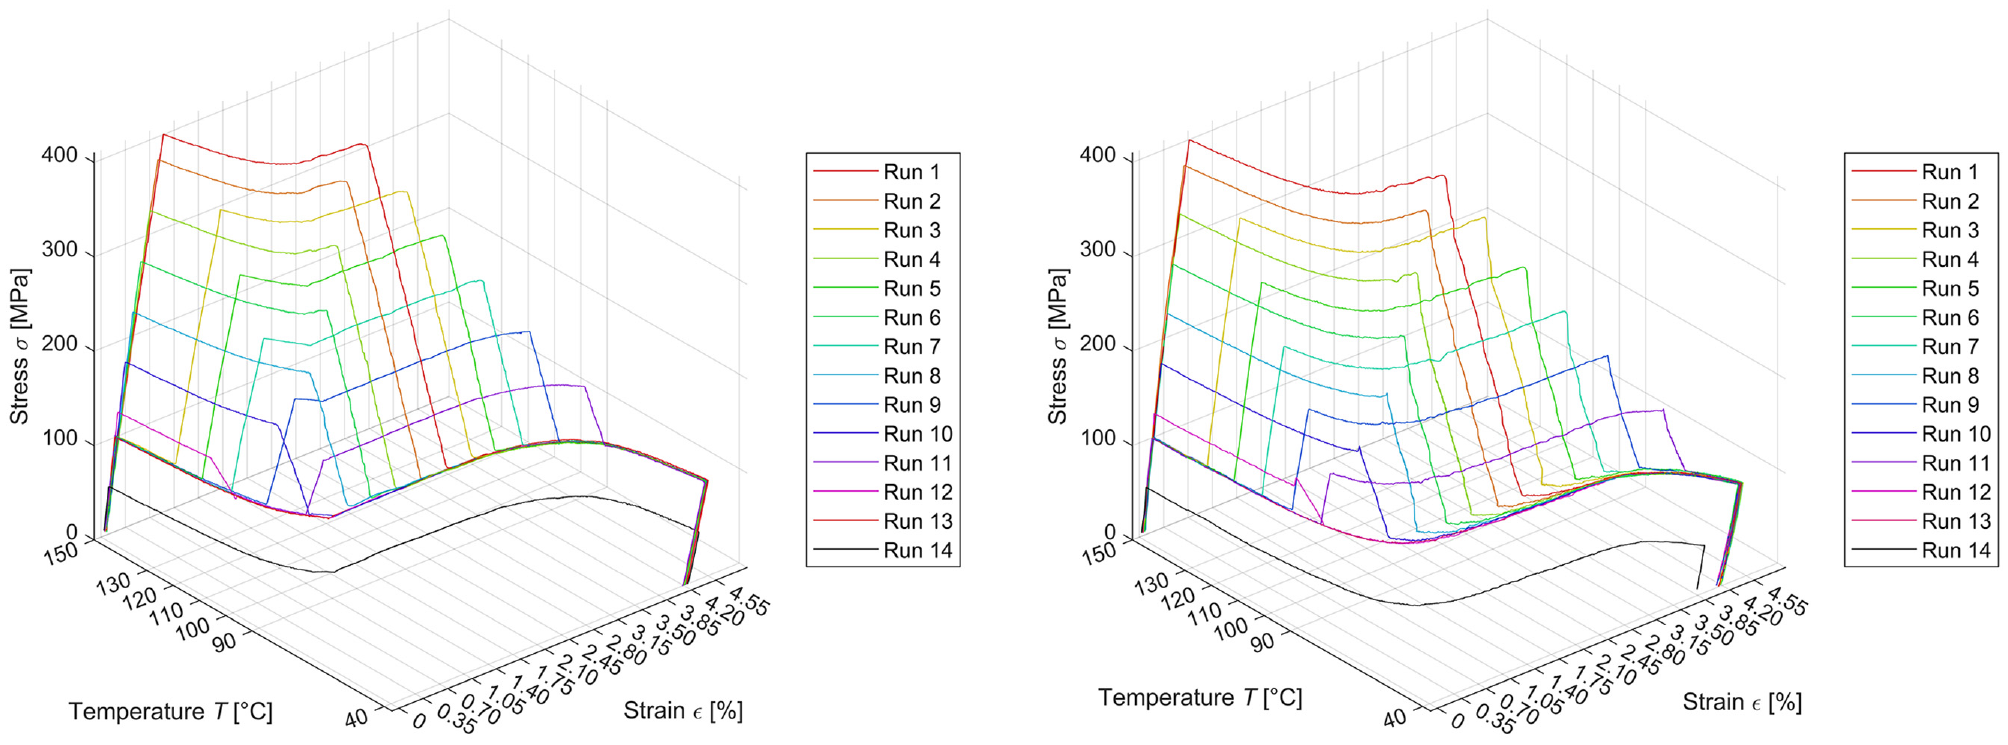
Experimental results for SMA wire temperature, stress, and strain in a 3D representation. Left: M2A transformation. Right: A2M transformation.
The trajectories of the different experimental runs form a consistent surface for the M2A phase transformation. The strain values for “full austenite” at the end of each heating procedure (state “H” in Figure 1) match very well. The strain variation between the 14 experimental runs was less than 0.04% (corresponding to 36 µm) and was not systematic, indicating that the wire specimen was not overloaded by the experimental procedure. Also, the strain curves for “full martensite” (state “N” in Figure 1) for Runs 1–13 are situated closely together. For the A2M phase transformation, however, the data from the ConstL conditions differ from the expectation. The consistency of the data from the different experimental conditions will be analyzed in more detail in the next section.
The experimental data for the specific electrical resistance show a similar picture. In Figure 13, the left diagram shows the measured data for the M2A phase transformation, while the right diagram shows those for the A2M transformation.
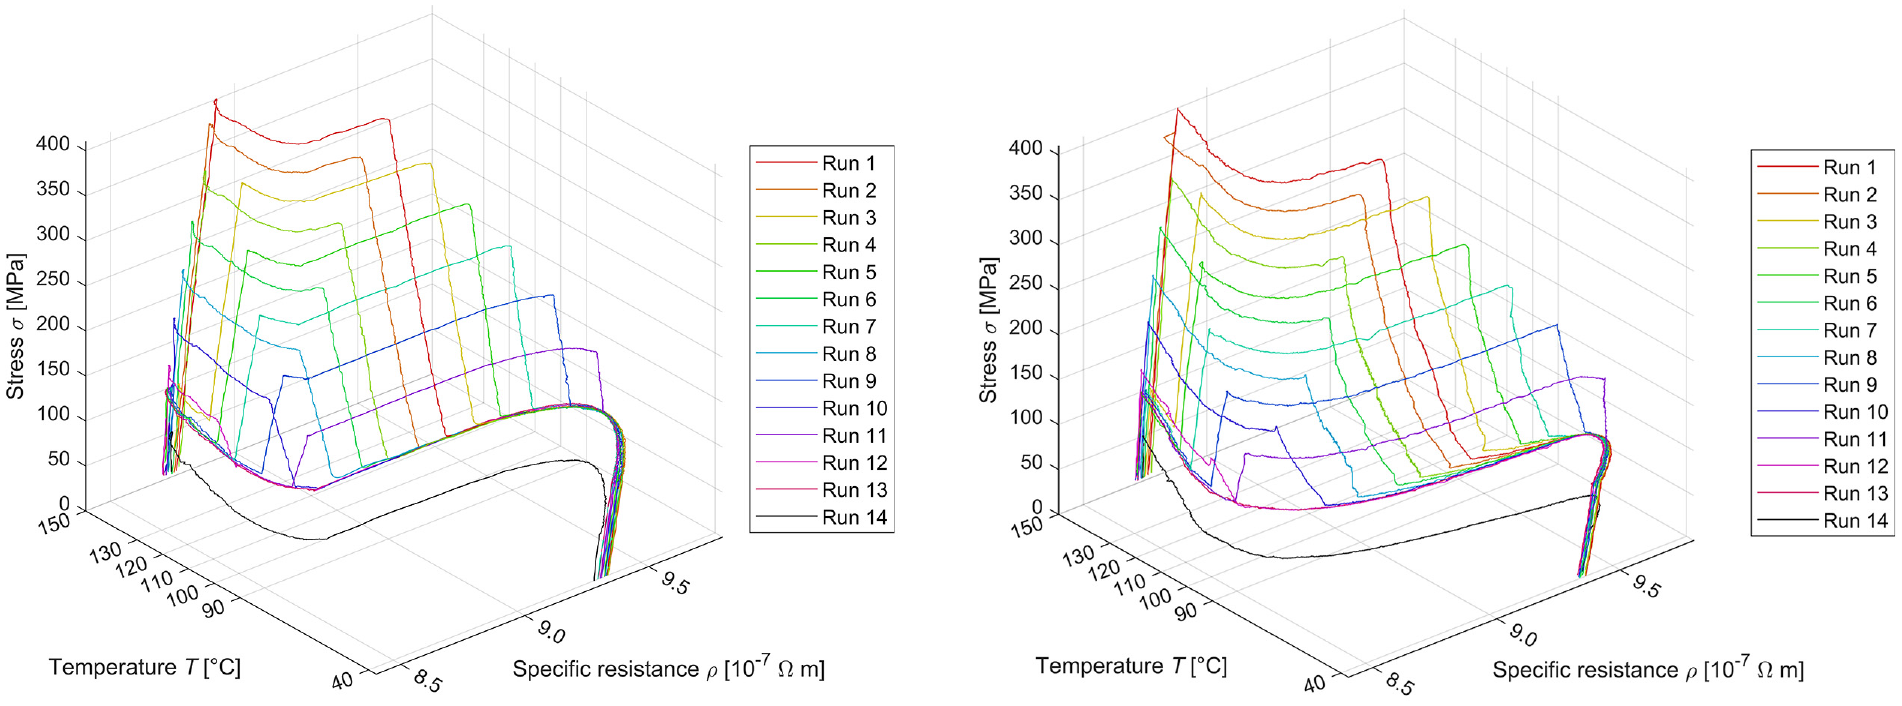
Experimental results for SMA wire temperature, stress, and specific electrical resistance in a 3D representation. Left: M2A transformation. Right: A2M transformation.
The specific resistance measured during the different experimental runs also forms surfaces for M2A and A2M phase transformation. In particular at lower stress levels, the A2M transformation is less steep than the M2A transformation, indicating the presence of a pronounced R-phase during the A2M transformation. Figure 13 also shows a systematic drift of the resistance data. Over the 44 h of measurements, the specific resistance in state “G” changed by 0.06 × 10⁻⁷Ω m. This effect is attributed to the electronics measuring the resistance, which shows a need for future improvement.
5.3. Consistency of experimental conditions
This article proposes the use of a combination of different experimental conditions for the characterization of SMA wires. It will now be analyzed to what extent the data from different experimental conditions are consistent. The pattern of experimental runs contains numerous cross-over points, which can be used for this analysis. The two main areas of interest are (a) the consistency between ConstF and ConstL experimental conditions in the steep phase transition zone (right plane in Figure 8) and (b) the consistency between ConstF and ConstT experimental conditions at elevated wire temperatures (left plane in Figure 8).
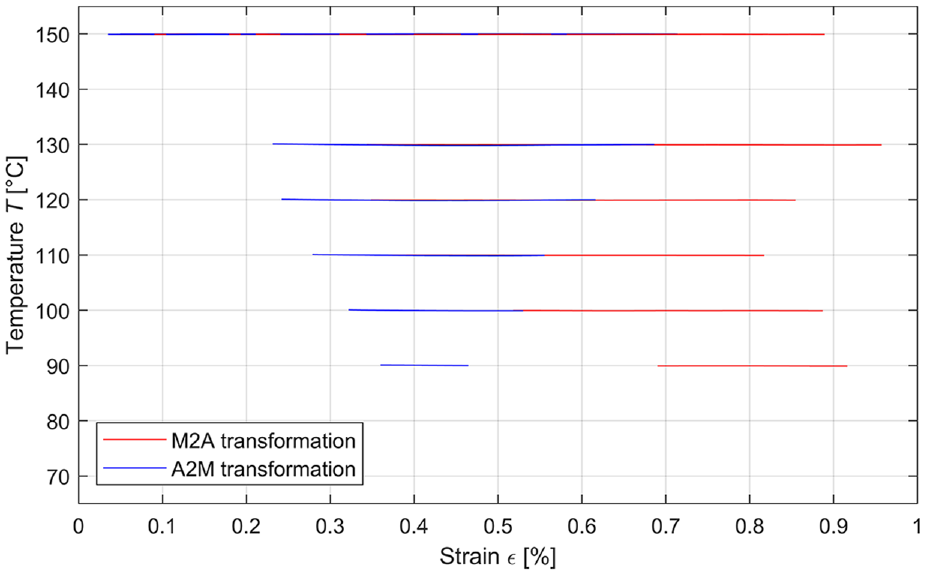
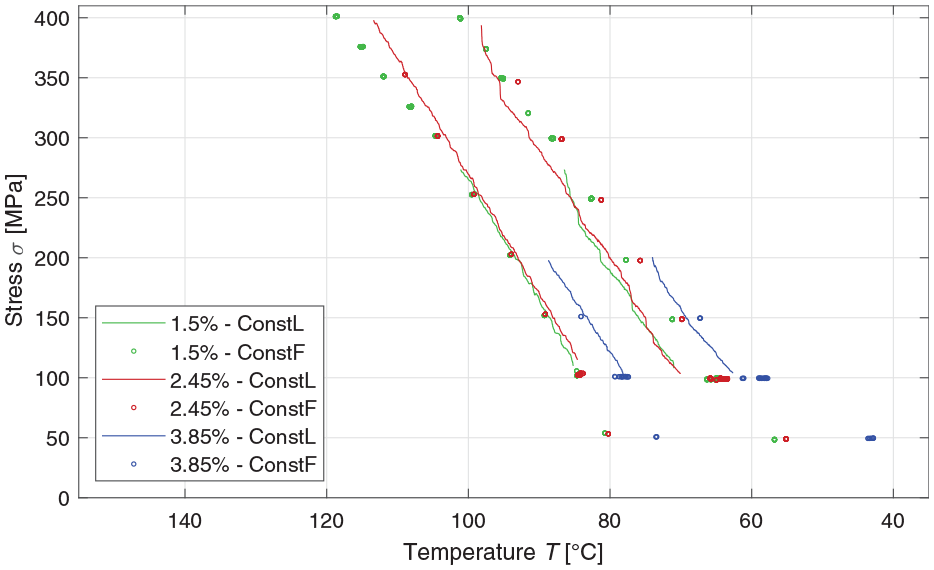
Figure 14 compares the measurements for elevated temperatures. It essentially presents vertical cuts through the three-dimensional diagram in Figure 12 at defined temperature levels. The solid lines represent the ConstL experimental data at different SMA wire temperatures. Individual markers show data from different ConstF experimental conditions at the relevant temperatures.
Comparison of the ConstT and ConstF experimental data for elevated temperatures.
In general, the ConstF markers match the ConstT solid lines reasonably well, confirming the consistency of the data from both experimental conditions. The gap at the upper end of the ConstT lines for 150°C indicates that at high stress levels, phase transformation to austenite will not be complete. The ConstT experimental condition (i.e. release stress and increase it again) is therefore needed to make the A2M phase transformation start from “full austenite.”
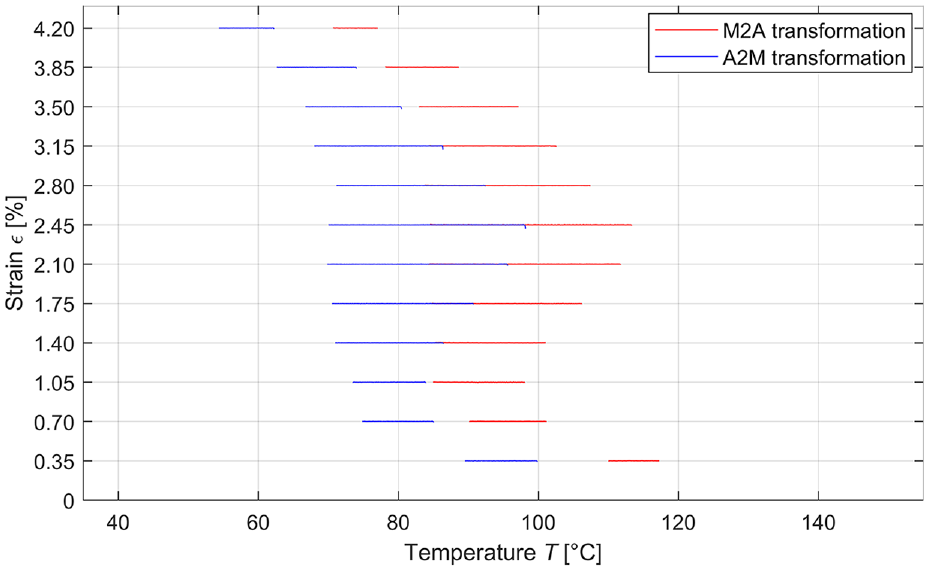
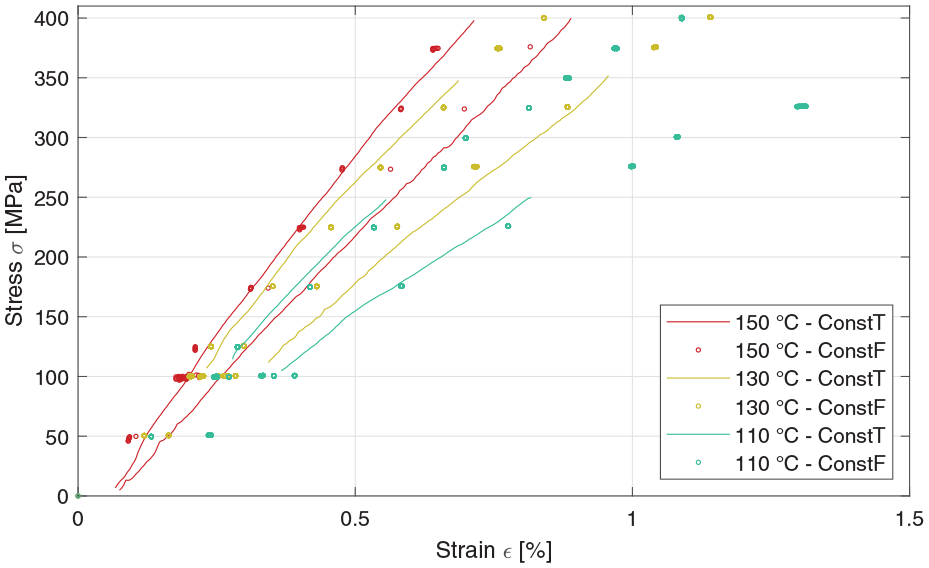
Figure 15 looks at the ConstL and ConstF experimental data in the steep phase transition zone. The diagram presents vertical cuts through the data in Figure 12 at different strain levels. The solid lines show the ConstL measurements at the strain levels. Individual markers show the corresponding data from different ConstF measurements at the relevant strain.
Comparison of the ConstL and ConstF experimental data in the steep phase transition zone.
For the M2A phase transformation, the ConstF markers match the ConstL lines remarkably well, indicating that both experimental conditions are capable of generating consistent data. However, the ConstL curves during cooling are somewhat surprising. At certain temperatures, sudden drops in stress occur, just as if the wire would slip. This may be due to localized transformation-induced material instabilities similar to those reported by Churchill et al. (2009b) for isothermal phase transformation, albeit for a virgin SMA wire. Interestingly, all experimental runs converge again under the subsequent ConstF condition at 100 MPa (see the right diagram in Figure 12). As the effect does not show in the ConstF measurements (at least not to the same extent), the ConstL and ConstF experimental conditions for the A2M phase conversion do not match well.
It may be argued that the ConstL condition is not representative of the use of SMA wires in actuators, in which the wire will rarely be operating against almost infinite stiffness. Usually, the stiffness the SMA wire sees is kept as low as possible in order to realize large actuator strokes. Therefore, the ConstF condition is much more representative of real SMA actuator applications. If the material instabilities described above occur in an SMA wire, the ConstL data during cooling should not be used for characterization of the A2M phase transformation surface.
On the other hand, the combination of different experimental conditions for scanning the phase transformation surfaces is obviously capable of identifying effects that otherwise may have gone unnoticed. The ConstL data indicate that when working against a very high stiffness, the SMA wire specimen will not perform in the expected way.
It may be advantageous to replace the ConstL condition in the experimental runs with a condition in which the SMA wire pulls against a defined virtual stiffness. If the microscale behavior reported above is not elicited, the A2M data from the different experimental conditions should also be consistent. Future work will address this idea.
5.4. Comparison of oil bath and Joule heating
This study opted for external heating of the SMA wire using an oil bath, as this gives the best control over temperature. It also ensures that the temperature of the SMA wire is uniform. Now experimental results from external heating by the oil bath are compared to those of Joule heating in air, using the same experimental setup and the same SMA wire.
The experiment consisted of heating the SMA wire at a fixed strain of 3.85% (ConstL) until a stress level of 200 MPa was reached, then heating further up to a temperature of 150°C (ConstF) and finally relieving the stress at this temperature to achieve “full austenite” (ConstT). The path back to “full martensite” used the reverse sequence. The experiment was then repeated in air, varying the heating power between 0 and 550 mW.
Figure 16 compares the results from these experiments. For the comparison, heating power was linearly fitted to oil temperature such that the stress in the ConstL condition started to increase at the same point of heating up.
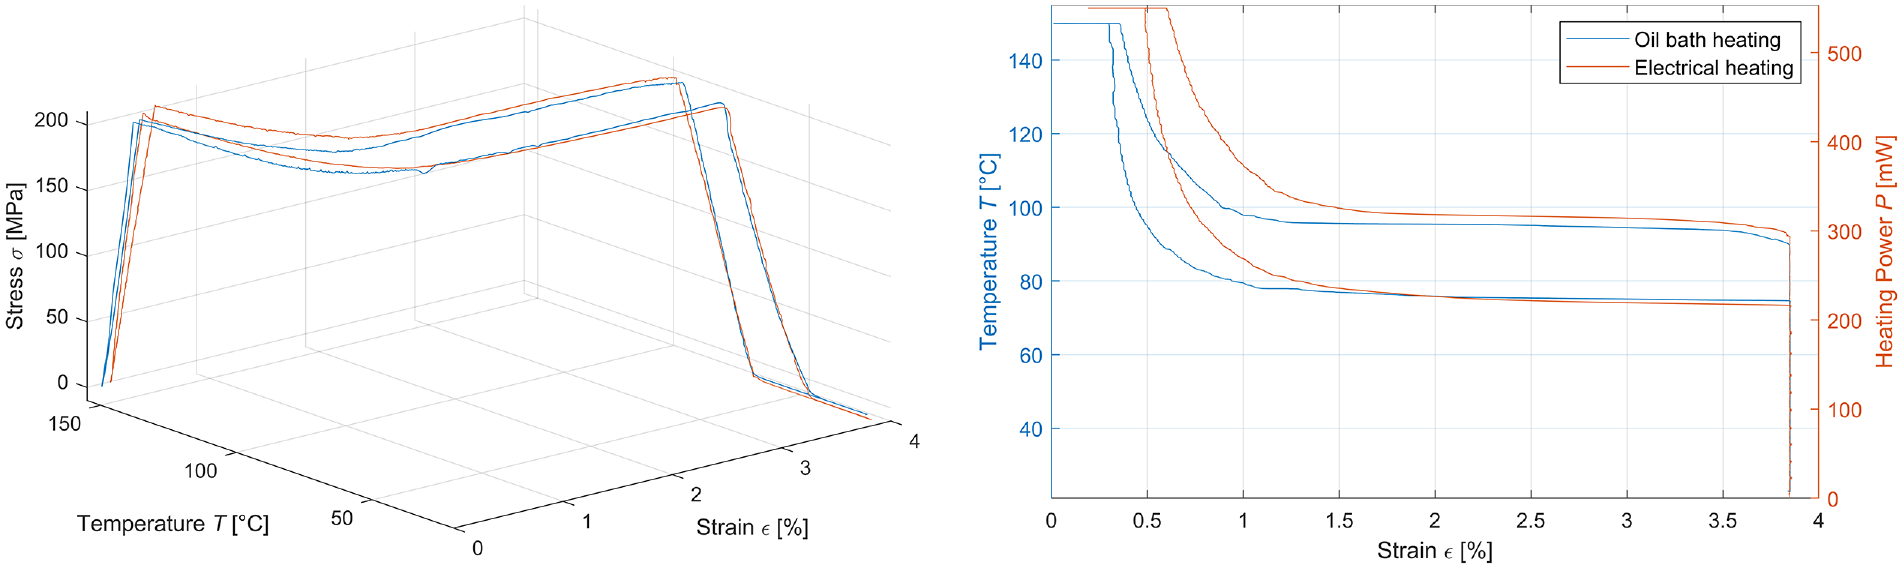
Experimental runs comparing heating in the oil bath to Joule heating in air. Left: three-dimensional representation of the experimental runs. Right: ConstF condition.
The main difference between heating in the oil bath and heating in air is in the total contraction of the SMA wire. In the oil bath, the contraction is 3.85%, while for Joule heating, the SMA wire contracts only by 3.66%. For Joule heating, the contraction is therefore reduced by about 5%. The transition region of the hysteresis also appears to be somewhat softer for Joule heating than for oil bath heating. This can be explained by the parts of the SMA wire adjacent to the fixation points, which see conductive cooling via the crimps and undergo phase transformation to austenite only for higher heating power or even not at all. It is concluded that good temperature control by external heating in an oil bath will result in more reliable experimental data than Joule heating of the SMA wire.
6. Summary and conclusions
The phase transformation of SMA wires can be described as a surface in temperature-stress-strain space. Phase transformation surfaces obtained from characterization experiments comprise essential information for the parametrization and validation of SMA models. These surfaces can also be used to compare different SMA alloy compositions comprehensively, or to assess variations between SMA wire production charges, changes of SMA wire behavior over its life time, etc. This article proposes an experimental method and a setup to “scan” the phase transformation surfaces of an SMA wire systematically while avoiding overloading of the wire.
The experimental method combines external heating of the SMA wire in an oil bath with a sequence of different experimental conditions. The characterization of the martensite to austenite (M2A) transformation starts with heating the SMA wire at a constant length until a defined stress level is reached (ConstL condition), followed by heating further at constant stress up to a maximum temperature (ConstF), and finally releasing the wire stress at a constant temperature (ConstT). Characterization of the austenite to martensite (A2M) transformation uses a reverse sequence. Specific regions of interest of the transformation surfaces can be scanned with high resolution by a combination of experimental runs.
The experimental setup uses a silicone oil bath to control the temperature of the SMA wire precisely over its full length. All sensors and actuators are placed outside the oil bath. However, the large variation of the oil temperature posed significant design challenges. Thermal deformations were avoided by manufacturing key structural components from ceramic materials with small temperature coefficients (quartz, Macor). A forced air flow over the oil surface avoids heating of electronic components, thus keeping the thermal drift of the sensors within specifications.
During characterization, overloading of the SMA wire has to be avoided, as this may change its properties. For each experimental run, threshold strain and stress were defined on the basis of the lifetime diagram defined for the Smartflex® SMA wire to be tested. This was done to fully explore, but not exceed, the operational boundaries defined for SMA wires in actuator applications. Experimental procedures included de-twinning the martensitic SMA wire by mechanical pre-straining prior to each experimental run. During the experimental runs, a minimum stress of 100 MPa was maintained to ensure formation of detwinned martensite.
The experiments comprised a total of 14 experimental runs. These covered stress levels between 100 and 400 MPa at intervals of 25 MPa, with an additional run at 50 MPa. The experimental results form consistent three-dimensional surfaces for both the M2A and A2M transformation. This was true for both the mechanical contraction of the SMA wire and its electrical resistance. However, during the ConstL condition of the A2M transformation, unexpected sudden drops in stress occurred. This may be due to localized transformation-induced material instabilities. A gap between the M2A and A2M transformation surfaces for high temperatures and stress levels indicates that due to the combination of ConstF and ConstT conditions, full phase conversion was taking place, demonstrating the benefit of the proposed experimental method.
Experiments comparing electrical (Joule) heating in air with heating in the oil bath showed that the contraction was reduced by approximately 5%. This can be explained by the SMA wire near the fixation points being cooled via the crimps. It is concluded that the heating method may have a significant impact on the experimental results. Cooling of the SMA wire near the fixation points will have an even greater impact in SMA actuators, where the wire lengths are typically short. Obviously, SMA wire models should take this effect into account.
It is concluded that the characterization of SMA wires using external heating in an oil bath can generate consistent experimental results for both mechanical contraction and electrical resistance, which provides a good starting point for accurate models. The combination of different experimental conditions is essential for ensuring a full phase transformation, while keeping the load of the SMA wire within the limits specified for the use in actuator applications.
Footnotes
Author’s note
Michael Honold was with the Actuators & Sensors Laboratory at the time the research for this article was conducted.
Declaration of conflicting interests
The authors declared no potential conflicts of interest with respect to the research, authorship, and/or publication of this article.
Funding
The authors disclosed receipt of the following financial support for the research, authorship, and/or publication of this article: The authors wish to thank the German Ministry of Education and Research (BMBF) for funding this work within the context of the project miniSMArt (grant no. 13FH040PX8).