
Abstract
A new magnetorheological (MR) damper has been designed, manufactured, modelled and tested under cyclic loads. A faulty behaviour of the damper was accidentally detected during the experiments. It was deduced that the presence of air bubbles within the MR fluid is the main reason for that failure mode of the damper. The AMT-Smartec+ MR fluid used in the current study, a new MR fluid whose characteristics are not available in the literature, exhibits good magnetic properties. However, the fluid has a very high viscosity in the absence of magnetic field. It is assumed that this high viscosity enables the retention of air bubbles in the damper and causes the faulty behaviour. To prove this assumption, a coupled numerical approach has been developed. The approach incorporates a Finite Element Analysis (FEA) of the magnetic circuit and a Computational Fluid Dynamics (CFD) analysis of the fluid flow. A similar approach was presented in a previous publication in which an ideal behaviour of an MR damper (no effect of air bubbles) was investigated. The model has been modified in the current study to include the effect of air bubbles. The results were found to support the assumptions for the reasons of the failure symptoms of the current MR damper. The results are shown in a comparative way between the former and current studies to show the differences in flow parameters, namely: pressure, velocity and viscosity, in the faultless and faulty modes. The results indicate that the presence of air bubbles in MR dampers reduces the damper force considerably. Therefore, the effect of the high yield stress of MR fluids due to the magnetic field is reduced.
1. Introduction
Magnetorheological (MR) fluids attract continuous research interests in different applications such as automotive (Bai et al., 2015; Chae and Choi, 2015; Gurubasavaraju et al., 2018a; Sapiński, 2011), mechanical (Bompos and Nikolakopoulos, 2011; Bullough et al., 2008), civil (Ding et al., 2013), aerospace (Han et al., 2019) and even in medical devices (Tao, 2019). The advantageous performance of MR fluid devices is achieved by tuning the fluid characteristics by the operation of an adjustable magnetic field within an automatic control circuit (Rossi et al., 2018).
Modelling of the rheological flow of MR fluids is quite complicated. This is because MR fluids manifest highly nonlinear flow characteristics that involve interactions between multi-physics phenomena (Elsaady et al., 2020b). The flow characteristics exhibit non-Newtonian, viscoplastic and viscoelastic behaviours under the effect of magnetic field (Wang and Liao, 2011). The constitutive equations of these characteristics are thought to be complicated (Syrakos et al., 2018). Therefore, most models that were developed for MR dampers, which are the most well-known MR fluid applications, adopt one-dimensional modelling techniques (Çeşmeci and Engin, 2010; Guo and Xie, 2019; Wang and Liao, 2011). These one-dimensional techniques are common because of their simplicity and easy interpretation of their parameters (Guo and Xie, 2019). Examples of these models are (i) the Bingham-based dynamic models (Yu et al., 2013), (ii) the nonlinear hysteretic bi-viscous model (Wereley, Pang and Kamath), (iii) the Bouc-Wen model (Bai et al., 2015) and (iv) the nonlinear viscoelastic-plastic model (Kamath and Wereley, 1997).
The aforementioned one-dimensional models represent an MR damper as a nonlinear mechanical system composed of a set of springs, dashpots and other elements that represent sources of nonlinearity (Wang and Liao, 2011). These models are found to be capable and robust to predict the nonlinear hysteretic characteristics of MR dampers (Wang and Liao, 2011). However, the models are not based on the representation of rheological flow characteristics of MR fluids. That representation is thought to be necessary, as the nonlinear performances of MR fluid devices are caused by these characteristics. Recently, multi-dimensional modelling techniques have attracted more interest, as they can predict more phenomena and design parameters such as the multi-physics phenomena, inertia, temperature and compressibility effects of MR fluids (Abali, 2019; Case et al., 2013; Elsaady et al., 2020a, 2020b; Guo and Xie, 2019; Guo et al., 2019; Gurubasavaraju et al., 2018a, 2018b; Meng et al., 2017; Parlak and Engin, 2012; Zheng et al., 2014).
The reasons for the nonlinear performance of MR fluid dampers can be listed as:
The magnetic phenomenon is a nonlinear phenomenon in which magnetic materials are prone to magnetic saturation. Therefore, the magnetic field strength in magnetic circuits of MR dampers increases in a nonlinear proportional way with input current (Goldasz, 2017). Also, magnetic materials exhibit a hysteretic behaviour when the polarity of magnetic field is switched.
The effects of compressibility, friction, inertia and viscoelasticity of MR fluids are the main sources of nonlinearity (Elsaady et al., 2020a; Syrakos et al., 2016). The role of fluid compressibility in producing the hysteretic behaviour of MR dampers is more significant in MR dampers whose constructions contain air chambers (Elsaady et al., 2020a). The role of fluid inertia is more remarkable when MR dampers are operated at high-frequency loads (Syrakos et al., 2016). The viscoelastic effect of MR fluids increases proportionally with magnetic field strength causing an increase of the nonlinear hysteretic behaviour (Krauze and Kasprzyk, 2016; Xu et al., 2012).
Hydraulic dampers, in general, are closed systems (no inlets or outlets for the fluid). This causes the dampers to be liable to nonlinear effects caused by aeration, cavitation and possible turbulence (Czop and Gniłka, 2017; Elsaady et al., 2019). Aeration may be caused due to improper sealing of the MR fluid in the damper or due to the presence of air dissolved in the fluid itself. MR fluids are reported as bubbly fluids in many studies (Bullough et al., 2008; Guo et al., 2013; Zhang and Oyadiji, 2015; Zheng et al., 2015, 2017).
Despite the aforementioned sources of nonlinearity, MR dampers show a typical ideal performance that is seen in many studies. The characteristics of this ideal behaviour were reviewed by Wang and Liao (2011). In that review, the dynamic characteristics of an MR damper were measured under different conditions of cyclic loads. The objective of these measurements was to analyse the dynamic characteristics of MR dampers and the requirements for modelling these characteristics. The results are shown in Figure 1. Figure 1(a) shows the time histories of damper forces at different values of input current. Figure 1(b) and (c) present the force-displacement and force-velocity diagrams, respectively, at the same currents shown in Figure 1(a). Figure 1(d) and (e) present the force-displacement diagrams at different conditions of piston motion. Figure 1(d) shows those diagrams at different amplitudes of piston displacement (measured at a frequency of 1 Hz and input current 0.5 A), whereas Figure 1(e) presents those diagrams at different frequencies (measured at an amplitude of 15 mm and input current 0.5 A).
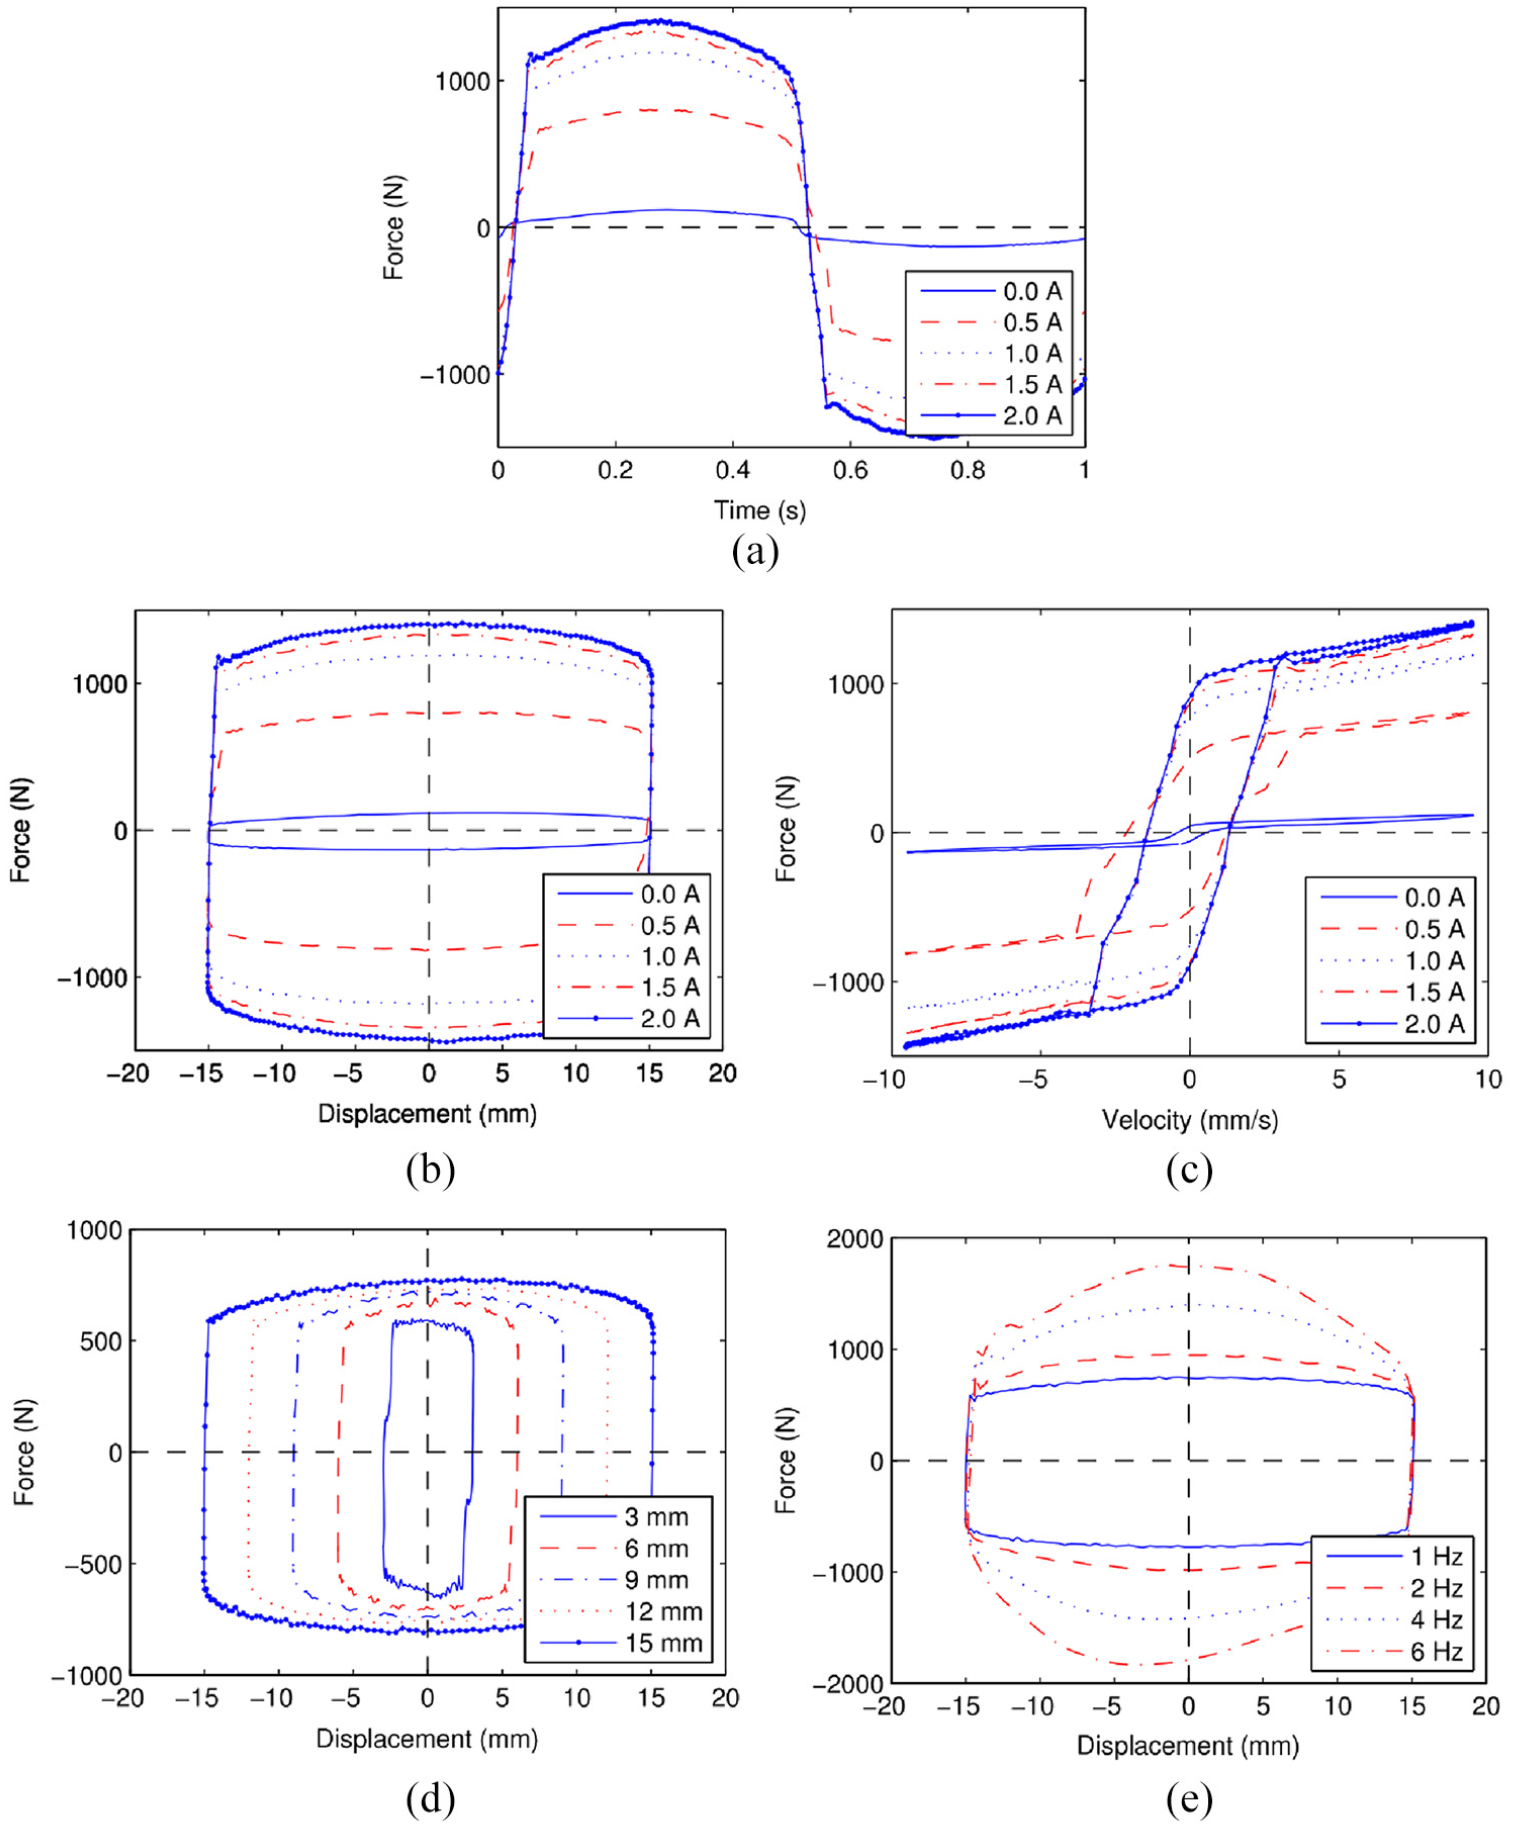
Characteristics of typical performance of MR dampers under cyclic loads (Wang and Liao, 2011): (a) time histories of damper forces at different input currents, (b) force-displacement curves (work diagrams), (c) force-velocity curves (characteristic diagrams), (d) work diagrams at different amplitudes of piston motion (measured at a frequency of 1 Hz and input current 0.5 A) and (e) work diagrams at different frequencies of piston motion (measured at an amplitude of 15 mm and input current 0.5 A).
The diagrams shown in Figure 1(a) to (e) indicate the characteristics of ideal behaviour of MR dampers reported in many studies (Bai et al., 2013; Wereley et al., 2004; Xu et al., 2012). In addition to the characteristics mentioned by Wang and Liao (2011), the following characteristics can be stated:
The increase of the maximum output force of the damper is seen to be nonlinear with the increase of input current, as shown in Figure 1(a). It can be inferred that the damper is affected by magnetic saturation at input currents higher than 2 A. Hence, the increase of the maximum output force becomes insignificant.
The area enclosed by each of the force-displacement (work) diagrams shown in Figure 1(b), (d) and (e) represents the energy absorbed by the MR damper, whereas the area enclosed by each of the force-velocity (characteristic) diagrams shown in Figure 1(c) represents the power dissipation due to the damping (Bai et al., 2013; Konieczny, 2016). The areas in both diagrams increase with increasing the applied current, piston velocity and displacement.
The hysteretic behaviour of the damper is obviously seen from the characteristic diagrams, as shown in Figure 1(c). It is indicated by the loops found on the curves, in which the damper exhibits a non-zero value of force at the instantaneous moments of zero velocity. The hysteretic behaviour can be also observed in the curves of force-time histories shown in Figure 1(a). However, it is hard to be recognised from the work diagrams shown in Figure 1(b), (d) and (e). That is because the hysteretic behaviour is represented by the small gradients of the curves, which are hardly seen, at the maximum limiting values of piston amplitudes. Therefore, the work diagrams are thought to be insufficient to assess the hysteretic behaviour of MR dampers.
The location of the maximum output force of the damper is seen to be around the instance of maximum velocity, as shown in Figure 1(a) and (c). These instances correspond to the time values of
The work diagrams are formed by a combination of rectangular and elliptical shapes, as shown in Figure 1(b), (d) and (e). The rectangular shape represents the plastic behaviour of the fluid (effect of fluid yield stress), whereas the elliptical shape depicts the viscous behaviour (Syrakos et al., 2016). The rectangular zone is enlarged by the increase of fluid yield stress, as shown in Figure 1(b), whereas the elliptical zone is expanded by the increase of fluid velocity caused by the motion of the piston with higher frequencies, as shown in Figure 1(e).
In this article, a new MR damper has been designed, manufactured and tested under cyclic load excitations. A faulty behaviour of the damper, whose characteristics are different from the ideal characteristics shown in Figure 1, was accidentally encountered. The reasons for that behaviour were analysed by the authors. To prove the validity of that analysis, the authors were motivated to develop a numerical approach that can represent this faulty behaviour. The current authors presented a numerical approach that predicted an ideal behaviour of an MR damper (Elsaady et al., 2020a). The dynamic characteristics of the damper were modelled on the basis of modelling of the rheological flow behaviour of MR fluid. That basis was shown to be advantageous in comparison with analytical one-dimensional models as shown earlier. In Elsaady et al. (2020a), the rheological flow in the damper was modelled taking into consideration the effects of non-uniform distribution of magnetic field, fluid compressibility and presence of an air pocket in the damper. The approach presented in the current study has been modified by adding the effect of air bubbles, whose presence has been attributed to causing the failure symptoms of the current MR damper.
In fact, there are quite few studies that report non-ideal behaviours or failure theories of MR fluid devices. However, reporting such faulty behaviours is thought to be necessary, as it may give insights into understanding the reasons for these behaviours and problems encountered in MR fluid research that may affect the durability of MR fluid applications. For instance, a highly-nonlinear and unexpected behaviour of an MR damper was found in Arsava and Kim (2015) due to damper operation under high impact loads. In terms of detection and modelling of such faulty behaviours, a fault-detection model of an automotive traditional hydraulic damper was presented by Hernandez-Alcantara et al. (2015). Moreover, a model of the ideal performance of an Electrorheological (ER) damper was developed in Morato et al. (2018), in which the model was modified so that it can account for the effects of different reasons for faulty behaviour. Examples of these reasons are: the effects of oil leakage, electrical faults, deformation of the fluid path and temperature increase of the fluid. A Finite Element Analysis (FEA) of the conditions that led to the failure of an automobile damper spring tower was presented in He et al. (2010). An MR damper design with fail-safe behaviour was developed by Böse and Ehrlich (2012). Bigué et al. (2019) proposed a relation between the durability of MR fluids and the ratio between magnetic and viscous forces. The durability of an MR fluid activated by magnetic field for a long time was investigated by Utami et al. (2018).
The paper is organised as follows, the design characteristics of the damper are presented in Section 2. The setup of experimental measurements and the analysis of the reasons for the current faulty behaviour are presented in Section 3. Then, the numerical method using FE and Computational Fluid Dynamics (CFD) analyses is illustrated in Section 4. The results of both models are discussed in Section 5, which shows the variation of different flow parameters in the faulty and faultless modes. Section 6 presents the ideal behaviour of the damper achieved after getting rid of the reasons that led to the current faulty behaviour. Finally, the conclusions are drawn in Section 7.
2. The new MR damper
2.1. Construction of the damper
A projected view of the current mono-tube MR damper is shown in Figure 2. The damper consists of an aluminium cylinder and a piston that separates the fluid domain into two chambers, namely compression and rebound chambers. The MR fluid is throttled between the chambers due to the movement of the piston via an annular throttling area in the piston. The compression chamber is connected to a bladder accumulator whose task is to store excess MR fluid in the compression stroke and supply additional MR fluid in the rebound stroke. The change in MR fluid volume is caused by the immersed/protruded part of the piston rod during piston motion. The accumulator is pre-charged at a pressure of 5 bars. A threaded hole is implemented in each cover of the aluminium cylinder in order to fix pressure transducers. The damper is provided with two adaptors to facilitate its installation on the testing machine; one of the two adaptors is attached to the left cylinder cover and the other adaptor is fixed at the end of the piston rod.
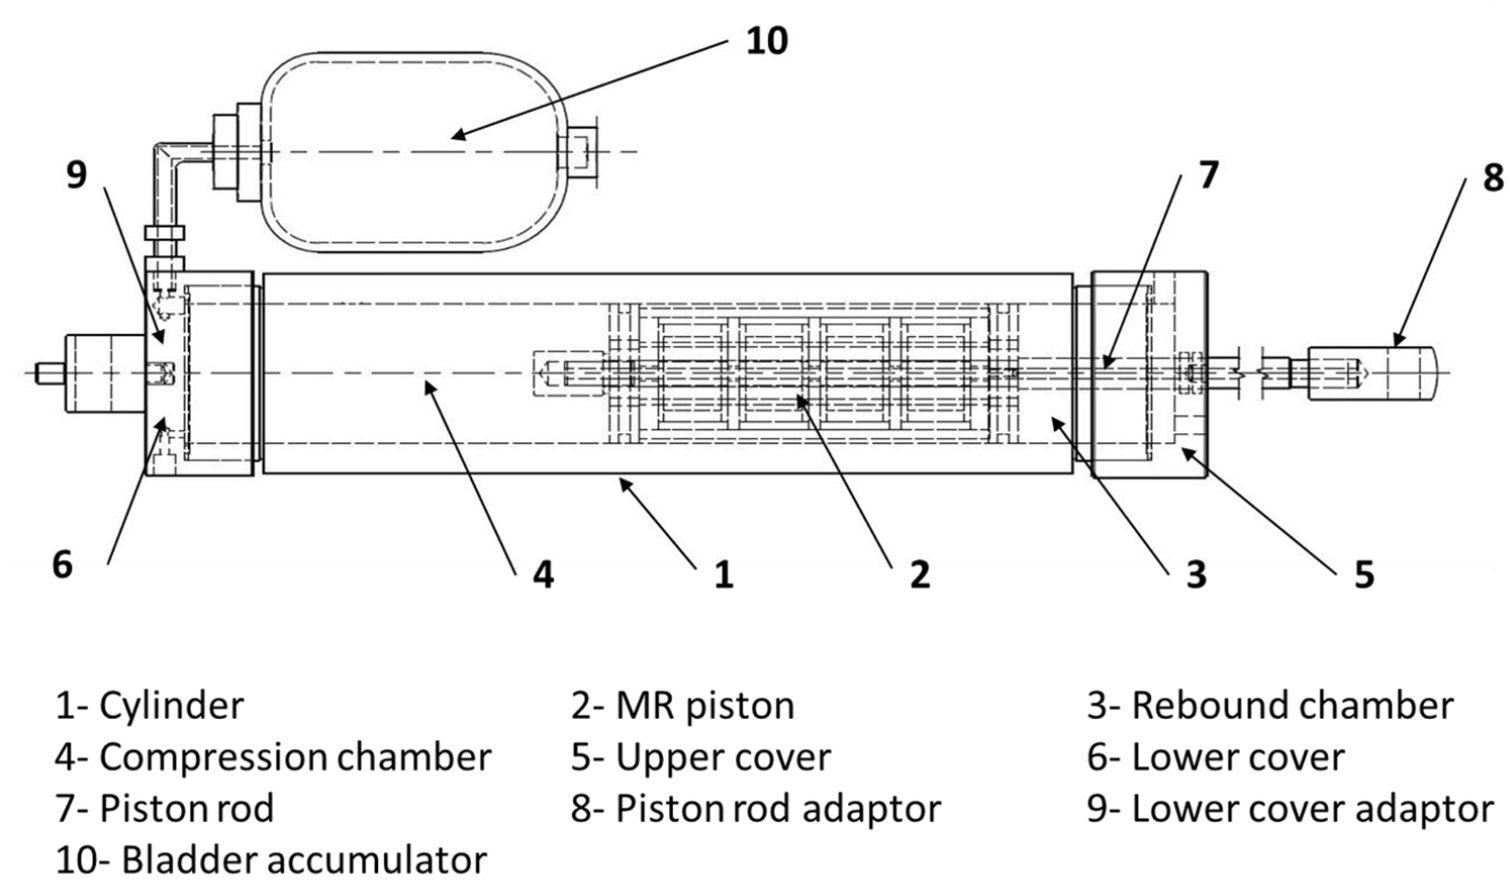
Projected view of the MR damper.
An iron-cobalt-vanadium alloy, known as “Vacoflux-50”, produced by Vacuumschmelze GmbH (2018a, 2018b) in Germany, was used in the current design. This material is shown to have a very high magnetic permeability compared to most carbon steel alloys which are the common magnetic materials used with MR dampers (Desai et al., 2019; Heo and Joonryong, 2014; Li et al., 2019; Macháček, 2019; Manjeet and Sujatha, 2019; Strecker et al., 2019; Ulasyar and Lazoglu, 2018). The saturation limit of most carbon steel alloys is below 1.6 T (Oxley et al., 2009), whereas it tends to 2.35 T for Vacoflux-50. The
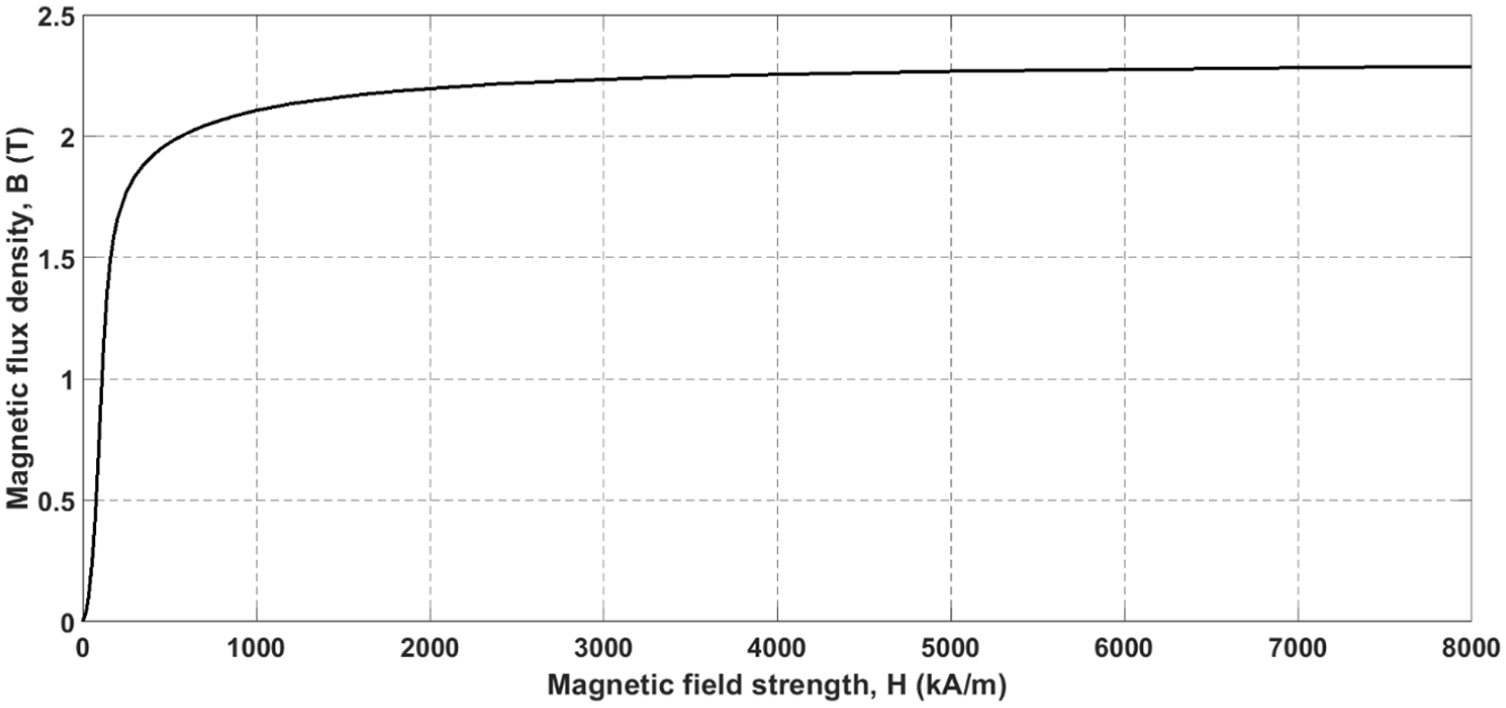
Magnetic field density,
A cross-sectional view of the MR piston is shown in Figure 4(a). The piston contains four coil assemblies and five magnetic spacers. The coils are wound on plastic bobbins and surrounded by plastic isolators. The coil assemblies and the five magnetic spacers are press-fitted (interference fit) into an outer hollow cylinder made of Vacoflux-50. A magnetic core made also of Vacoflux-50 is fitted on the aluminium piston rod to allow the flow of magnetic flux across the MR fluid region. Thus, the throttling area of the piston is represented by the annular MR fluid region between the outer surface of the magnetic core and the inner surface of the coil bobbins.
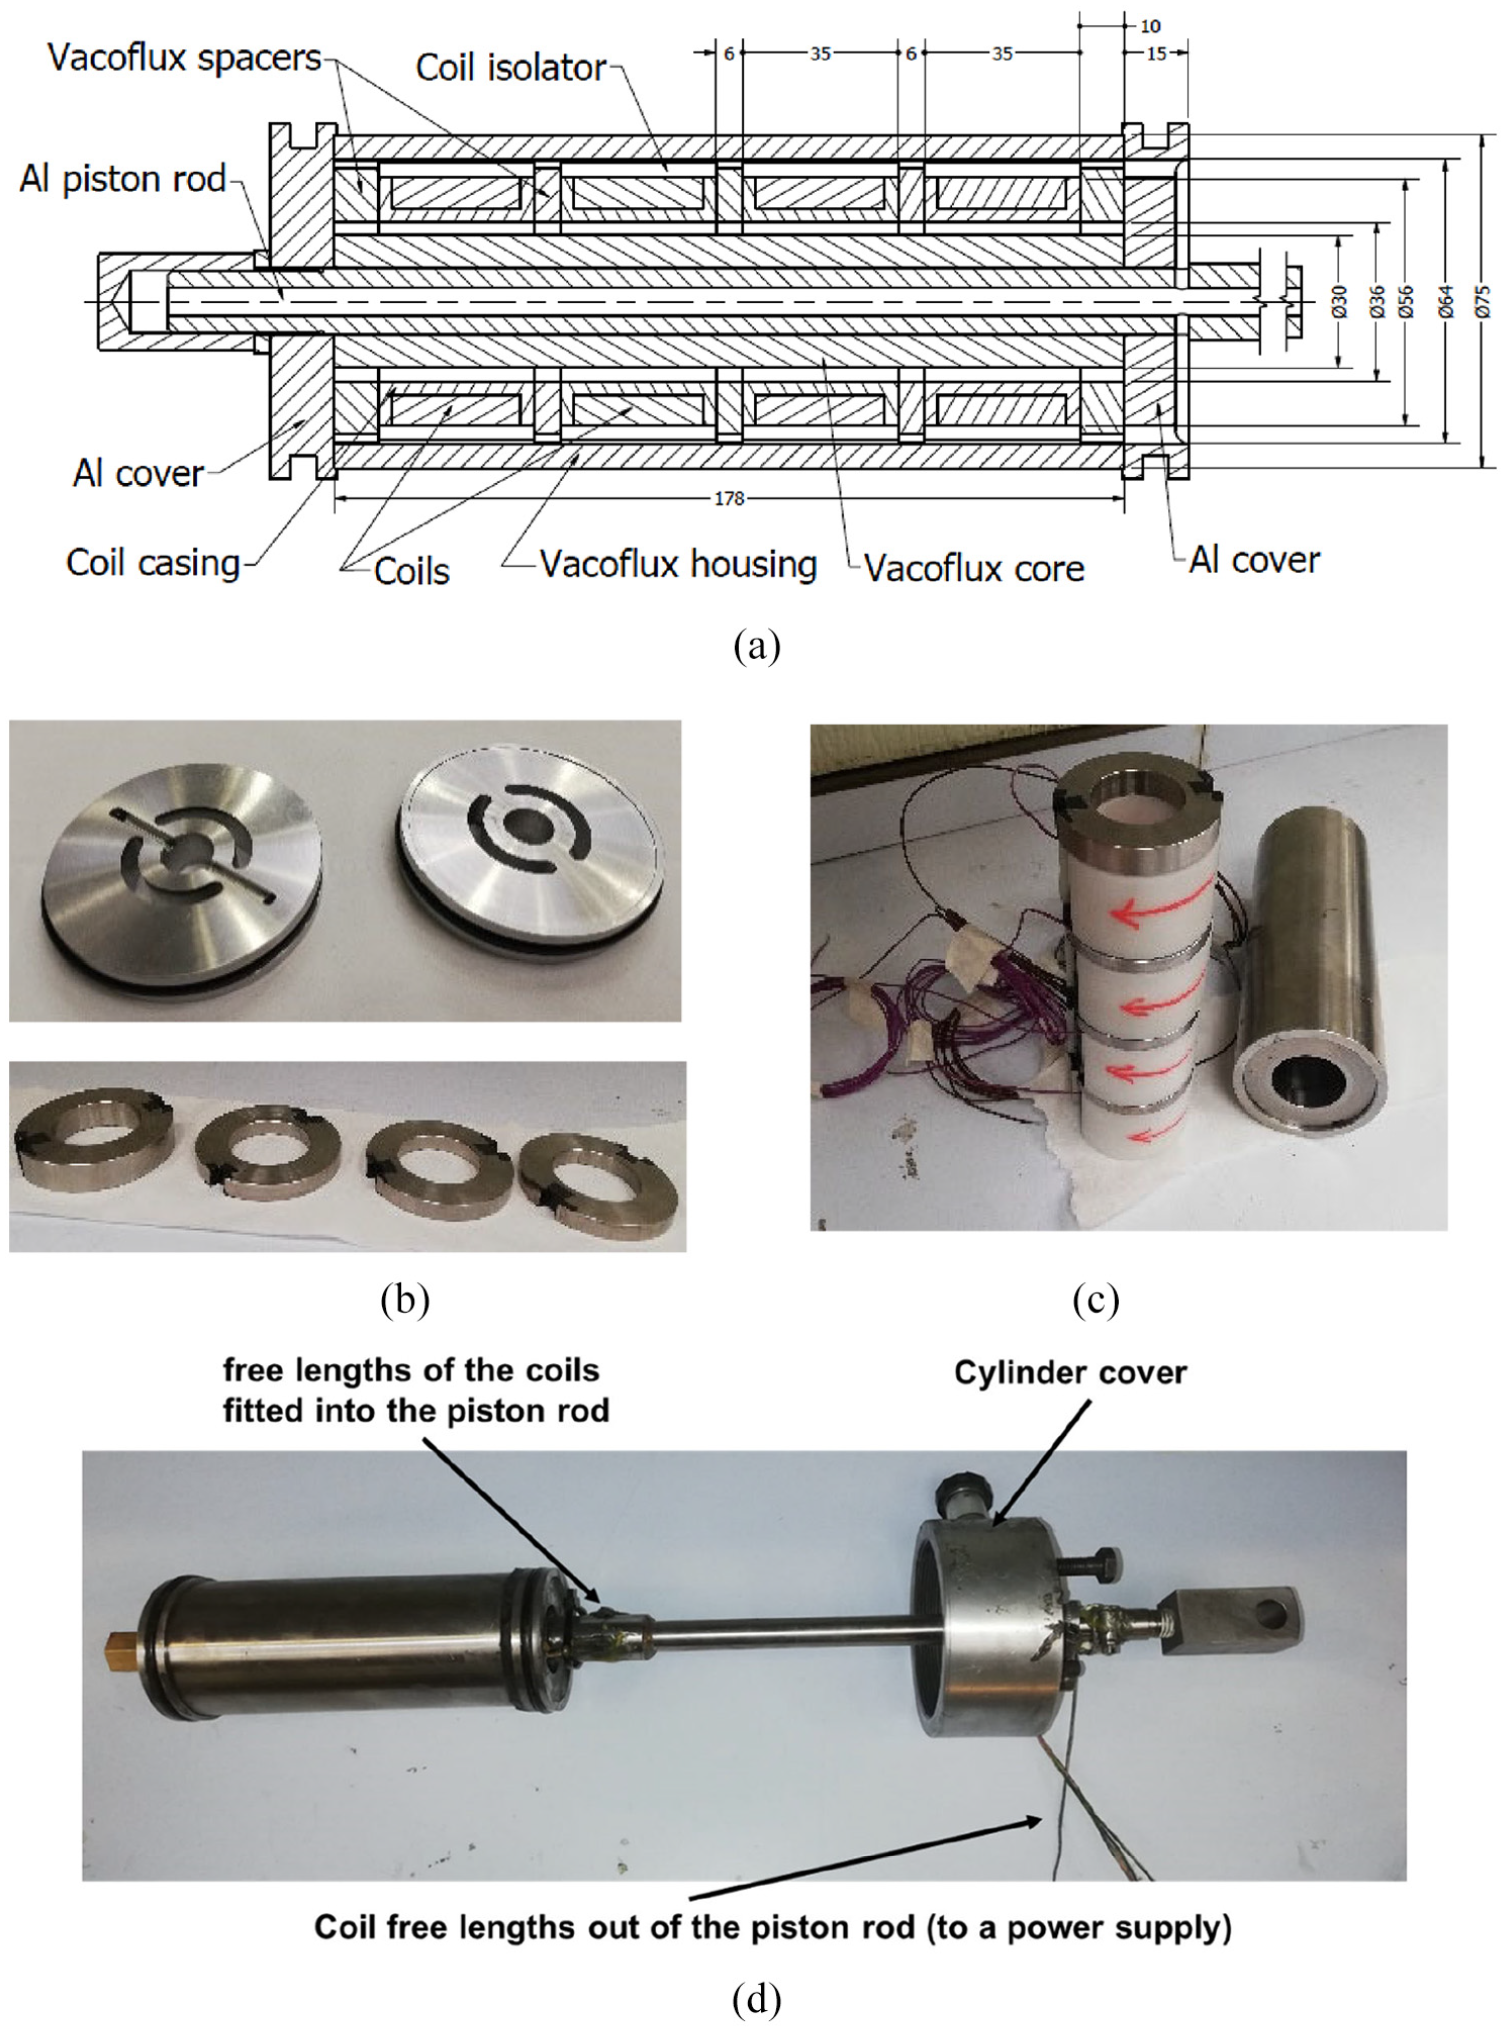
Construction of the new MR piston: (a) cross-sectional view of the piston, (b) the aluminium covers and the magnetic Vacoflux-50 spacers, (c) the alignment of coil assemblies and spacers in the outer housing and (d) piston assembly.
The piston is enclosed by two aluminium covers provided with openings to permit the flow of MR fluid, as shown in Figure 4(b). The magnetic spacers are provided with radial notches, as also shown in Figure 4(b). The notches are employed so that the free wire lengths of the coils pass through them out of the piston. The alignment of the coils and magnetic spacers in the outer housing is shown in Figure 4(c), which shows also the direction of coil windings. The free wire lengths of the coils coming out of the piston are fitted through the holes provided in the right aluminium cover. Then, the wires are fitted into the piston rod through two radial holes in the rod, as shown in Figure 4(d). The wires come out of the piston rod from an opening provided at the end of the rod so that the wire terminals can be connected to a power supply.
The use of a nonmagnetic piston rod was mandatory in the current study, although the magnetic flux density was predicted to be lower in comparison with the density due to the use of a magnetic material. The reason for the use of aluminium is the limitations of machining capabilities in the workshop where the components of the damper were manufactured. To allow fitting of the free wire lengths, it was necessary to drill a very long axial hole through the centre of the piston rod. However, if the piston material is relatively hard such as any type of magnetic steel alloys, it was hard to drill that hole. Hence, a commercially available hollow aluminium alloy tube of the right dimensions was used, and a reasonable thickness of magnetic Vacoflux-50 material was employed as an inner magnetic core to permit the flow of magnetic flux across the MR fluid region.
2.2. Magnetic properties of AMT-Smartec+ MR fluid
As it was aimed that the current MR damper should be capable of resisting high loads, an MR fluid with high magnetic permeability and yield stress was used. The AMT-Smartec+ MR fluid, produced by Arus MR Tech Company was used in the current study. The fluid characteristics are not reported in the literature as the company that produces the fluid has been recently established in 2015. The AMT-Smartec+ MR fluid has high magnetic permeability and yield stress in comparison with other common types of MR fluids, as will be shown in this section. Therefore, it was also aimed in this study to use this fluid as its advertised characteristics seem to be better than other commercially available MR fluids. In the literature available to the authors, another MR fluid produced by the same company, termed as “AMT-Magnaflo”, was used in Aravind et al. (2018) with the purpose of enhancing surface roughness of materials by the use of MR fluids during machining.
The characteristics of the AMT-Smartec+ MR fluid are compared with those of other well-known fluids, namely: the MRF-132DG and MRF-140CG MR fluids produced by LORD Corporation, and the MRHCCS4-B MR fluid produced by Liquids Research Ltd (2018). The characteristics compared are the
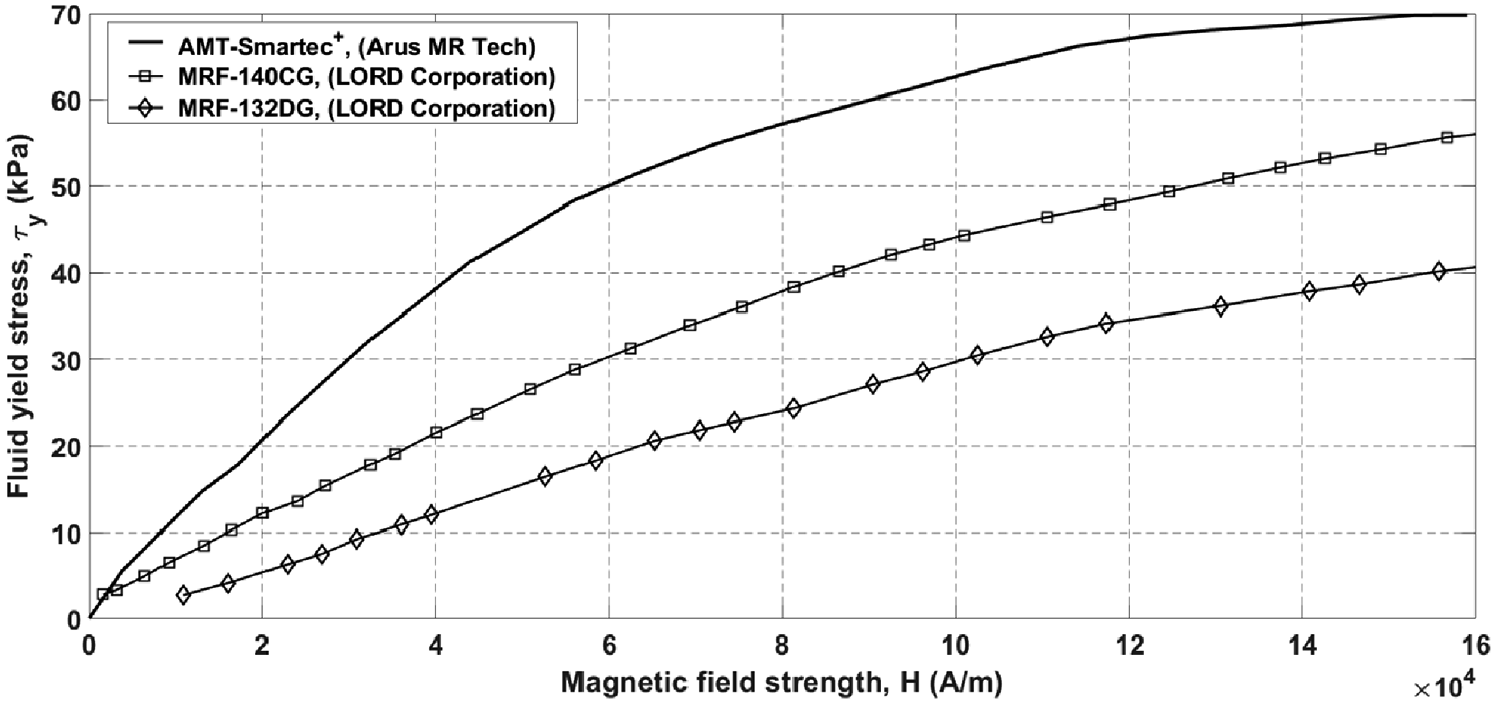
Yield stress,
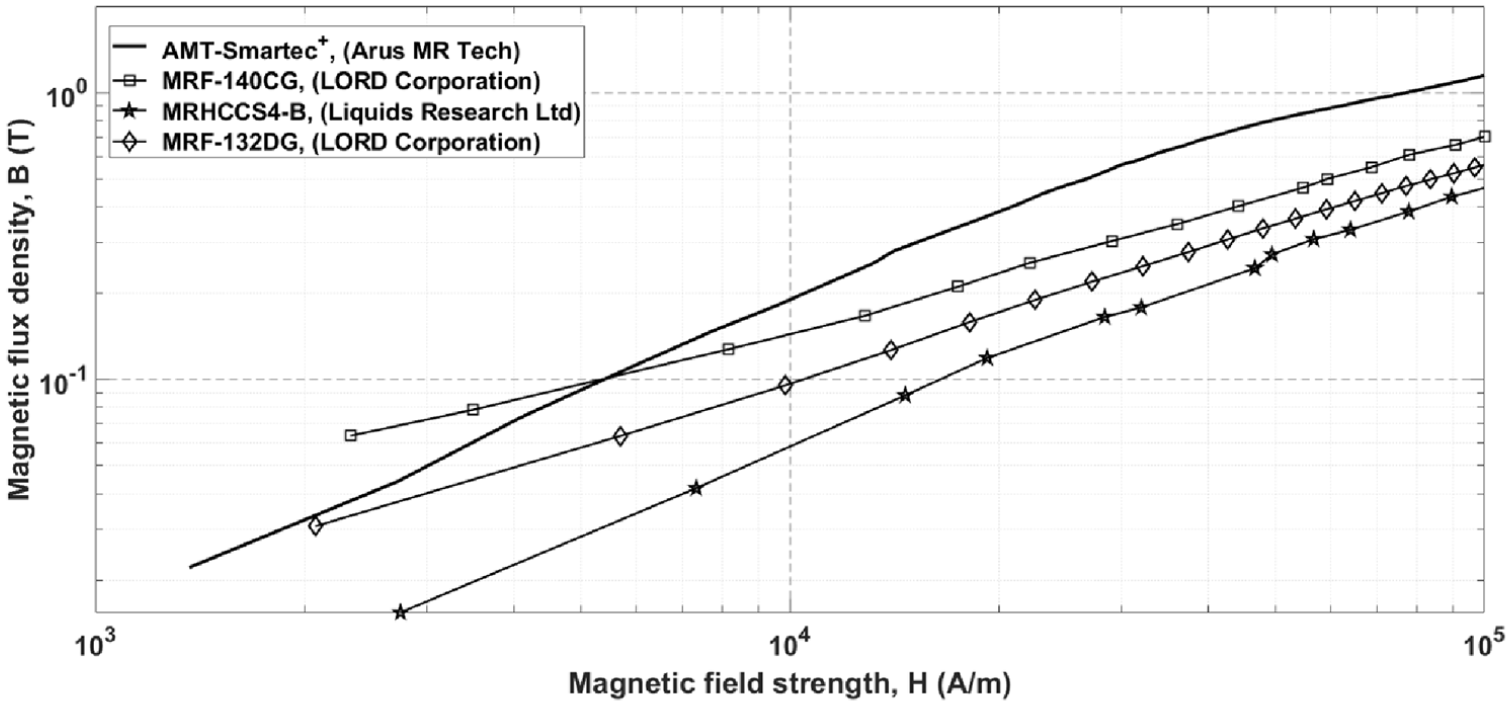
Magnetic field density,
Figure 5 shows that the AMT-Smartec+ MR fluid has higher yield stress compared to the MRF-140CG, which is the highest MR fluid produced by LORD Corporation in terms of yield stress. Figure 6 also shows that the AMT-Smartec+ MR fluid has a higher magnetic saturation limit compared to the other investigated fluids. The
A sample of the AMT-Smartec+ MR fluid has been visually inspected in comparison with another sample of the MRF-132DG MR fluid. Firstly, the two samples with the same volume are put in a small container, as shown in Figure 7(a). Then, the two samples were put successively on a magnet, as shown in Figure 7(b) and (c). Figure 7(a) indicates that the viscosity of the AMT-Smartec+ MR fluid in the absence of the magnetic field is much higher than that of the MRF-132DG MR fluid. It is seen that the AMT-Smartec+ MR fluid does not take the shape of the container, unlike the MRF-132DG MR fluid. That high viscosity can be also indicated in the datasheets of both fluids, although the online available data of both fluids in terms of density and weight fraction of ferromagnetic particles are nearly the same (
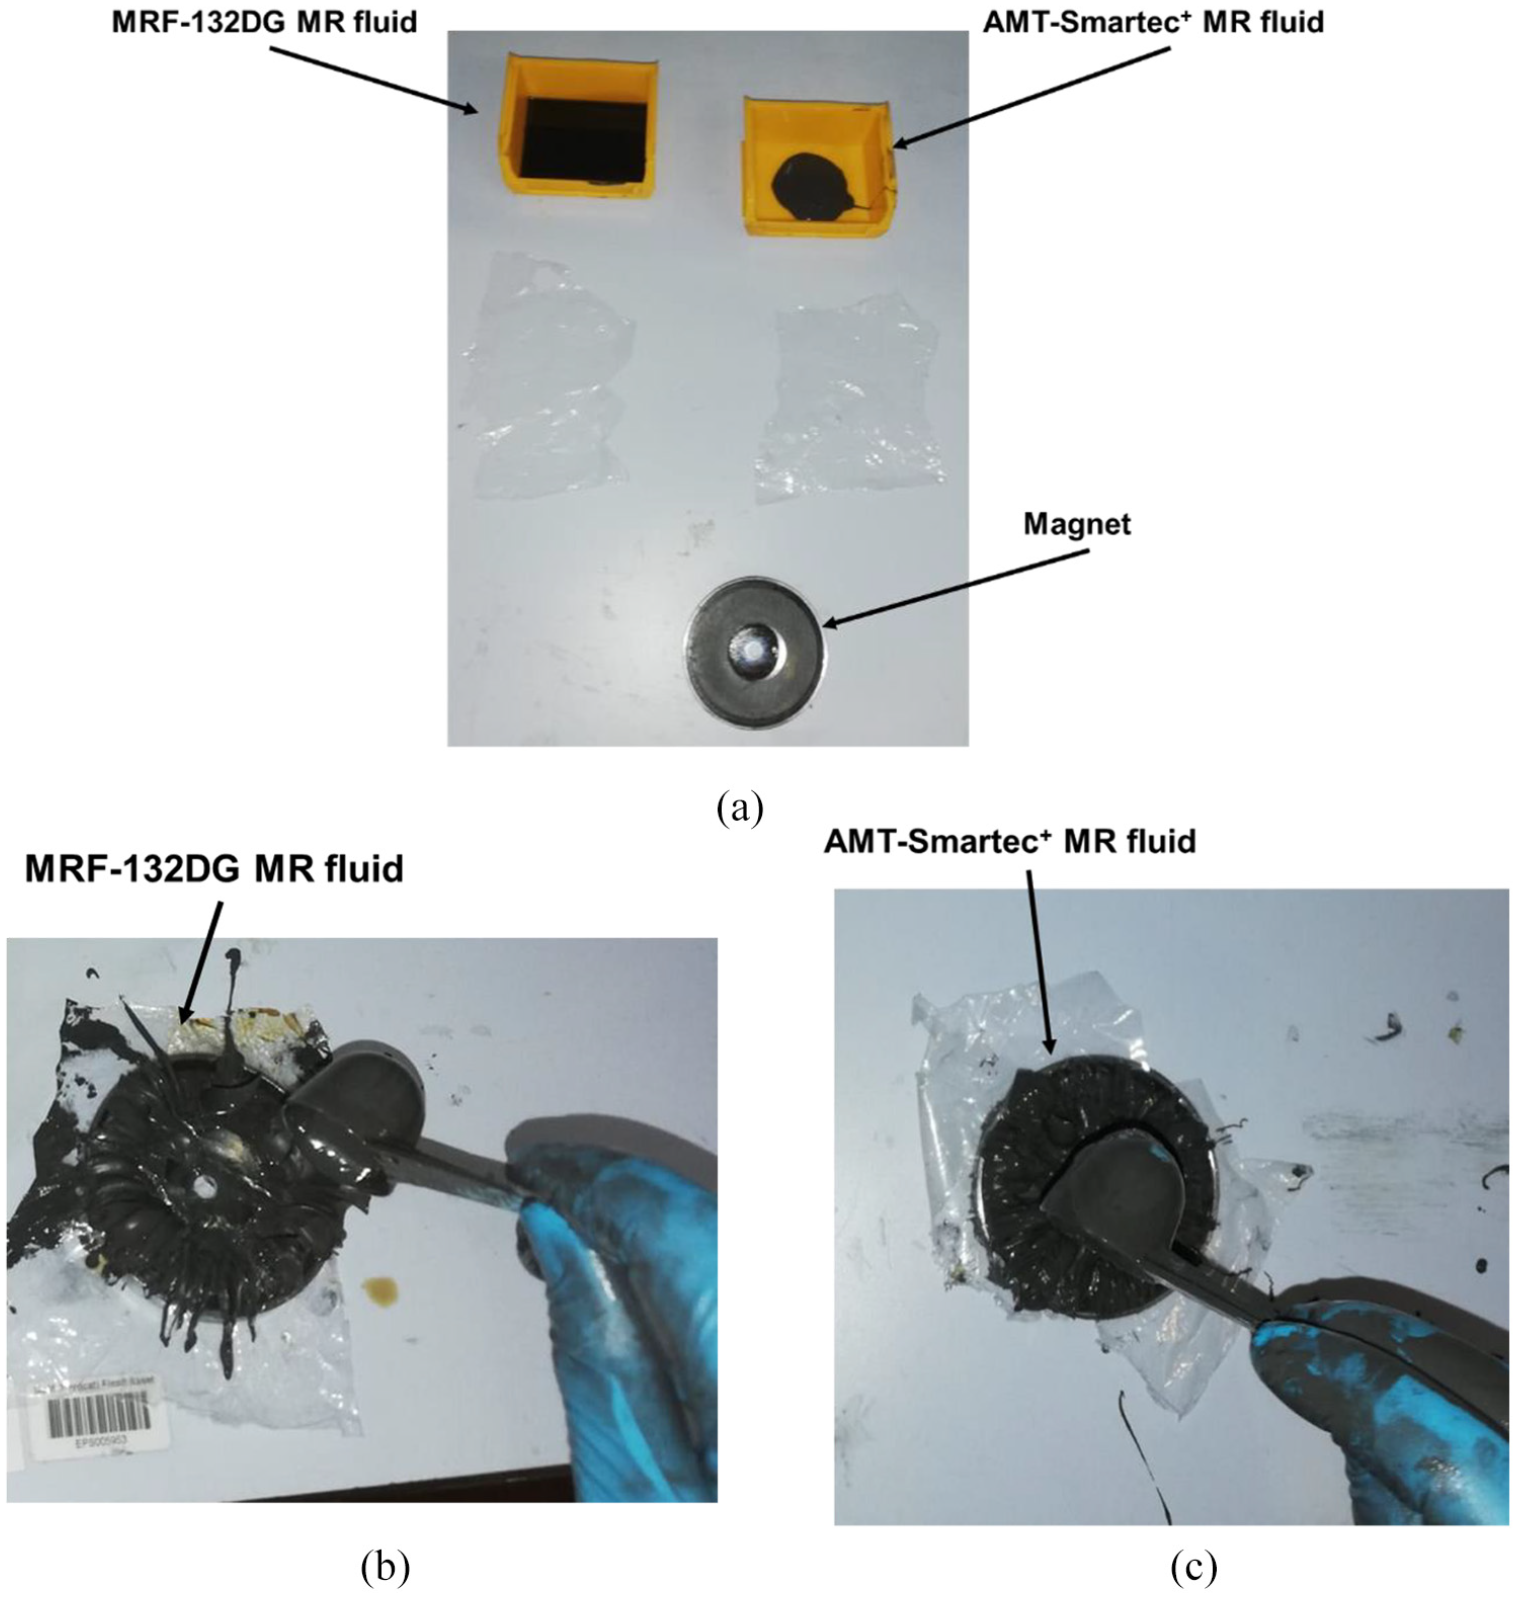
Evaluation of the magnetic effect of AMT-Smartec+ MR fluid in comparison with LORD-132DG fluid: (a) two samples of the fluids showing the relatively high viscosity of AMT-Smartec+ MR fluid, (b) a sample of LORD-132DG MR fluid placed on a permanent magnet and (c) a sample of AMT-Smartec+ MR fluid placed on the same magnet.
It was realised that in the presence of the magnet, the resistance force to scope the MR fluid is about the same, as shown in Figure 7(b) and (c). Therefore, the magnetic effect of both fluids was nearly the same, although the fluid yield stress of the AMT-Smartec+ MR fluid is quoted to be higher. Also, the low viscosity of the MRF-132DG MR fluid at zero magnetic fields is more advantageous, as it provides a wider range of magnetic effect compared to that of the AMT-Smartec+ MR fluid. The high viscosity of an MR fluid in off-state is thought to be a major drawback, as it reduces the dynamic range in which the fluid is operated. Also, this high viscosity makes the fluid more liable to the In-Use Thickening (IUT) problem, in which an MR fluid transforms into a paste due to being activated by magnetic field for a long time (Kumar et al., 2019). It should be noted that MR dampers are often employed in mechanical suspension systems of luxury cars since they give a better response to road conditions. That response may not be achieved if the viscosity of the MR fluid in the off-state is high.
Moreover, another drawback of the high viscosity of an MR fluid in its off-state has been found in the light of the experiments conducted in the current study. It has been found that the fluid is highly affected by the presence of air bubbles, as will be shown in Section 3. The use of the AMT-Smartec+ MR fluid in the current study was based on the technical data presented in Figures 5 and 6, as it was expected that the current MR damper design using the AMT-Smartec+ MR fluid can resist higher loads. Also, it was aimed in this work to present the characteristics of this fluid in MR dampers. The unfavourable effect of high fluid viscosity in the absence of magnetic field was accepted as long as the fluid imposes high magnetic properties which lead to achieving a high output force of the damper. However, that high output force was rather not achieved due to the high off-state viscosity which was thought to be probably partly responsible for the pollution of fluid by air bubbles, as will be discussed in Section 3.
3. Experimental measurements
The performance of the current MR damper was tested under cyclic load excitations using the Electro-Servo-Hydraulic (ESH) machine. The ESH machine consists mainly of three parts, namely: the control unit, shown in Figure 8(a), the loading frame, shown in Figure 8(b) and the hydraulic power supply unit (not shown). The damper was installed on the loading frame using fixtures connected to the upper and lower cross-head beams, as shown in Figure 8(b). The lower cross-head beam has a built-in load cell that measures the variations of damper force. The upper cross-head beam contains a servo actuator whose task is to apply excitations to the piston rod. The actuator has a built-in Linear Voltage Displacement Transducer (LVDT) that measures the displacement of the piston rod. Pressure transducers were screwed in the covers of the damper cylinder to record fluid pressure at different locations. The difference between the force obtained directly from the load cell and the one deduced from the pressure difference represents the total friction and inertia forces of the piston.
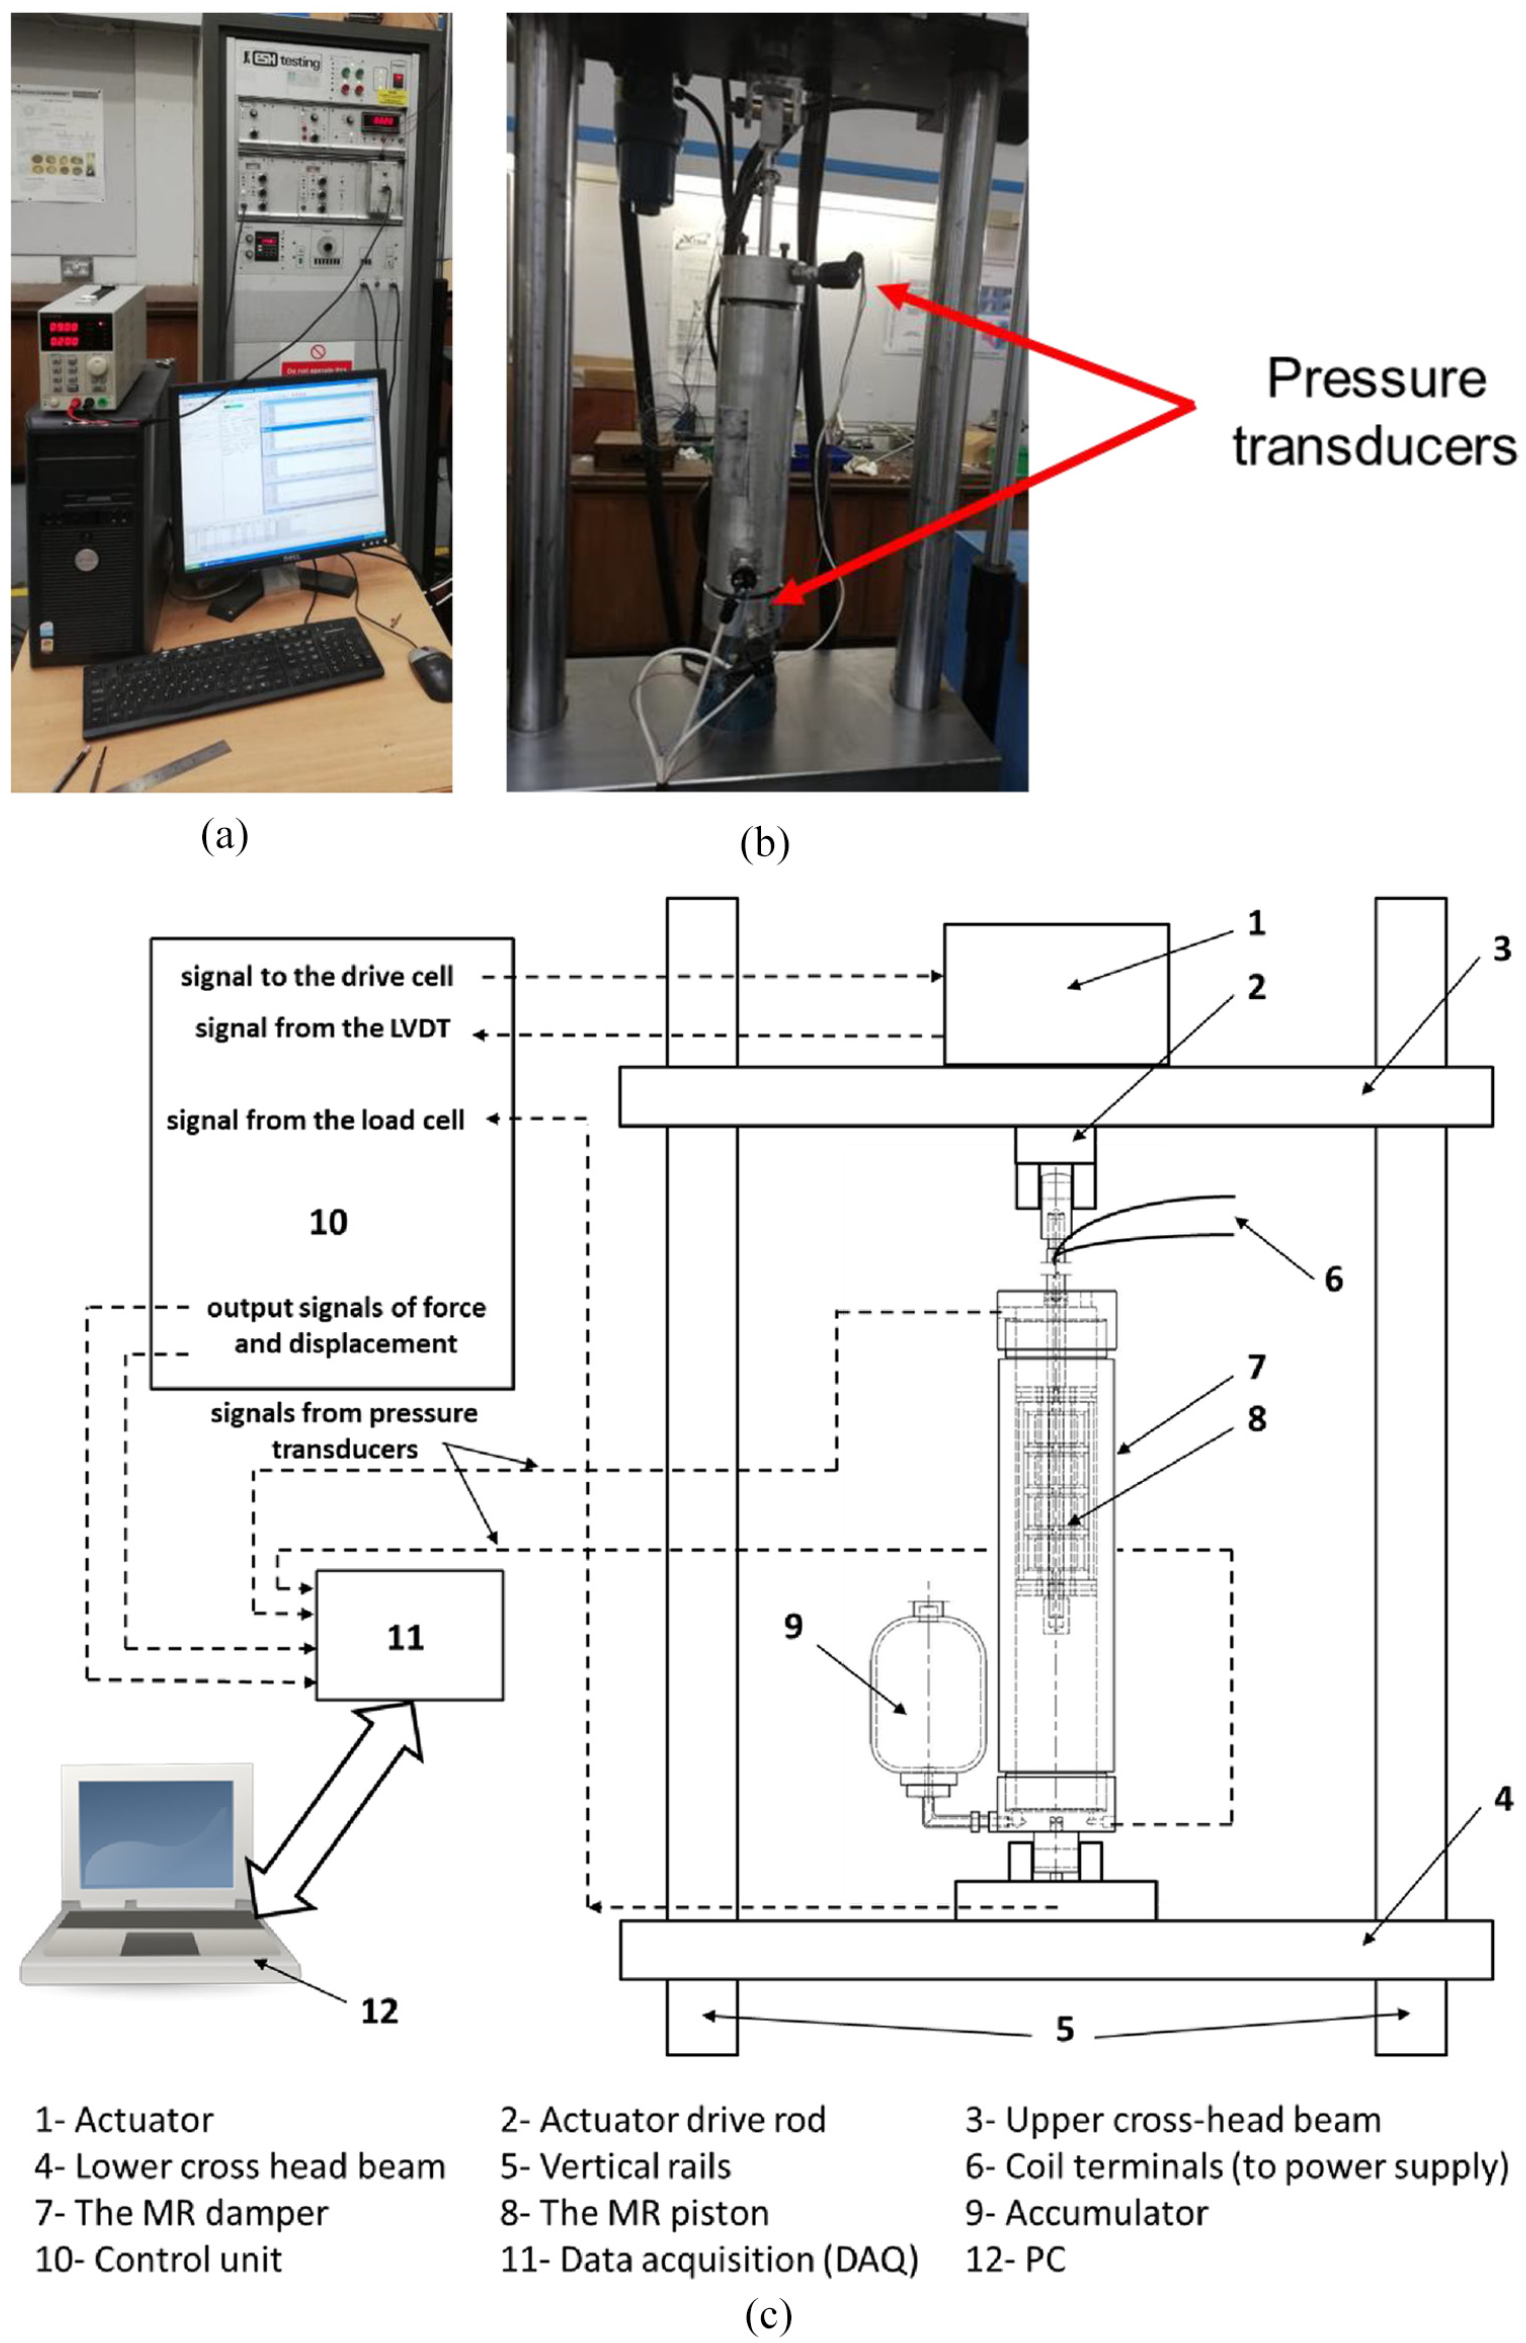
Setup of the MR damper on the ESH machine: (a) the control unit and the measuring software, (b) installation of the MR damper on the machine and (c) wiring diagram of the measuring circuit.
A schematic diagram of the measuring circuit is shown in Figure 8(c). The control unit operates the actuator via a voltage signal coming from the Data Physics Data Acquisition System (DAQ). The analogue signals from both the LVDT, load cell and pressure transducers are directed to the DAQ and viewed on a computer. The model of the pressure transducers is ATM.ECO, whose range is 100 bars.
The experimental measurements were performed at different frequencies and amplitudes of piston motion and different excitation currents to the piston. However, a leakage problem was detected at the location of the lower cover, as shown in Figure 9. The reason for that leakage is thought to be due to the improper sealing caused by bad characteristics of aluminium-on-aluminium threading.
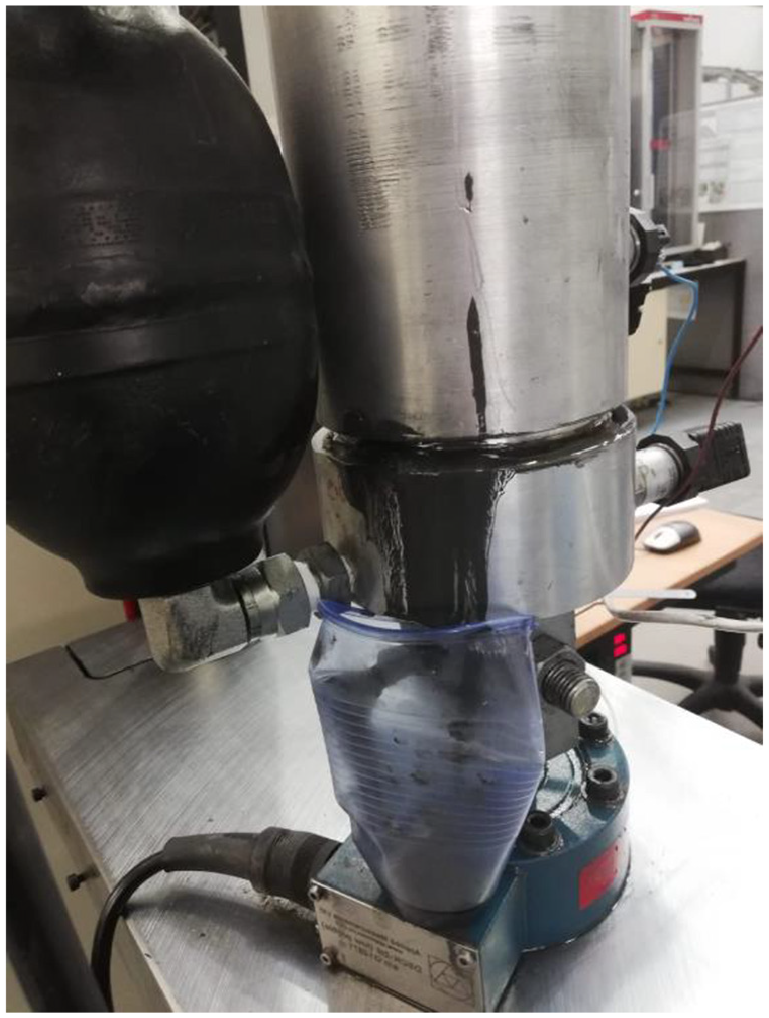
Detected leakage from the damper.
The measurements were performed, despite the leakage detected, to evaluate the characteristics of the faulty behaviour of the damper. The values investigated for motion frequency,
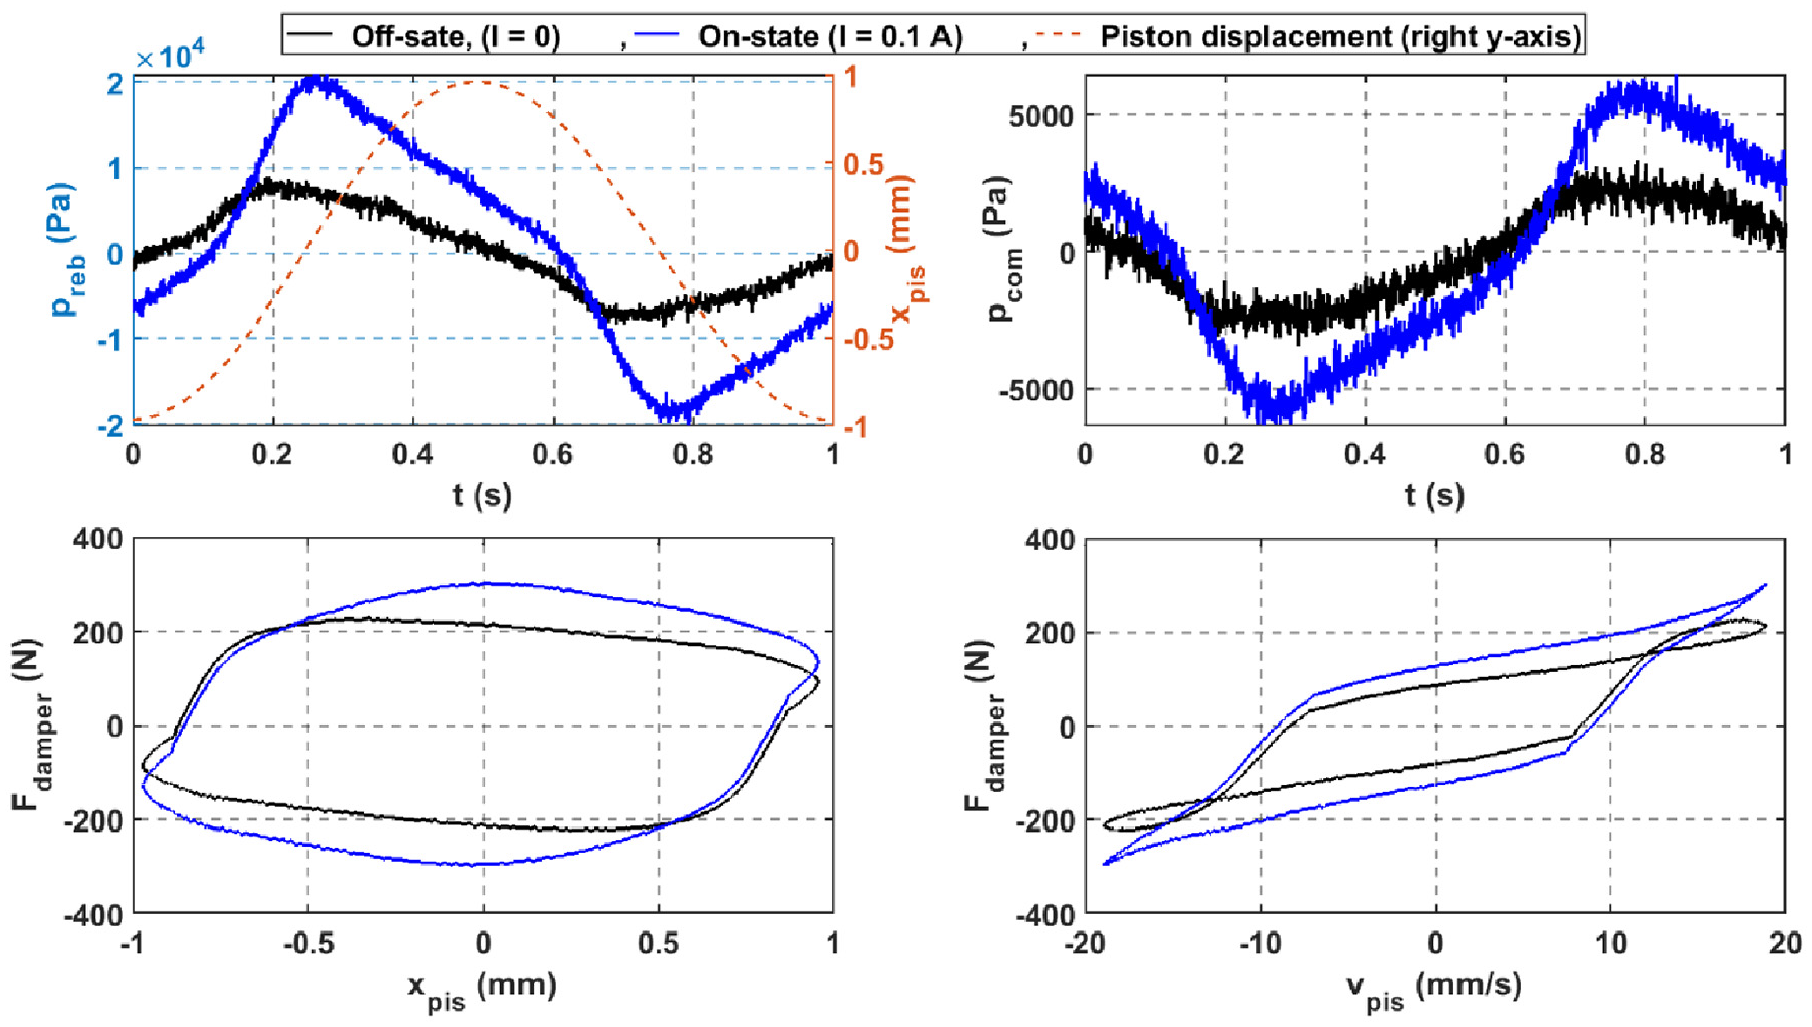
The results obtained for the measured parameters employing the aforementioned values of motion frequencies and amplitudes show the same profiles shown in Figures 10 and 11. Figure 10(a) shows the time histories of the measured parameters at different input currents,
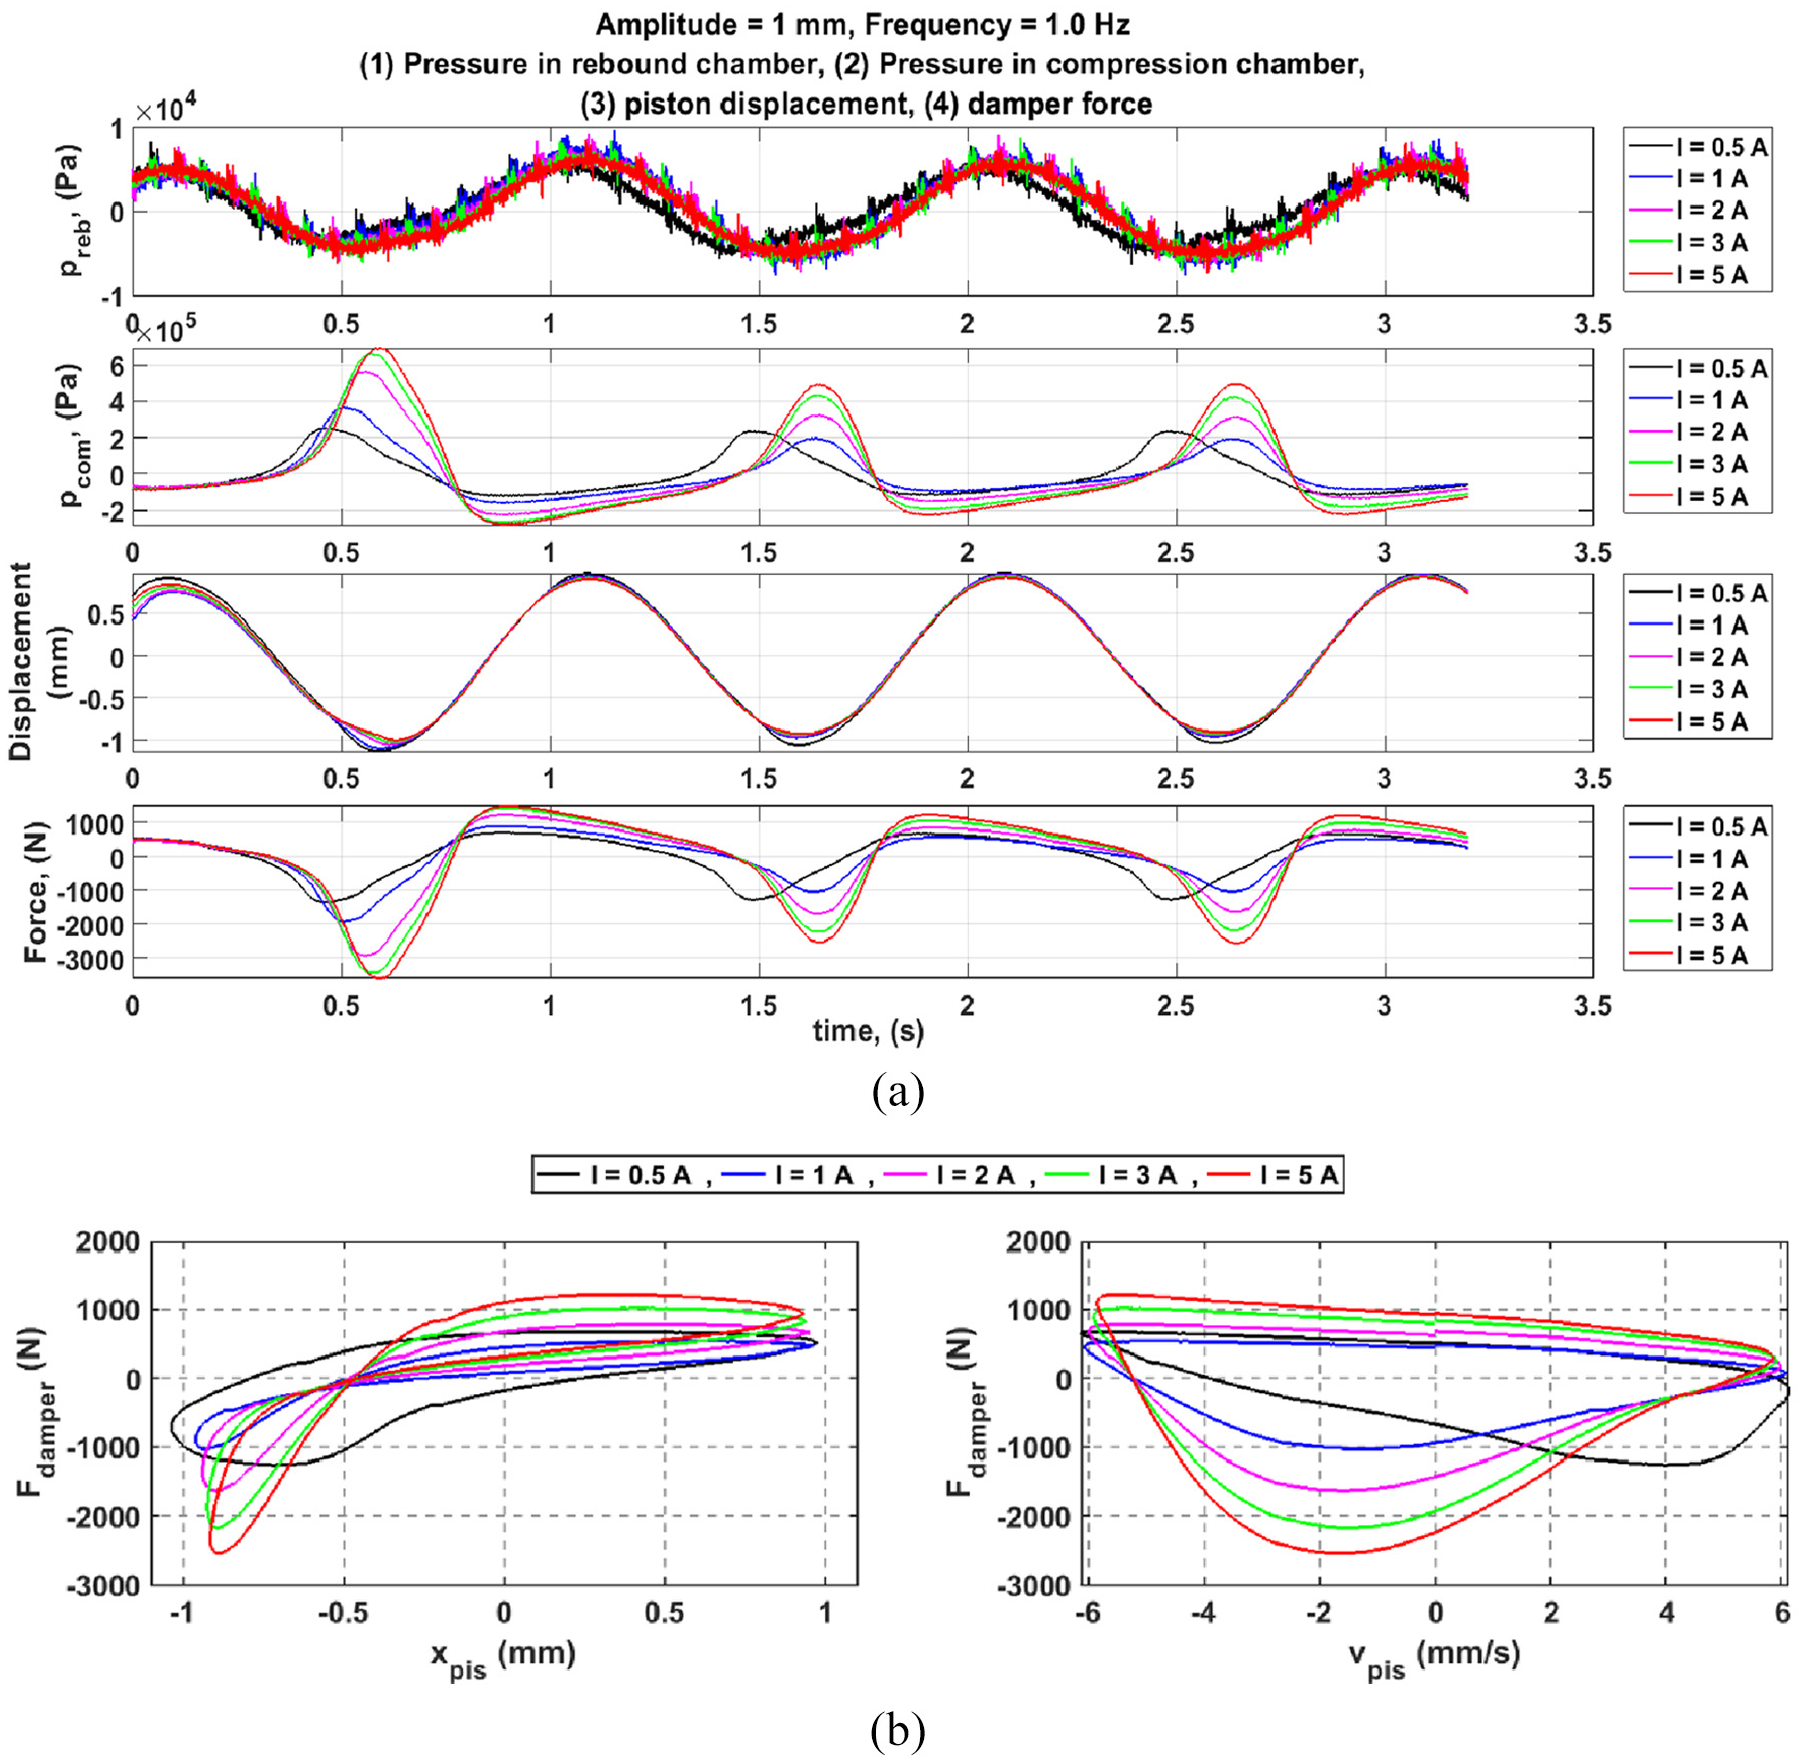
Experimental characterisation of the faulty behaviour of the MR damper at different input currents,
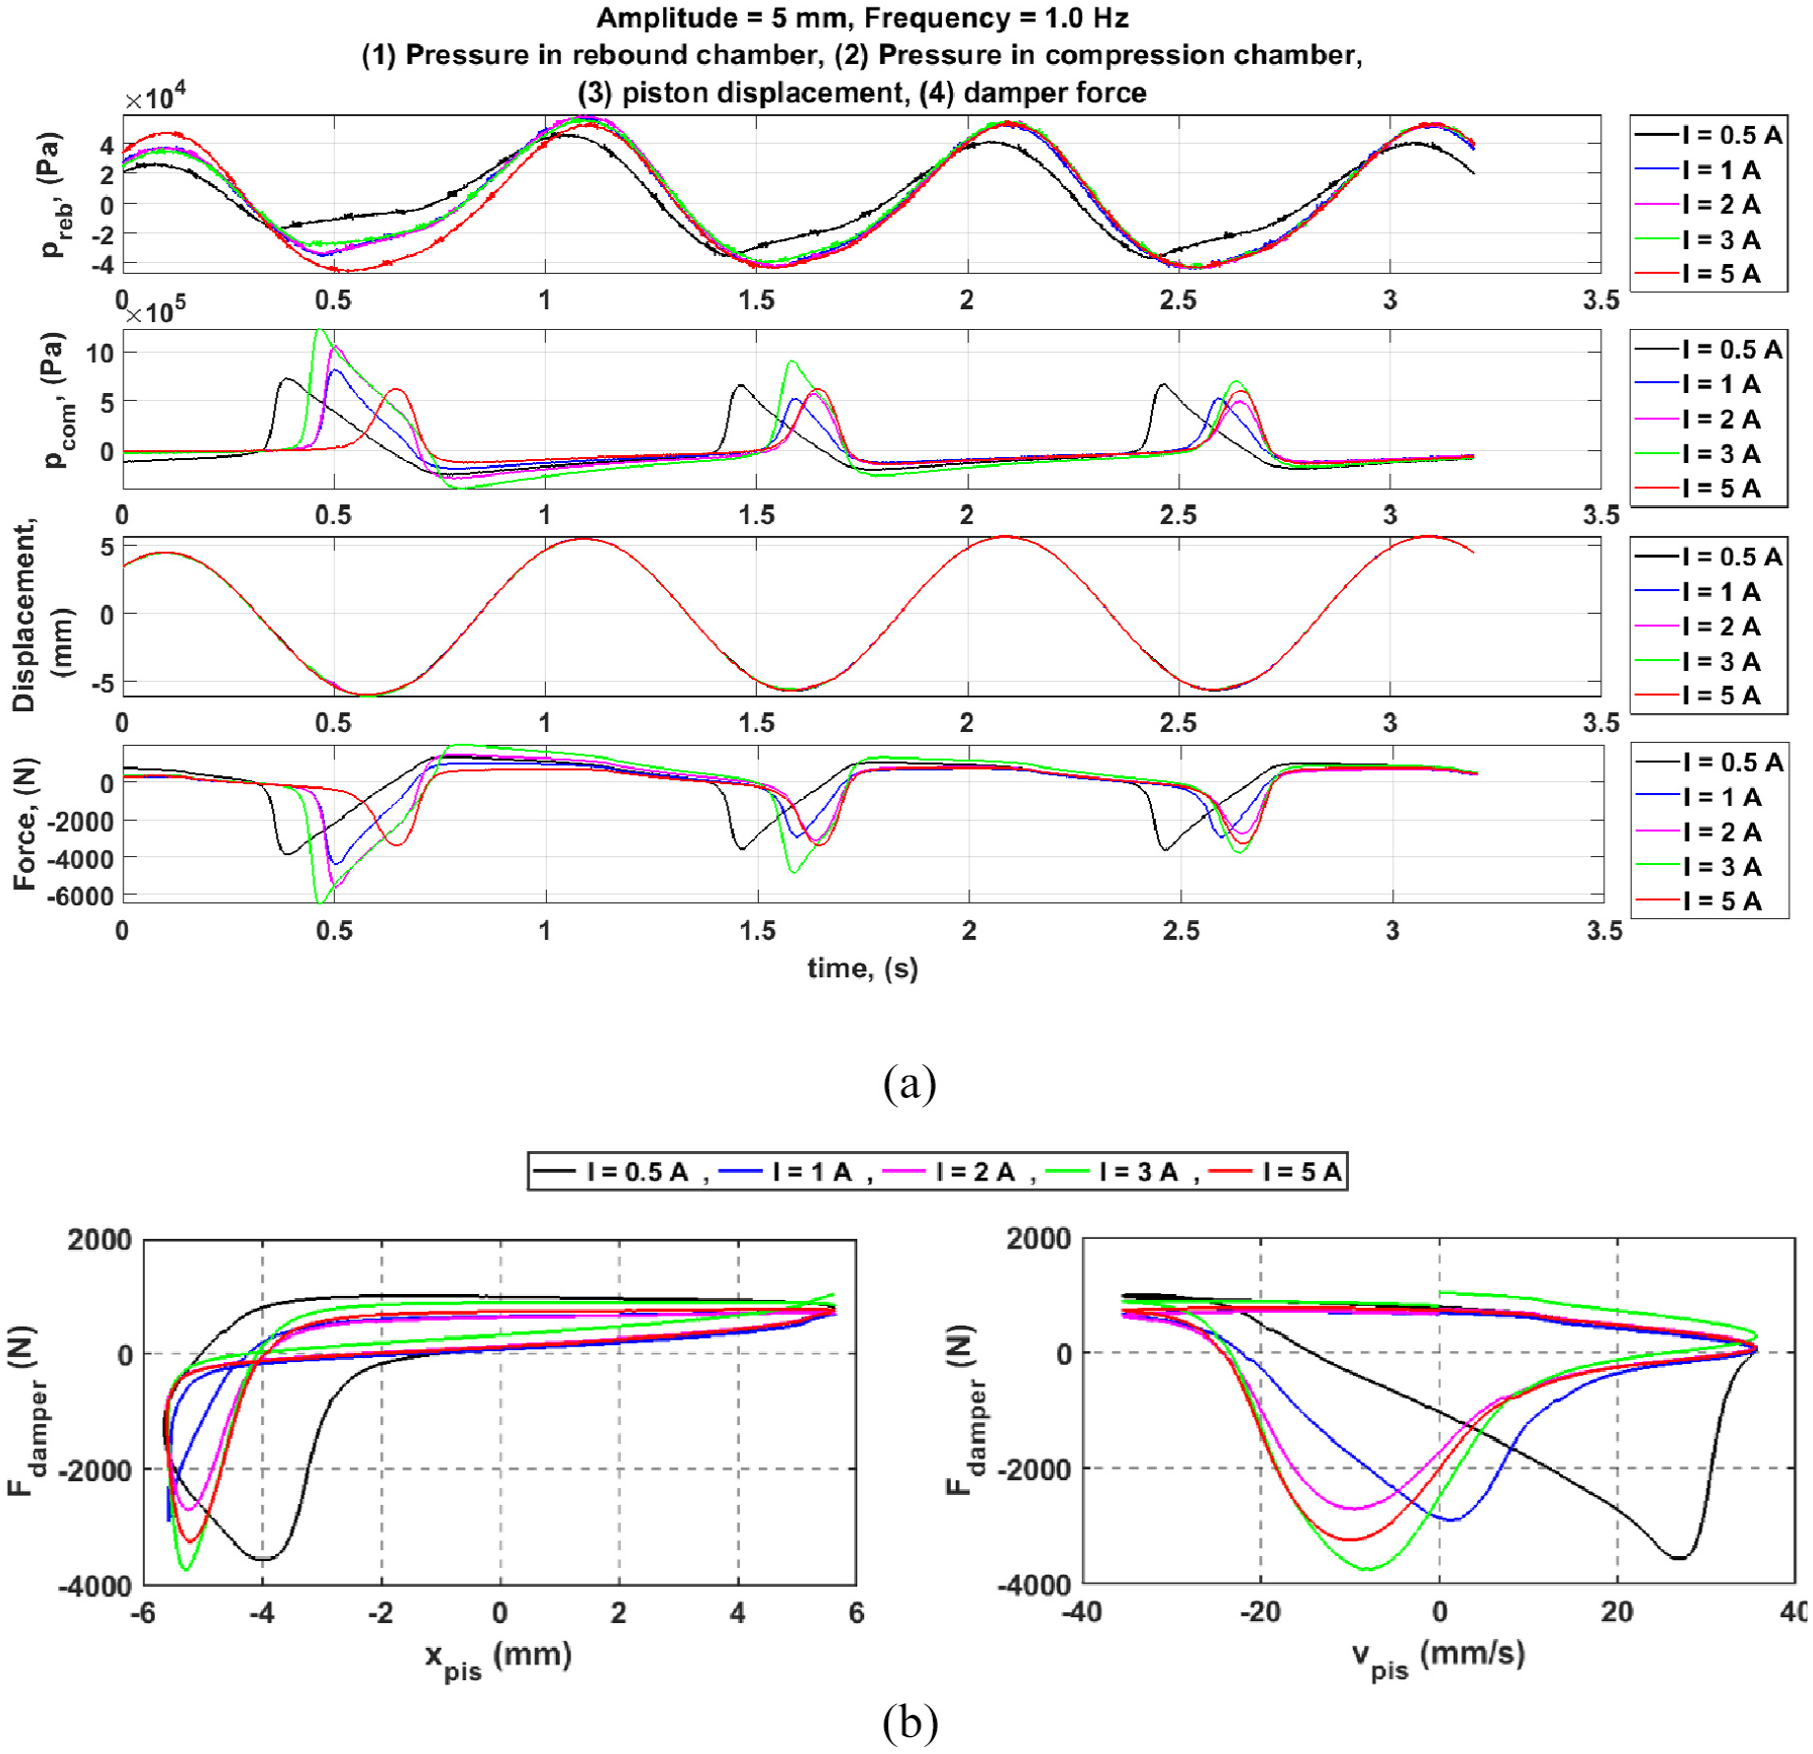
Experimental characterisation of the faulty behaviour of the MR damper at different input currents,
3.1. Analysis of the experimental results
It can be deduced from the results shown in Figures 10 and 11 that the damper exhibits an unusual behaviour due to the following facts that can be seen in the figures:
The higher pressure is seen to occur in the compression chamber rather than in the rebound chamber. This is unusual because the pressure should be lower in the compression chamber as the chamber is connected to the bladder accumulator. Therefore, the change in pressure due to gas compression and expansion in the accumulator was expected to be small, as in Chooi and Oyadiji (2009a) and Xu et al. (2019). This observation indicates that the accumulator was not functional due to the fluid leakage. It was deduced that the fluid in the compression chamber did not flow into the accumulator; therefore, it did not compress the gas chamber in the accumulator. This is because the pressure in the compression chamber is less than the threshold pressure (the pre-charge pressure) of 5 bar that was required to open the accumulator valve. On the other hand, the fluid leakage caused an air pocket to be formed in the rebound chamber as the damper was fixed in a vertical position. Therefore, the presence of this air pocket caused relatively lower pressure in the rebound chamber, but a relatively higher pressure in the compression chamber.
The symptoms of the faulty behaviour of the current MR damper are indicated by the work and characteristic diagrams shown in Figures 10 and 11. It is seen that all diagrams exhibit unexpected and rather strange profiles compared to the ideal characteristics shown in Figure 1(b) to (e). Also, the increase of the energy dissipated (area enclosed by work diagrams) and the dissipation power due to damping (area enclosed by characteristic diagrams) with the input current were expected to be higher with respect to those areas shown in Figure 1(b) to (e) and in Konieczny (2016).
The damper force is not consistent in each cycle. The force is seen to be higher in the first cycle, then, it significantly reduces in the next cycle. The variation between the second and third cycle can be neglected. The reason for that behaviour is thought to be due to inhomogeneity and improper characteristics of the fluid. The fluid seems to from a rigid plug in the throttling area, therefore a high force is exhibited. However, the plug is thought to be weaker in the dynamic state.
The damper output force is asymmetric about
Regarding the location of the maximum force/pressure, the maximum pressure in the compression chamber is seen to occur earlier when
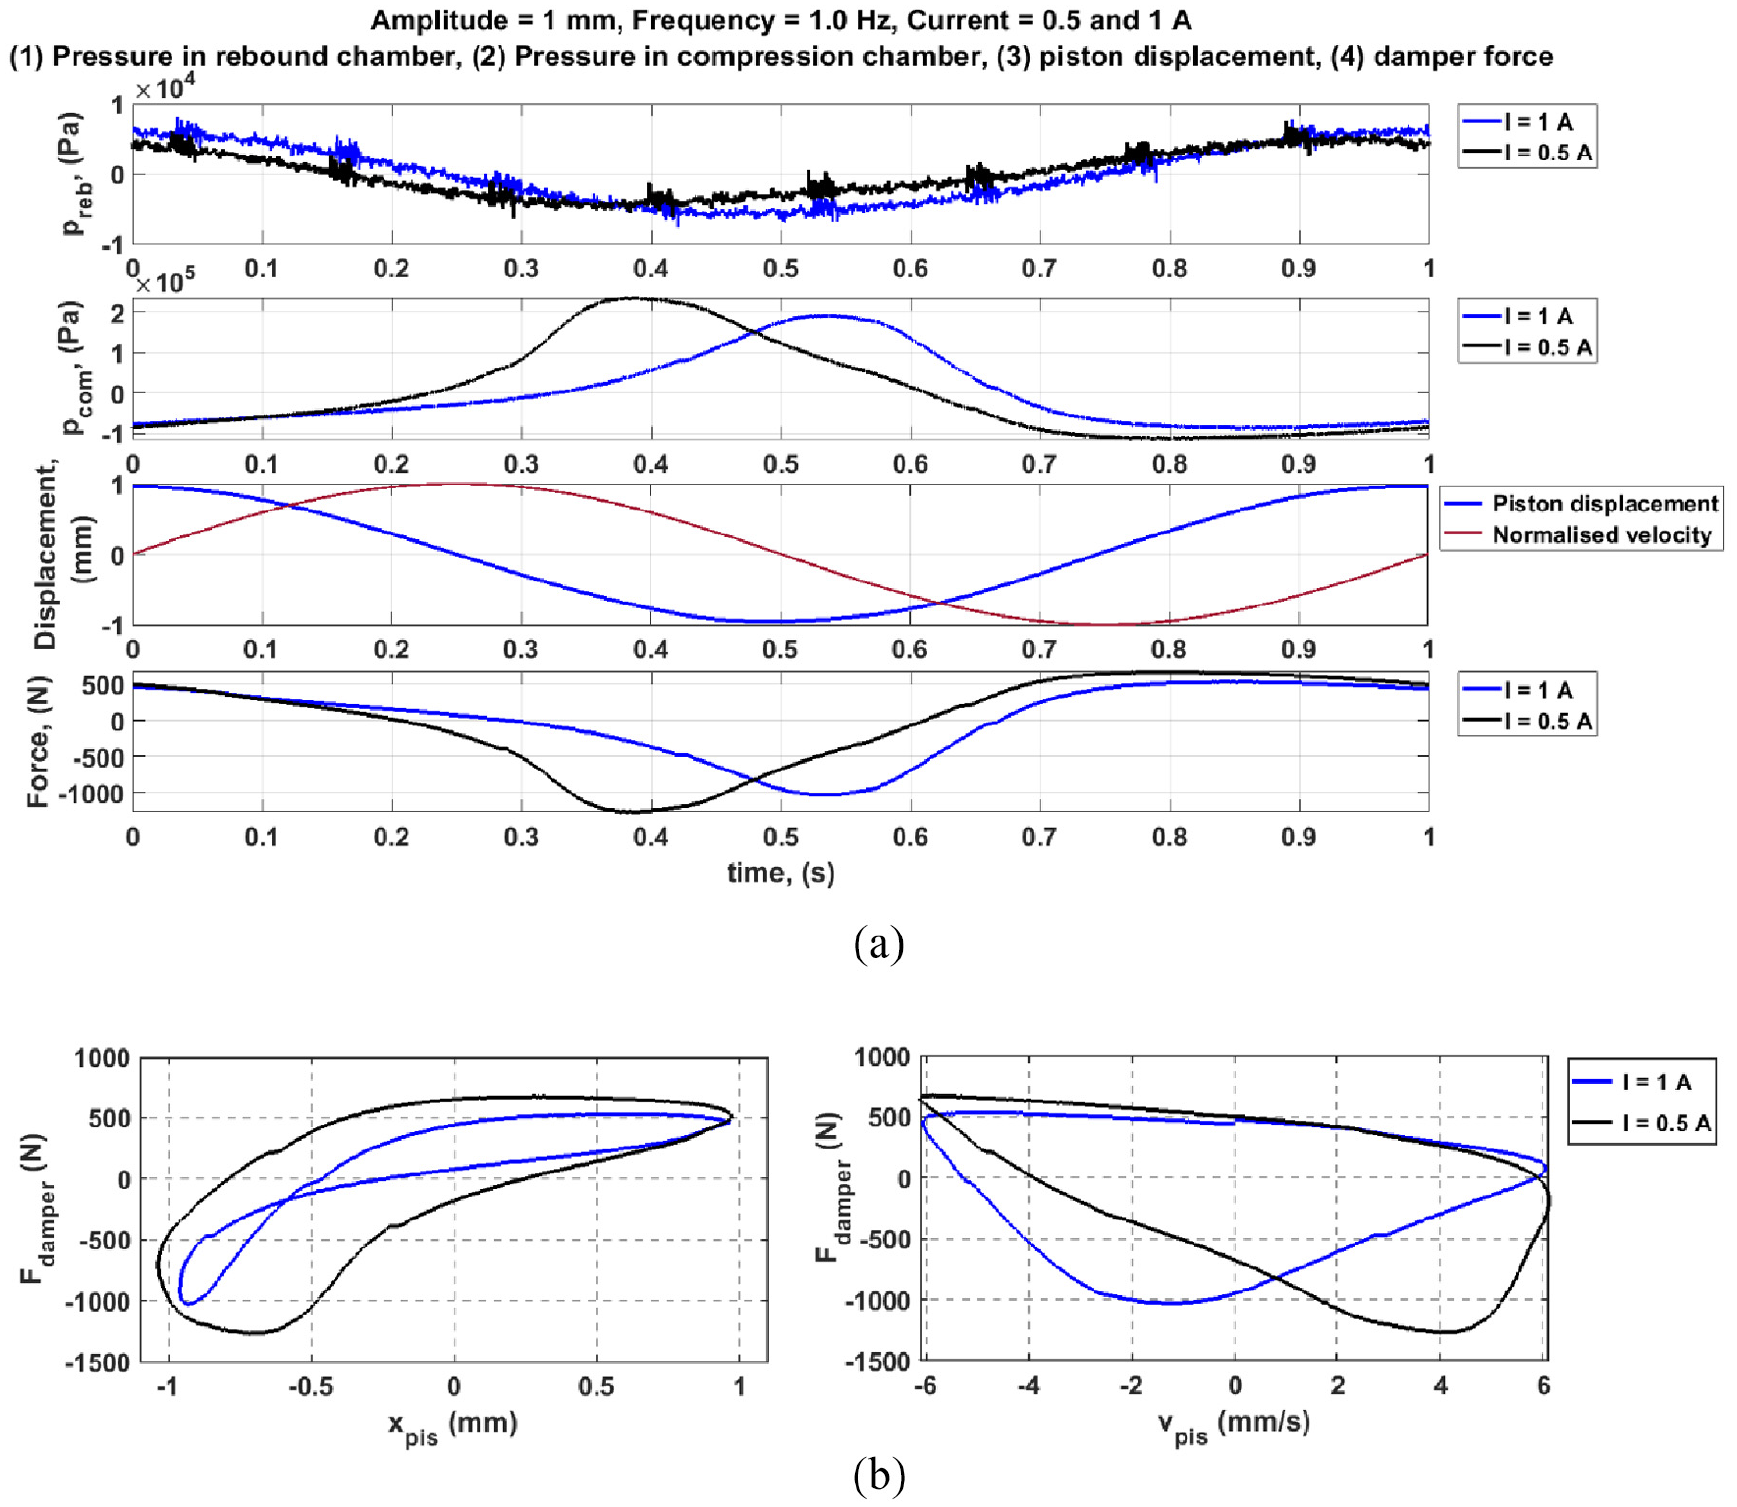
The unusual phenomena mentioned in paragraph (v), namely: the retardation of the peak force/pressure difference, seen in Figures 10(a) and 11(a), and the higher force at lower input current, seen in Figure 12 can be interpreted as follows:
The retardation of the peak force/pressure in the compression chamber has been attributed to the high magnetic field strength which causes the fluid to be plugged in the throttling area, and also due to the presence of air bubbles. It has been deduced that the fluid plug formed in the throttling area of the MR piston is weaker when the input current is low. Therefore, the flow is permitted in the throttling area causing the instance of maximum force to occur earlier at
Figure 12 shows a higher force/pressure in the compression chamber when
To summarise the aforementioned reasons for the unusual performance detected in the current damper, it can be stated that:
The function of the accumulator is absent and the fluid seems to be not pre-pressurised. This allows the retention of air bubbles within the MR fluid. Air bubbles are thought to be retained within the liquid during the damper filling due to the high off-state viscosity of the fluid. The fluid has a very thick and pasty texture, as shown in Figure 7(a).
The output force of the damper is highly affected by the presence of air bubbles and the air pocket formed in the rebound chamber due to leakage. These factors increase the fluid compressibility as they lead to reducing the effective bulk modulus of the liquid-air mixture (Jelali, 2003). The effect of air bubbles is manifested by the asymmetric force around the
On the basis of the aforementioned deductions, the authors were motivated to prove the validity of those deductions by the development of a numerical approach that simulates the damper performance in the faulty mode. The elements of the current numerical approach are presented in Section 4.
4. Numerical method
The current numerical approach follows the same strategy of the one presented in Elsaady et al. (2020a). In that study, a one-way coupled numerical approach was developed to model the performance of an MR damper that was tested in Chooi (2005) and Chooi and Oyadiji (2009a). An FE model for the solution of the magnetic circuit was coupled to another model for the solution of flow dynamics developed by utilities of CFD analysis. The apparent viscosity of the MR fluid was defined in the CFD model according to the magnetic field density obtained from the FE model and the local shear rate of the fluid computed in the CFD model. The FE analysis was performed using COMSOL/Multiphysics software, whereas the fluid flow analysis was implemented by ANSYS/Fluent software. The same approach has been adopted in the current study. However, a different CFD model was developed to account for the presence of air bubbles, which was not accounted for in the former study.
The CFD model presented in the former study is a two-phase model which accounts for compressibility effects caused by the presence of an air pocket appended to the compression chamber of the previously-tested damper. The two-phase CFD model employed in that study is based on the Volume-Of-Fluid (VOF) model included in ANSYS/Fluent, whereas the current CFD model is based on the “Mixture” model, included also in ANSYS/Fluent. The differences between both models are illustrated in Section 4.2.
4.1. FE model
4.1.1. Computational domain
A two-dimensional steady-state axisymmetric FE model was established using COMSOL/Multiphysics to model the flow of magnetic flux in the MR piston shown in Figure 4. The computational domain and a sample of the mesh are shown in Figure 13. The size of cells is seen to be relatively smaller in the MR fluid region, to accurately determine the distribution of magnetic flux density (strength). The FE mesh was composed of triangular elements with a total number of 25,233 elements, which includes 2012 edge elements and 70 vertex elements. The coils were defined in COMSOL/Multi-physics in a parallel connection. Magnetic insulation was assumed at the outer boundaries of the computational domain. A grid-independent solution was achieved.
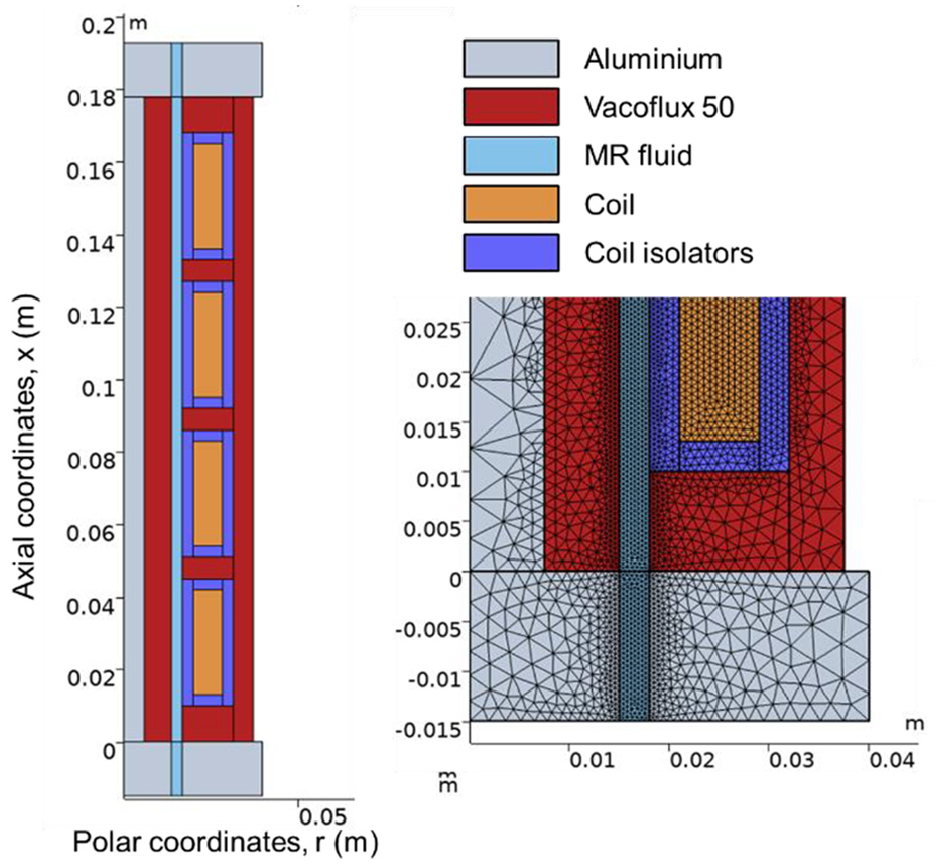
The computational domain of the FE model.
4.1.2. Governing equations
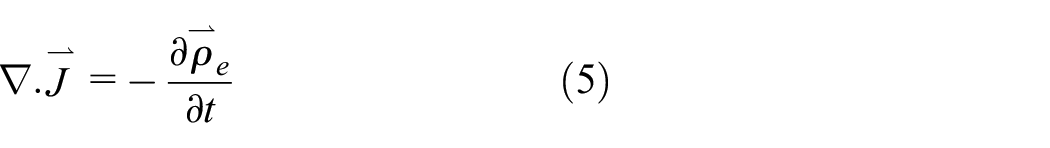
The flow of magnetic field is governed by Maxwell’s equations, which are composed of four fundamental laws of electromagnetism, namely: Gauss’s law for electricity, Gauss’s law for magnetism, Faraday’s law, and Ampère’s law (Purcell and Morin, 2013). The differential equations that represent these laws can be written, respectively, as:
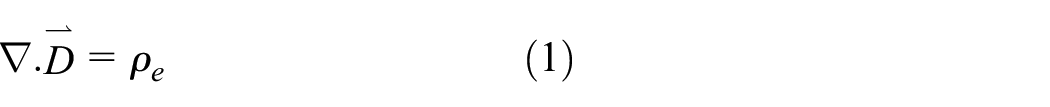
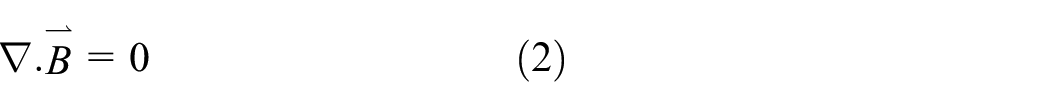
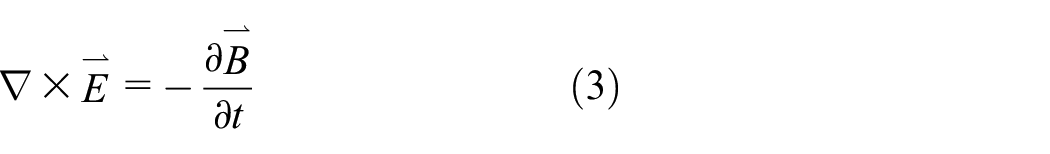
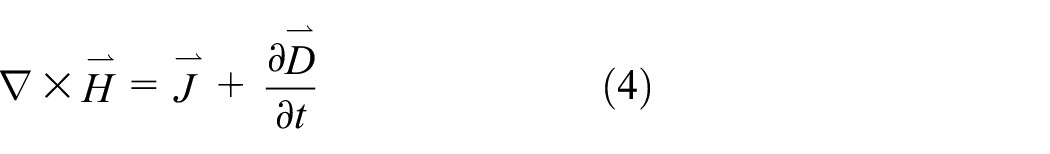
where
The AC/DC module available in COMSOL/Multiphysics has been used for solving the set of governing equations. The following additional constitutive equations are developed in order to have a closed system of equations (COMSOL, 2018):
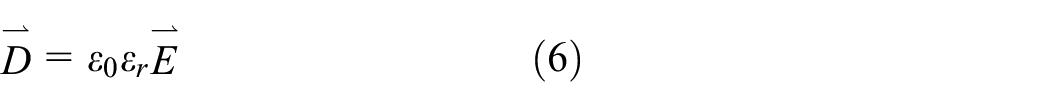
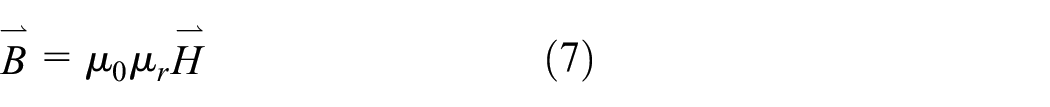
where
4.1.3. Nonlinear magnetic properties
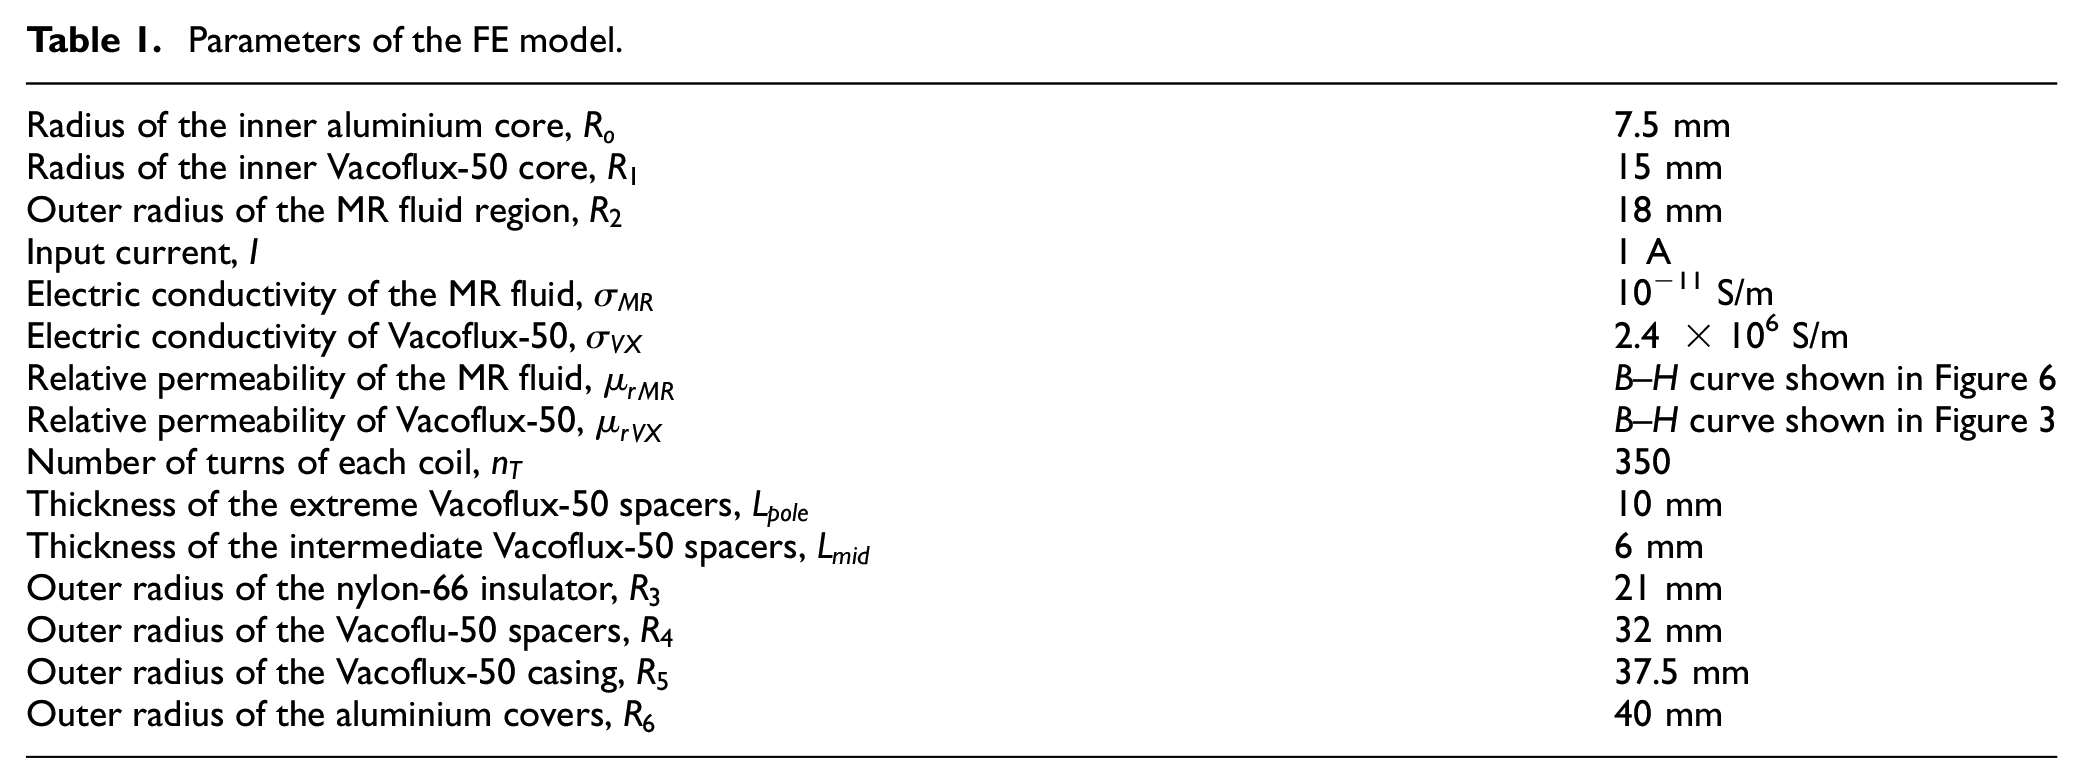
Although MR dampers operate at low currents, the dampers may be liable to magnetic saturation caused by nonlinear magnetic properties of materials (Goldasz, 2017; Xu et al., 2012). The effect of nonlinear magnetic properties has been accounted for in the current FE model. This has been performed by the definition of the magnetic properties of the materials used in the model according to the corresponding
Parameters of the FE model.
4.2. CFD model
There are two main differences in the “Mixture” model, used in the current study, compared with the VOF model that was employed in Elsaady et al. (2020a). These differences can be stated as:
The phases are interpenetrating in the “Mixture” model. Therefore, the volume fraction in each control volume (cell) can have any value from 0 to 1, unlike the VOF model. This allows the air volume fraction to be linked with pressure and velocity flow parameters. For instance, the air volume fraction is expected to be low in the MR fluid regions affected by high pressure, and vice versa.
The “Mixture” model allows the interpenetrating phases to move at different velocities using the concept of slip velocities.
Thus, the computational domain of the current CFD model is represented by two interpenetrating continua (MR fluid and air bubbles), rather than representing the domain as two immiscible continua as presented in Elsaady et al. (2020a). The elements of the current numerical approach are illustrated in the following subsections.
4.2.1. Governing equations
The governing equations of both the VOF and the “Mixture” models are shown by equations (9) to (13). The continuity equation used in the VOF model to track the interfaces between the immiscible phases is given as:
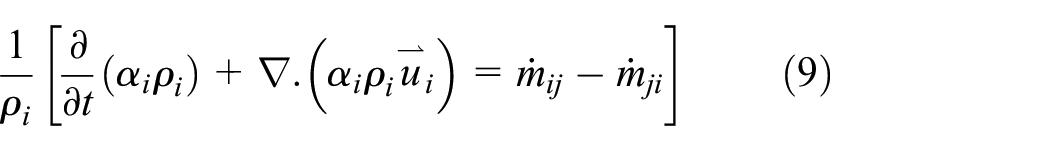
where
The momentum equations used in the VOF model can be written as:
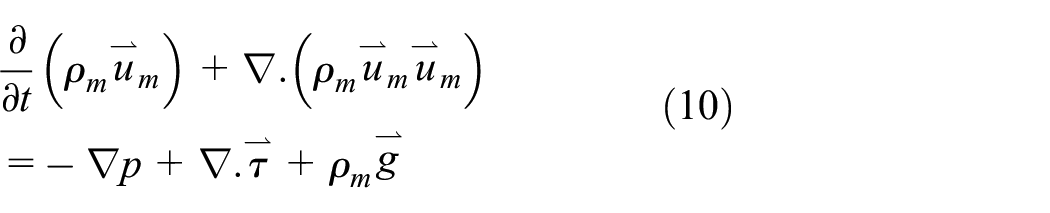
where
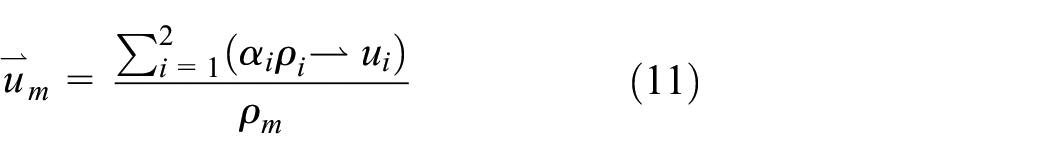
On the other hand, the continuity and momentum equations used in the “Mixture” model can be written, respectively, as:
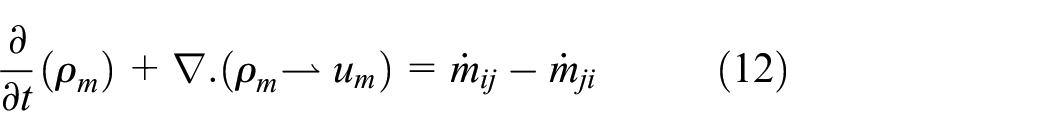
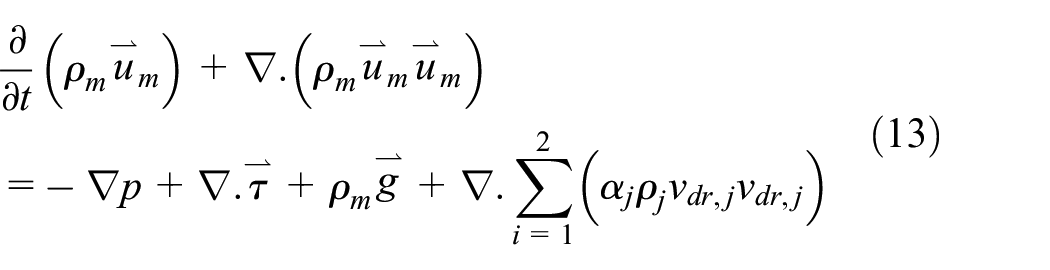
where
4.2.2. Computational domain
As it has been stated in Section 3.1 that the function of the accumulator connected to the compression chamber was absent during the experiments, the accumulator was not represented in the current CFD model. The computational domain is shown in Figure 14. It comprises a two-dimensional axisymmetric structured grid. An air pocket, whose volume represents the quantity of the leaked fluid was included at the top of the rebound chamber. The viscosity of the fluid was defined according to the magnetic field density obtained from the FE model and the local shear rate computed in the CFD model. The contours of the initial viscosity of the fluid are shown in Figure 14. The viscosity is seen to be higher in the MR fluid regions adjacent to the magnetic spacers between the coils due to the higher magnetic flux density in these regions. The coils are schematically represented in the figure just for clarification, but they do not belong to the fluid domain as they are only defined in the FE model.
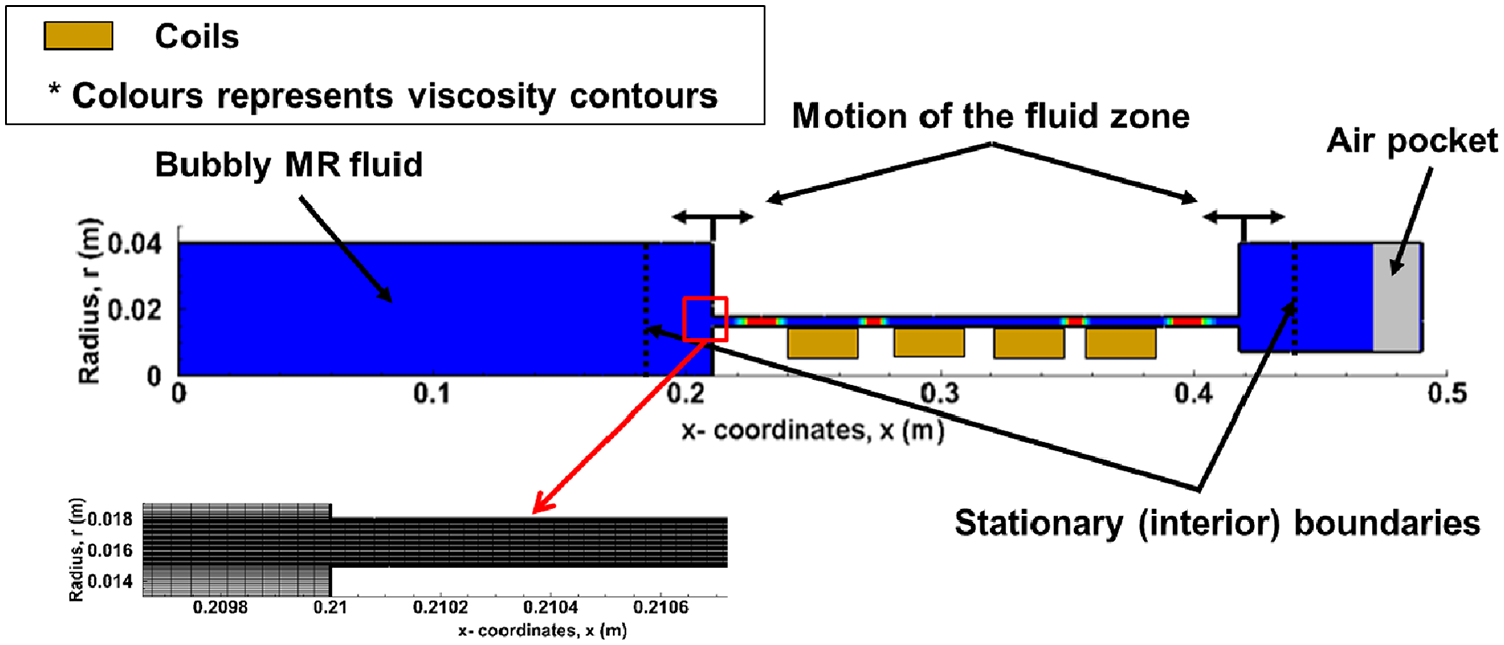
The computational domain of the CFD domain.
To implement the motion of the piston in the current CFD model, the dynamic mesh layering technique available in ANSYS/Fluent was used in the same manner presented in Elsaady et al. (2020a). The motion was assigned to the intermediate fluid zone shown in Figure 14, which is bounded by two stationary interior boundaries. Therefore, the layering (adding or removing cells) occurs in the adjacent cells to these stationary boundaries. A sample of the mesh is also shown in Figure 14, in which the cell size is seen to be relatively smaller in the throttling area of the damper, as the gradients of velocity and shear rate are expected to be higher. The total number of mesh cells is 242,280. Parallel processing using 16 cores with 2–24 GB RAM per core was used during the simulations.
4.2.3. User-Defined Function
The User-Defined Function (UDF) also defines the grid motion as illustrated in the preceding subsection using the “DEFINE_CG_MOTION” macro. Also, it performs the coupling between the current FE and CFD models by the definition of fluid viscosity. There is a limitation on using theoretical viscoplastic equations, such as Bingham plastic or Herschel-Bulkley models, in numerical approaches, as these models define infinite viscosity at zero shear rate. Therefore, alternate equations should be developed. The apparent viscosity of the MR fluid is defined in the UDF according to the following equation:
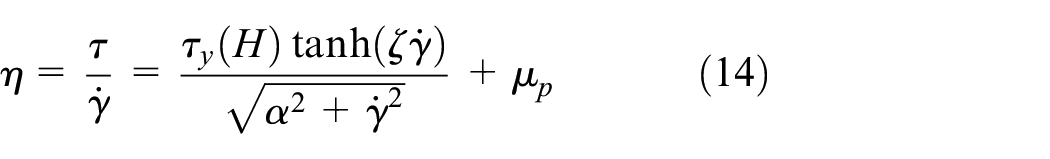
where
The fluid yield stress,
4.2.4. Computational method
The “Mixture” model was used in ANSYS/Fluent with the implicit volume fraction formulation scheme and dispersed phase interface. The “Coupled” scheme was used for solving the pressure-velocity linked equations.
The first order discretisation scheme was applied to both pressure and momentum. The values of under relaxation factors were taken as 0.75 for pressure and momentum, 0.1 for slip velocity, 0.25 for volume fraction and 0.95 for energy. The time step was taken as 2 × 10⁻⁵ s. The maximum number of iterations at each time step is 200 and the convergence criteria were assigned as 10−5, except for volume fraction that was assigned as 5 × 10⁻⁹. It should be noted that the time step is smaller and convergence criteria are tighter in the current CFD model, in comparison with the model presented in Elsaady et al. (2020a), in which the VOF model was used. This is because the “Mixture” model is more complicated compared to the VOF model. These tight conditions have been used in the current study in order to achieve a stable and consistent solution.
4.2.5. Initial conditions
The motion of the piston was defined as a sine wave that defines the velocity of the piston. This means that the piston starts motion at a velocity of zero towards the compression chamber, then back to the rebound chamber to complete one cycle. The two cases shown in Figure 12 were chosen from the experimental data to validate the current numerical approach. The simulations were carried out in two cycles in order to achieve the dynamic conditions in the second cycle.
An initial constant value of the air volume fraction within the MR fluid was assumed in the model. Different values of the initial air volume fraction were tried. It can be inferred that the greater value of air volume fraction causes the bulk modulus of the fluid-air mixture in each chamber to be lower. Therefore, it leads to less pressure difference between the chambers of the damper. It was found that the value of 0.93% of the air volume fraction leads to the best model results in terms of pressure in both chambers.
5. Results and discussions
5.1. Results of the FE model
The steady-state contours of magnetic field density in the current MR damper are shown in Figure 15. The figure shows that the main flow of the magnetic field across the MR fluid region occurs at the farthermost upper and lower ends of the piston, at which the farthermost Vacoflux-50 spacers are located. Therefore, it is seen that the field density is high in the MR fluid regions adjacent to these spacers. Also, the highest field density is seen, as expected, in the inner Vacoflux-50 core, and that is why the MR fluid region is employed in the current design to be inside the coil bobbin rather than being around the coils. By the insertion of the MR fluid region, the MR fluid region is located closer to this inner core, in which the magnetic field flows with higher density. Therefore, the field density in the MR fluid region will be slightly higher in comparison to the field density around the coils.
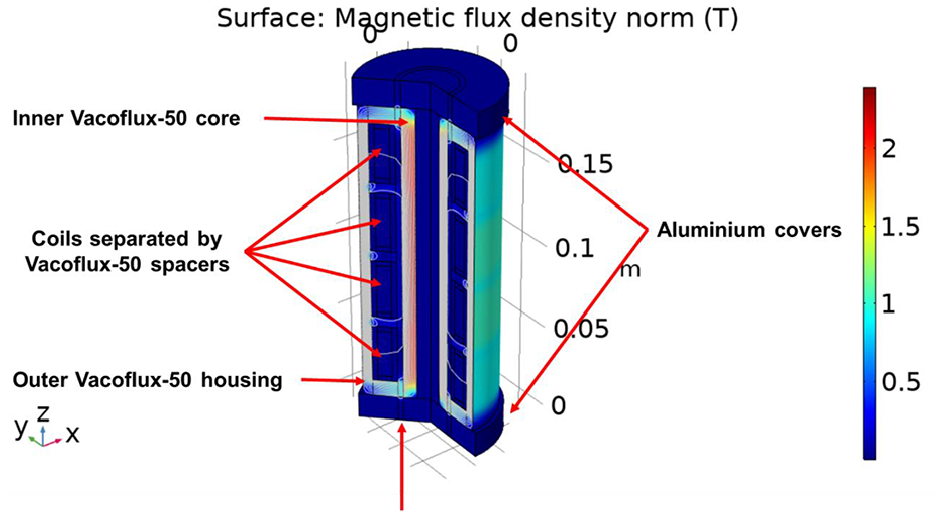
Contours of magnetic flux density in the MR piston (viewed in 3D,
The contours of magnetic flux density in the MR fluid region are shown in Figure 16. The figure shows the variation of magnetic field density at
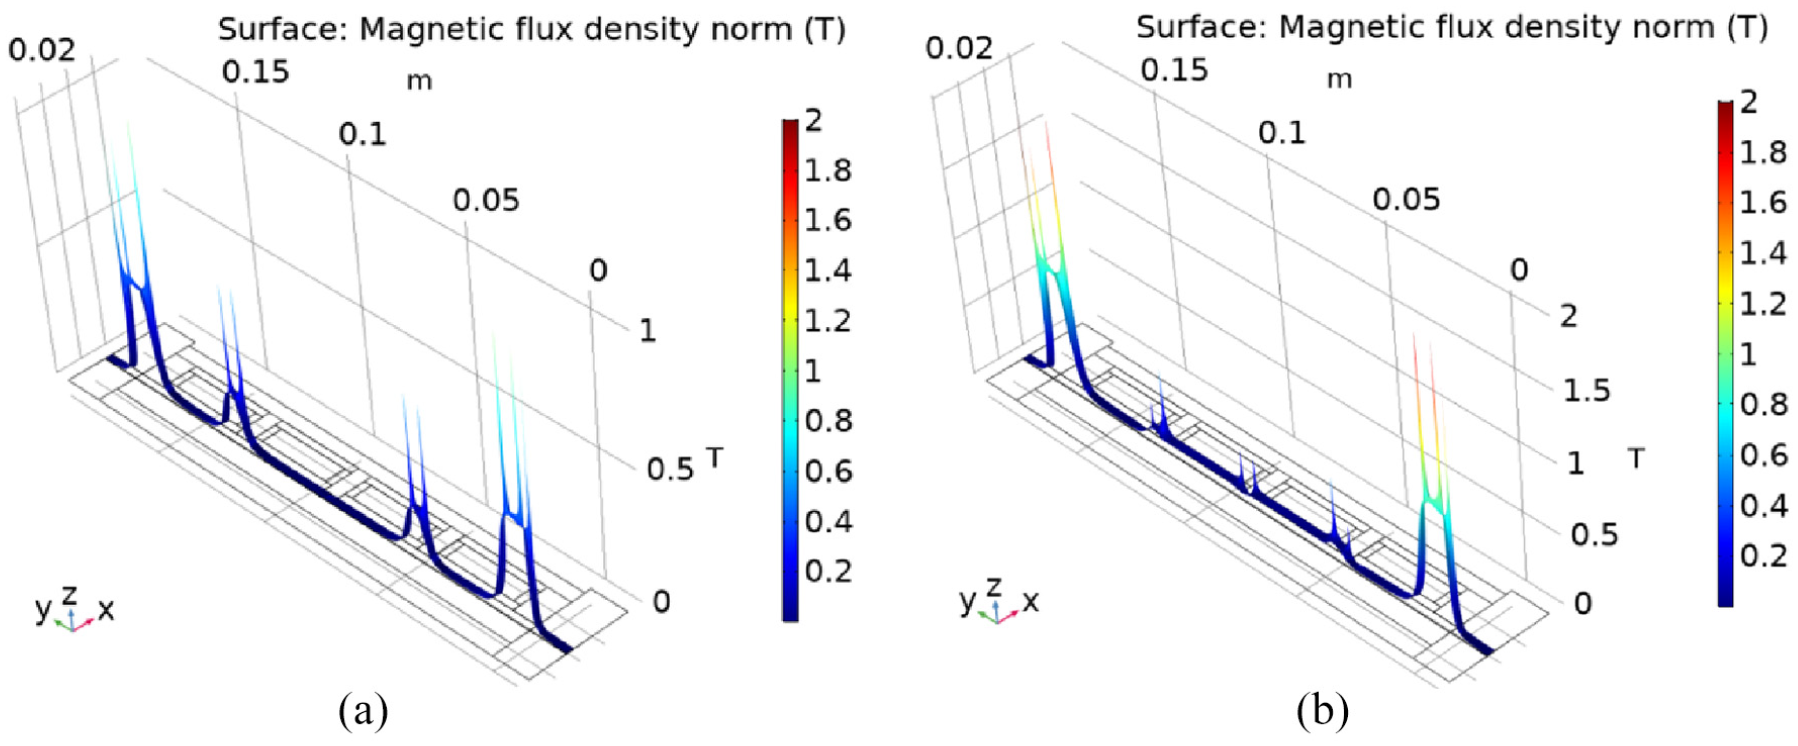
Variation of magnetic field density in the MR fluid region (the throttling area of the piston): (a)
It is also seen in Figure 16 that the variation of magnetic field density in the radial direction is negligible, except for in very small areas adjacent to the corners of the coils where the magnetic flux is concentrated. Therefore, the distribution of magnetic field density in the MR fluid region can be assessed by plotting the field density on an intermediate line in the MR fluid annulus, as shown in Figure 17. The figure shows the variation of flux density at different input currents. It is seen that the magnetic flux mainly flows from the farthermost ends of the piston. The flow of flux in the locations of the intermediate Vacoflux-50 spacers is smaller than that in the farthermost ends because the spacing causes partial cancellation of the opposite flowing magnetic flux of the adjacent coils. This is due to the fact that for this magnetic coil design, in which the current flows in the same direction, as in Sahin et al. (2012), there is partial cancellation of the flux in the intermediate spacers (between coils 1 and 2, and coils 3 and 4), whereas there is nearly a total cancellation of the flux in the middle spacer (between coils 2 and 3). On the other hand, the magnetic flux at the farthermost ends of the set of coils will always be the sum of the magnetic fluxes induced by each coil. The magnetic saturation effect can be seen in the figure either at the farthermost or intermediate MR fluid regions. The variation of the field density was found to be negligible at higher input currents than 2 A. Therefore, it can be said that the saturation of magnetic field, and hence damper performance, is avoided at lower input currents than 2 A.
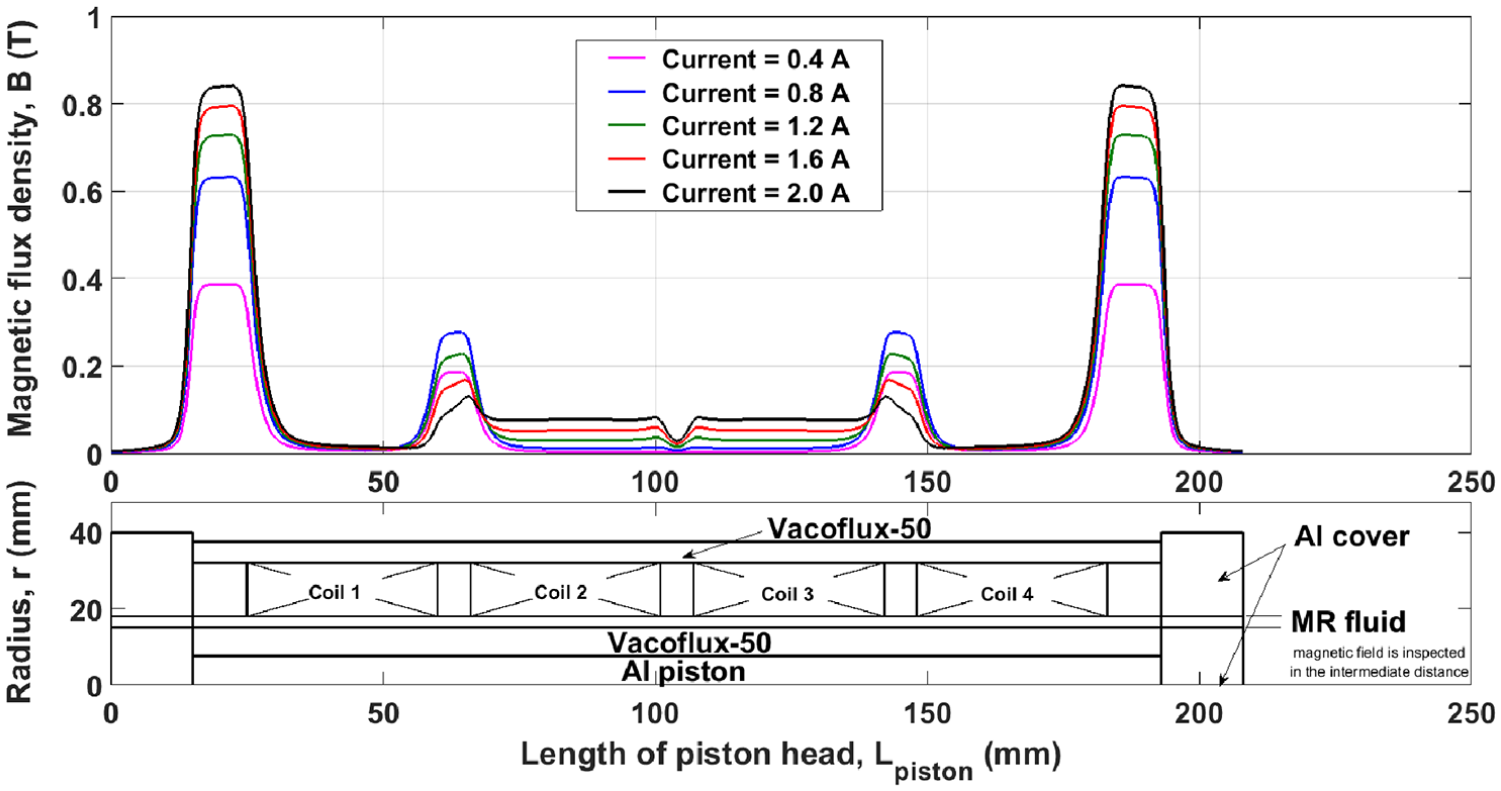
Distribution of magnetic flux density in the throttling area of the MR piston at different input currents to the coils. The figures are plotted on an intermediate line in the MR fluid region.
5.2. Results of the CFD model
5.2.1. Model validation
The current numerical approach has been validated by the direct comparison between theoretical and experimental results of the pressures in the rebound and compression chambers, as shown in Figures 18 and 19. The figures also show the theoretical output force of the damper computed from the pressure difference in both chambers compared to the experimental data obtained from the experimental measurements. The force diagrams are shown in both figures by the time histories, work and characteristic diagrams based on the theoretical and experimental data. As it has been deduced from Figure 10 that the performance of the damper was variable in each cycle, the results used to validate the current model are the results measured for the third cycle of piston motion. The behaviour of the damper was found to be consistent after the third cycle of piston motion.
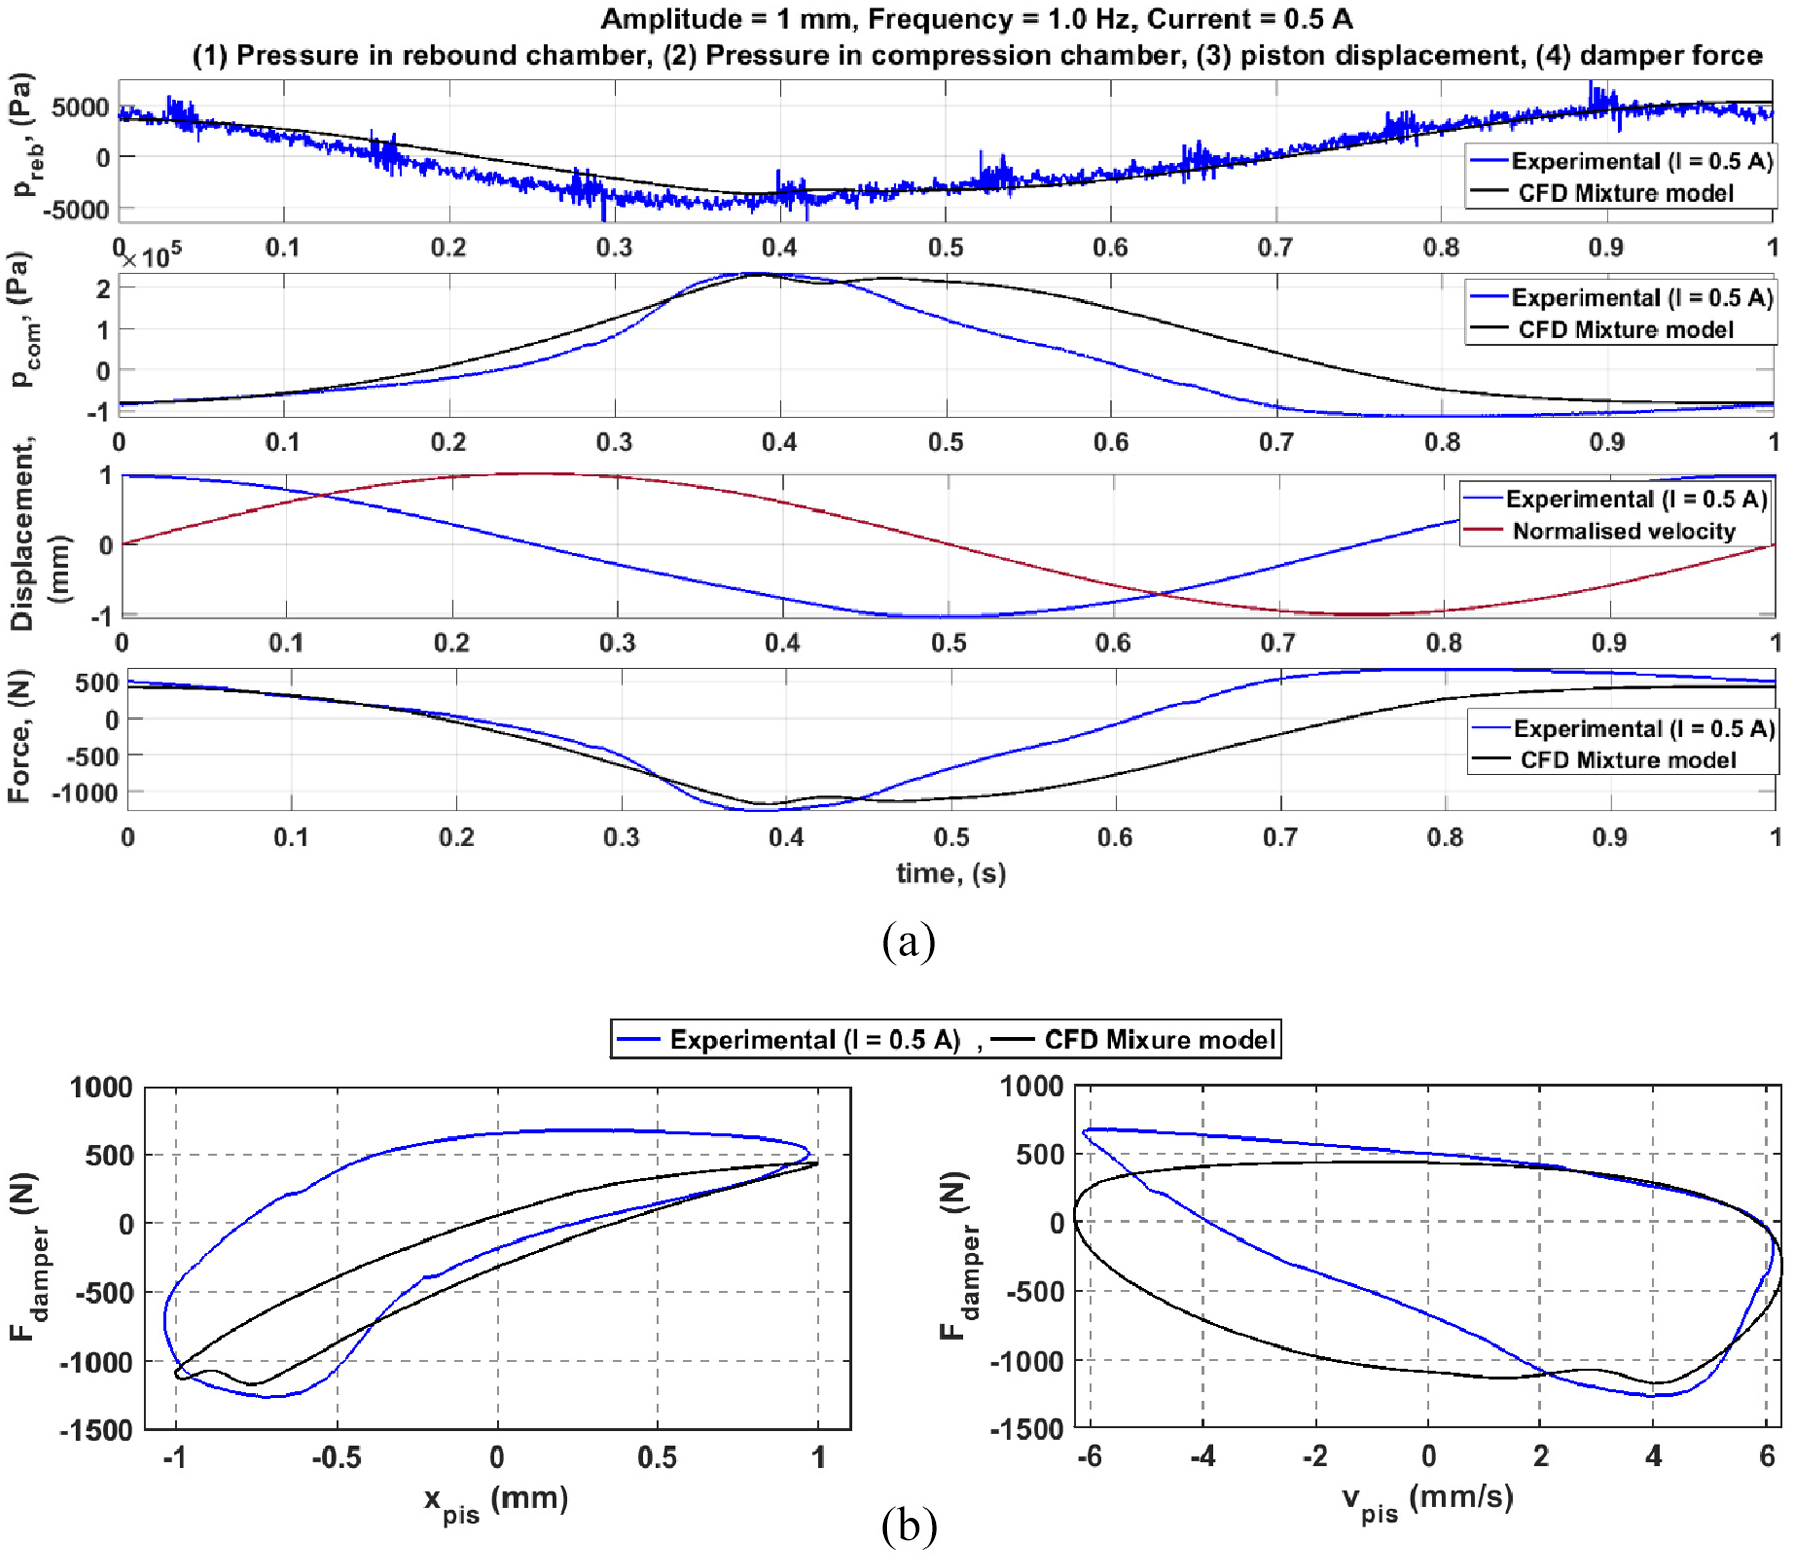
Results of the current CFD model compared to the experimental measurements in one cycle of piston motion (
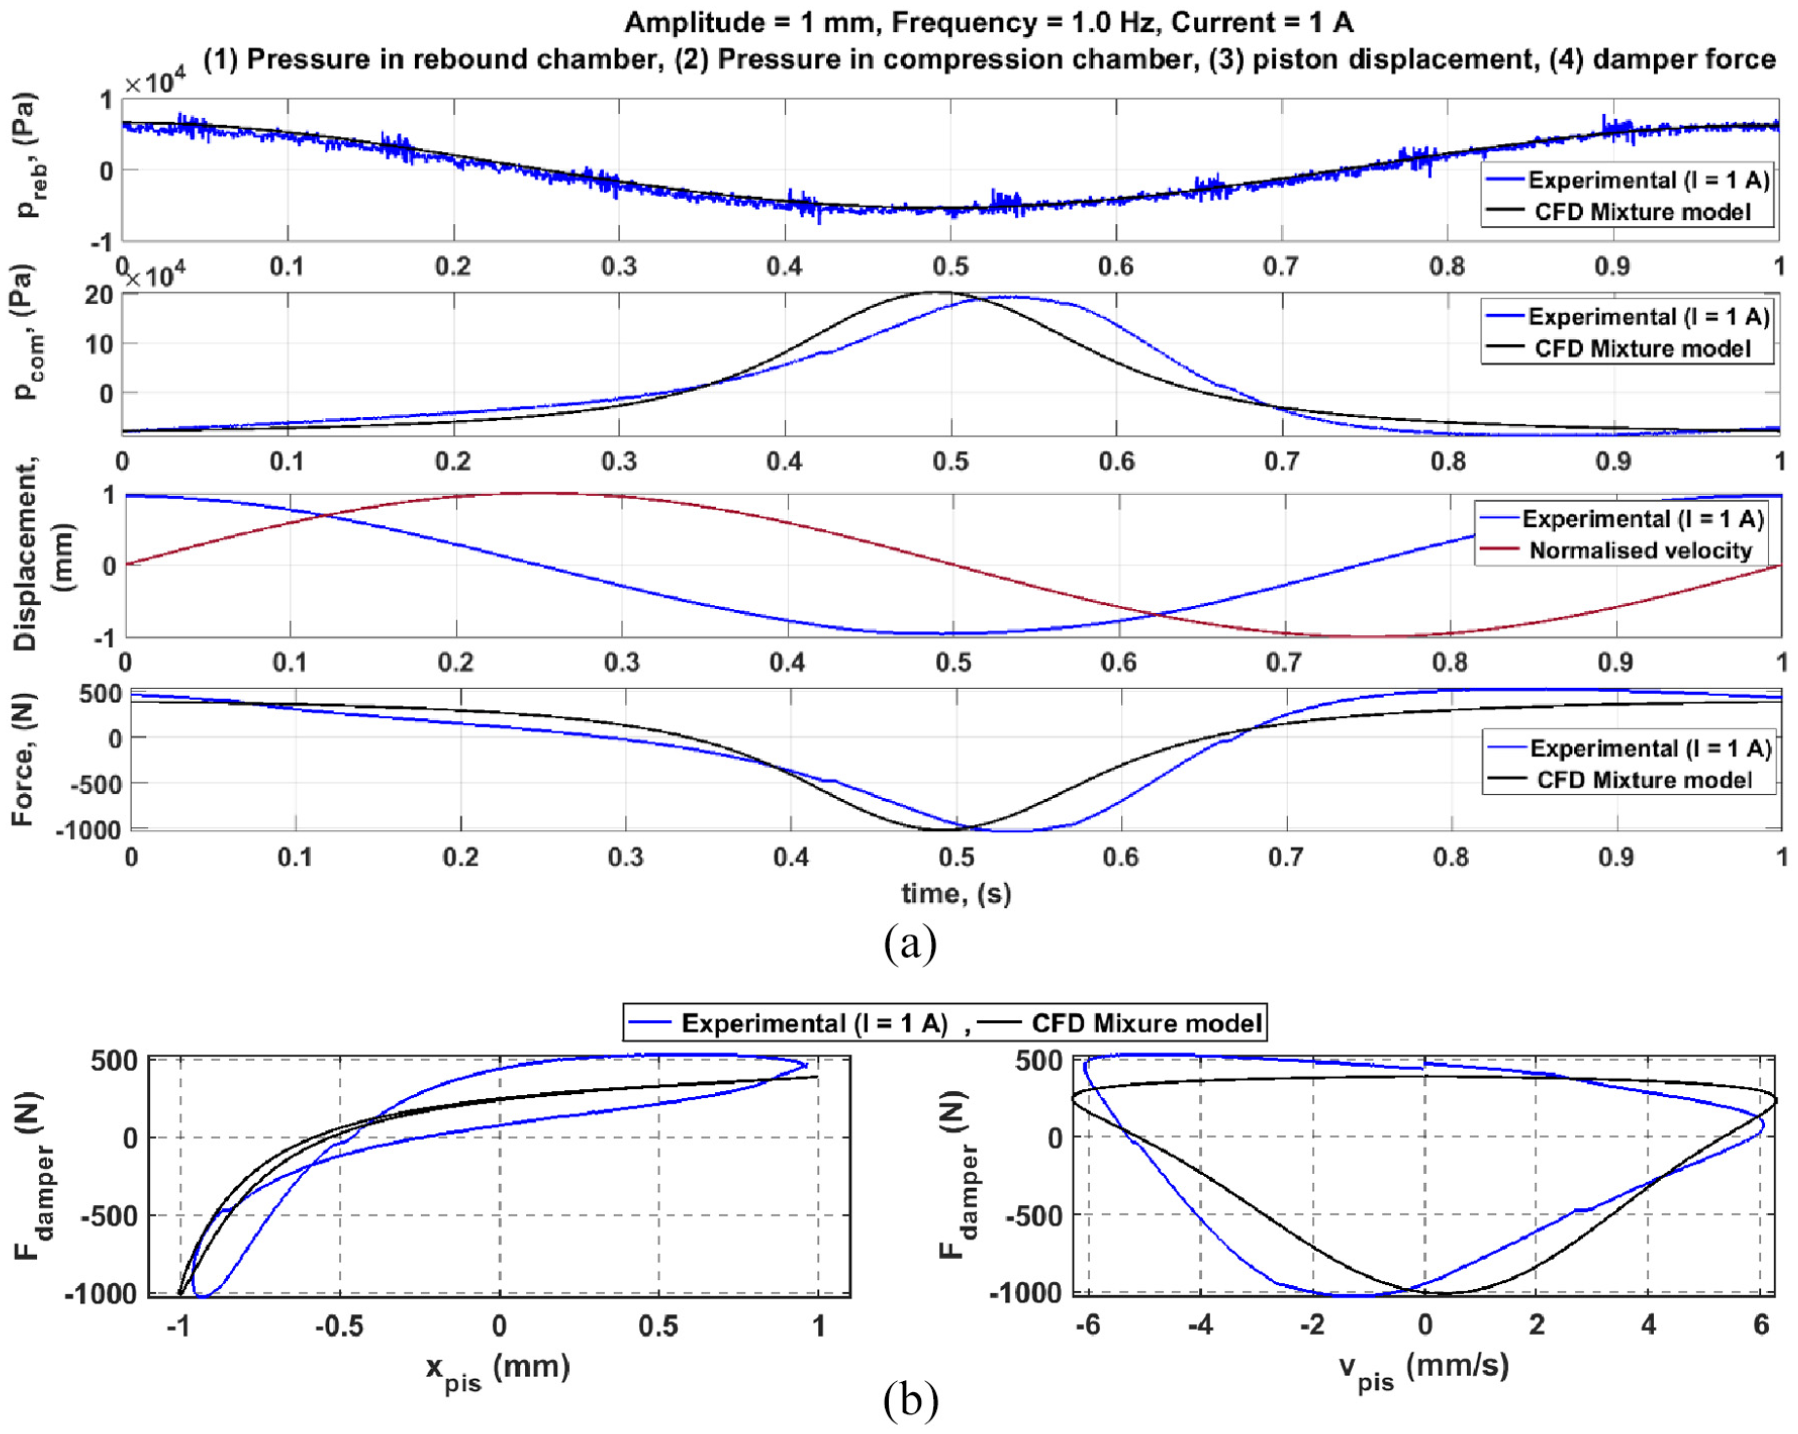
Results of the current CFD model compared to the experimental measurements in one cycle of piston motion (
Figures 18 and 19 show fairly good matching between the theoretical and experimental pressures in both chambers in terms of the maximum values. The peak value of the theoretical pressure in the compression chamber is seen to have a good matching with that of the experimental pressure in Figure 18, whereas it is slightly shifted, compared to the experimental data, as shown in Figure 19. The differences between the theoretical and experimental forces are seen clearly in the corresponding work and characteristic diagrams shown in Figures 18(b) and 19(b). The reason for these differences is thought to be due to the assumptions of the current CFD model. In particular, the initially-defined homogenous distribution of air volume fraction in the current CFD model is thought to be the main reason for these differences. Moreover, the volume integral of the air volume fraction remains constant as the model is applied within a closed domain. However, it is thought that the damper allows minimum inflow and outflow of air during the experiments due to improper sealing of the piston rod and through the location of leakage. This not only allows aeration of the damper but also affects the pressure in both chambers. So, the total air volume fraction in the damper is variable along the motion cycle, which was not accounted for in the model. It was found that the value of air volume fraction affects the pressure in the compression chamber greatly, especially that the damper was tested at low values of motion amplitudes of the piston.
Referring to Section 3.1(v), the prediction of the instances of theoretical peak pressures in the compression chamber was achieved by the CFD model at both currents, as shown in Figures 18(a) and 19(a). The prediction of the relatively earlier pressure peak at
5.2.2. Predictions of flow parameters
Hereinafter, the variations of flow parameters, namely: air/liquid volume fraction, fluid pressure, viscosity and velocity are presented based on the current CFD model. The fairly accurate predictions of these parameters are thought to validate the analysis of the experimental results described in Section 3.1. Some parameters are also compared with their counterparts predicted previously by the current authors in Elsaady et al. (2020a). It has been found that the current results, which represent the current faulty behaviour, are completely different from those in the former study that represent an ideal behaviour of the damper. The differences are due to the inclusion of the effect of air bubbles in the current study.
The contours of fluid pressure in the MR damper at the end of the compression stroke (piston-motion in right-to-left direction) are shown in Figure 20. The figure shows the higher pressure in the compression chamber compared to the rebound chamber. The flow pattern in both chambers can be also seen in the figure, in which the flow pattern in the compression chamber is seen to be relatively simpler.
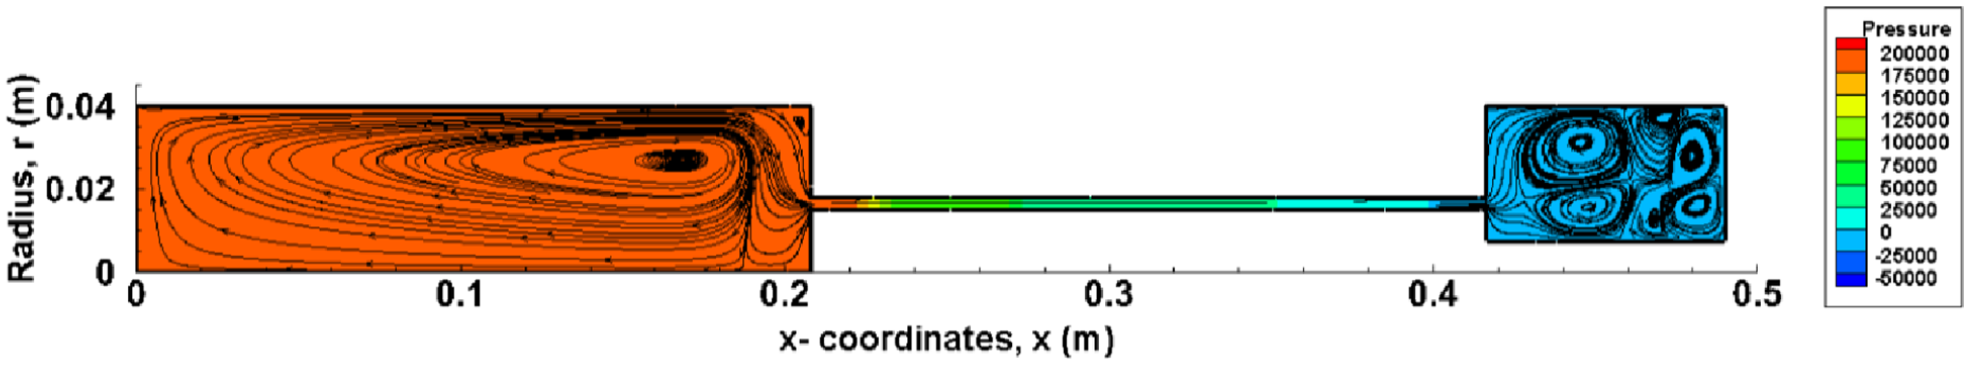
Pressure contours at
The time history of liquid volume fraction has been monitored at a specific location in the compression chamber, as shown in Figure 21(a). The figure shows that the liquid volume fraction increases (lower air volume fraction) during the compression stroke, whereas it reduces in the rebound stroke until it returns to the initial value. The higher liquid volume fraction during the compression stroke (piston motion from right-to-left) is due to the high pressure in the compression chamber. The high pressure causes air in the compression chamber to escape to the rebound chamber, and vice versa in the rebound stroke (piston motion from left-to-right). This behaviour is also shown by the contours of liquid volume fraction in the whole computational domain as seen in Figure 21(b). The figure indicates the variation of liquid volume fraction at different moments of piston motion.
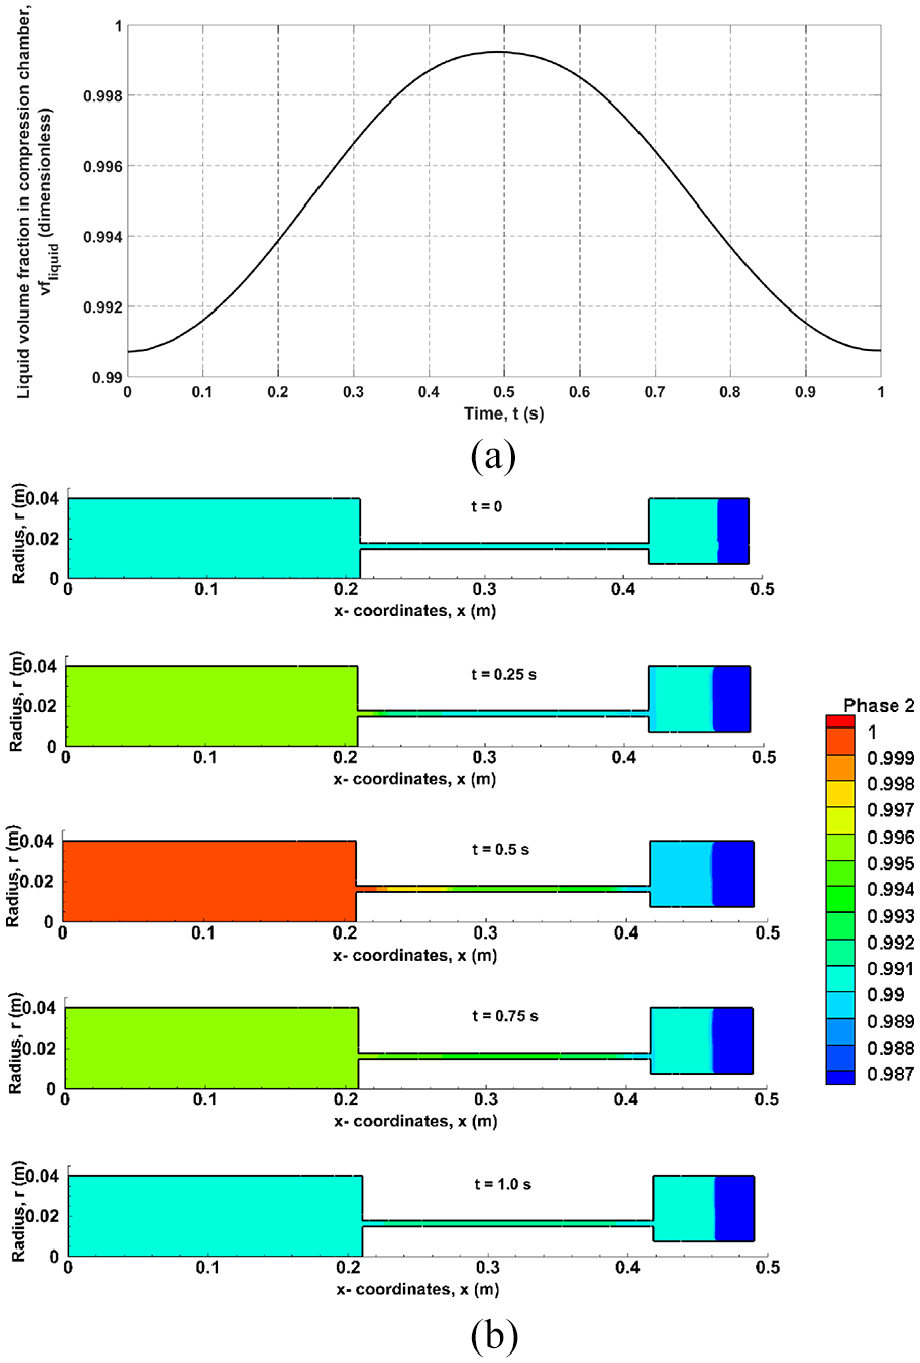
Variation of volume fraction of liquid: (a) in the compression chamber within a complete cycle and (b) contours of volume fraction in the whole domain at different time steps.
The viscosity contours of the MR fluid mixture in the current study are compared with those contours shown in Elsaady et al. (2020a) at the same relative time moments of piston cycle, as shown in Figure 22. The figures show the viscosity contours in both dampers at the time values of
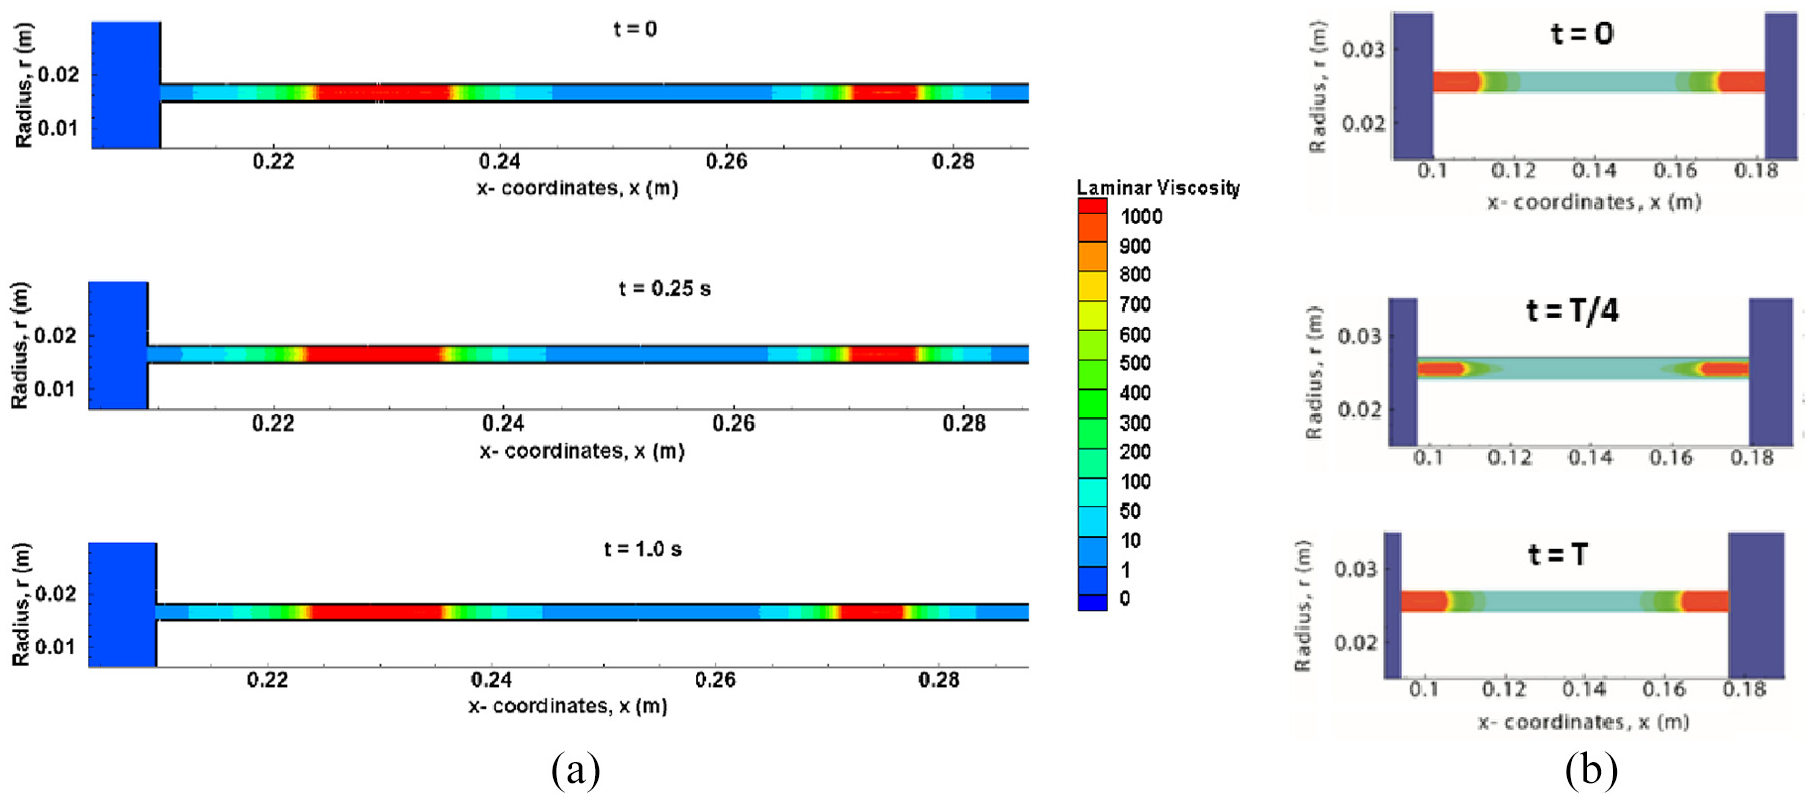
Viscosity contours at the relative time moments of piston cycle (
The purpose of this comparison is to show the different behaviour of fluid viscosity in the current damper compared to the damper studied in Elsaady et al. (2020a). In the former study, shown in Figure 22(b), the fluid viscosity is seen to be dependent on the fluid shear rate. The high viscosity is seen to be formed across the whole throttling area at the moments of instantaneous stops of the piston (
To assert that the MR fluid was plugged in the throttling area of the MR damper during the experiments, as predicted by Figure 22(a), the velocity vectors of the MR fluid in the current study are compared with those presented in Elsaady et al. (2020a) at the same instance of
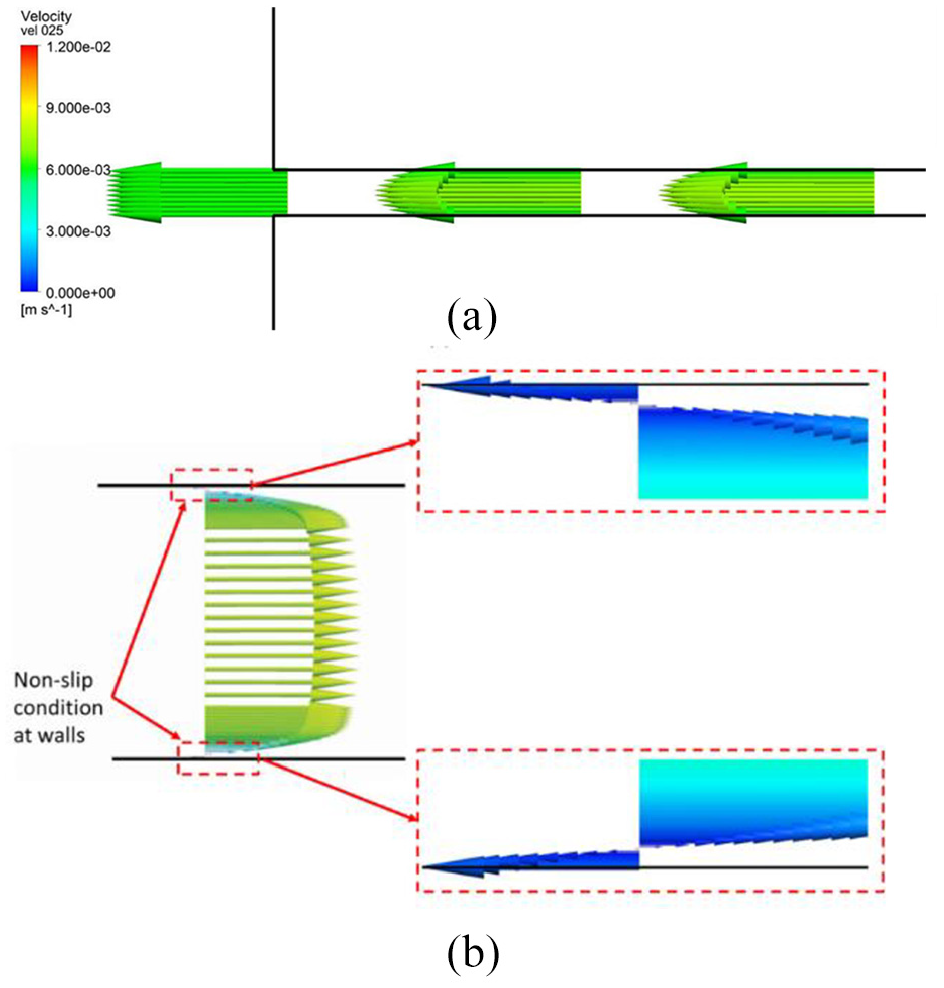
Velocity vectors at the time moment of
Because the rheological behaviour of the fluid at
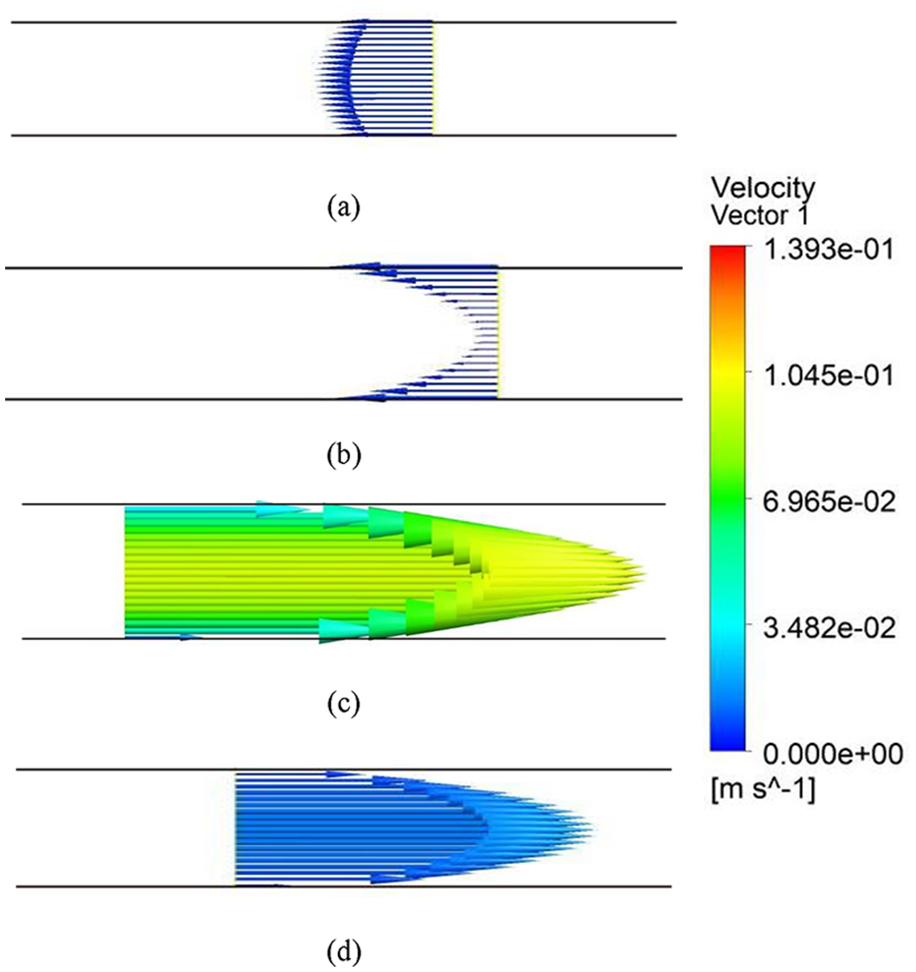
Velocity vectors at different time moments when
5.2.3. Effect of air volume fraction
In the preceding analyses of Figures 18, 19, 22 and 23, the inclusion of the effect of air bubbles in the current CFD model has been seen to affect the behaviour of the damper drastically. Now, it may be necessary to evaluate the effect of the value of air volume fraction on the performance of the damper. The current CFD model assumes the value of air volume fraction as 0.93%. Different values of initial air volume fraction were tried in the model employing the same conditions of piston motion, and the variation of pressure in the compression chamber was predicted, as shown in Figure 25. The figure indicates that the initial value of air volume fraction in the damper has a remarkable effect on the pressure in the compression chamber. The higher the initial volume fraction the lower the maximum pressure in the chamber is, hence lower output force of the damper. This remarkable effect with a very small variation of the initial air volume fraction is thought to be due to the relatively big size of the damper and the small values adopted in the current study for piston motion (
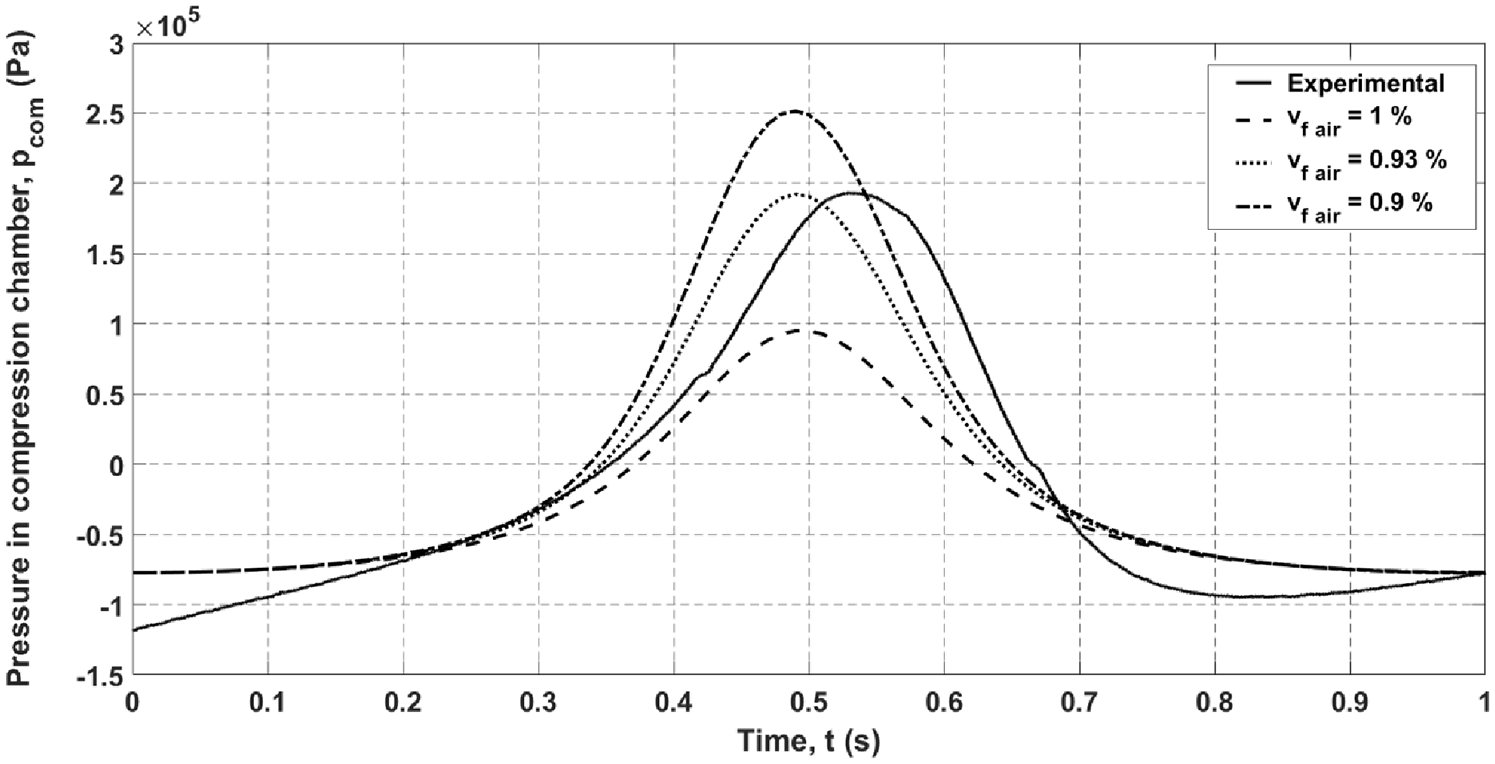
Effect of air volume fraction due to different values of initial air volume fraction in the damper.
6. Ideal behaviour of the damper
To show the difference between the faulty behaviour of the damper investigated in the current study and the ideal behaviour, some modifications were applied to “repair” the damper as follows:
As the AMT-Smartec+ MR fluid was thought to cause the current failure mode of the damper due to its high off-state viscosity which allowed more air bubbles to be retained during filling of the damper. Therefore, the AMT-Smartec+ MR fluid was replaced with the well-known LORD-132DG MR fluid.
The bladder accumulator was replaced with a diaphragm moulded in “hat- or dish-shaped” profile in order to separate out the bottom of the damper as an accumulator of the damper. The diaphragm was fixed between the bottom cylinder cover and the cylinder (in the compression chamber).
The threaded opening in the cover, which was provided to connect to the accumulator, was used to fix a one-way air valve connected to an air pump. The air pump applies a pre-charge pressure of 5 bars to the damper.
The threaded parts of both the cylinder and the bottom cover were reformed and the parts were fixed in a manner by which the leakage was overcome.
The dynamic characteristics of the damper have been measured in the same manner presented in Figure 8, and the characteristics of the damper obtained are as expected for a fault-free damper, as shown in Figure 26. The figure shows the pressures in compression and rebound chambers of the damper and the work and characteristic diagrams. It is seen that, due to the change of the MR fluid type and the elimination of the leakage, high pressure is seen in the rebound chamber, unlike the faulty damper which shows a higher pressure in the compression chamber as seen in Figures 10 and 11. Moreover, the maximum pressures in both chambers are seen to be very near to the locations of maximum velocities (zero displacements). Hence, the work and characteristic diagrams show the common characteristics reported in Figure 1.
Ideal behaviour of the MR damper due to replacing the AMT-Smartec+ MR fluid with LORD-132DG MR fluid: (up) pressures in damper chambers and (down) work (left) and characteristic (right) diagrams.
7. Conclusions
The current study reports a faulty behaviour of an MR damper and a numerical approach which could predict the flow characteristics for that faulty-mode behaviour. The faulty behaviour was found in the current experimental measurements applied to measure the dynamic characteristics of the damper under cyclic loads. That faulty behaviour has been attributed to the high off-state viscosity of the AMT-Smartec+ MR fluid which is thought to allow the retention of air bubbles within the fluid. The AMT-Smartec+ MR fluid exhibits good magnetic characteristics in terms of yield stress and magnetic permeability. However, the fluid viscosity in the non-activated status is too high. This high viscosity is thought to be a major drawback of the fluid because of the following reasons: the high off-state viscosity reduces the dynamic range of the fluid, makes the fluid more prone to the IUT problem, and causes higher retention of air bubbles during filling of the damper with the fluid.
Therefore, one of the messages of this article is the necessity for evaluating all the characteristics of the fluid and not just depending on the magnetic and yield stress properties shown by the
The main aim of the current study was to interpret the reasons for the faulty behaviour of the current MR damper that was found in the experiments. It has been shown that the complicated characteristics associated with the performance of the damper were successfully predicted by the coupled FE/CFD approach presented. These complicated characteristics are: (i) the definition of the magnetic-field-dependent apparent viscosity of the MR fluid performed by the current coupling technique between the FE and CFD models, (ii) the inclusion of nonlinear magnetic properties in the current FE model and (iii) the inclusion of the effects of fluid compressibility and air presence as bubbles and a large air pocket. The prediction of these parameters has been shown by the fairly good matching between the theoretical and experimental results shown in Figures 18 and 19. The other aim of the current study was to evaluate the characteristics of the MR fluid used, as the fluid characteristics have not been reported in the literature.
It can be concluded that the presence of air bubbles in MR damper leads to a different performance of the damper compared to the ideal performance shown in Figure 1. This has been shown by the shifted location of peak pressure in the current experiments compared to the ideal locations reported in Wang and Liao (2011). Also, the presence of air bubbles has been shown to conduce a different rheological behaviour of the fluid. This has been shown by the results of viscosity and velocity contours seen in Figures 22 and 23, respectively, due to faultless and faulty modes.
The presented numerical model is thought to be useful in the modelling of the complicated rheological behaviour of MR fluids in different applications, which may be not limited to MR dampers. This complicated behaviour is not only due to the multi-physics phenomena involved in MR fluid flow, but also due to other sources of nonlinearity that have been accounted for in the current model, namely: nonlinear magnetic properties, fluid compressibility and presence of air bubbles and a large air pocket. Future work of this study will include overcoming the faulty behaviour of the damper and getting rid of the presence of air bubbles. The leakage problem can be overcome by modifying the current design, whereas air bubbles could be removed by the operation of a vacuum pump after filling the damper with the fluid. Also, future work will include optimising the dimensions of the piston to enhance the suggested design.
Footnotes
Acknowledgements
The authors would like to acknowledge the support obtained from Vacuumschmelze GmbH in Germany, to this research in the form of materials, technical data and heat treatments. Also, the authors want to acknowledge the support obtained from ![]() Corporation in the USA in the form of supporting diaphragms that were used in the current study.
Corporation in the USA in the form of supporting diaphragms that were used in the current study.
Declaration of conflicting interests
The author(s) declared no potential conflicts of interest with respect to the research, authorship, and/or publication of this article.
Funding
The author(s) received no financial support for the research, authorship, and/or publication of this article.