
Abstract
Recent research has shown that estimations of the transformation temperatures of superelastic Nitinol using differential scanning calorimetry can be inaccurate, in part, due to the residual stress in the material. Superelastic Nitinol is selected as the end-cap material in a tunable cymbal transducer. The differential scanning calorimetry accuracy is initially probed by comparing transformation temperature measurements of cold-worked superelastic Nitinol with the same material after an annealing heat treatment, administered to relieve stresses from fabrication. The accuracy is further investigated through a study of the vibration response of the cymbal transducer, using electrical impedance measurements and laser Doppler vibrometry to demonstrate that the change in resonant frequencies can be correlated with the transformation temperatures of the Nitinol measured using differential scanning calorimetry. The results demonstrate that differential scanning calorimetry must be used with caution for superelastic Nitinol, and that an annealing heat treatment can allow subsequent use of differential scanning calorimetry to provide accurate transformation temperature data.
Keywords
Introduction
There has been increasing interest in the ability to tune the operating frequency of ultrasonic devices such as those for surgical applications. Nitinol, a shape memory alloy (SMA), which is a binary alloy of nickel and titanium, offers the capability for frequency tuning through a small change in temperature. Nitinol has recently been used in tunable frequency cymbal transducers (Feeney and Lucas, 2014; Meyer and Newnham, 2000), where the elastic modulus of the Nitinol is controlled by a change in the temperature of the material. A common method of measuring the transformation temperatures is by the use of differential scanning calorimetry (DSC). However, it has been reported (Abel et al., 2004) that DSC results can exhibit inaccuracies, especially for superelastic Nitinol, although the supporting experimental evidence is not extensive. A recent publication by the authors (Feeney and Lucas, 2014) on the design and characterization of Nitinol cymbal transducers showed that significant inaccuracies in the DSC characterization of a superelastic Nitinol (Johnson Matthey Noble Metals) occurred, whereas DSC characterization of a shape memory Nitinol (Memry GmbH) did not exhibit these inaccuracies. It has been postulated that the condition of Nitinol from the fabrication process, for example, cold worked, affects the ability of the DSC technique to accurately estimate transformation temperatures (Eaton-Evans et al., 2008). In order to investigate this phenomenon, superelastic Nitinol is subjected to an annealing heat treatment to attempt to relieve stress. The DSC method is then applied to the heat-treated Nitinol and a cymbal transducer is fabricated with annealed Nitinol end-caps. The accuracy of the DSC estimations is then determined by measuring the vibration response of the cymbal transducer through the phase transitions associated with the tunability of this transducer.
The flextensional transducer based on the traditional Class V configuration, called a cymbal transducer, was first proposed in the 1990s (Zhang et al., 1999, 2000), the name being based on the cymbal shape of the end-caps. The cymbal transducer converts the small radial displacement amplitude of the driver disk, which is normally a piezoceramic such as lead zirconate titanate (PZT), into an amplified axial displacement (Zhang et al., 2001). The cymbal was developed in order to increase the generative force and operational displacement from that of an earlier moonie transducer (Silva et al., 1999). The cymbal transducer has been very successful in low- and medium-power applications such as transdermal drug delivery (Lee et al., 2004; Maione et al., 2002; Smith et al., 2003) and underwater acoustic transduction arrays (Newnham et al., 2000, 2001, 2002). The main limitation for adoption in high-power applications is that the epoxy resin used to form the mechanical coupling is insufficient for the higher stresses associated with the higher power levels (Lin, 2010). Consequently, in recent years, there have been a number of proposed modifications of the cymbal transducer (Bejarano et al., 2012, 2014; Lin, 2010), for example, for incorporation in an ultrasonic orthopedic surgical device (Bejarano et al., 2014).
In addition to developments of the cymbal transducer for operation at high power, there is an increasing desire to be able to operate a single device at more than one resonant frequency (Meyer and Newnham, 2000). A novel method of achieving this tunable characteristic is to use phase changing materials. For example, in the 1990s, it was demonstrated that the natural frequencies of composite fiberglass beams could be controlled using embedded Nitinol wires (Baz et al., 1995). More recently, there have been a small number of studies reporting the incorporation of Nitinol in a cymbal transducer as the end-cap material (Feeney and Lucas, 2014; Meyer and Newnham, 2000). These investigations have principally focused on the tunable frequency capability of the transducer in response to a thermal stimulus. An example of a cymbal transducer, based on the classical design but with superelastic Nitinol end-caps, is shown in Figure 1.
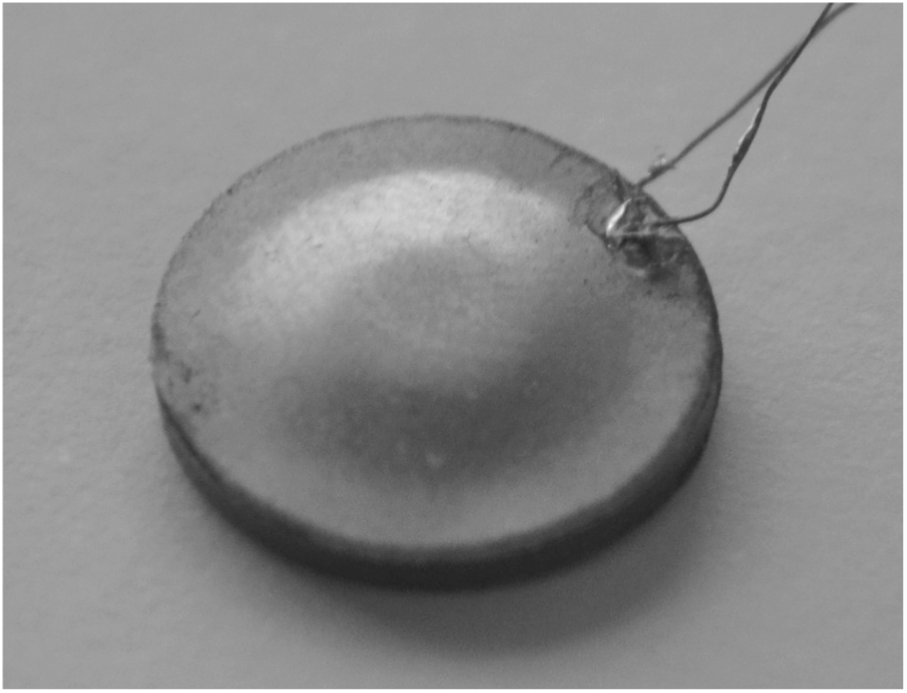
A superelastic Nitinol cymbal transducer.
In order to develop a range of tunable high-power ultrasonic devices that can incorporate a Nitinol cymbal transducer, it is essential that the transformation temperatures of the end-cap material are known. If DSC is unreliable in this respect, then there is little opportunity to progress toward predictable and reliable devices.
Nitinol characteristics
Nitinol is a binary alloy of nickel and titanium, whose smart properties were recognized by Buehler et al. in the 1960s (Gil and Planell, 1998). It has become very popular in a wide range of applications, most notably in the biomedical industry where it has found success in cardiovascular stents (Kumar and Lagoudas, 2008; Pelton et al., 2000). The microstructure of Nitinol transforms between cubic austenite at high temperature and monoclinic martensite at low temperature (Thompson, 2000). An intermediate transformation can occur, called the R-phase, which is characterized by the emergence of a rhombohedral phase in the material microstructure. This phase is especially common in Nitinol alloys which are rich in nickel (Shaw et al., 2008). The transformation between phases can be generated by stress or temperature (Thompson, 2000). The Young’s modulus of Nitinol is phase dependent, with the modulus of martensitic Nitinol reported to be around 28–41 GPa, reaching between 60 and 90 GPa in the austenitic condition (Meyer and Newnham, 2000). It has been reported that the relationship between Nitinol modulus and temperature is complex, principally because the modulus is known to be affected by the strain in the material (Duerig, 2006). Precise modulus changes resulting from heating or cooling of the Nitinol are also very difficult to predict because of the difficulty of accurately measuring the mechanical properties of the material. The phase transformation of the material in response to temperature change exhibits a high level of hysteresis. Consequently, the temperatures at which the material transforms between microstructure phases are dissimilar between heating and cooling. As a result, the start (S) and finish (F) temperatures of a phase transition are normally defined with reference to the respective microstructure phase: austenite (A), martensite (M), or R-phase (R). Until the finish temperature of a Nitinol phase has been passed (at which point one of the phases is eliminated), the microstructure will contain a mixture of more than one phase.
There are two types of Nitinol which can be fabricated. The first is shape memory Nitinol, whose austenite finish transformation temperature, AF, is at a sufficiently high temperature for the material to be heated in order to generate a different microstructure phase. The shape memory effect (SME) can hence be exhibited because the material is generally martensitic at the room temperature. If shape memory Nitinol is deformed, its original configuration can be recovered by heating beyond the AF transformation temperature. The second type of alloy is superelastic Nitinol. In order to exhibit superelasticity, the Nitinol must exist above its AF transformation temperature, where very large deformation is recoverable. Under sufficient stress, the loaded regions of the austenitic microstructure transform to martensite. Superelastic Nitinol is often subjected to high levels of cold working in the fabrication process (Morgan, 1999), and residual stresses can therefore form within the material (Kuhn and Jordan, 2002).
The transformation temperatures of Nitinol can be tuned by changing the chemical composition of the material, through certain cold working procedures, or by the application of specific heat treatments (Shaw et al., 2008). The effects of including different alloy constituents in Nitinol have been documented in detail (Pelton et al., 2003), but the influences of cold working and heat treatment are more difficult to quantify. A number of studies have investigated the aging and heat treatment of Nitinol, in terms of duration and temperature, in order to identify the most effective ways to influence the transformation temperatures (Huang and Liu, 2001; Pelton et al., 2000; Xu and Wang, 2010). In particular, focus has been placed on the manipulation of the AF transformation temperature (Pelton et al., 2000). Since the end-caps used in this study have been mechanically formed prior to heat treatment, the influence of annealing on the transformation temperatures of the end-caps may be more significant than the effect of annealing a flat disk, but this is very difficult to determine in practice. The measurement of the transformation temperatures of Nitinol is commonly performed using DSC (Alapati et al., 2009; Alexandrou et al., 2006; Kus and Breczko, 2010).
Transformation temperature measurement
Adoption of SMAs, such as Nitinol, in products has relied on measurement techniques that can enable characterization of the transformation response. The phase transformation of Nitinol affects multiple properties. For example, the elastic modulus, electrical resistivity, and magnetic susceptibility of Nitinol are all lower in the martensite phase compared to the austenite phase (Duerig and Pelton, 1994). The transformation temperatures of Nitinol can be measured using techniques such as dynamic mechanical analysis (DMA). However, the most commonly used method of transformation temperature measurement is DSC, which is a thermoanalytical technique. One of the reasons for its popularity over other techniques is its ability to obtain accurate and comprehensive transformation temperature and specific and latent heat data, whereas, for example, it can be difficult to interpret the change in electrical resistivity over a temperature range (Shaw et al., 2008). The DSC method enables all the transformation temperatures to be estimated, where the heat flow in a sample of the material is measured as a function of temperature. An endothermic reaction correlates with a transformation to austenite, whereas exothermic behavior is exhibited for a transition to a martensitic microstructure (Kus and Breczko, 2010). Despite the advantages, inaccuracies in DSC measurements have been reported in a number of studies (Eaton-Evans et al., 2008; Feeney and Lucas, 2014; Obaisi, 2013) and are suggested to be as a result of residual stresses which arise in the fabrication of Nitinol, for example, in the tailoring of the properties of superelastic Nitinol (Eaton-Evans et al., 2008). However, the supporting experimental data relating to inaccuracy of DSC data are insufficient to draw firm conclusions (Abel et al., 2004).
In order to enable the effective design of Nitinol devices with a tunable frequency capability, it is necessary to determine the transformation behavior of Nitinol accurately from DSC analysis. Therefore, based on these previous studies, it is clear that a better understanding is needed of how the fabricated condition of the Nitinol is related to the reliability of DSC analysis.
DSC of Nitinol end-caps
Cymbal transducer end-caps are often formed from sheet metal, usually using a punch to ensure repeatability in the geometrical dimensions. Since the transformation temperatures of Nitinol are extremely sensitive to heat treatment, cold working, and chemical composition, DSC analysis is generally conducted on samples cut from sacrificial fabricated end-caps to ensure consistency.
The superelastic Nitinol end-caps (Johnson Matthey Noble Metals) used in this study are composed of 55.99 wt% nickel balanced with titanium. As a rule, as nickel content is increased, transformation temperatures decrease (Kumar and Lagoudas, 2008). Small amounts of elements C, Co, Cu, Cr, Fe, Mn, Mo, Nb, O, and Si are also included, comprising less than 0.3% of the total composition, in order to tailor the transformation characteristics such that the Nitinol is superelastic at the room temperature.
It has been reported that a heat treatment, such as aging, at a temperature of around 450 °C can result in a noticeable increase in the AF transformation temperature (Pelton et al., 2003). An annealing heat treatment at 450 °C was therefore selected in order to compare the accuracy of DSC estimations of transformation temperatures of cold-worked superelastic Nitinol cymbal end-caps before and after annealing. Two end-caps were annealed at 450 °C for 1 h, and another two were annealed at the same temperature for 2 h. Once the Nitinol end-caps were annealed, they were subjected to water quenching to ensure the cooling process for the end-caps was consistent. Small samples cut from sacrificial end-caps were also heat treated for use in DSC estimation.
A DSC (Perkin Elmer Diamond) calibrated with indium was used for the estimation of the transformation temperatures. Two characterizations of the Nitinol phase transformations were conducted for two different scan rates, 10 °C/min and 20 °C/min, because both the accuracy and the sensitivity of DSC measurement data are dependent on the scan rate. As the scan rate is increased, a higher temperature gradient is applied, and consequently, the heat flow within the material is greater. This is exhibited in the DSC thermogram as a more significant and discernible transformation event, compared to using a lower scan rate. In contrast, the data are less accurate if the scan rate is increased because of the resultant thermal lag. Additionally, because the DSC analysis method employs a heating and cooling cycle, and it is known that thermal cycling of Nitinol can influence the transformation temperatures (Zarnetta et al., 2010), the DSC process should ideally be conducted on a sample of Nitinol once only, to ensure a high reliability of the thermogram data.
Nitinol exhibits thermal hysteresis, meaning the transformation behavior on the heating cycle is not the same as on the cooling cycle. Transformation events between the different microstructural phases can be clearly identified from a DSC thermogram if an appropriate scan rate and temperature range are selected. The subsequent estimation of the transformation temperatures is known to be liable to error (Shaw et al., 2008); however, in general, the steepest portion of the thermogram curve at each transformation event is extrapolated and the associated transformation temperature is at the intersection with a defined baseline.
The DSC thermograms for both the untreated (Feeney and Lucas, 2014) and treated superelastic Nitinol samples, cut directly from sacrificial end-caps, are shown in Figure 2, where the upper and lower curves in each image correspond to the heating and cooling cycles, respectively.
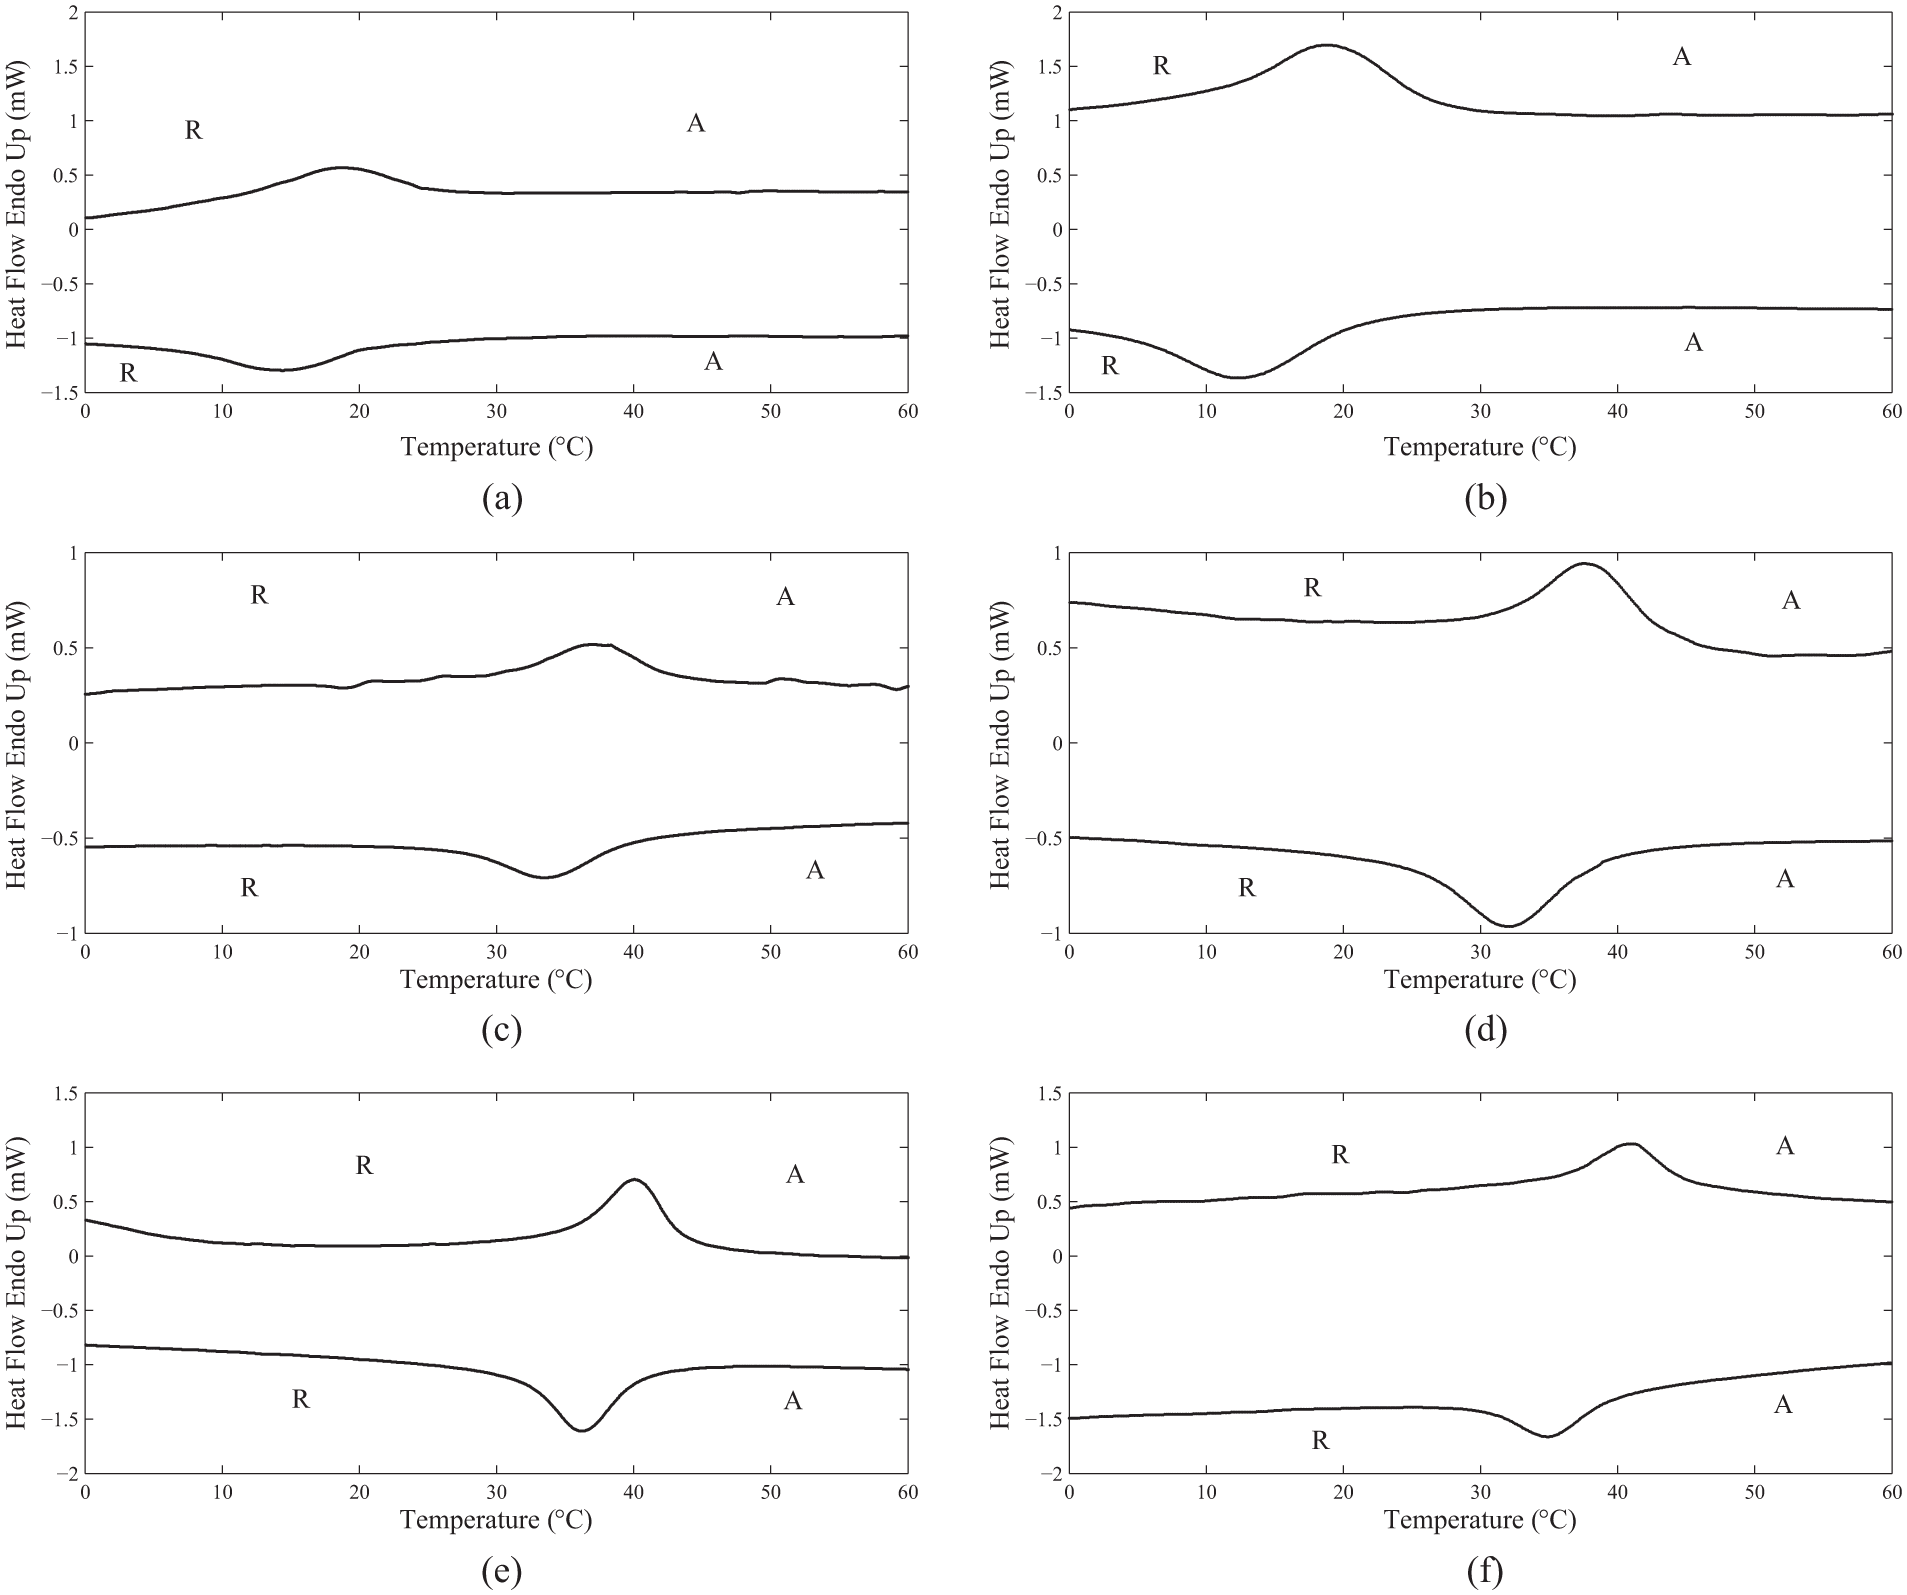
DSC thermograms for untreated superelastic Nitinol (Feeney and Lucas, 2014) at (a) 10 °C/min and (b) 20 °C/min; annealed for 1 h at (c) 10 °C/min and (d) 20 °C/min; and for 2 h at (e) 10 °C/min and (f) 20 °C/min.
The estimated transformation temperatures for each annealed condition and measurement scan rate, extracted from the thermograms in Figure 2, are provided in Table 1, where they can be compared with those of the cold-worked superelastic Nitinol prior to annealing. The untreated Nitinol end-caps were fabricated from superelastic material and the DSC thermograms show that the AF transformation temperature is approximately the room temperature. However, the AF transformation temperature is estimated and so could be far lower. High resistance to deformation was exhibited by the untreated end-caps by physical inspection indicating the presence of a stiff microstructure, which is consistent with superelastic Nitinol. Transformations to the martensite phase were not identified for any of the Nitinol samples in the temperature range of the DSC tests. A single phase change can be observed in all the thermograms and, based on the relatively low thermal hysteresis between the transformation events in the heating and cooling cycles (Shaw et al., 2008), this single transformation is between the intermediate R-phase (R) and austenite (A). It can be assumed that the superelastic Nitinol, for both annealed conditions, transforms to martensite at sub-zero temperatures, and therefore, characterization of the transformation temperatures associated with this phase requires a technique such as liquid nitrogen DSC.
Transformation temperatures estimated from DSC analysis.
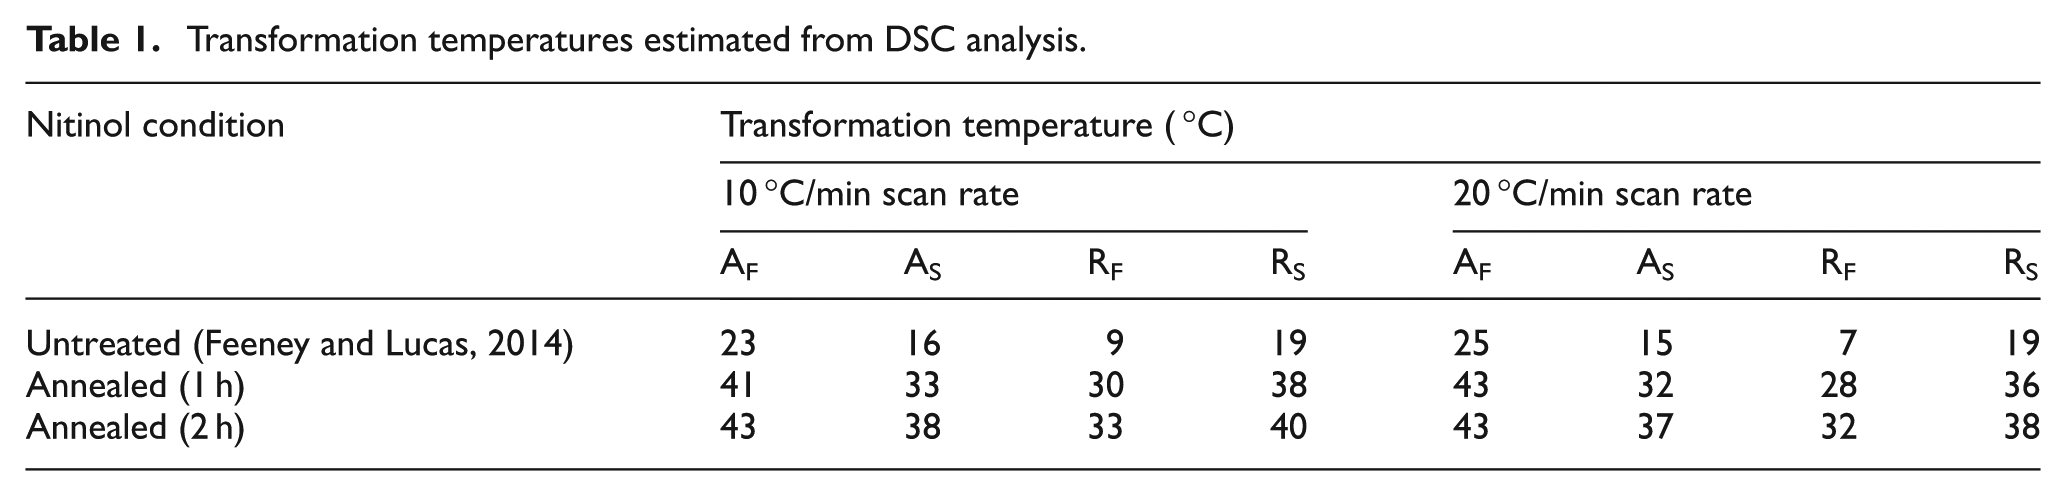
It has been previously established that superelastic Nitinol does not transform at the temperatures estimated from DSC (Eaton-Evans et al., 2008; Feeney and Lucas, 2014), as shown in Table 1. However, it is clear that after annealing, the DSC estimations of the transformation temperatures are very different from those of the untreated sample. Each heat treatment was conducted at the same temperature for the two durations, and the second hour of annealing has induced a further slight shift of the transformation temperatures. This suggests that transformation temperature change is not significantly dependent on the duration of the annealing process, a conclusion which is in broad agreement with a similar observation reported in the literature (Xu and Wang, 2010). In addition, the results in Table 1 show that there is no significant difference between the transformation temperatures measured using a scan rate of 10 °C/min and those measured at 20 °C/min, although the increase in scan rate has resulted in a small rise in heat flow in the samples annealed for 1 h. The compromise between sensitivity and accuracy is not seen to be critical for the two scan rates and data from either can provide transformation temperature estimates.
Although it is known that DSC is inaccurate for the characterization of superelastic Nitinol, what cannot be concluded solely from Table 1 is whether DSC becomes an accurate technique for the characterization of superelastic Nitinol once it has been subjected to a heat treatment, although the transformation temperatures have clearly changed significantly. The accuracy can be confirmed, however, through dynamic characterization of the resonant response of cymbal transducers fabricated with end-caps of the untreated and annealed superelastic Nitinol.
Transducer fabrication
In a cymbal transducer, metal end-caps sandwich a piezoceramic disk, bonded by an epoxy resin. The poling of the piezoceramic disk is in the thickness direction. The 2-h annealed Nitinol was used to fabricate one of the superelastic Nitinol cymbal transducers, which could then be compared with an identical transducer fabricated from the untreated superelastic Nitinol. A hard PZT, Sonox P4 (CeramTec), was chosen as the piezoelectric driver. A thin layer of insulating epoxy resin (Eccobond, Ellsworth Adhesives Ltd), at a ratio of three parts resin to one part hardener, was used as the bonding agent, with insulating epoxy used because of the high bond strength compared to conductive epoxy resins (Zhang et al., 2001). Small solder spots were deposited on the top and bottom surfaces of the piezoceramic disk to ensure electrical connectivity with the electrodes. Once the transducer was assembled, it was supported in a custom fabrication rig where the epoxy resin was allowed to cure for 24 h. Once the curing process was complete, electrodes were formed on the flange surface of each end-cap using a silver conductive epoxy (Chemtronics CW2400). Soldering was not used in this case in order to avoid any heating effects on the Nitinol and also because the passive titanium oxide layer which forms on Nitinol makes effective soldering difficult (Hall, 1993). The final geometrical dimensions for the transducer are summarized in Table 2, with each transducer end-cap dimension illustrated in the schematic in Figure 3.
Cymbal transducer geometrical dimensions (all units in mm).
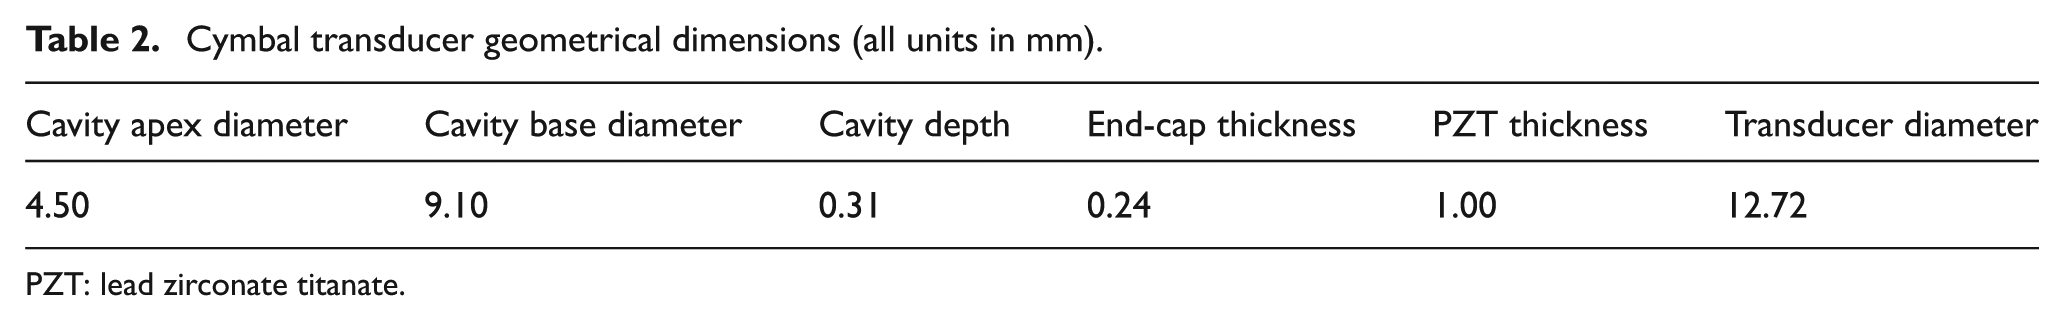
PZT: lead zirconate titanate.
Geometrical dimensions of the cymbal transducer end-cap.
Dynamic characterization of the transducer
Dynamic characterization of the cymbal transducer was used to identify the different resonant frequencies associated with operation in the R-phase and the austenite phase. The measurements can also be used to track the resonant frequency change of the transducer as a function of temperature, and hence detect the temperature at which the phase change occurs. In practice, this is not a highly accurate process as the phase change, and hence resonant frequency change, of Nitinol tends to occur too rapidly for a precise transformation temperature to be extracted using this technique. However, a useful estimation of the transformation temperatures is achievable by dynamic characterization and it certainly allows the results in Table 1 to be verified.
In the assembly of a cymbal transducer, difficulty in precise control of the amount and location of deposited epoxy resin means there are small differences in the bond profiles between the piezoceramic disk and the two end-caps. This asymmetry can result in a double peak in the measured frequency response spectrum (Ochoa et al., 2002, 2006; Tressler and Newnham, 1997), representing two fundamental modes of vibration of the cymbal transducer. One vibration mode exhibits out-of-phase motion of the end-caps (the symmetric mode) and the other exhibits in-phase motion of the end-caps (the asymmetric mode). The appearance of the double peak in the response is very common in cymbal transducers (Ochoa et al., 2006) and can also be caused by small differences in end-cap material or geometry (Ochoa et al., 2002, 2006; Tressler and Newnham, 1997).
The dynamic characterization experiments were therefore used to measure and track the resonant frequencies of both the symmetric and asymmetric modes through a temperature range that incorporated the phase transformation. The resonant frequency tracking required initial identification and measurement of the two mode shapes, followed by monitoring of the displacement amplitude of the transducer in each mode.
The cymbal transducer was characterized using three experimental techniques. The frequency response spectrum was first measured using electrical impedance analysis (Agilent 4294A), to identify the double peak and the resonant frequencies associated with the symmetric and asymmetric modes. Associating the two resonant frequencies with their mode shape (symmetric or asymmetric) was then achieved using experimental modal analysis (EMA), by measuring frequency response functions (FRFs) from a grid of measurement points on the surfaces of the cymbal transducers, with the vibration response being measured by a three-dimensional (3D) laser Doppler vibrometer (LDV) (Polytec CLV). Both electrical impedance analysis and EMA require only a very low level of excitation of the transducer, hence a very low input voltage across the piezoceramic. A stress-induced phase transformation in Nitinol occurs when sufficient stress is generated to cause a microstructure reorientation to martensite (Kumar and Lagoudas, 2008). There is evidence that this can be between 200 and 800 MPa, depending on both the temperature of the material and the loading path (Orgéas and Favier, 1998). However, electrical impedance analysis and EMA excite vibration of the end-caps which results in a maximum stress approximately two orders of magnitude lower (finite element models of the cymbal transducer estimated a maximum stress of around 3 MPa). The measured resonant frequency values are therefore principally associated with a change in temperature. The final characterization technique comprised excitation of the transducer through bi-directional frequency sweeps which allowed the displacement amplitude of the transducer to be measured as a function of excitation frequency for a fixed input excitation voltage, with the bi-directional sweep repeated for five 2 V increments from 2 to 10 V. The normal-to-surface displacement amplitude at the center of each end-cap face was measured using a one-dimensional (1D) LDV (Polytec), and a burst-sine excitation signal was used with two second intervals between each burst to minimize heating due to the excitation, which could particularly affect the experiments conducted at the lower temperatures and higher voltages.
The electrical impedance and displacement amplitude response measurements were conducted for two different temperatures, with the transducers placed in a temperature-controlled chamber controllable up to 80 °C. A lower temperature test was conducted where it was assumed, from the DSC thermograms, that the transducer end-caps would exist in the softer R-phase-dominated state, and a higher temperature test, where it was assumed the transducer end-caps were in the austenite-dominated state. The chamber temperature in each experiment was continuously monitored using a type K thermocouple, and measurements were only recorded once the transducer end-caps reached the temperature of the chamber, as verified by an infrared camera (FLIR T425). This infrared camera measurement is important because the transducer self-heats, which could influence the phase transformation. EMA was not conducted for the higher temperature test because access for 3D LDV measurements was not sufficient to acquire accurate FRFs in the chamber from the entire measurement grid on the end-cap surfaces.
Frequency response characterization through impedance analysis and EMA
The impedance–frequency spectra for the frequency response characterization experiments are shown in Figure 4. The DSC thermograms of the superelastic Nitinol annealed for 2 h showed start and finish transitions to austenite at 37 °C and 43 °C, respectively, and showed the Nitinol to exist in the R-phase at the room temperature. Therefore, for the impedance characterizations, a chamber temperature higher than 43 °C was required in order to ensure complete transformation to austenite from R-phase, and therefore, the temperature for the lower temperature test was set at approximately 20 °C and approximately 55 °C for the higher temperature test.
Impedance–frequency response of the annealed superelastic Nitinol cymbal transducer at two different temperatures.
It is evident from Figure 4 that the transducer exhibits the double peak in the response spectrum, associated with the resonant frequencies of the symmetric and asymmetric modes. Also, a significant increase in resonant frequency is achieved for both modes of vibration at the higher temperature. The increase in resonant frequency for each mode is shown in Table 3.
Resonant frequencies (Hz) of the superelastic Nitinol cymbal transducers at two different temperatures.
It was not possible to capture the precise temperature required for the completion of this resonant frequency shift from impedance analysis, and hence estimate the transformation temperature, due to the fast rate of temperature increase. However, the observations indicated a good correlation with the phase transformation temperatures obtained from the DSC analysis.
This is quite different to the findings from impedance analysis of the identical cymbal transducer fabricated with untreated superelastic Nitinol end-caps (Feeney and Lucas, 2014). In this case, the transducer was initially operated around 25 °C where, according to the DSC estimations, the Nitinol end-caps would be in the austenite condition. However, the change in resonant frequency did not complete at 25 °C, but continued to increase until a temperature of around 40 °C–45 °C was reached, indicative of the completion of the transition of the superelastic Nitinol end-caps to austenite. It is therefore clear that there is a poor correlation between the AF transformation temperature found from the DSC analysis and the AF transformation temperature estimated from monitoring the change in resonant frequency, for the untreated superelastic Nitinol transducer.
One reason that superelastic Nitinol might not complete its transition to austenite until around 45 °C is that the microstructure contains both austenite and R-phase constituents. This can occur if the Nitinol is at a temperature above the AS transformation temperature, but below the AF transformation temperature, such that not all the R-phase has been eliminated. The fabrication process of the superelastic Nitinol end-caps included cold working, which would influence the transformation temperatures of the material, thus raising the AF transformation temperature past the room temperature.
On comparison of the resonant frequencies of annealed superelastic Nitinol transducer, it is observed that despite the two end-caps being identical, there is a different frequency change through the phase transformation for the symmetric mode and the asymmetric mode. This difference has been similarly reported in another study (Meyer et al., 2002), but for a change in load media (air to water) rather than a change in temperature. Eliminating the asymmetric mode, whose frequency change is difficult to predict, from the frequency response, may be desirable in order to design and operate a reliable tunable cymbal transducer based on control of one modal response. However, eliminating asymmetries may not be realistic for the classical cymbal configuration and a modified version, similar to some that have previously been proposed (Bejarano et al., 2012, 2014; Lin, 2010), may be preferable.
In order to verify the modes of vibration, EMA was conducted at the room temperature, measured to be 21 °C, and the symmetric and asymmetric mode shapes are shown in Figure 5. Cool to warm colors indicate low to high displacement amplitudes, respectively, in the deformation plots.
Mode shapes of the annealed superelastic Nitinol cymbal transducer using EMA at 21 °C, showing the (a) symmetric mode at 15,029 Hz and (b) asymmetric mode at 20,519 Hz.
The symmetric mode shape is characterized by the two end-caps moving out-of-phase with each other (Figure 5(a)), whereas the asymmetric mode shape is characterized by the two end-caps moving in-phase (Figure 5(b)). This is typical for cymbal transducers with asymmetry and has implications for tunable transducers since the largest amplitude can only be realized on one side of the transducer. This again is an argument for incorporating a modification from the classical cymbal design that can reduce asymmetry. For each mode of vibration, one end-cap is more responsive than the other. The resonant frequencies of the modes of vibration of the transducer measured using EMA correlate well with those found from the electrical impedance measurements in the lower temperature condition shown in Table 3.
The results showing the increase in resonant frequency with temperature in Table 3 demonstrate that transducer end-caps stiffen from the softer R-phase microstructure to the austenite phase, and that the resonant frequency of a superelastic cymbal transducer can be tuned to more than one frequency, in the order of kilohertz, through a temperature change, by influencing the phase transformation properties of the material. The change in the resonant frequencies through a phase transformation was monitored through the electrical impedance analysis, and for both untreated and treated Nitinol transducers, there was no further increase in resonant frequency beyond a temperature of around 40 °C–45 °C. This means that the AF transformation temperature from impedance analysis frequency tracking experiments correlates well with DSC estimations for the treated Nitinol transducer but not for the untreated Nitinol transducer.
Displacement amplitude response measurements
The displacement amplitude through a frequency range incorporating resonance, of both the symmetric and asymmetric modes in each microstructure phase, was measured, as shown in Figure 6. The temperature within the test chamber was monitored using a type K thermocouple, and the temperature was recoded once the transducer had been allowed to thermally equilibrate, to ensure the desired Nitinol microstructure phase existed.
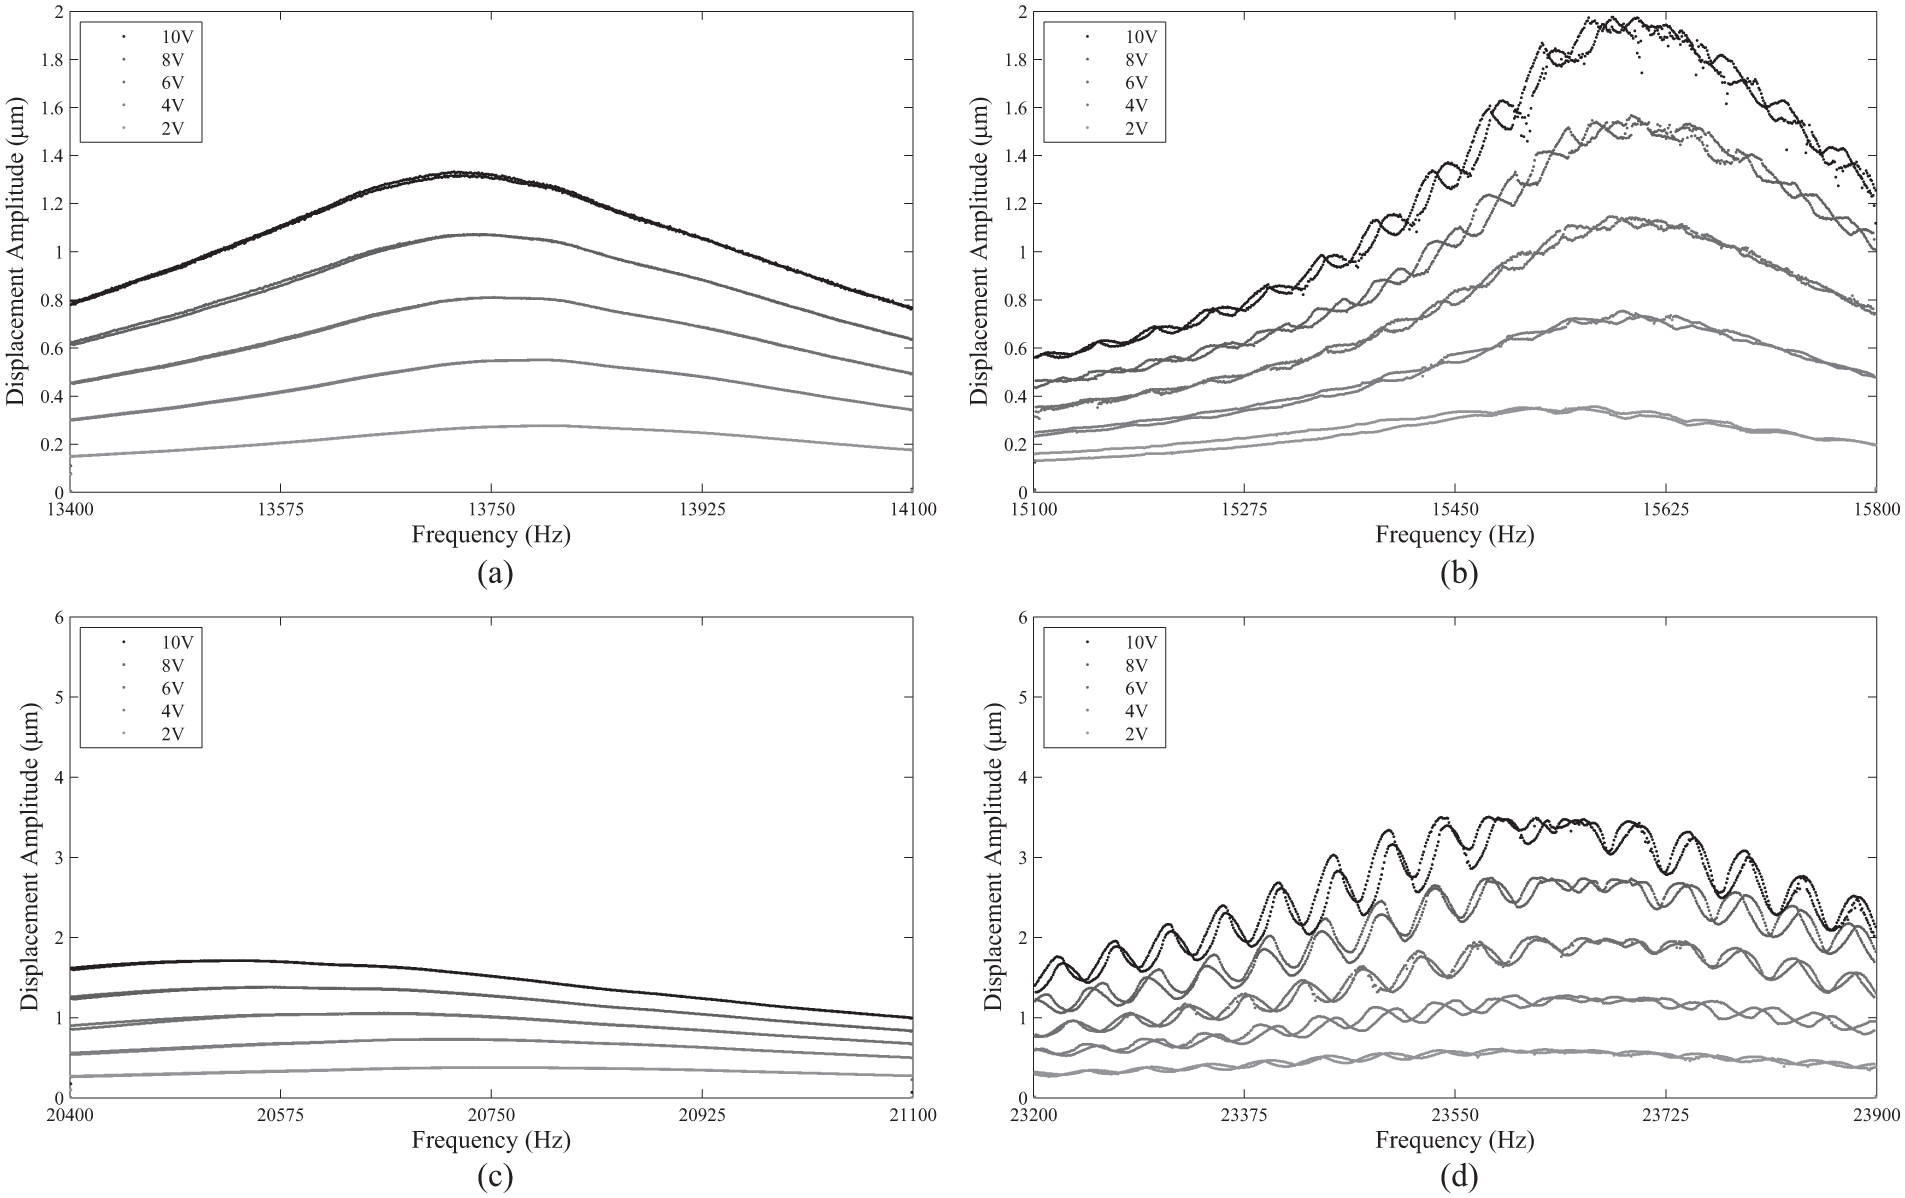
Displacement amplitude response of the annealed superelastic Nitinol cymbal transducer, for the symmetric mode at (a) 22 °C and (b) 52 °C, and the asymmetric mode at (c) 22 °C and (d) 53 °C.
The resonant frequencies of the transducer were tracked using the LDV system, where it was found that the resonant frequencies of the transducer increased above the room temperature, past 40 °C. Hence, the displacement amplitude measurements were recorded around 52 °C to ensure that the austenite phase was generated in the microstructure of the Nitinol.
The frequencies of the resonance peaks shown in Figure 6 correlate closely with those found by electrical impedance measurement and EMA. Additionally, by plotting the response through resonance using a bi-directional frequency sweep, the nonlinearity in the vibration responses is clearly exhibited. Nonlinear softening has been reported to occur in piezoelectric transducers due to driving the transducer above some threshold amplitude of vibration (Umeda et al., 2000). There is evidence of nonlinear softening in both Figure 6(a) and (c), which are the vibration responses of the transducer with end-caps in the R-phase, exhibited as a decrease in frequency for increased input voltage. However, for both modes in the high-temperature austenite condition, nonlinear hardening is exhibited at the lower input voltage levels, while a more linear response is measured at the higher input voltage levels, indicating that the end-caps have a hardening characteristic at low excitation that softens with increasing excitation level.
There are similarities in the vibration response of this transducer with that of the untreated superelastic Nitinol cymbal transducer. The first is that the vibration response of both modes exhibits an increase in displacement amplitude on transition to a higher modulus end-cap material phase, and this result is consistent for the heat-treated and -untreated transducers. This appears to be counter-intuitive, with lower amplitude normally expected for a stiffer material phase. It is very probable that the higher displacement amplitude can, at least in part, be attributed to the difference in damping capacity between austenitic and R-phase (or martensitic) Nitinol. It is known that martensitic Nitinol exhibits higher damping capacity compared to austenitic Nitinol (Piedboeuf et al., 1998); hence, there is a greater energy dissipation in the lesser-ordered martensitic or R-phase states than in the austenitic state. For a superelastic Nitinol transducer, this means that a larger input is required in the R-phase condition in order to achieve comparable displacement amplitudes for both phases of Nitinol.
Modulations in the displacement amplitude for each input voltage level in the austenite condition are present in the measurements for both modes of vibration. This characteristic can be attributed to the higher temperature of the transducer affecting the material properties of the epoxy resin bond layers (Feeney and Lucas, 2014). The flexural and storage moduli and the flexural strength are affected at higher temperatures (Harismendy et al., 1997), and this is a weakness of this transducer configuration for this tunable frequency application. However, alternative configurations exist that remove the epoxy layer and replace it with a mechanical coupling (Bejarano et al., 2014), and these can be investigated for future tunable cymbal transducers.
Superelastic Nitinol shows promise, when integrated in a cymbal transducer, for the design of ultrasonic devices that can be tuned to operate in the same mode at two distinct resonant frequencies via a phase transformation through a relatively small controlled temperature increase. The reliance on DSC for estimating the phase transformation temperatures has been shown to be inaccurate for superelastic Nitinol. However, if a sacrificial sample of the Nitinol is first subjected to an annealing heat treatment prior to DSC measurement, then the DSC estimates of the phase transformation temperatures become accurate and can be reliably used to understand how to control the temperature of the cymbal transducer to effect the excitation of the tunable resonant frequencies.
Conclusion
This investigation has demonstrated that by subjecting untreated superelastic Nitinol end-caps to a post-fabrication annealing heat treatment, thermoanalytical analysis by DSC can be adopted in order to more accurately estimate the transformation temperatures of the material. The accuracy of the DSC method was assessed using the data obtained from electrical impedance and laser Doppler vibrometry measurement techniques on a cymbal transducer fabricated using the material. EMA was used to determine the mode shapes and the associated resonant frequencies of the transducer with end-caps in the R-phase condition. The high level of correlation between the electrical impedance measurement results and those from the displacement amplitude analysis constitutes a reliable and comprehensive dynamic characterization. The resonant frequencies of the modes were found to increase at a temperature which was in close accordance with the AF transformation temperature estimated using the DSC method. However, this did not occur for the cymbal transducer with superelastic Nitinol end-caps which were not subjected to the post-fabrication annealing heat treatment. It is very likely that the annealing process has relieved the residual stress in the end-caps, which contributed to the inaccuracy of the DSC thermogram data. The physical condition of the Nitinol must be taken into account when considering the accuracy of the DSC thermogram data. Coupling dynamic characterization measurements with DSC enables the effects of temperature on the Nitinol material transformation to be accurately and reliably determined. This is important for the future design of tunable cymbal transducers using superelastic Nitinol.
Footnotes
Acknowledgements
The authors would like to acknowledge the EPSRC Engineering Instrument Loan Pool, which provided the DSC.
Declaration of conflicting interests
The authors declared no potential conflicts of interest with respect to the research, authorship, and/or publication of this article.
Funding
This work was funded by the Engineering and Physical Sciences Research Council (EPSRC) grant EP/P505534/1.