
Abstract
Kinship placement has been shown to be superior to foster care in increasing permanency and safety for children. Despite the many benefits of kinship placement, kinship caregivers receive less support than foster family, and this creates unique challenges. This study analyzes data from a state-wide kinship caregiver survey with 868 respondents. Caregivers reported their top three challenges and needs, which were stratified by caregiver-reported income, location of residence, and reasons for the child’s placement into kinship care. We found striking differences in reported challenges and needs based on income, region, and reason for placement. This further demonstrates the need for support for kinship families and can help develop targeted policies to alleviate challenges faced by kinship caregivers across the state.
Keywords
Background
Kinship caregivers, defined as relatives or close family friends who take on the responsibility of caring for children who are unable to live with their biological parents, play a crucial role in the welfare of children across the United States. According to a report by the Annie E. Casey Foundation, between 2020 and 2022, over 44,000 children in Washington State were living with kinship caregivers.1 In the United States, over 80% of out-of-home residency is with kin, although in the majority of cases, these are informal arrangements (Anderson et al., 2021).
Kinship care is an increasingly important option for children who are removed from their homes due to abuse, neglect, or other reasons. It’s been shown to provide a sense of familiarity, safety, and stability that is often lacking in other types of out-of-home care (Bell & Romano, 2017; Hallett et al., 2023). In addition, children in kinship care have improved physical health and behavioral health (Bramlett et al., 2017; Winokur et al., 2009). Studies have found that kinship caregivers face a variety of challenges that can impact their ability to provide adequate care for the children in their care (Winokur et al., 2009, 2018).
Formal kinship caregivers who are caring for children supervised by the public child welfare authority typically receive a high level of case management support and state benefits (Testa, 2017). In contrast, informal caregivers include kinship caregivers who care for children who are not supervised by the state child welfare authority and often lack assistance and support to access benefits readily offered to formal caregivers (The Annie E. Casey Foundation, 2023; Winokur et al., 2008). It’s estimated that over 95% of kinship caregivers are informal and therefore lack many of the benefits and services that formal kinship caregivers receive (The Annie E. Casey Foundation, 2012). This lack of economic and social resources can have an impact on both the caregiver’s and children’s long-term well-being (Stein et al., 2014).
Previous research has demonstrated unique needs of kinship caregivers (e.g., financial, emotional health, housing, and child care needs; Day et al., 2022; Washington et al., 2018). Financial strains and poverty have been identified more commonly in kinship families than in non-kin foster families (Rubin et al., 2017). Many benefits such as health care coverage are often lacking for kinship families (Geen, 2003). It has also been demonstrated that kinship families are in need of mental and behavioral health services for both kinship caregivers and the children living in their care (Kling, 2010).
To ensure that Washington State has the infrastructure to readily learn from caregivers and professionals in the field about service needs and concerns, a state-wide Kinship Care Oversight Committee (KCOC) was established. The KCOC is a collective of community partners that support and strengthen kinship families across the state. They include kinship caregivers, child and caregiver advocates, non-profit service providers, tribes, and legal community representatives. This body was legislatively established in 2003 to provide guidance to the Legislature in identifying, supporting, and strengthening kinship care families (Washington State Legislature, 2019). This committee has been crucial in both identifying and addressing the needs of kinship caregivers and provides guidance to the state to inform policy and practice priorities.
Washington State utilizes a regionally based service delivery model (six total regions across the state) for the implementation of child welfare services, including services for formal and informal kinship care providers. KCOC also uses this same regional model to provide services and case support for formal and informal kinship caregivers. See Figure 1 for a map of the Washington State regions.
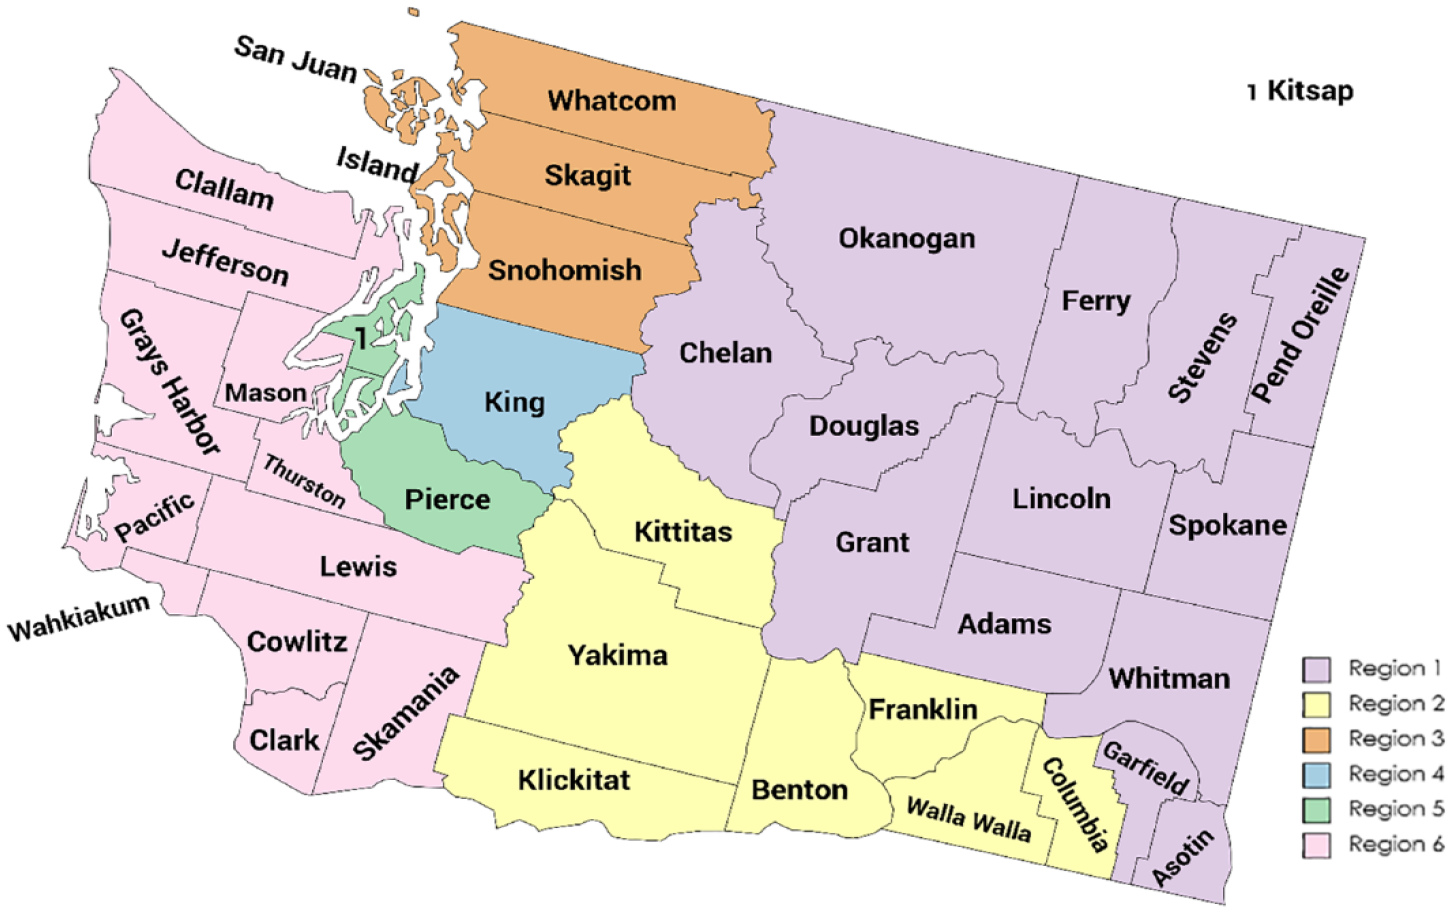
DCYF regions of Washington State.
Each of these regions offers varying levels of support and outreach to kinship families. Regions are also very different as two are considered majority urban (Regions 4 and 5), while the rest have a mix of rural and urban communities (Washington State Department of Health, 2021). In addition, the political climate for each region is very different with Regions 3, 4, and 5 voting majority Democrat in recent 2020 elections, Region 2 voting for majority Republican in the recent elections, and the remaining two regions with mixed voting histories (MIT Election Data and Science Lab, 2018). For these reasons, stratifying differences by region could provide additional insight into drivers and can inform regional policy and program development.
Despite the significant amount of literature on kinship caregiver challenges, there remains a lack of research on the specific needs and experiences of kinship caregivers in Washington State and how they differ based on family characteristics such as income, region, and reason for placement all of which can affect their needs. Regional differences can be a helpful tool to determine where resources should be created and allocated. County-level lack of resources has been tied to regional differences in child protective services (CPSs) response pathway determination (McCallum & Cheng, 2016). Similarly, allocation of health care services using community-based needs has been proposed as a solution to improve inequalities in health care access (Klein et al., 2023). In many states, the CPS departments serve specific regions or counties (Child Welfare Information Gateway, 2018). By studying how needs differ between regions, the state can better meet those unique regional needs.
The present study aims to explore the needs and experiences of kinship caregivers in Washington State, with a specific focus on understanding how caregiver characteristics may influence these needs. By gaining a deeper understanding of these factors at a regional level, policymakers and service providers can better design and implement support services that meet the unique needs of this population, ultimately improving outcomes for the children in their care.
Methods
This study used existing data from a state-wide survey of kinship caregivers residing in Washington State who are currently caring for a child or children under the age of 18 who are unable to live with their biological parents. This study was approved by the Washington State Institutional Review Board (IRB).
Instrument Details
A simple survey was designed with community collaboration with the KCOC to collect demographic data such as self-identified race and income, and specific questions on unique challenges and needs as a kinship caregiver. The survey was self-administered and took approximately 15 minutes to complete.
For challenges, caregivers were asked: “Please check three issues that present the greatest challenges related to raising the kinship children who are currently in your care.” Various options including an “other” category were provided. See Table 2 for category details. Similarly, caregiver unmet needs were assessed by asking, “The following are services and resources for which you may have needs that are not being met. Please check the three services or resources for which you have the greatest unmet needs regarding the children in your care.” Survey respondents were able to choose up to three categories. See Table 3 for category details. If a caregiver chose “other,” then they were provided a write-in option.
Caregivers responding to the survey could also select up to two reasons for the placement of the child. Since children are often placed for varied reasons, survey design allowed for the caregiver to select up to two reasons. For income and county, caregivers were given only one choice. Caregivers could optionally skip either question or answer “other” for the county and provide a free text response.
Survey design was based on previous research and input from community stakeholders within the KCOC. The responses for needs and challenges were limited to three choices to capture the most pressing needs. The ranking of needs and challenges was not used to minimize the time needed for survey completion and ease of completion.
Procedure
Surveys were collected through mass mailings to kinship caregivers identified by multiple governmental support organizations including the Washington Department of Children, Youth, and Families (DCYF), the Aging and Long-Term Support Administration (ALTSA), and the Economic Services Administration (ESA). Half of the participants were recruited through ESA, while the other two organizations recruited a quarter of the participants each.
Participants could complete a digital survey with a QR code or return a paper survey by mail. The survey was provided in both English and Spanish. Consent was provided by participants at the beginning of the paper or electronic survey. Participants who completed the survey received a $15 gift card for compensation of their time. In addition, participants were added to a lottery to win one of twenty $50 gift cards.
Sample
The sample included 868 kinship caregivers. The inclusion criteria included adult participants who were caring for non-biological children under the age of 18 years of age who had active cases in one of the three state agencies identified above in the last 24 months. Caregivers responded from all 39 counties across Washington State.
Two participants were missing all variables of interest in this study, leaving 866 participants in the final analyses. Participants missing a variable of interest, that is, income, county of residence, and reason for placement, were omitted from that specific calculation. There were six participants who lived outside Washington State and 88 participants who were missing county of residence; these participants were not included in the analysis for regional differences. Similarly, there were 66 participants who were missing income, those individuals were excluded from the calculations regarding the intersection of income and unmet needs. There were 28 individuals missing the variable of reason for placement, so those individuals were not included in the sub-analysis of reason for placement. An individual who was missing one variable of interest would be included in the other two analyses if they had responded to those survey questions.
Analysis
The main areas of interest for this study were county, reported yearly income, reason(s) for placement of the child into their care, top three challenges, and top three needs. Counties were recategorized into DCYF regions (1–6), as this was more relevant to influence policy changes. In addition, some counties had a very small number of participants which would have led to low power had a county-based sub-analysis been conducted. See Figure 1 for more details about each region.
Surveyed caregivers reported yearly income brackets in increments of $10,000 up to >$70,000. We used the U.S. Department of Health & Human Services (HHS) poverty guidelines for 2019 to choose our cut-offs for analysis (HHS, 2020). The average family size for study participants was between 3 and 4, which is what we used when considering how to stratify income. The 2019 HHS poverty guideline for a three-person and four-person family was $21,330 and $25,750, respectively. Since we could not use exact numbers as cut-offs, we used the bracket that was closest to the HHS poverty guideline, understanding that a small number of participants would be misclassified. We considered families making <$20,000 as living in poverty.
Since the cost of living in Washington State is higher than the national average, we also stratified using the national average household income as reported by the U.S. Census Bureau (n.d.). The average median household income in the United States in 2019 was $65,712. With this in mind and the inability to choose an exact amount, we selected a cut-off of <$60,000 as a rough cut-off for making less than the average.
The statistical software program R (V4.1.3) was used to calculate general descriptive statistics for survey responses. Excel was used to create plots using statistical outputs from the above analysis. Qualitative responses for the “other” category were coded for common themes to decide if these would fit into the categories provided by the survey. Free text responses were discussed by three researchers. If themes represented existing categories provided by the survey and the participant had not chosen that field, these participants were integrated into that categorical response. Those that did not fit into already established categories were considered “other.” These responses were analyzed by researchers for common themes. Because the “other” group was very small, it was not used in a graphical representation of the outcomes.
Results were presented to the KCOC for input. This discussion helped formulate the interpretation of our results.
Results
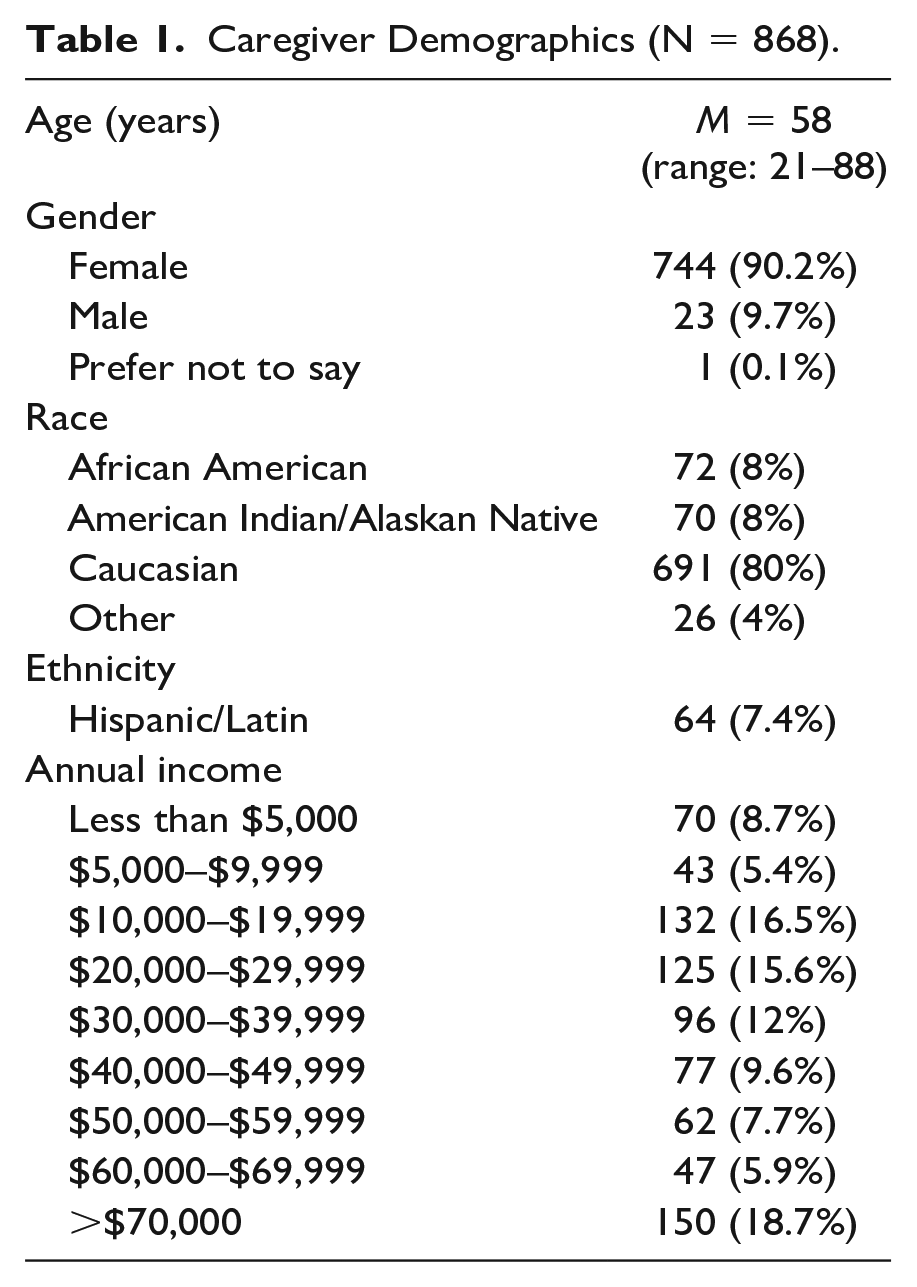
The mean age was 58 years, with a range from 21 to 88 years of age. Ninety percent of respondents were female. Caucasian caregivers made up 80% of the kinship caregivers who responded to the survey. Most of the caregivers identified as grandparents (71%). The majority of our population lived below the national average household income with the median being $20,000 to $29,999 bracket, though our data had a bi-modal distribution with peaks at $10,000 to $19,999 and again at >$70,000 brackets. See Table 1 for more detailed demographic information.
Caregiver Demographics (N = 868).
Financial challenges and financial assistance were by far the most common challenges and unmet needs for this population of respondents. In addition, when looking at the region and reason for placement, financial challenges and unmet financial needs were identified most frequently with a few exceptions which are discussed below. Thirty-six percent of respondents identified finances as a top three challenge, while 35% of respondents chose financial needs as a top three unmet need.
For the top three challenges, the child’s emotional health (32%) and the child’s behavior (27%) were identified most frequently, following financial challenges. Social and recreational activities for children (31%) and respite care (23%) were the second and third most common unmet needs following financial assistance. These themes persisted when stratifying for region and reason for placement with some exceptions.
Income
When caregivers were stratified for income, very different trends in challenges and needs became apparent. There were 243 survey respondents who reported annual incomes less than $20,000 and 555 survey respondents who reported annual incomes greater than or equal to $20,000. Caregivers reporting a yearly income of <$20,000 were more likely to choose finances, housing, and caregiver physical health as a top three challenge than those making greater than or equal to $20,000. Those making over $20,000 were more likely to choose a child’s emotional health, caregivers’ emotional health, respite care, delaying retirement, and both caregiver and child’s relationship with parents as unmet needs than those making less than $20,000. See Figure 2 for more details.
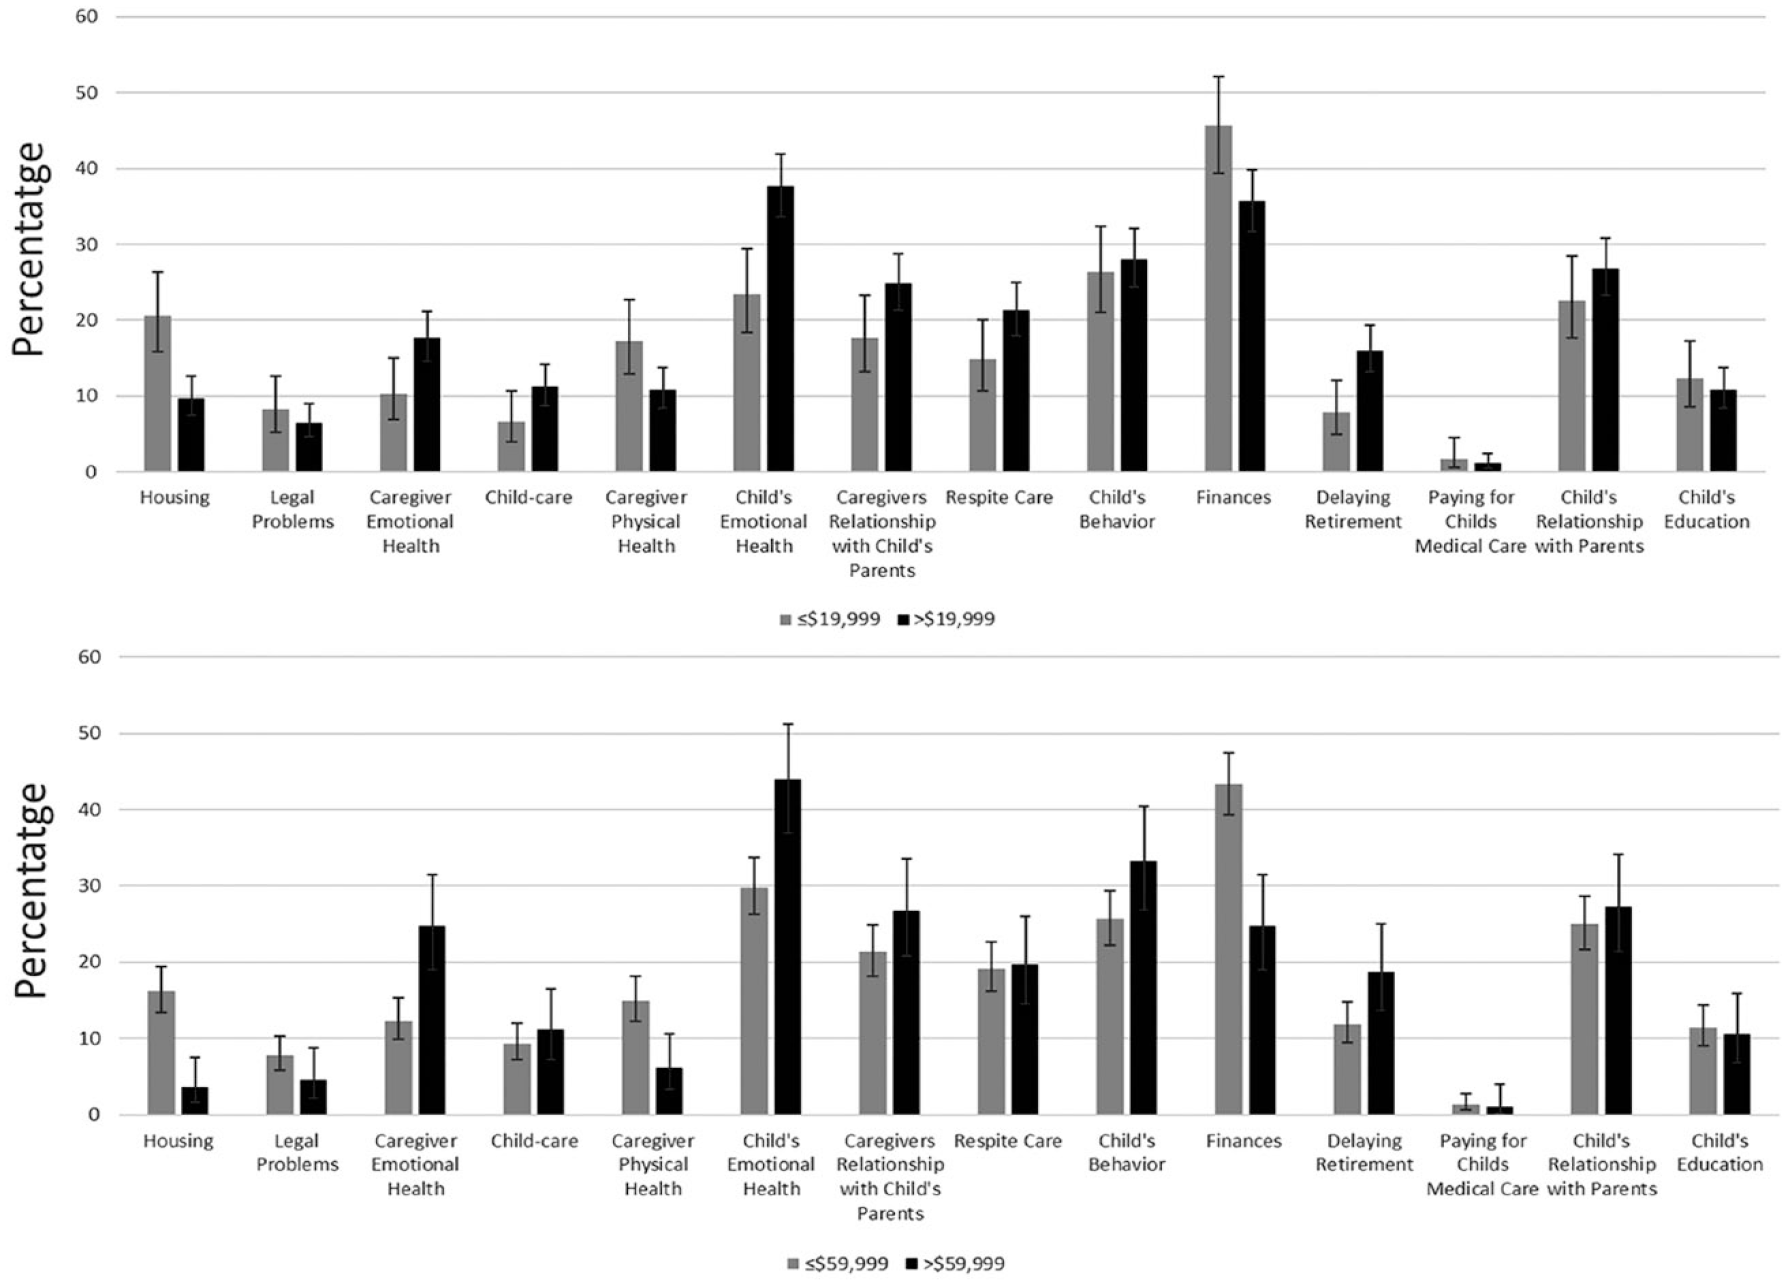
Top Three Challenges Chosen by Kinship Caregivers Above and Below $19,999 Annual Income and Above and Below $59,999 Annual Income.
When changing the income cut-off to $60,000, the patterns were similar. There were 600 respondents who reported annual incomes below $60,000 and 198 respondents who had annual incomes greater than or equal to $60,000. The difference in the percentage of people choosing finance and housing as the top three challenges increased. Similarly, the gap between mental health challenges such as the child’s emotional health and caregivers’ emotional health as a top three challenge widened. See Figure 2 for more details.
Region
Caregivers in specific regions identified different challenges and unmet needs. Regions 4 and 5 are considered mostly urban regions. While Regions 1, 2, 3, and 6 are considered mixed rural and urban, with the majority of counties being rural. See Figure 1 for more details about each region.
Overall, financial challenges were identified most frequently in Regions 1, 4, 5, and 6. In the other two regions, financial challenges were reported at the same or with slightly less frequency than the child’s emotional health challenges. When responding to needs, financial support was most frequently reported in all regions, with the exception of Region 3. Region 3 is just north of Seattle and mostly rural. In this region, recreational activities were identified more frequently as a need than financial needs. See Tables 2 and 3 for more details.
In Region 4, 22% of caregiver respondents identified housing as a top three challenge as compared to all other regions where only 11% (6.3%–13.2%) of caregivers identified housing as a top three challenge. Caregivers in Region 4 also identified transportation and child care needs twice as frequently as the other regions. This region also had the highest percentage of caregivers reporting financial support as one of their top three unmet needs. See Table 2 for more details.
Top Three Challenges Stratified by DCYF Region (% [CI]).
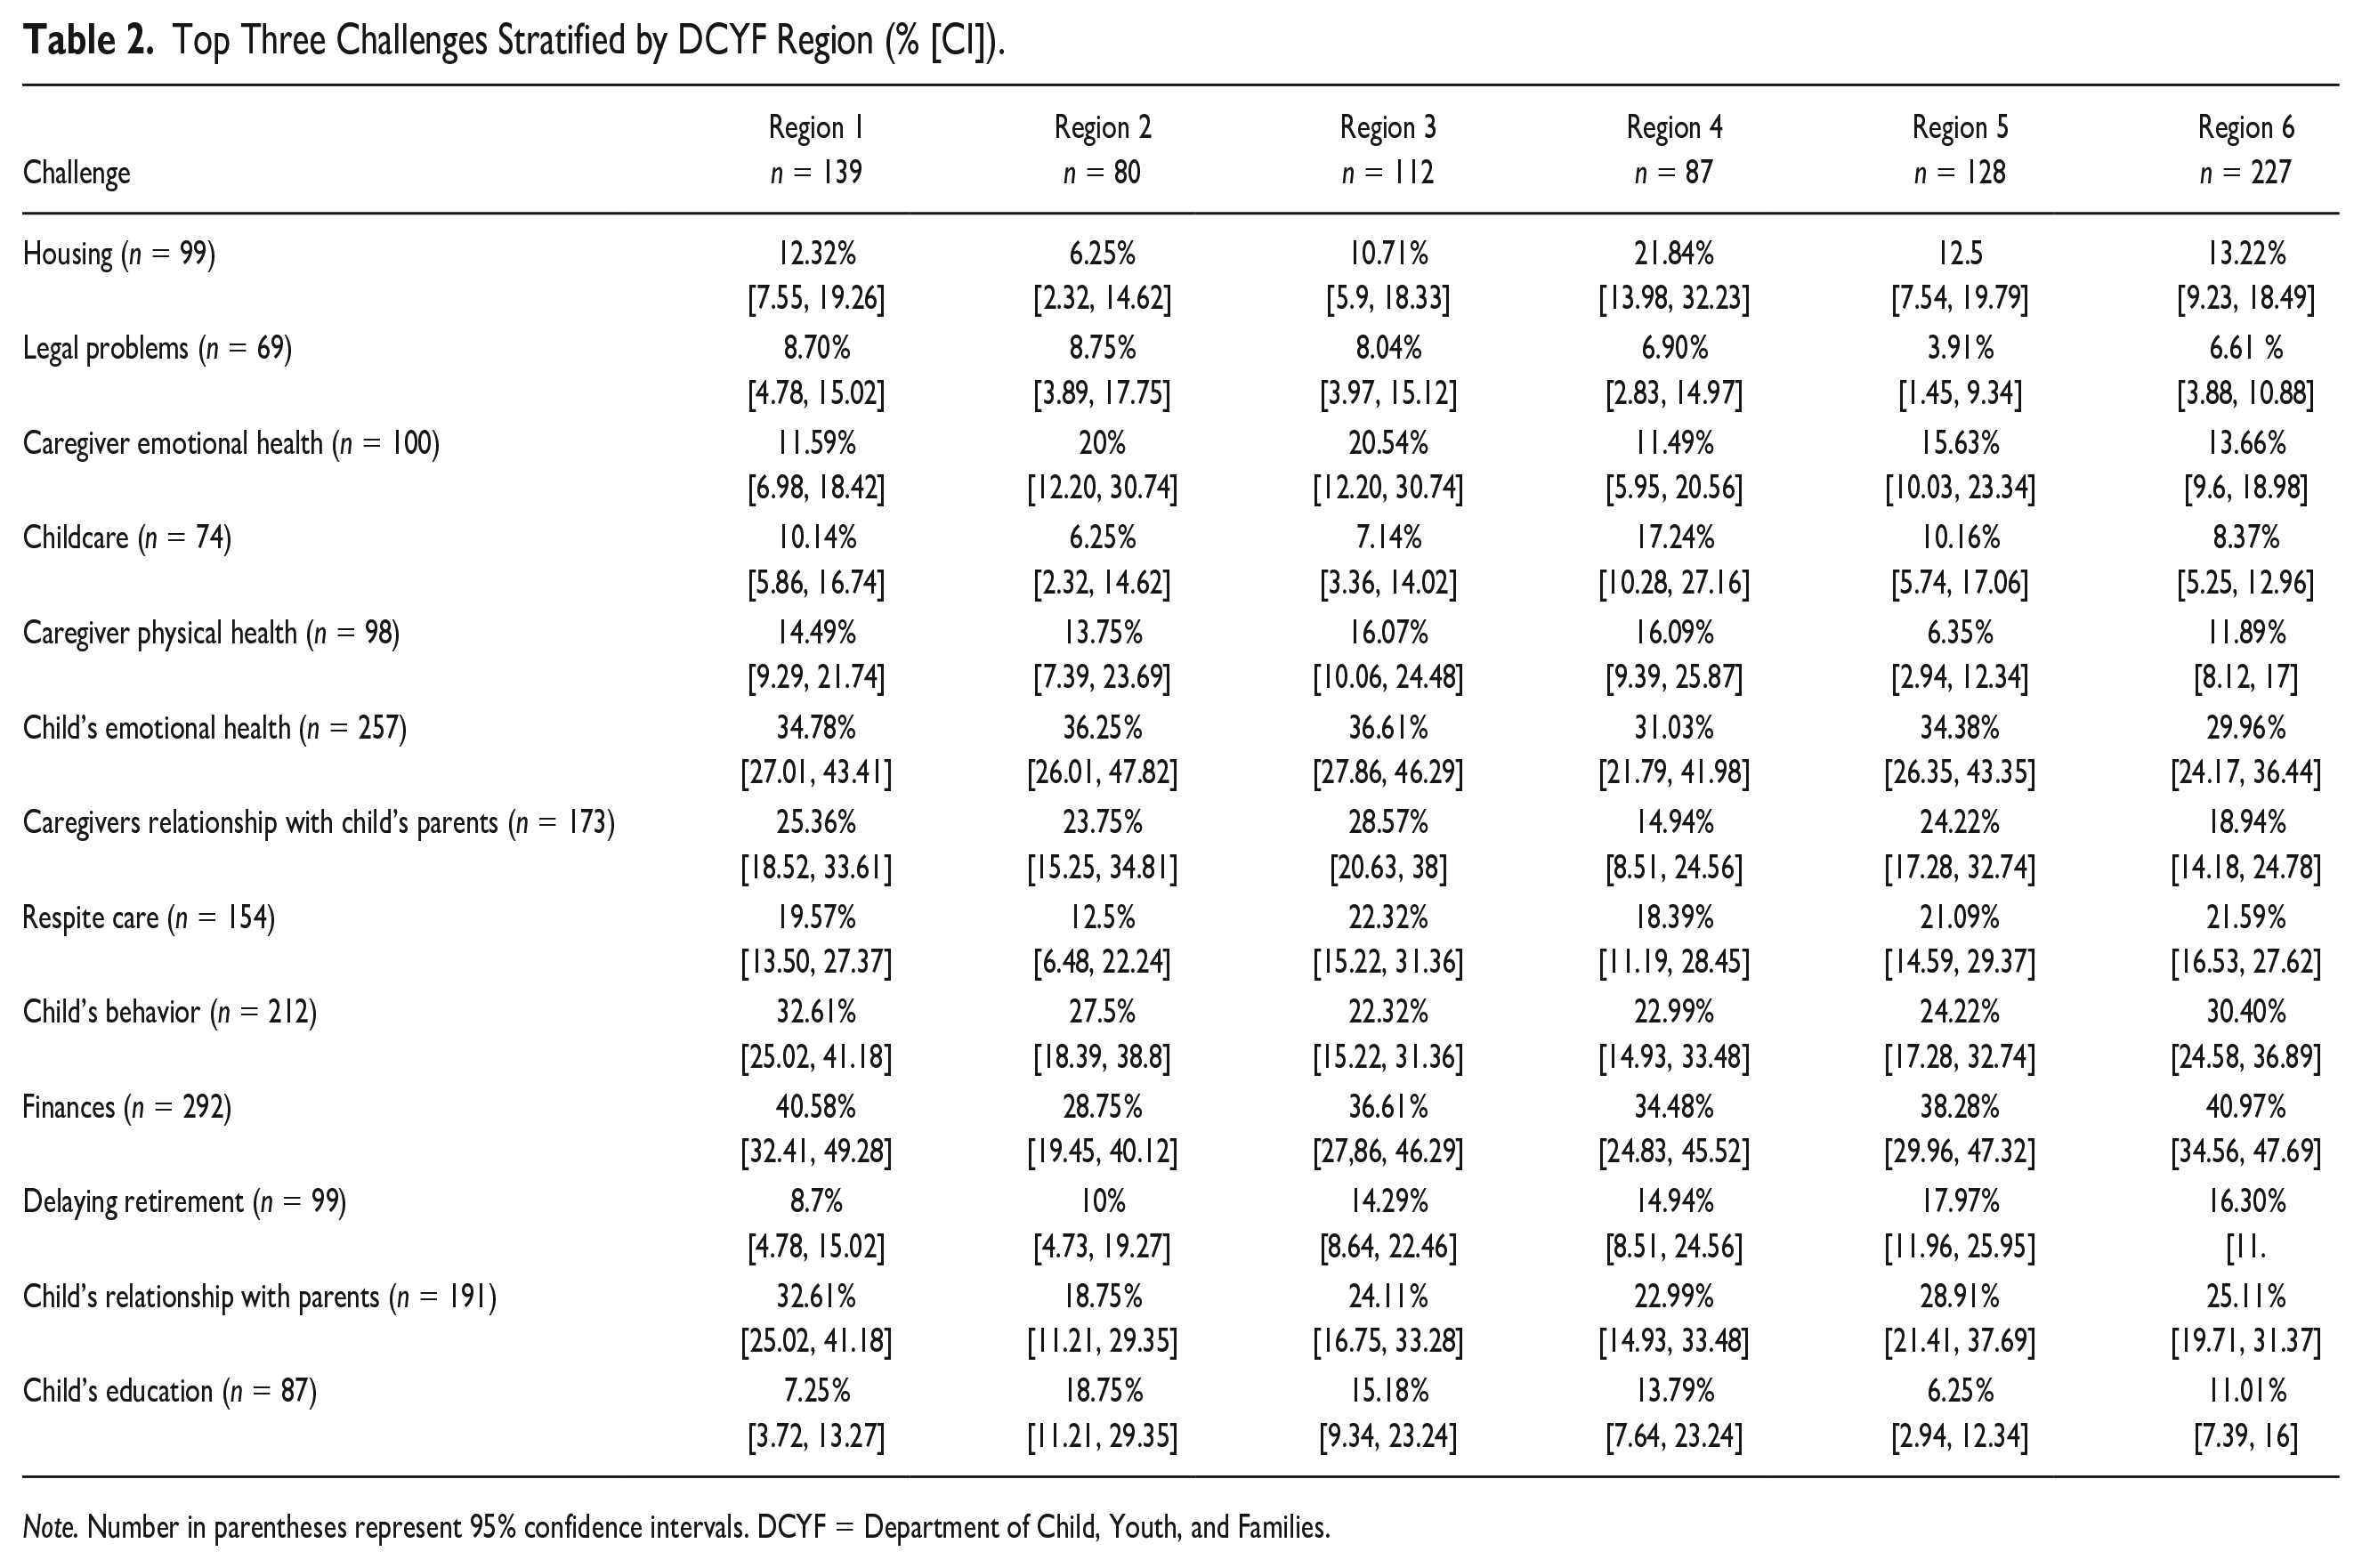
Note. Number in parentheses represent 95% confidence intervals. DCYF = Department of Child, Youth, and Families.
Top Three Unmet Needs Stratified by DCYF Region (% [CI]).
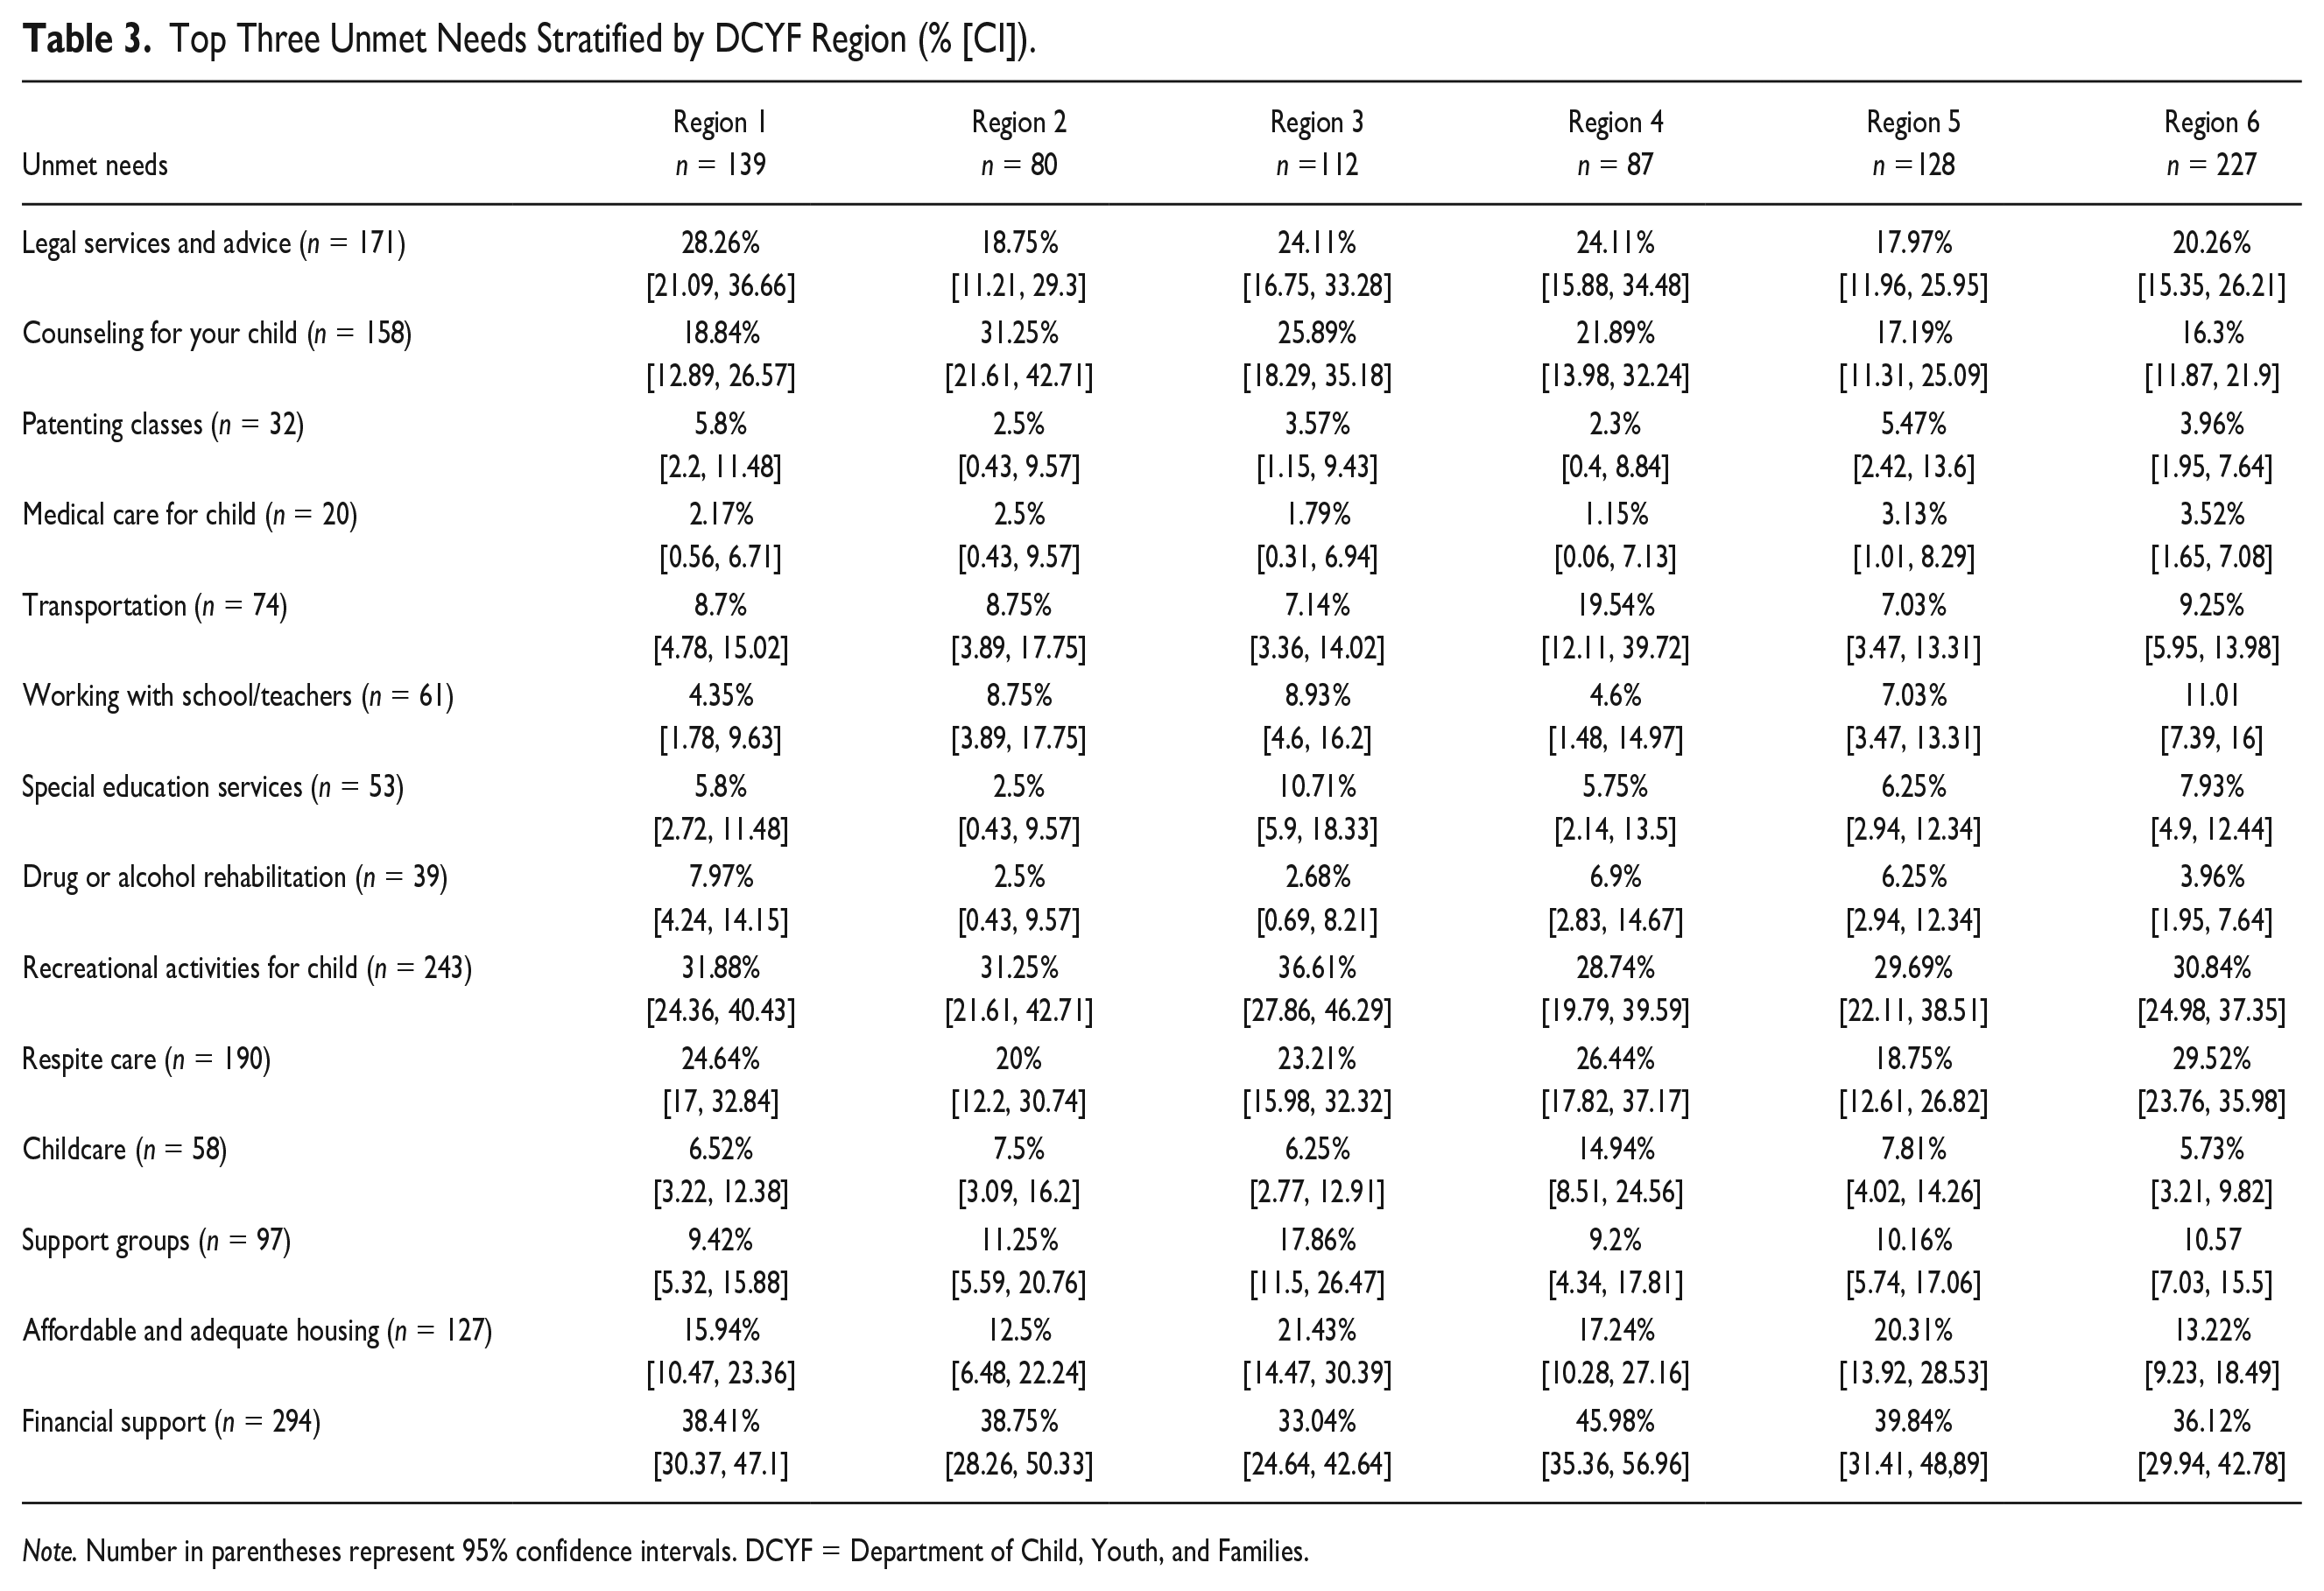
Note. Number in parentheses represent 95% confidence intervals. DCYF = Department of Child, Youth, and Families.
Another striking difference was that Region 1 reported a child’s relationship with their biological parent as a challenge more frequently than the other five regions with over 32% of caregivers from that region choosing this as a top three need. This is 8.6% higher than the average of the other five regions. Region 1 also reported higher levels of child behavioral health challenges than the other counties and the highest need for legal assistance.
Regions 2 and 3 reported the highest percentage for both caregiver and child emotional health challenges. The same two regions (2 and 3) reported counseling for their child as a need at a higher frequency than the other four regions. Region 3 also had the highest percentage of caregivers indicating a need for support groups. Over 31% of caregivers in Region 2 reported counseling for their child as an unmet need. This is 11% higher than the average of the other five counties (16.3%–25.9%). See Tables 2 and 3 for further details.
Reason for Placement
When stratifying for the caregiver’s reported reason for placement of the child/children in their care, the most common reason for placement was biological parent substance use (n = 575). We stratified based on the top six reasons for out-of-home placement: financial circumstances, substance use, incarceration, abuse/neglect, behavioral/mental health of the bio-parent, and homelessness.
Financial challenges were identified most frequently by caregivers as a top three challenge for all reasons for placement, except for child abuse and neglect. Over 40% of caregivers identified a child’s emotional health as a top three challenge when a child was placed out-of-home for child abuse or neglect reasons. Children placed for abuse and neglect also had the highest percentage of caregivers reporting a child’s behavior as one of their top three needs (32.6%) as compared to other reasons for placement. See Figure 3 for more details.
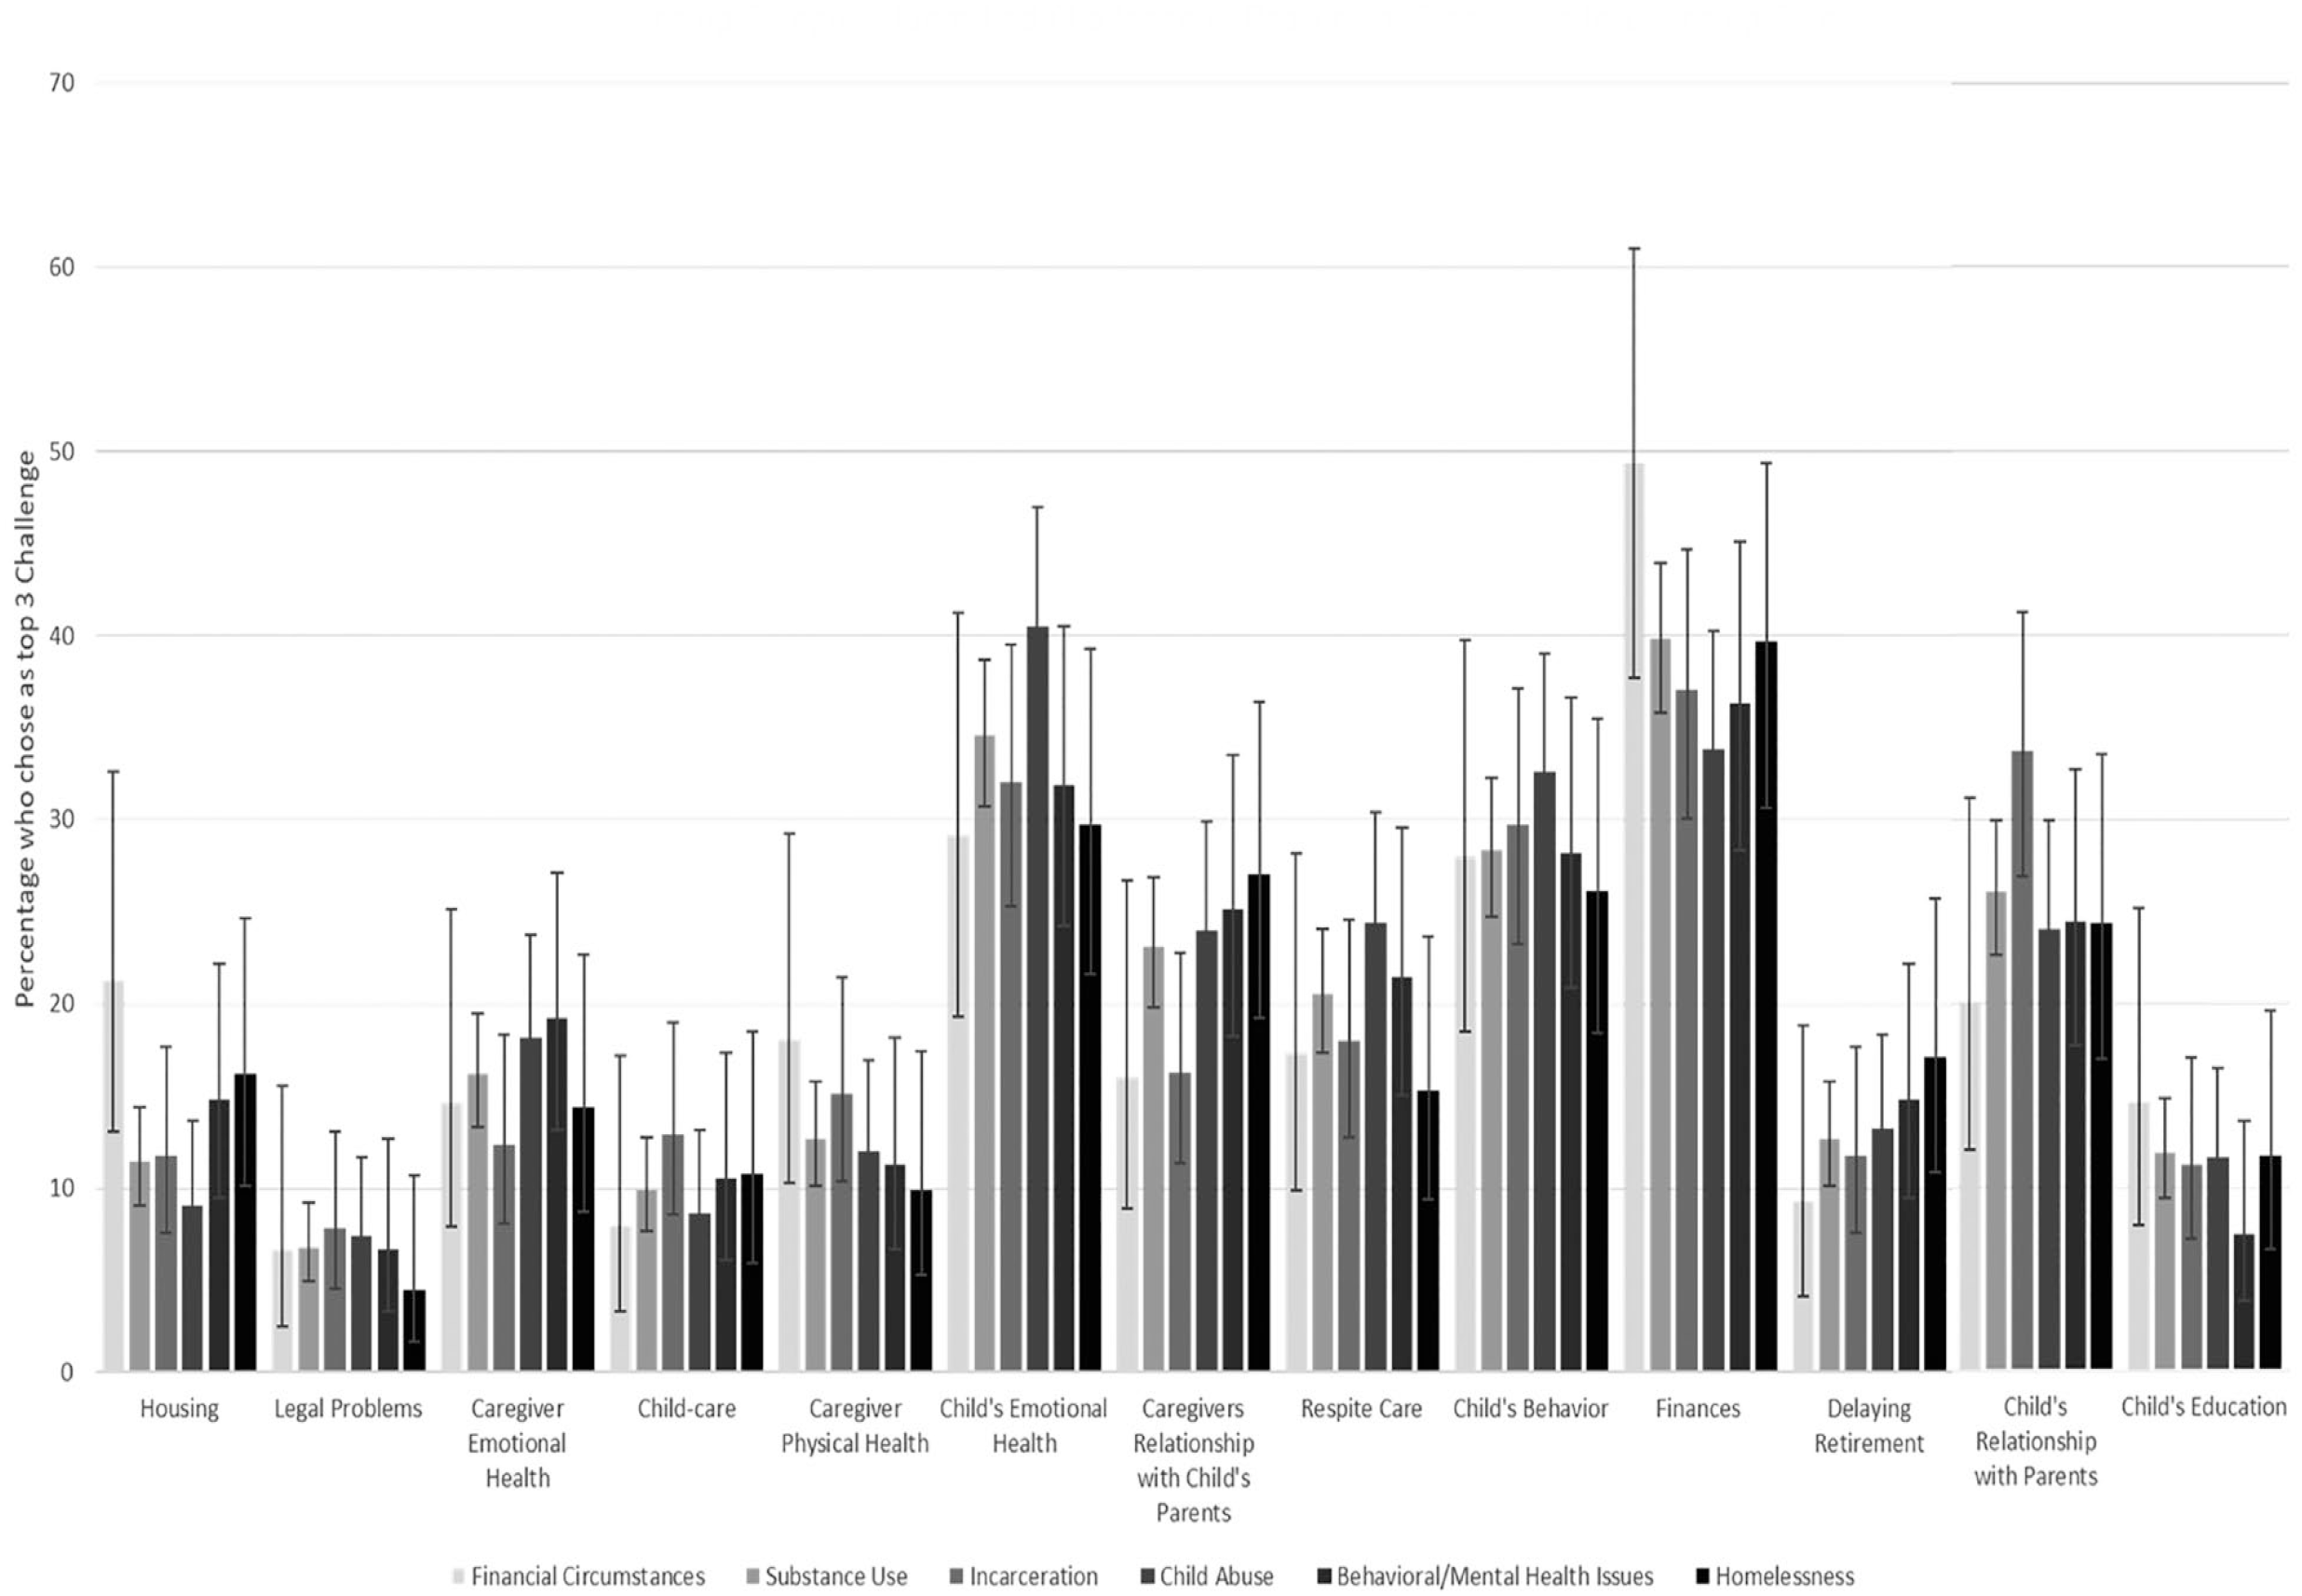
Kinship Caregiver Identified Challenge Versus Reason for Placement Into Kinship Care.
Thirty-four percent of the caregivers caring for children who were placed due to bio-parent incarceration identified the child’s relationship with parents as a top three challenge. This was 10% higher than the average of the other five reasons for placement. Housing and financial challenges were most frequently reported as a top three challenge by caregivers who reported the reason for placement was due to financial reasons.
Discussion
Financial challenges as a top three need were a common theme throughout the study. Despite stratification by region and reason for the child’s placement into care, financial challenges and financial support as an unmet need are reported most frequently in the top three, with only a few exceptions. One of the only circumstances when financial challenges were identified less frequently was when stratifying by income. It was also identified less frequently when children were placed with kin for child abuse and neglect reasons and in Region 3, though these differences were not statistically significant.
It is not unexpected that financial challenges were more commonly reported for lower income thresholds. Challenges such as caregiver health and housing were also more commonly identified as statistically significant top three needs at lower income brackets. When we stratified using a higher income threshold, the trend for these basic needs for health, finances, and housing was still present for those caregivers making less than $60,000 a year. It may be that the national poverty index may not be reflective of poverty in Washington State, where the cost of living is higher than average in the United States (U.S. Department of Health & Human Services, 2020).
At higher incomes, behavioral health challenges, respite care needs, and counseling services needs were reported at significantly higher rates than in lower income brackets. Those making greater than $60,000 reported a child’s emotional health, child’s behavior, caregiver’s mental health, and relationship with bio-parent as challenges more frequently than financial challenges. This is consistent with Maslow’s hierarchy of needs (Maslow, 1943). Maslow proposed that individuals will prioritize certain needs above others. These were called “basic needs” which included physical and safety needs (Maslow, 1943; (see Figure 4). Recent adaptations of this model have suggested an overlapping model, where the distinct tiers suggested by Maslow in 1943 aren’t distinct but overlap (Chen, 2021; see Figure 5). These models are still used to study how individuals prioritize certain needs over others (Hale et al., 2019; Lonn & Dantzler, 2017).
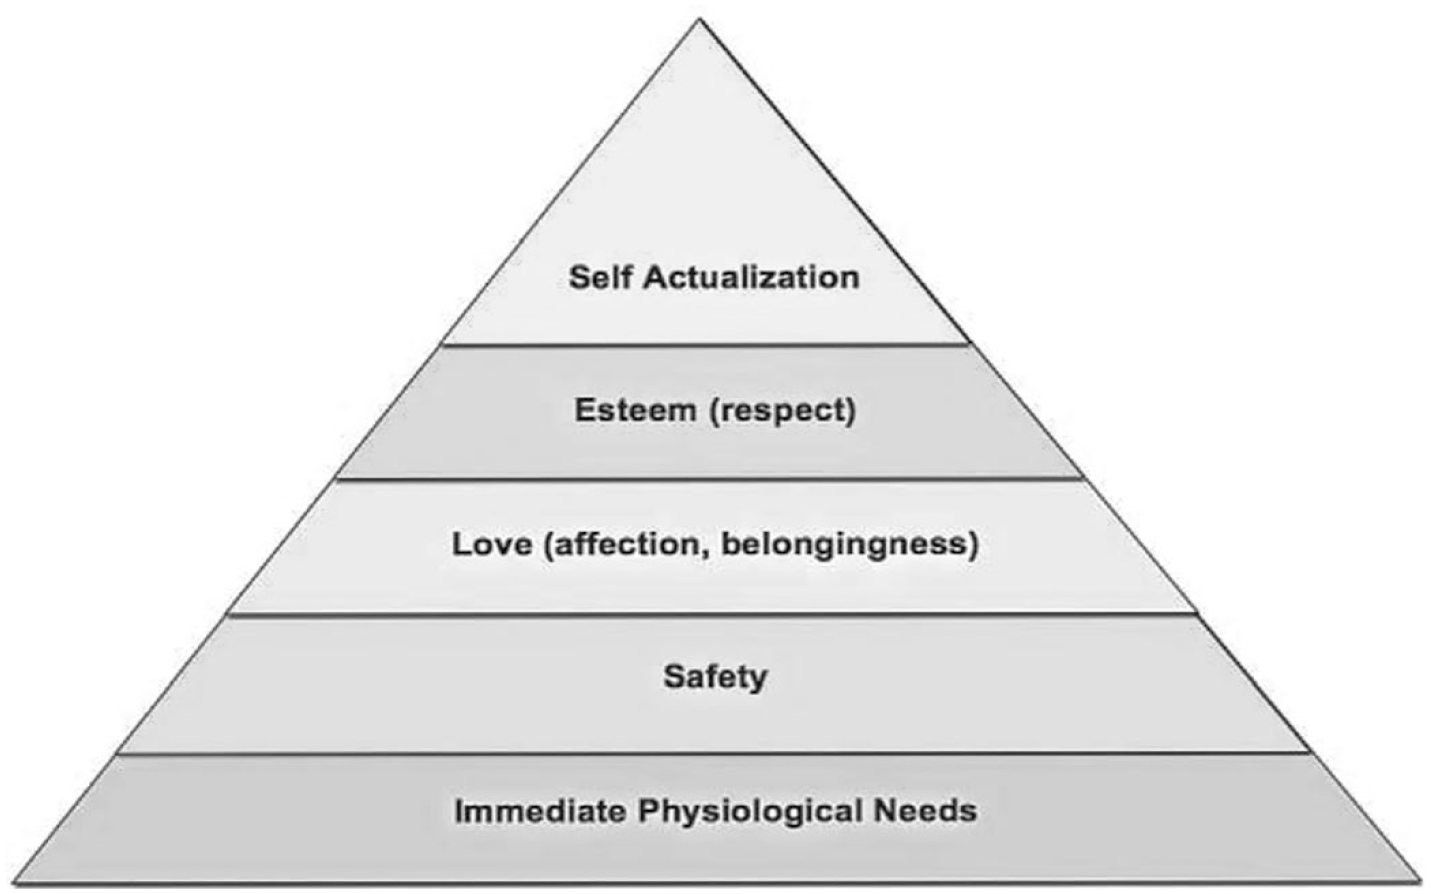
Maslow’s Classic Hierarchy of Needs.
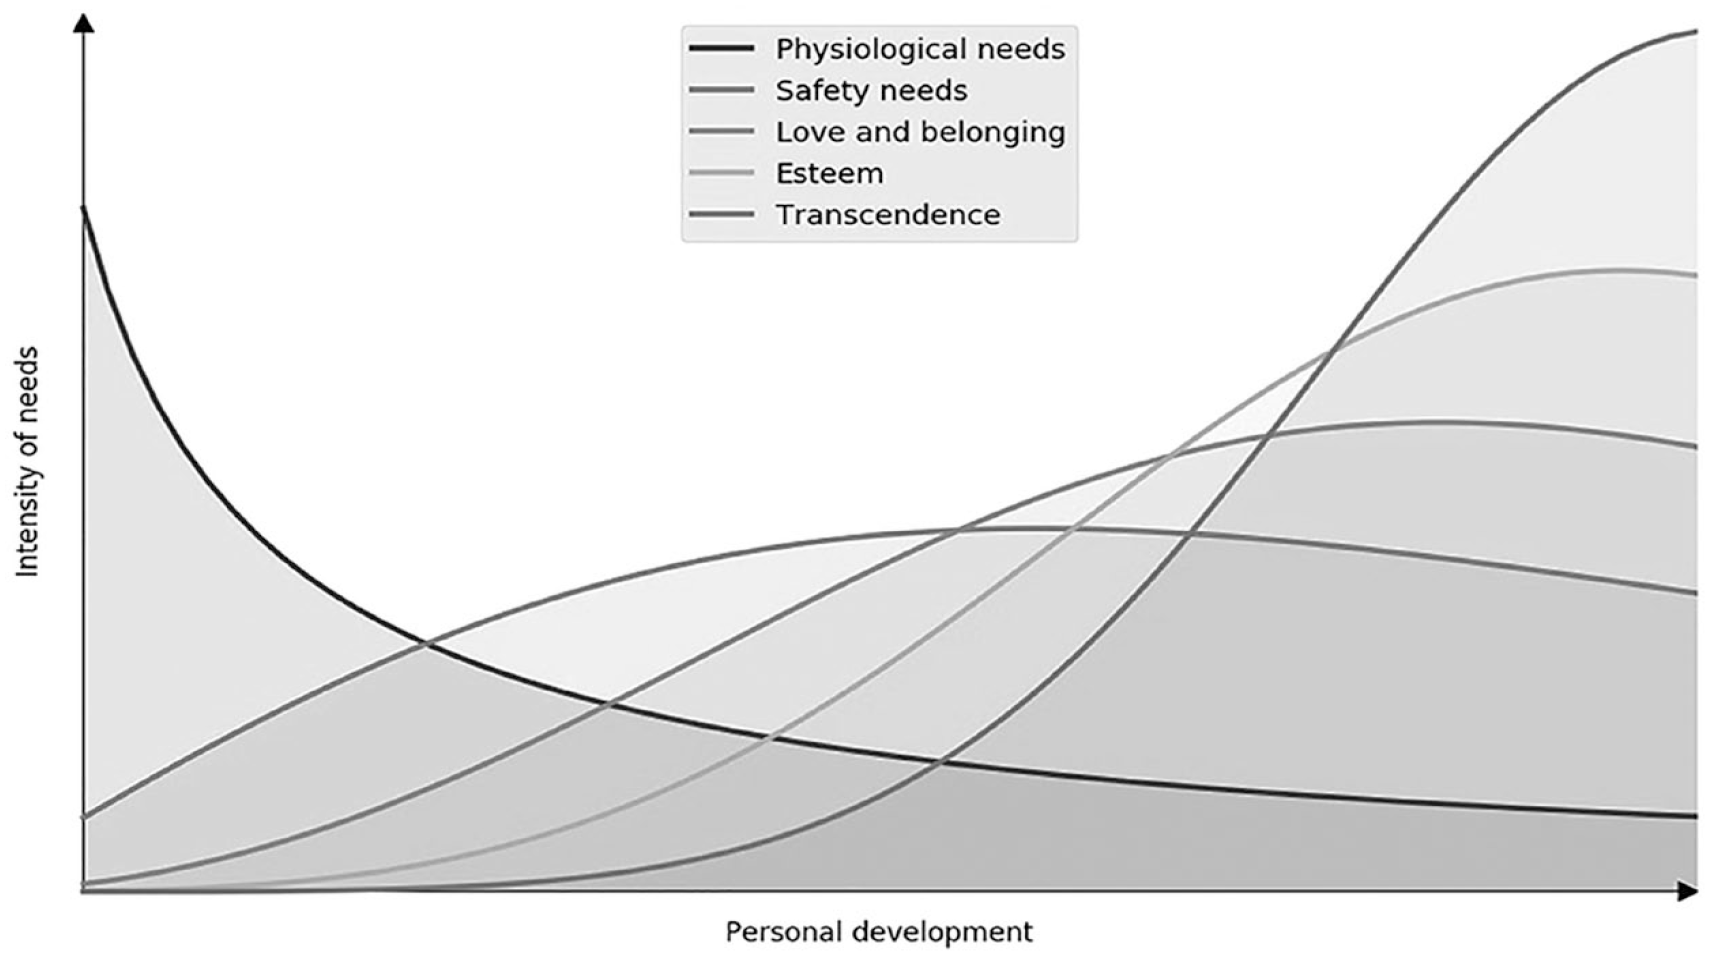
A Dynamic Depiction of Maslow’s Hierarchy as Overlapping Waves of Needs.
Recently adapted frameworks suggest that individuals may have higher-order needs even if basic needs are not met (Hale et al., 2019). It’s likely that those who live within lower income brackets (<$60,000) may also have needs for mental health, respite care, and retirement, but when faced with only three choices, they attend to basic needs first. When physical and safety needs such as housing, finances, and health are met, caregivers may prioritize higher-level needs such as mental health and strengthening social relationships (Hale et al., 2019). This is what we found for those living in high-income brackets (>$60,000 annual income) in our study, who often choose child behavioral health, caregiver mental health, child’s relationship with bio-parent, and caregivers’ relationship with bio-parent as the most common reported challenges.
Kinship caregivers caring for children placed for concerns of child abuse and neglect also reported a child’s behavioral and emotional health more frequently as a top three need. It is known that abuse and neglect have a significant impact on a child’s short-term and long-term mental health (Jackson et al., 2015; Merrick et al., 2017). Mental and behavioral health services are limited and often difficult to access (Whitney & Peterson, 2019). In cases of child abuse and neglect, service referral and coverage end when a welfare case is closed. These results call for the need to continue providing support for children who have a history of child abuse and neglect and improve access to mental and behavioral health services.
It is not unexpected that a child’s relationship with their parent was reported more frequently as a challenge for those children placed due to parental incarceration. Parental incarceration has been shown to have an impact on child well-being and development. Studies have found that efforts to maintain a strong relationship between the incarcerated parent and child can mediate some of these negative outcomes (Herreros-Fraile et al., 2012). It is therefore important to address the barriers that children may face when connecting with incarcerated parents. It is also not unexpected that housing and financial challenges were reported more frequently when a child was placed for financial reasons. This speaks to issues of intergenerational poverty that lead to familial disruptions and hardships.
Region 4, which includes the Seattle metro area, has the highest cost of living in Washington State, especially when it comes to housing (Eckart, 2020). It is therefore unsurprising that caregivers from Region 4 reported housing challenges more frequently than caregivers from other regions. It is also not unexpected that financial support was identified most frequently as an unmet need by caregivers in Region 4.
A somewhat unexpected result for Region 4 was that it had the highest percentage of caregivers reporting child care and transportation as a top three need more frequently than other regions. Region 4 represents King County, which is a primarily urban region that includes Seattle. Caregivers from KCOC proposed that this may be due to limited transportation and childcare services outside urban areas (Seattle). They also suggested that it may be difficult to use public transportation with young children and that there are higher costs of having a car in urban areas. In addition, public transportation and child care in King County are very expensive in comparison to other countries (The Annie E. Casey Foundation, 2023; U.S. Department of Transportation, 2021).
Recreational activities for children were commonly identified as a top three unmet need across all regions, all reasons for placement, and all incomes. Region 3 had the highest percentage of respondents who reported a need for recreational activities for their children. KCOC members from Region 3 reported that there are limited activities because it’s a predominantly rural area. KCOC members suggested that it can be burdensome to access recreational activities in rural areas as they may be far from home and require transportation. Recreational activities were reported more frequently in lower income brackets and for more rural regions (1, 2, 3, and 6). This demonstrates the impacts of both income and location on access to recreational activities for children.
Limitations
This study relied on self-reporting surveys distributed by several agencies across the state of Washington. This sample may not reflect the racial demographics of kinship caregivers in Washington State nor be generalizable to all kinship caregiver populations outside of Washington State. Our sample was predominantly white (80%) and grandparents (71%). Based on Washington State census data from 2020, 57% of grandparents caring for children <18 years of age were white. This discrepancy in race for our population may be due to who had access to and responded to the mailers and surveys. Future study design can improve survey distribution and completion and assess barriers for kinship caregivers of color.
There are currently no studies that look at the racial make-up of the formal and informal kinship caregiver population outside of grandparent caregivers. Future studies can be done to better assess the make-up of the kinship caregiver population to assess whether this study population accurately reflects their demographics.
The COVID-19 pandemic also introduced new challenges and needs. This survey was distributed between December 2019 and April 2020. Some respondents responded prior to the initiation of the lockdown and others after. Needs and challenges may have changed following this significant event. Further study would need to be conducted to investigate the differences in challenges and unmet needs reported by survey respondents before and after the initiation of lockdown.
The design of this study allowed caregivers to choose only three challenges and three needs. Responses cannot accurately demonstrate the number of needs these caregivers have. It is possible that caregivers might have chosen more than three challenges and unmet needs had they had the opportunity for unlimited choices. Future studies could use different techniques to identify and rank needs within this unique population.
Implications for Practice
Overall, this study re-demonstrates the need for kinship caregiver supportive services in Washington State. Specific evaluations were done based on region, reason for placement, and income to better meet the service needs of the kinship community. Basic financial support, housing services, and recreational activities were identified frequently as the top three unmet needs, especially for those in lower income brackets. This speaks to the need to invest in these services for kinship caregivers across the state.
Specific regions such as Region 4 can invest in resources that may alleviate barriers to accessing housing, child care, and transportation services for kinship families. In addition, regions with higher needs for mental health services such as Regions 2 and 3 can help link kinship caregivers to appropriate therapies and advocate for the expansion of mental health services in their region. Those regions whose caregivers are struggling to find respite care and recreational activities, can investigate barriers, and improve access to those services. These regional differences suggest that states may be able to better target needs by studying regional or county differences to improve the allocation of resources.
Differences based on income can also improve the allocation of resources and benefits. Our data suggests that income requirements to apply for benefits may need to be modified to improve access for those who may still be struggling but unable to qualify for services. Meeting physical and safety needs as described by Maslow’s hierarchy of needs can then provide families the opportunity to attend to higher needs such as mental health and relationship with bio-parents.
Further studies to analyze the impact of the COVID-19 pandemic can be done to see if challenges and needs have shifted. Improved survey techniques can be developed to identify ongoing needs, response rates, and diversity. Ongoing investigations can be undertaken to identify shifting needs as policy changes improve access to services for kinship caregivers.
Footnotes
Acknowledgements
The authors would like to acknowledge UW biostatistician Michael Nash for his help with the statistical analysis.
Disposition editor: Cristina Mogro-Wilson
Declaration of Conflicting Interests
The author(s) declared the following potential conflicts of interest with respect to the research, authorship, and/or publication of this article: Drs. Schlatter and Brown have provided medical legal consultation and testimony.
Funding
The author(s) disclosed receipt of the following financial support for the research, authorship, and/or publication of this article: This study was funded by a U.S. Department of Health and Human Services Grant (ACYF-CB-PI-18-05) to fund developing, enhancing, or evaluating kinship navigator programs.
Ethical Considerations
This study was approved by Washington State IRB.