
Abstract
The U.S. Department of Education’s Office of Special Education Programs collects data on how states implement the Individuals with Disabilities Education Act through the mandated State Performance Plan/Annual Performance Report (SPP/APR). Some indicators in the SPP/APR require state educational agencies (SEAs) to report data by race and ethnicity. These state-level reports consistently show that students of color with disabilities spend the most time in separate educational settings such as resource rooms and special day classes. Despite the racial and ethnic discrepancies in these data, SEAs do not report educational environments for children with disabilities by race and ethnicity at the local level. As a result, the public can only see racialized patterns in educational environments at the state level, not within local educational agencies. Race and ethnicity are important factors in addressing educational inequities. This article describes current special education data reporting requirements related to educational environments and offers policy, practice, and research implications for reporting race and ethnicity with these data.
Keywords
The federal Individuals with Disabilities Education Act (IDEA) governs the special education of children and young adults with disabilities in the United States. State educational agencies (SEAs) must report special education performance and compliance data to the U.S. Department of Education’s (U.S. DOE’s) Office of Special Education Programs (OSEP) through the State Performance Plan/Annual Performance Report (SPP/APR). The OSEP uses these data to monitor how states are implementing the IDEA. Individuals with Disabilities Education Act data is an important tool for realizing educational equity and social justice (Knight & DeMatthews, 2020). Scholars use the data from the SPP/APR to study racial and ethnic disparities in special education outcomes and investigate the reasons behind these differences (e.g., Grindal et al., 2019; Oswald et al., 1999). Recently, scholars have suggested ways to improve the usefulness of IDEA data so practitioners can use the data to positively influence practice (Albrecht et al., 2012; Knight & DeMatthews, 2020; Kramarczuk Voulgarides et al., 2017). This literature suggests that the next IDEA reauthorization should include updates to IDEA data reporting requirements.
As Congress prepares to reauthorize the IDEA (U.S. Department of Education [U.S. DOE], 2019), researchers and academics are positioned to highlight gaps in current policy and offer ways to improve the law. One area of interest is the accuracy, usefulness, and availability of the data that special education data systems collect. Race and ethnicity are particularly important variables in special education datasets because special education data are not “race neutral” (Cavendish et al., 2014, p. 32). Rather, a child’s race and ethnicity affect her experience with special education policies and practices, and these are salient factors when interpreting special education data or intervening in patterns of inequity in schools.
The SPP/APR state-level data consistently show that students of color, specifically Black or African American, Native Hawaiian or Other Pacific Islander, Asian, and Hispanic or Latino/a students with disabilities, spend the most time in separate educational settings (Office of Special Education and Rehabilitative Services [OSERS], 2021). Despite the racial and ethnic discrepancies in these data, SEAs do not report educational environments by race and ethnicity for children with disabilities at the local level. As a result, the public can only observe racialized patterns in educational environments at the state level, not within local educational agencies. This article describes the current special education data reporting requirements related to educational environments and discusses the implications of reporting race and ethnicity in these data for policy, practice, and research. Ultimately, this article may contribute to the broader discussion about data reporting during IDEA reauthorization.
Literature Review
Concerns about racial and ethnic inequity in special education date back more than half a century, to before the advent of federal special education data systems (e.g., Dunn, 1968). Since Congress reauthorized the IDEA in 1997, special education data systems have reported several indicators of local educational agencies’ compliance and student outcomes by race and ethnicity, allowing researchers to explore the intersection of race, ethnicity, and disability in special education. Scholars and practitioners have used these data to further highlight inequity in special education, particularly related to racial disproportionality. Racial disproportionality occurs when “students’ representation in special education programs or specific special education categories exceeds their proportional enrollment in a school’s general population” (Blanchett, 2006, p. 24).
In recent discussions of racial disproportionality, a controversial issue (e.g., Blanchett & Shealey, 2016) is whether it results from racial biases in policies and practices or reflects the impacts of poverty on student academic performance and behavior. Early studies found that district characteristics (e.g., teacher race) and practices (e.g., special education referral processes) could predict the proportion of students of color identified with disabilities within those districts (Coutinho et al., 2002; Oswald et al., 1999). The authors of these studies took the perspective that racial and ethnic disproportionality in special education results from institutionalized inequity and systemic bias that shapes local practices. Many agree these practices contribute to the likelihood that students of color are identified as disabled even when controlling for socioeconomic factors (Coutinho et al., 2002; Fish, 2019; Guarino et al., 2010; Hibel et al., 2010; Kincaid & Sullivan, 2017; Sullivan & Artiles, 2011; Sullivan & Bal, 2013). By contrast, some researchers argue that socioeconomic factors contribute to poor academic performance and behavior and that these individual characteristics cause teachers to refer students of color for special education (Hibel et al., 2010; Mann et al., 2007; Morgan et al., 2015, 2017a, 2017b). Because researchers and academics on both sides of the issue agree that special education data reflect racial disproportionality, the debate is whether racial biases play out in special education policies and practices or whether students of color come to schools with greater needs, resulting in higher rates of special education among students in those populations.
This debate implies that the data employed in studies of racial disproportionality influence how researchers perceive and explain the issue (Ahram et al., 2021). One group uses district-level data that reflect school practices, while the other uses data that reflect student characteristics. It is important to emphasize that the type of data employed in these studies may influence the research because many scholars have theorized about the challenges of collecting useful and accurate data at the intersection of race, ethnicity, and disability in special education.
Concerns about federal data reporting include that it reinforces erroneous assumptions about biological differences associated with race or disability (Artiles, 2011), reflects inconsistent measures across states (Albrecht et al., 2012; Kramarczuk Voulgarides et al., 2017), and fails to address underlying racial biases and institutionalized racism (Artiles, 2011; Kramarczuk Voulgarides & Tefera, 2017; McCall & Skrtic, 2009). In recent years, scholars have provided recommendations to enhance the usefulness of IDEA data for local practitioners, so they may leverage IDEA data to improve local practices. These recommendations include abandoning “colorblind” IDEA policies that ignore or require only passing attention to race and racism (Kramarczuk Voulgarides et al., 2017, p. 164), embedding quantitative data analysis into teacher and researcher preparation programs to support using IDEA data for social justice (Knight & DeMatthews, 2020), and publicly posting racial disproportionality in local educational agencies (Albrecht et al., 2012).
Recent recommendations to improve IDEA data illuminate the tension between capturing the sociopolitical context of student experience and meeting the specific data requirements outlined in federal law. This tension also reflects the importance of policymakers’ choices related to the data collected in special education data systems. Policymakers are tasked to consider how they can improve the overall accuracy and utility of federal data systems to meet the requirements of the law and ensure educational equity. With this duty in mind, the article now turns to educational environment data to consider why the OSEP might want to require SEAs to report these data by race and ethnicity.
Overview of Current IDEA Data Related to Educational Environments
The IDEA requires that children with disabilities receive free appropriate public education (34 CFR §300.101) alongside children without disabilities (34 CFR §300.114). The latter requirement, referred to as the least restrictive environment requirement, requires public agencies to educate children with disabilities in general education settings to the maximum extent appropriate. The state-level data that the OSEP gathers related to the educational environment (e.g., classroom setting) where a child with a disability receives special education and related services are relevant to conversations about equity in special education because they reflect racial disproportionality. State to state, Black or African American, Native Hawaiian or Other Pacific Islander, Asian, and Hispanic or Latino/a students with disabilities are disproportionately educated in settings outside of the general education class, such as in resource rooms and special day classes, while White students with disabilities are disproportionately educated in general education settings (Grindal et al., 2019; OSERS, 2021). These state-level patterns also seem to hold true at the local level (e.g., Cooc, 2022; Skiba et al., 2006), but unfortunately, local data on educational environments broken down by race and ethnicity are not available through federal data systems.
State and local racialized patterns in educational environments data indicate that some students with a disability, such as those who are Black, have qualitatively different experiences at school on average. One key difference is that students of color with disabilities spend less time in general education settings on average than their White peers. While it is possible that time spent in general education is related to a child’s academic performance or behavior, differential access to general education is nevertheless concerning because of its relationship to educational and racial equity (Cavendish et al., 2014; Marx et al., 2014; Smith & Kozleski, 2005). Students with disabilities who spend more time in segregated educational settings experience less instructional time (Helmstetter et al., 1998), are less engaged, and spend less time being taught by credentialed teachers (Hunt & Goetz, 1997). These differences in educational opportunities at the local level may ultimately contribute to disparate educational and social outcomes, such as higher graduation rates for students with disabilities who are White when compared with students with disabilities who are Black or African American (OSERS, 2021). There are two specific data collections described below that are relevant to understanding the current state of transparency in reporting educational environment data by race and ethnicity for students with disabilities.
SPP/APR Indicator B5
In a child’s individualized education program (IEP), practitioners must specify the educational environment where a child with a disability receives special education and related services. An IEP is a legally binding document that outlines how special education and related services will meet a child’s educational needs. The local educational agency (which can be a school district, charter school, or educational services agency) collects data from the IEPs of all children it serves under the IDEA and reports the percentage of time each child spends in general education to its SEA. The SEA then reports educational environment data for all its local educational agencies to the OSEP through Indicator B5 (Education Environments [School Age]) on its SPP/APR.
The OSEP uses the SPP/APR data to evaluate how SEAs implement the IDEA requirements through quantitative indicators that measure child and family outcomes and compliance with IDEA regulations. SPP/APR data are publicly available, thus informing the public about how state and local educational agencies implement the IDEA requirements. SPP/APR Indicator B5 provides information to the OSEP about the educational environments where school-age students with a disability receive special education and related services. Specifically, the percentage of all school-age students with a disability served: (a) inside the general education class 80% or more of the school day, (b) inside the general education class less than 40% of the day, or (c) in separate schools/residential facilities/home/hospital placements. As mentioned earlier, Indicator B5 data reflect racial and ethnic disproportionality nationally; however, SEAs do not report Indicator B5 data by race or ethnicity at the local educational agency level.
It is possible for special education administrators at a local educational agency to conduct their own data analyses using race, ethnicity, and percentages of time spent in general education for the children they serve under the IDEA. If special education administrators choose to conduct these data analyses locally, they are not required to share the results with practitioners or the public. Thus, without a reporting requirement, the public can only observe state-level racialized patterns in educational environments and cannot observe data for any specific local educational agency by race or ethnicity.
Significant Disproportionality and the Coordinated Early Intervening Services and LEA Maintenance of Effort Data Collection
Separate from the SPP/APR, IDEA regulations on disproportionality (34 CFR §300.646) mandate that SEAs annually calculate a risk ratio to assess whether a local educational agency has significant racial or ethnic disproportionality, including in its placement of students with disabilities in particular educational environments. These are fiscal data because they impact the amount of federal IDEA funds that local educational agencies spend on Coordinated Early Intervening Services (CEIS). They are separate from the SPP/APR data, which evaluates the programmatic implementation of the IDEA. CEIS and Local Educational Agency (LEA) Maintenance of Effort (MOE) data do not solve the concern raised about Indicator B5 because SEAs do not report CEIS and LEA MOE data publicly. Rather, SEAs collect and monitor these data, and local educational agencies that exceed the risk threshold because of inappropriate practices as determined by the state must meet a set of requirements to address the disproportionality. SEAs report which local educational agencies in the state were required to set aside funds for CEIS and the reason for the significant disproportionality to the U.S. DOE as part of the CEIS and LEA MOE data collection. LEA MOE data are not public; therefore, local practitioners and community members cannot access these data to observe racialized patterns in educational environments at the local level.
An Alternative SPP/APR Indicator B5
In short, existing data collections about the educational environments of students with disabilities do not report local educational environments data by race or ethnicity. As a result, practitioners and the public cannot access data to examine the extent of differential educational environments outcomes for students of color in their school communities. The OSEP may change the SPP/APR data reporting requirements. For instance, the OSEP could require that SEAs report Indicator B5 data for each local educational agency by race and ethnicity rather than in racial aggregate. An example adjustment to the SPP/APR Indicator B5 might read, Percent of children with IEPs, age 5 and enrolled in kindergarten, and ages 6–21 served (A) inside regular class 80 percent or more of day; (B) inside regular class less than 40 percent of day; (C) in separate schools, residential facilities, or homebound/hospital placements by race/ethnicity.
This change would require that SEAs report Indicator B5 data for local educational agencies by race and ethnicity rather than in racial aggregate on the SPP/APR. These data would then be publicly available through the SPP/APR reporting process, allowing practitioners, policymakers, researchers, and communities to observe the performance of local educational agencies related to racial disproportionality in educational environments. The article now turns to policy, practice, and research implications for the proposed change.
Implications for Federal and State Policies
The proposed change would align Indicator B5 with several other SPP/APR indicators. Table 1 illustrates that SPP/APR indicators vary by topic and whether the indicator reports race and ethnicity. The CEIS and LEA MOE data, which report race and ethnicity, are also shown for reference but are not publicly reported.
Comparison of the SPP/APR Indicators and the CEIS/LEA MOE Data Collection.
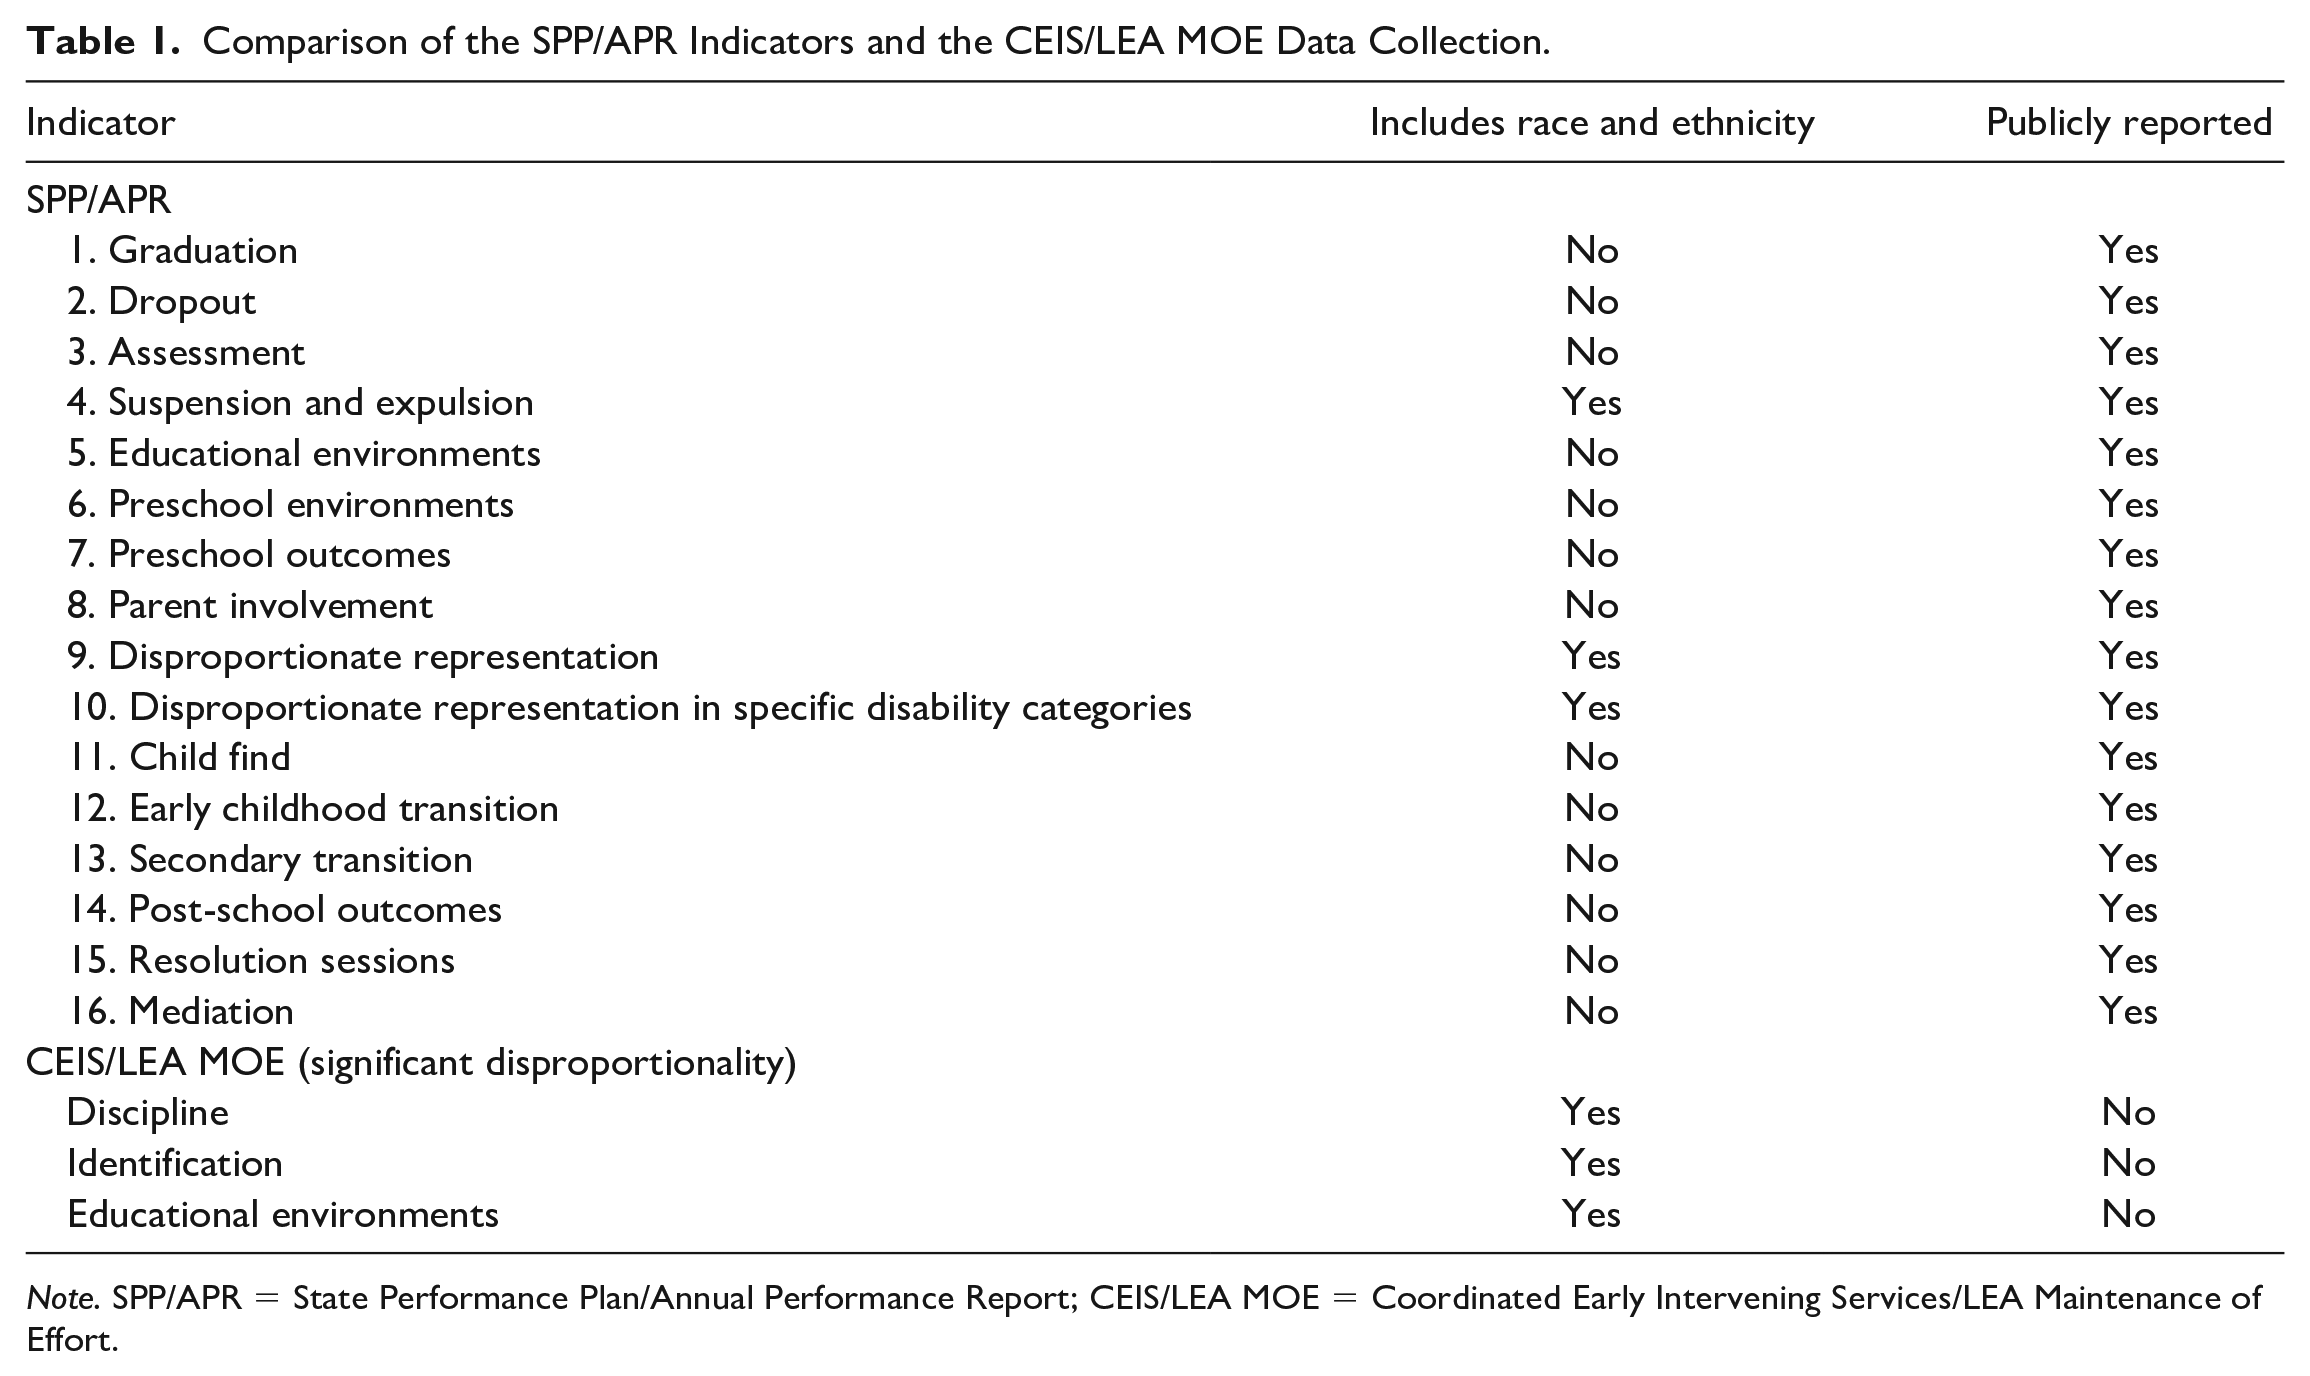
Note. SPP/APR = State Performance Plan/Annual Performance Report; CEIS/LEA MOE = Coordinated Early Intervening Services/LEA Maintenance of Effort.
Indicators B4A/B, B9, and B10 show the public whether a local educational agency has a significant discrepancy in suspension and expulsion rates by race and ethnicity (B4), disproportionate representation of racial and ethnic groups in special education due to inappropriate identification (B9), and disproportionate representation of racial and ethnic groups in specific disability categories due to inappropriate identification (B10). Because of these indicators, for example, the public can see to what extent a school district or charter school identifies Black students for special education compared with Hispanic or White students (Indicator B9) provided the state determines that the disproportionality is a result of inappropriate identification. These three SPP/APR indicators set a precedent for reporting race and ethnicity in the SPP/APR.
While additional transparency related to race and ethnicity may serve to improve local practice and facilitate public accountability, federal policymakers must also consider the financial and time burden of additional data reporting. The U.S. DOE is required, under the Paperwork Reduction Act of 1995 (44 U.S.C. 3506(c)(2)(A)), to provide the public and federal agencies with an opportunity to comment on proposed, revised, and continuing data collections. Through this process, the U.S. DOE can evaluate the impact of new reporting requirements. It is possible that SEAs may not experience much additional burden with the proposed change, as they already collect racially and ethnically disaggregated data for other purposes. For example, they use these data to determine if local educational agencies have significant disproportionality (34 CFR §300.646).
Implications for Local Practices
Although IDEA data reporting may seem disconnected from the meetings in which IEP teams decide a child’s educational environment, research suggests that state-level data collection requirements can influence the programmatic decisions made by special education practitioners and administrators (DeMatthews & Knight, 2019). If practitioners are provided with educational environment data broken down by race and ethnicity, it could encourage them to have more open discussions about how race and ethnicity intersect with disability, potentially leading to changes in educational practices (Ahram et al., 2011; Skiba et al., 2006). On the one hand, there could be immense benefit from these discussions if they lead to more children of color engaging in general education. Longitudinal studies find that access to general education has cumulative positive effects on grades and standardized assessments, as well as increased attendance and reduced behavior referrals for students with disabilities (e.g., Cole et al., 2021; Doutre et al., 2021; Rea et al., 2002; Sailor et al., 2018). On the other hand, if these data incentivize increasing the quantity of time spent in general education classrooms without improving the quality of that time, there may be little or no positive effect on student outcomes. Some examples of quality indicators are meaningful access to the curriculum and social activities (Koegel et al., 2012) and increased collaboration between general and special education teachers (Hoppey & Mickelson, 2017). The proposed data reporting might allow practitioners to monitor progress over time and adjust practices accordingly.
Implications for Researchers and Academics
Researchers and academics are positioned to help lawmakers understand the effects of IDEA regulations on student experiences and outcomes and suggest ways to make these data more accurate and useful for practitioners and community members. Notably, requiring SEAs to publicly report local educational environments data by race and ethnicity would not solve the data quality concerns common in education including the failure of data to accurately reflect the complexity of students’ lives and identities (Viano & Baker, 2020) or address underlying racial biases (Artiles, 2011; Kramarczuk Voulgarides & Tefera, 2017; McCall & Skrtic, 2009). Researchers might attend to these concerns by considering how complex historical and societal factors at the intersection of race, ethnicity, and disability, such as disparate access to resources, impact their research findings. Additionally, scholars interested in improving data quality and use in special education might attend to the growing research base that offers frameworks for producing equity in special education placement practices (e.g., Sullivan et al., 2015), engaging practitioners in case studies using IDEA data by race and ethnicity (e.g., Ahram et al., 2011; Thorius, 2019) and seeking community input on specific adjustments to local educational agency and SEA data reporting (e.g., NeMoyer et al., 2020).
Conclusion
Since the 1997 reauthorization of the IDEA, federal lawmakers have emphasized the importance of addressing racial and ethnic disparities in special education to improve educational outcomes for students of color. While racial and ethnic disproportionality is a complex problem, SPP/APR Indicator B5 data that attend to race and ethnicity may help guide local responses to differential outcomes in educational environments. With the upcoming reauthorization of the IDEA, there is an important opportunity to reflect on the role of special education data in promoting educational equity and take steps to improve federal data systems. This article describes one modification that might improve the usefulness of special education data for practitioners, policymakers, and researchers.
Footnotes
Declaration of Conflicting Interests
The author(s) declared no potential conflicts of interest with respect to the research, authorship, and/or publication of this article.
Funding
The author(s) received no financial support for the research, authorship, and/or publication of this article.