
Abstract
The purpose of this study was to evaluate the impact of the U.S. Workforce Innovation and Opportunity Act (WIOA) on outcomes (competitive employment rates and median earnings) for adult and youth vocational rehabilitation consumers with blindness or low vision (B/LV) and to determine whether impacts differed by agency type. We utilized RSA-911 data to create two agency-level longitudinal datasets, one for youth and one for adults, with 6-year pre-WIOA and 3-year post-WIOA periods. Data were analyzed using discontinuous growth modeling to assess longitudinal changes in agency-level outcomes through the inclusion of variables representing WIOA and subsequent change in response to WIOA. After WIOA, both youth and adult agency-level competitive employment rates decreased significantly for consumers with B/LV, with a larger impact on youth, and median earnings increased. Results document that the impact of WIOA on agencies varied widely. Separate agencies had a significant decrease in adult competitive employment rates for consumers with B/LV and a significant increase in median earnings compared with combined agencies. Overall, the influence of WIOA on B/LV consumer outcomes appears to be mixed at best, and the effect is surprisingly similar for youth and adults.
Individuals with blindness or low vision (B/LV) have historically experienced substantially lower employment rates and higher unemployment rates than the general population (McDonnall & Sui, 2019). Based on the most recent estimates from the American Community Survey, 46.2% of the working-age population of people with B/LV were employed, compared with 78.6% of people without disabilities (U.S. Census Bureau, 2020). In addition, more than twice as many people with B/LV were unemployed (8.5% compared with 4.1% for people without disabilities). These labor force statistics illustrate the challenge that people with B/LV experience with employment, likely associated with a myriad of identified barriers such as negative employer attitudes, lack of transportation, lack of adaptive skills, and inaccessible work environments or lack of needed accommodations (Crudden et al., 1998; McDonnall et al., 2013; Silverman et al., 2019; Steverson, 2020). Assistance with employment to address these barriers can be obtained via vocational rehabilitation (VR) services authorized under the Rehabilitation Act of 1973.
The Workforce Innovation and Opportunity Act of 2014 (WIOA), which includes the first reauthorization of the Rehabilitation Act since 1998, represented a significant policy shift in several areas for the state-federal VR system. It comprised a myriad of changes to the VR system; some of the substantial changes were: (a) an increased emphasis on services to youth with disabilities, including a requirement to set aside 15% of federal VR funds to provide five pre-employment transition services (pre-ETS) to students with disabilities; (b) an emphasis on competitive integrated employment (CIE) for all individuals served; (c) greater emphasis on employer engagement; and (d) increased collaboration among federal programs that support employment services (core programs). Furthermore, WIOA requires agencies to provide the five key pre-ETS to students with disabilities who are current consumers and to students with disabilities who have not applied for VR services. Associated with the renewed emphasis on CIE, WIOA eliminated the homemaker closure, as all consumers served by VR agencies must have an employment goal. In addition to these changes in foci, the Act also mandated common performance measures for all WIOA core programs, resulting in a substantial change for VR agencies in terms of reporting requirements and how their effectiveness is evaluated.
While these changes were expected to have a major impact on all VR agencies and, to some extent, their consumers, the changes could potentially have a greater impact on consumers with B/LV, especially those served by separate agencies (agencies that serve only individuals with B/LV). The elimination of the homemaker closure is particularly relevant for this population as a substantially higher proportion of B/LV consumers were closed as homemakers than consumers with other disabilities, historically and at the time of the passage of WIOA (Capella-McDonnall, 2006; WIOA Notice of Proposed Rulemaking, 2015). Some agencies have traditionally closed a large percentage of their consumers with B/LV each year as homemakers (WIOA Notice of Proposed Rulemaking, 2015). The 15% set aside for pre-ETS also may be particularly difficult for separate agencies as B/LV is associated with aging; a large majority of this population is older, and the prevalence of B/LV in youth is very small (Erickson et al., 2021). The requirement essentially compels separate VR agencies to allocate 15% of their budget to provide a few specific services to a small subset of the population they serve.
The limited research conducted to date regarding WIOA has predominantly focused on one or two specific aspects of the Act. Three studies addressed the implementation of new WIOA regulations, including customized employment provisions (Smith et al., 2017) and pre-ETS requirements (Miller et al., 2018; National Council on Disability, 2017). The National Council on Disability (2017) surveyed 25 VR agencies about their implementation of pre-ETS 2.5 years after WIOA was passed and documented several challenges to pre-ETS implementation experienced by VR agencies at that point, such as tracking service provision and separating allowable and unallowable costs. Miller and colleagues (2018) investigated pre-ETS implementation experiences of a subset of VR agencies through 2017 and identified strategies agencies used to meet four specific pre-ETS requirements, including making pre-ETS available to all students with disabilities and reserving at least 15% of funding for pre-ETS.
Two studies investigated VR agency staff’s perceptions of WIOA’s impact on consumer outcomes (McDonnall et al., 2018; Sherman et al., 2019). Through an online survey, Sherman and colleagues examined VR professionals’ perceptions about WIOA policy changes and how they may impact consumer outcomes, with particular emphasis on changes to VR counselors’ educational and certificate requirements. Vocational rehabilitation professionals reported that WIOA had a notable impact on service delivery and counseling effectiveness, which they reported ultimately had a negative impact on consumer outcomes. McDonnall and colleagues interviewed administrators of VR agencies that serve consumers with B/LV to explore their response to and the perceived impact of pre-ETS and the elimination of the homemaker closure. They found that many agencies were struggling with the pre-ETS 15% requirement, which had either resulted in reduced services to adults or concerns about future reductions in adult services. Additionally, separate agencies were experiencing more challenges with the pre-ETS requirement than combined agencies. About half of the administrators had a concern about the elimination of the homemaker closure, primarily about being unable to provide services to a group of people who need them to achieve independence.
Only one study was identified that utilized quantitative VR case service data to evaluate an aspect of WIOA. This study reported on the provision of pre-ETS to students with disabilities, utilizing the Rehabilitation Services Administration Case Service data (RSA-911) for Program Year (PY) 2017, which covered July 2017 through June 2018 (Honeycutt et al., 2019). Substantial variation across VR agencies in their provision of pre-ETS, including who received them and how agencies delivered them, was observed. Differences noted for separate agencies were that only 9% of their consumers received pre-ETS services (a much lower percentage than other agency types) and that almost all students receiving pre-ETS had applied for VR services, compared with less than half of the students receiving pre-ETS in general and combined agencies.
Considering the magnitude of the changes required by WIOA and their potential for a substantial effect on the VR system, evaluating changes in services and outcomes for VR consumers is essential. In a report of trends in VR consumers’ employment outcomes before and after WIOA implementation, the U.S. Department of Education (2020) provided aggregate VR case service data for consumers with all types of disabilities during federal fiscal years (FYs) 2010 through 2019. Interesting findings from this report include (a) the number of individuals applying for services decreased substantially over time, both before and after WIOA; (b) the percentage of applicants determined to be eligible for services decreased substantially since WIOA; (c) the employment rate for consumers at case closure decreased substantially in 2017 and continued to decrease in 2018 and 2019; (d) median wages were higher in 2017 to 2019 compared with previous years; and (e) more agencies had moved to an order of selection since the passage of WIOA. This report provided the most comprehensive quantitative data-based information about the impact of WIOA to date, yet only descriptive data were presented. RSA publishes WIOA annual reports for each state and a national report (available at https://rsa.ed.gov/wioa-resources/wioa-annual-reports). These reports provide data on the new performance measures but do not provide information by agency (in states with a separate and general agency) or by disability type.
Empirical evaluation of WIOA’s impact has been limited thus far; now, more than 6 years after the passage of the law and 4 years after the final regulations were published, data are available to evaluate the impact of WIOA. In the late fall of 2020, RSA released PY 2019 data to researchers, allowing for the evaluation of WIOA’s impact for three full PYs with a WIOA-revised RSA-911 data collection protocol. We were interested in empirically evaluating whether WIOA had an impact on the outcomes of adults and youth with B/LV who received VR services and had their cases closed. The purpose of this study was to examine the impact of the WIOA legislation on agency-level employment outcomes for adults and youth who are B/LV and determine whether impacts differed by type of agency. Our hypotheses were:
Method
Data Source and Samples
RSA-911, the individual-level administrative data collected from VR agencies that documents service provision and outcomes for participants, was utilized for this study. Prior to WIOA, these data were reported annually on the federal FY, from October to September, and included information about consumers whose cases were closed during that FY. In correspondence with WIOA legislation, starting on July 1, 2017, RSA-911 adopted a new case reporting paradigm that requires state VR agencies to provide quarterly data on all open cases, with evaluation occurring on the PY (July to June). We delineated pre-WIOA and post-WIOA periods for this study based on when the law was formally defined: The final rules for the VR program were published in 2016. We selected 2015 as the last pre-WIOA year, as this was prior to the establishment of the final WIOA rules, and most consumers closed in FY 2015 received services before the implementation of the Act. FY 2016 and part of FY 2017 (October 1, 2015 to June 30, 2017) was considered a transition period, and our post-WIOA period began with PY 2017. This long transition period was utilized due to (a) state agencies closing many existing open cases before the RSA-911 data reporting paradigm change, resulting in a large number of closures prior to July 1, 2017 (U.S. Department of Education, 2020) and (b) our desire to limit the number of consumers—as much as possible—who had cases closed in the post-WIOA period but received services before WIOA. We elected to utilize FY prior to WIOA and PY after WIOA as these are the annual periods on which VR agencies were evaluated during those time frames. Therefore, the pre-WIOA period extended from October 2009 to September 2015 and the post-WIOA period extended from July 2017 to June 2020.
This study utilized two agency-level samples comprised of (a) youth with B/LV as their primary disability (age 21 or younger at the time of application, to coincide with the maximum age at which pre-ETS services are applicable in most states) and (b) adults with B/LV as their primary disability (22 years of age or older at the time of application). Using RSA-911 data, we aggregated youth cases and adult cases, respectively, for each agency and each year, to compute outcome variables at the agency level. We constructed two longitudinal datasets with data for 51 state VR agencies over six pre-WIOA years and three post-WIOA years. The pre-WIOA years included FYs 2010–2015 (October 1, 2009, to September 30, 2015), and the post-WIOA years included PYs 2017-2019 (July 1, 2017, to June 30, 2020). Table 1 presents the mean number of youth and adult cases closed by all 51 agencies for each year and the analytic (agency) sample sizes for each outcome variable by year. In short, both youth and adult datasets included employment outcome information for each of the 51 agencies, and agencies had up to 9 data points over time. The 51 state VR agencies included combined agencies (those serving people with all types of disabilities including B/LV) and separate agencies (those serving only people with B/LV) across the 50 U.S. states and the District of Columbia. General agencies that primarily serve people with disabilities other than B/LV were not included in this study. We also excluded Kentucky’s PY 2018 and PY 2019 observations because Kentucky’s separate and general agencies consolidated into a combined agency during PY 2018 (in the middle of the post-WIOA period).
Number of Case Closures and Agency Sample Sizes by Year.
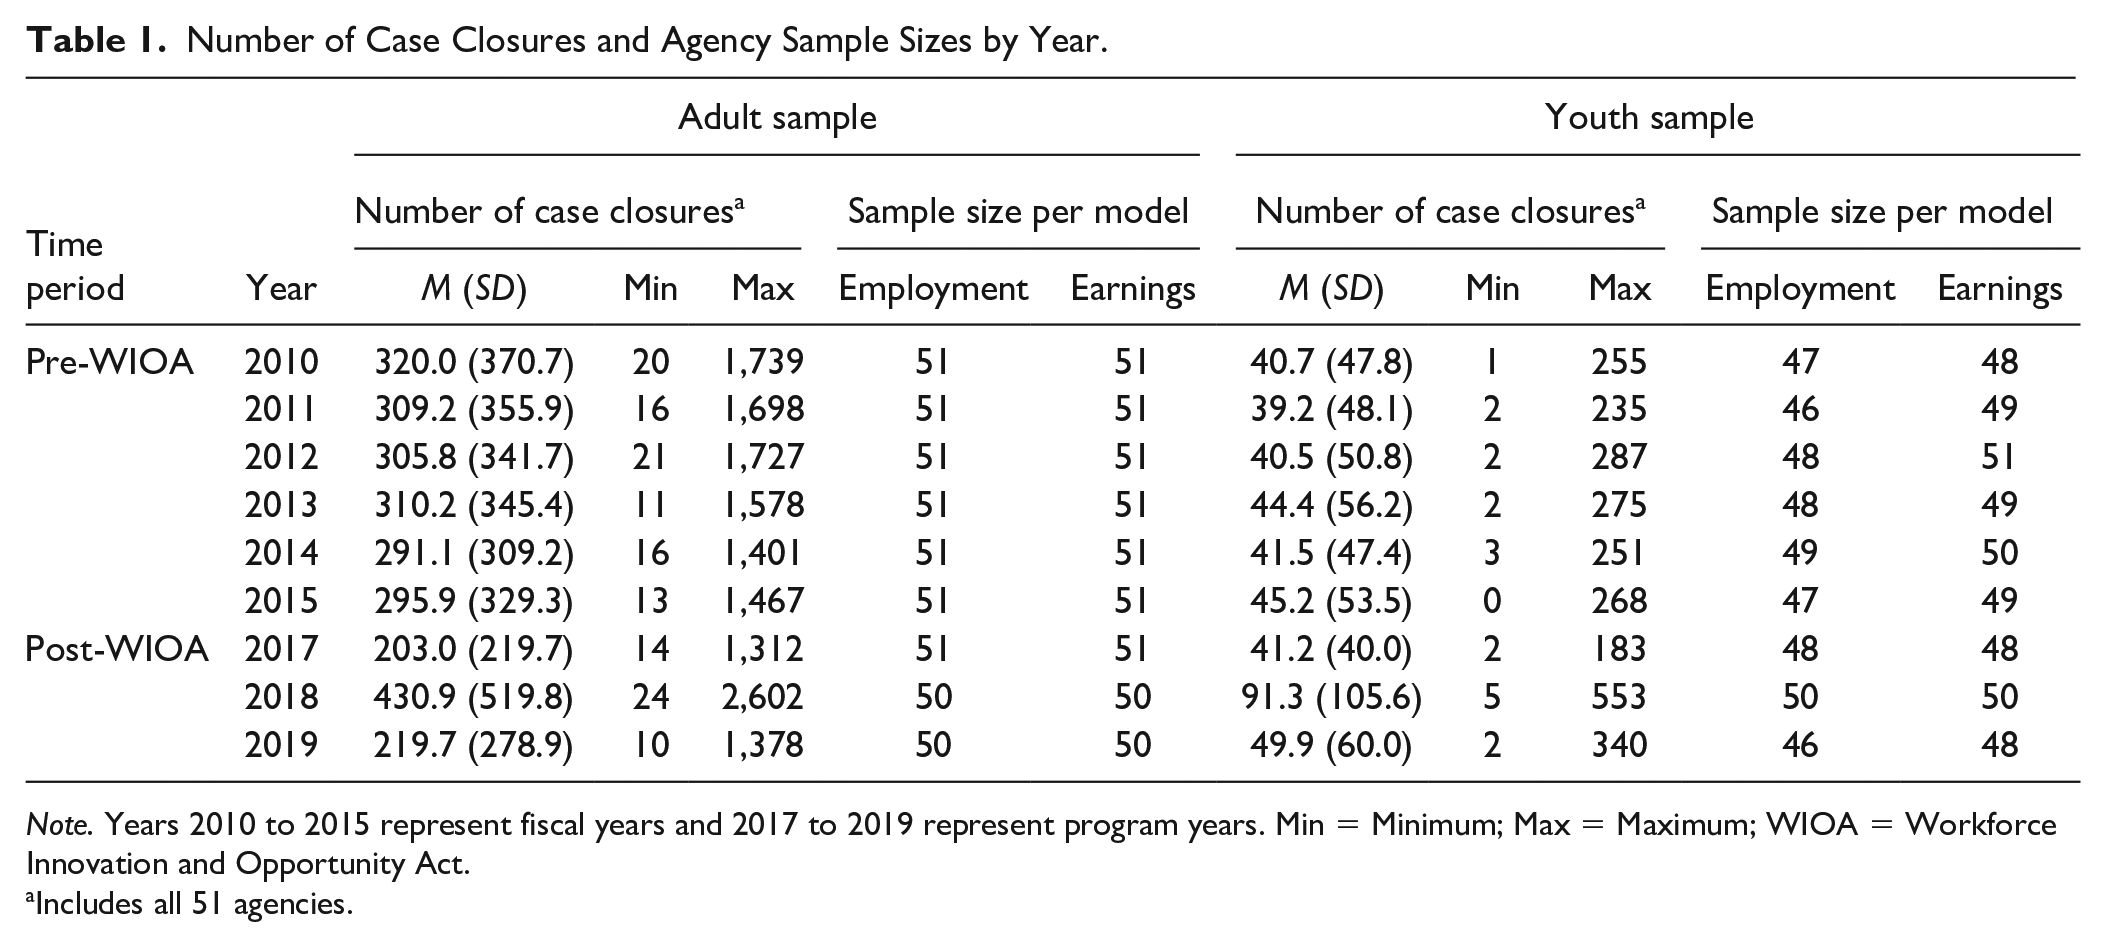
Note. Years 2010 to 2015 represent fiscal years and 2017 to 2019 represent program years. Min = Minimum; Max = Maximum; WIOA = Workforce Innovation and Opportunity Act.
Includes all 51 agencies.
Variables
We evaluated WIOA’s impact in terms of two outcomes: competitive employment rate and median earnings at closure, measured at the agency level. We defined competitive employment as compensation at or above the federal minimum wage and employment in one of the following categories: without supports in an integrated setting, with supports in an integrated setting, self-employment, or the business enterprise program. Competitive employment rate was computed by dividing the total number of people who were competitively employed at case closure by the number of cases closed. We only computed competitive employment rates for agencies that had at least five closures in a given year; therefore, not all agencies had youth employment rate data for every year. Median earnings at closure reflected the midpoint of hourly earnings among competitively employed people at case closure in a given year. Median earnings from 2011 to 2019 were adjusted to 2010 dollars by the annual Consumer Price Index to account for the effect of inflation (U.S. Bureau of Labor Statistics, n.d.). A few agencies did not have youth earnings data for some years because their competitive employment rate for youth was 0% for those years.
Four predictors were included in the longitudinal analyses. We included three time-based variables: time, WIOA, and post-WIOA time. Time represented the pre-WIOA linear slope, WIOA represented the change in the intercept immediately following the WIOA transition, and post-WIOA time represented the post-WIOA linear slope. The fourth predictor variable was agency type (0 = combined agency, 1 = separate agency), which was consistent over time except for Texas. The separate and general VR agencies in Texas consolidated into a combined agency in 2016, corresponding with the transition period between pre-WIOA and post-WIOA. Therefore, the agency type for Texas was coded “1” for FYs 2010–2015 and “0’ for PYs 2017–2019.
We also included employment at application as a covariate in the competitive employment rate models, defined as the agency-level competitive employment rate at application (in the pre-WIOA period) or at the time of the individual plan for employment (IPE; in the post-WIOA period). This variable was computed by dividing the total number of people who were competitively employed at application or IPE by the number of cases closed in a given agency in a given year. It was included as a covariate because a substantial percentage of B/LV consumers enter VR with a job, and separate agencies serve a higher percentage of consumers who are employed at application.
Data Analysis
We computed agency-level competitive employment rates and median earnings by year and used a graphical format to present averages for all agencies and for separate and combined agencies. We utilized discontinuous growth models (also called piecewise linear growth models) to investigate longitudinal changes in agency-level employment outcomes following WIOA. The discontinuous growth model extends the basic continuous growth model through the inclusion of variables representing an event and change in response to the event (Bliese et al., 2020; Bliese & Lang, 2016). As shown in Table 2, we coded the time-based variables to examine relative change in the outcomes in response to WIOA. Therefore, estimates for a time represent the predicted change in the outcomes as if WIOA did not occur, and WIOA and post-WIOA time estimates represent differences between observed values and these predicted values (Bliese & Lang, 2016).
Relative Coding of the Time-Based Variables in the Discontinuous Growth Models.
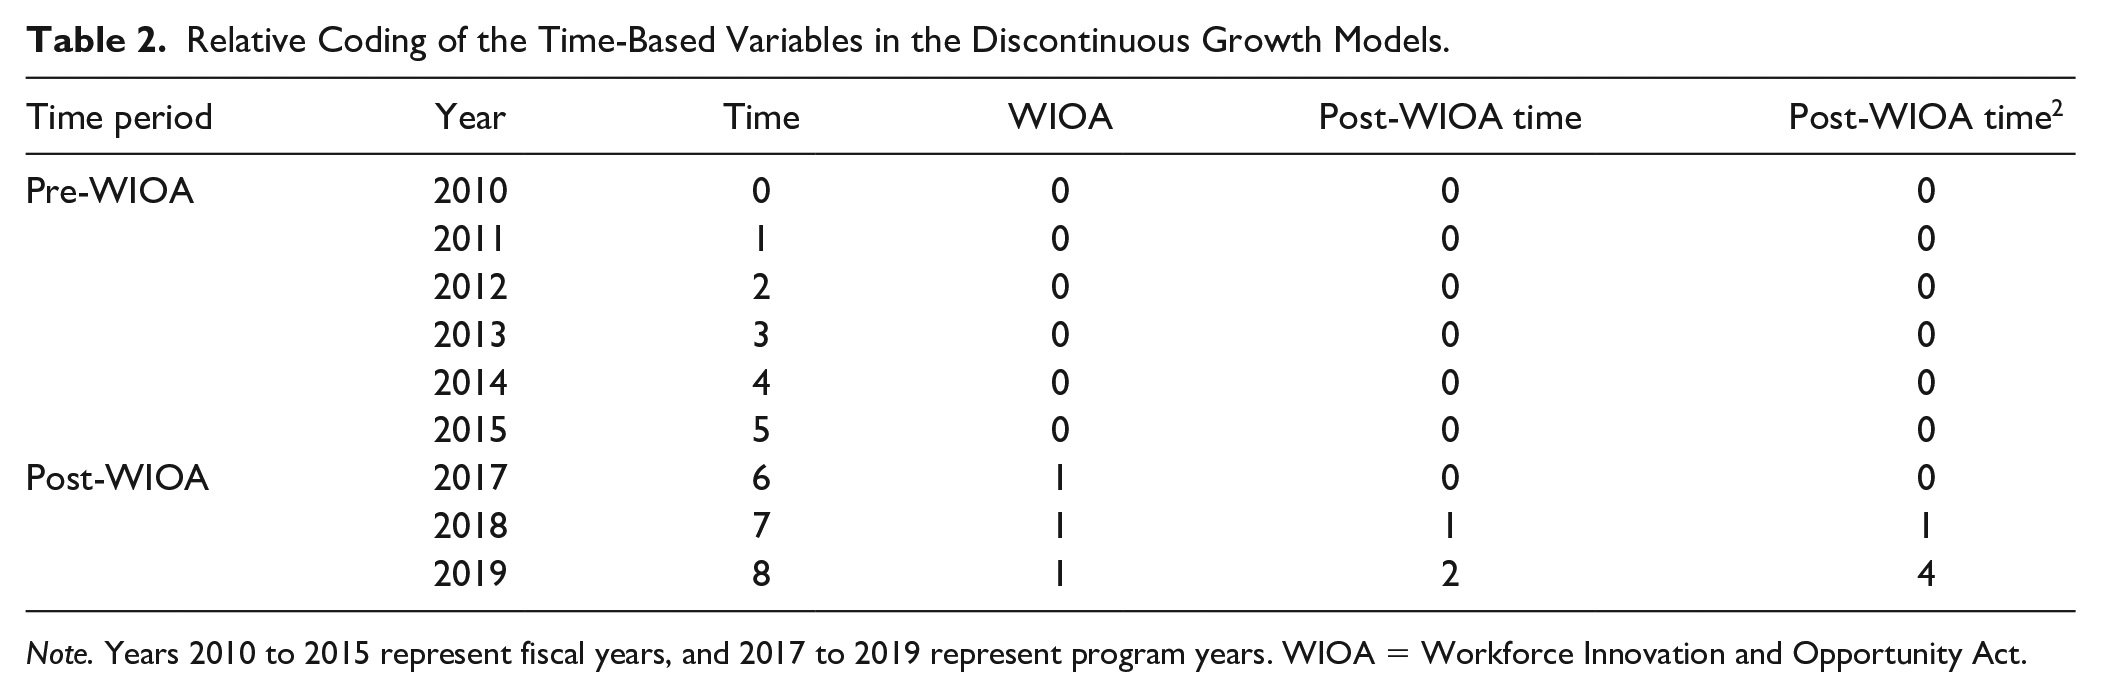
Note. Years 2010 to 2015 represent fiscal years, and 2017 to 2019 represent program years. WIOA = Workforce Innovation and Opportunity Act.
We used SAS 9.4 PROC MIXED with maximum likelihood estimation and Kenward-Roger adjustment for all models. We applied a natural log transformation to the earnings variable prior to analysis; therefore, the dependent variables in the models were competitive employment rates and log earnings. To aid in interpreting the coefficients for the log earnings models, we exponentiated the values and used the formula (exp(b) – 1) x 100 to calculate percentage change. Following Bliese and colleagues’ model-building guidelines (Bliese et al., 2020; Bliese & Lang, 2016), we first examined the unconditional means (intercept-only) model for each outcome and estimated the intraclass correlation coefficient (ICC) to determine how much of the total variance was associated with differences between agencies. Second, we added time, WIOA, and post-WIOA time to the model as fixed effects, resulting in a basic discontinuous growth model. To evaluate potential nonlinear trajectories in post-WIOA outcomes, we added a quadratic term (post-WIOA time2) to the model and retained it if statistically significant. Next, we added random effects to examine between-agency variability in the time-based variables, and we removed nonsignificant random effects if they did not improve model fit based on likelihood ratio tests. We tested random slopes but ultimately removed them because they made the models unstable and overly complex, which is common in discontinuous growth models (Bliese et al., 2020). Finally, we evaluated a full model with additional predictors: (a) agency type; (b) two-way interactions between agency type and WIOA, post-WIOA time, and post-WIOA time2 (when applicable); and (c) employment at application (for the competitive employment rate models), which was centered at the grand mean. We removed the interactions between agency type and post-WIOA time/post-WIOA time2, as they were not significant in any models.
To verify model assumptions and screen for outliers, we examined studentized residuals and influence diagnostics. The residual plots, histograms, and statistics for the marginal and conditional residuals did not indicate any violations of the distributional assumptions for linear multilevel models with random effects. The residual plots and influence diagnostics revealed a few minor outliers in some models. We investigated each outlier by verifying the accuracy of the data and examining its influence on the model estimates. The outliers did not impact the overall interpretation of the results; therefore, we retained those observations in the final models.
Results
Competitive Employment
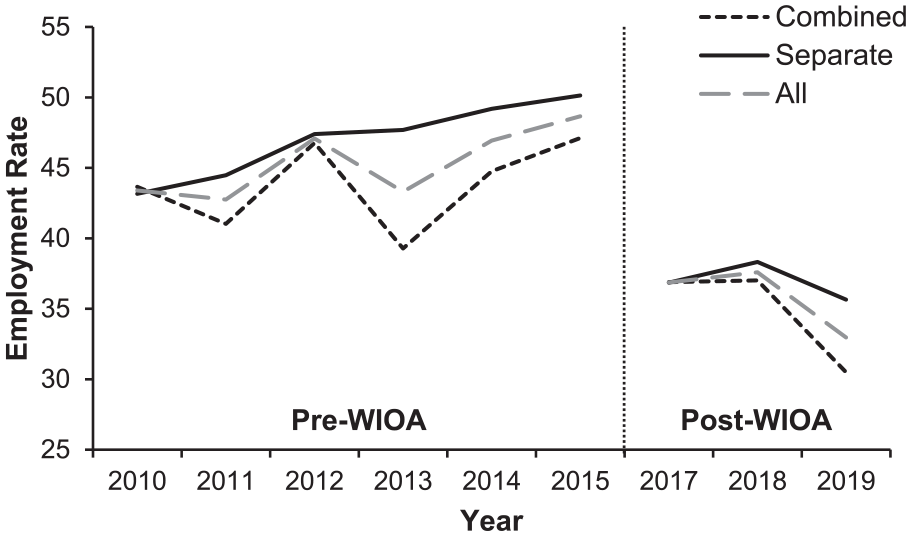
Agency-level competitive employment rates ranged from 10.6% to 93.3% (M = 50.75, SD = 14.96) for adults and from 0% to 100% (M = 42.19, SD = 16.68) for youth. Average competitive employment rates for adults and youth by year for the pre- and post-WIOA periods are displayed in Figures 1 and 2, respectively. Table 3 provides the discontinuous growth model results for adult and youth competitive employment rates.
Discontinuous Growth Models for Agency-Level Competitive Employment Rates.
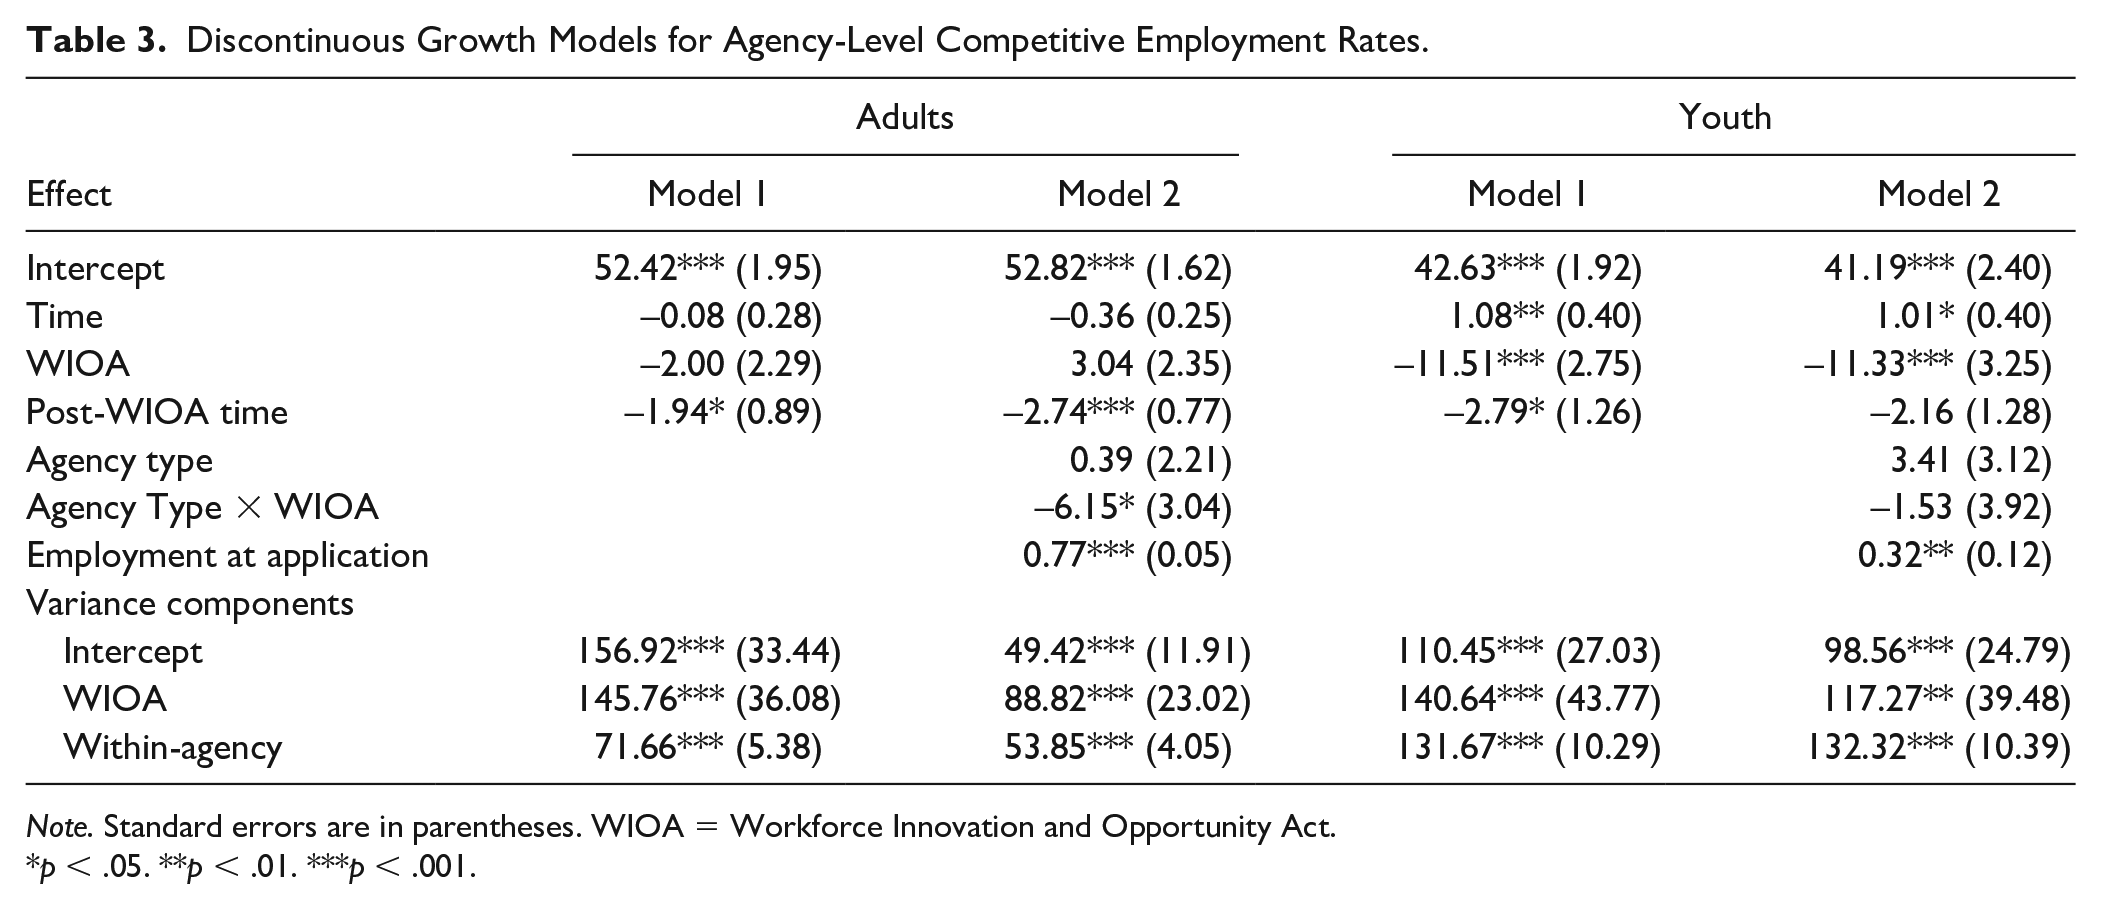
Note. Standard errors are in parentheses. WIOA = Workforce Innovation and Opportunity Act.
p < .05. **p < .01. ***p < .001.
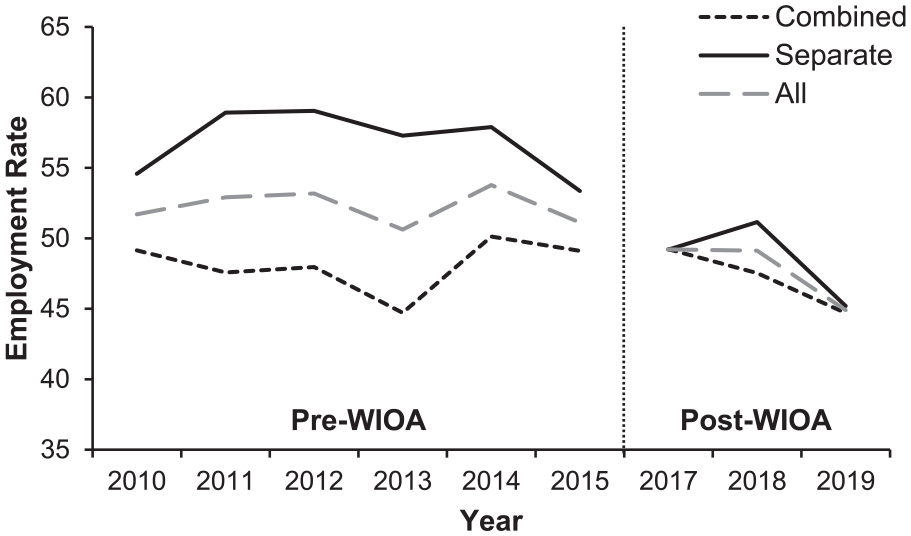
Agency-Level Competitive Employment Rates for Adults Before and After the WIOA.
Agency-Level Competitive Employment Rates for Youth Before and After the WIOA.
For the unconditional means model predicting adult competitive employment rates, the between-agency variance was 110.76 (SE = 24.49), and the within-agency variance was 113.41 (SE = 7.96). The ICC of 0.49 indicates that between-agency differences accounted for approximately half of the variability in competitive employment rates. In Model 1 (the basic discontinuous growth model), adult competitive employment rates were stable during the pre-WIOA period, and the average competitive employment rate did not change significantly immediately after the WIOA transition. The random effect for WIOA indicates that the initial impact of WIOA on adult competitive employment rates varied significantly across agencies; approximately half of agencies decreased and the other half either increased or exhibited little to no change. During the post-WIOA period, competitive employment rates declined significantly at a rate of 1.94 percentage points per year relative to the pre-WIOA slope. Model 2 (the full discontinuous growth model) indicates that pre-WIOA employment rates for adults did not differ significantly by agency type when accounting for employment at application. The interaction between agency type and WIOA was significant, which signifies that the immediate change in post-WIOA employment rates for adults differed by agency type. The immediate change in employment rates associated with WIOA was 6.15 percentage points lower for separate agencies than combined agencies.
In the unconditional means model predicting youth competitive employment rates, the between-agency variance was 90.18 (SE = 22.76), and the within-agency variance was 189.08 (SE = 13.77), for an ICC of 0.32. Therefore, within-agency differences accounted for a majority of the variability in youth competitive employment rates. Model 1 (the basic discontinuous growth model) indicates that competitive employment rates for youth increased by 1.08 percentage points per year during the pre-WIOA period. Immediately after the WIOA transition, youth competitive employment rates decreased by an average of 11.51 percentage points relative to the expected value. The significant random effect for WIOA signifies that the impact of WIOA on employment rates varied significantly across agencies. For example, one agency decreased by 61 percentage points from FY 2015 to PY 2017, while others increased or exhibited no change. Average youth employment rates continued to decline during the post-WIOA period at a rate of 2.79 percentage points per year relative to the pre-WIOA slope. In the full model (Model 2), pre-WIOA employment rates for youth did not differ by agency type. The impact of WIOA on youth employment rates also did not differ significantly by agency type; both combined and separate agencies experienced a significant decrease relative to expected values.
Median Earnings
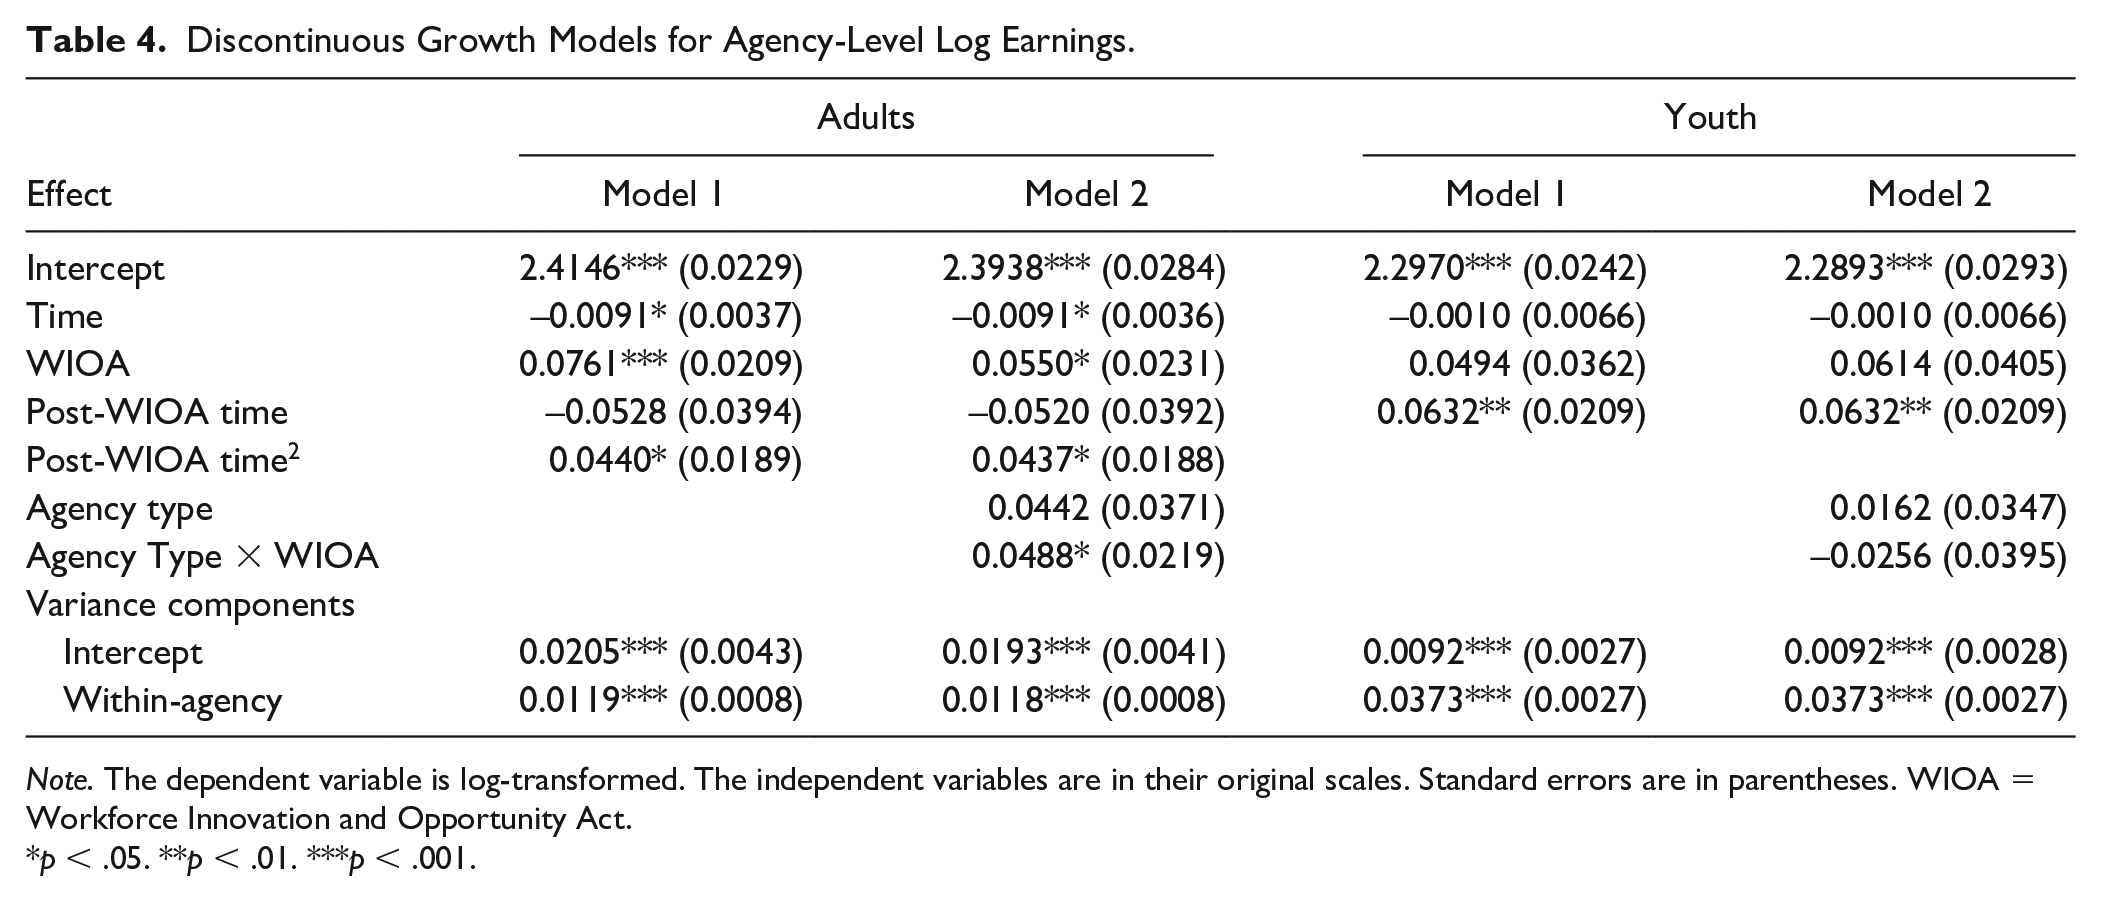
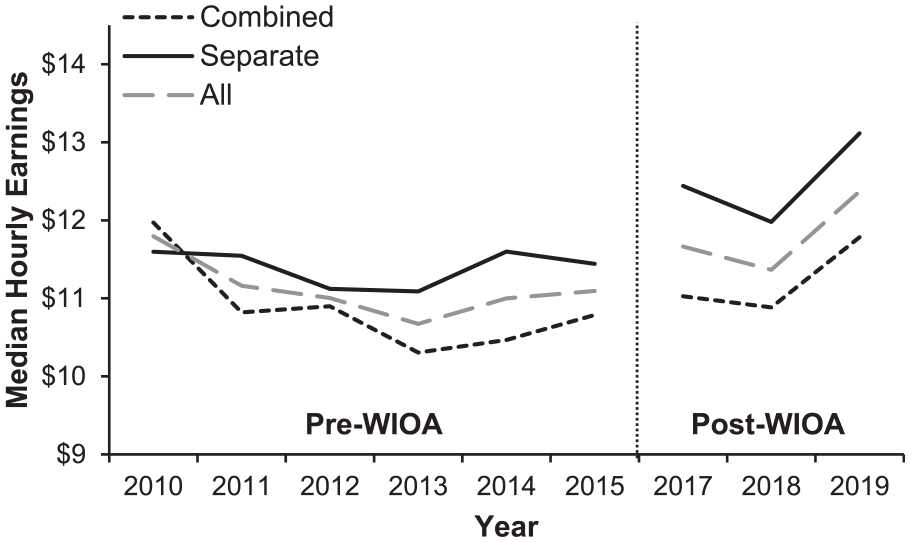
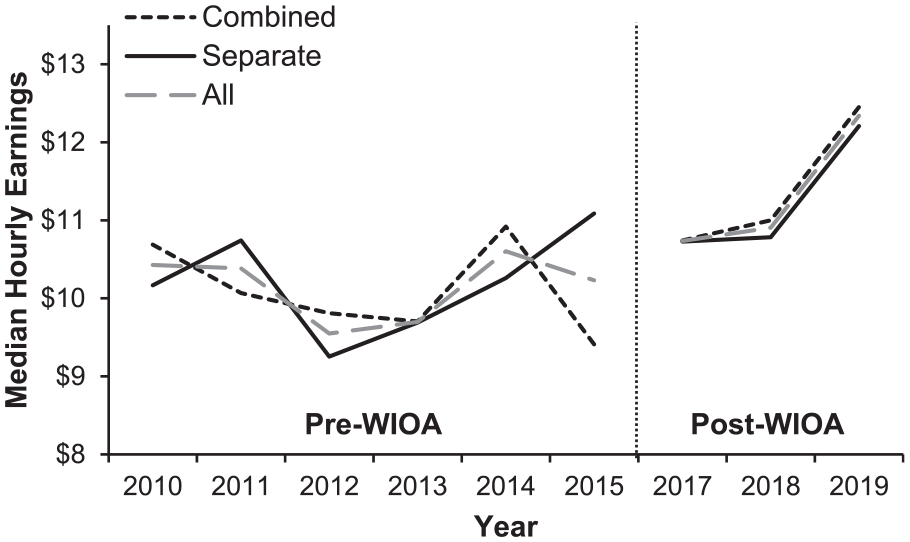
Agency-level median earnings ranged from US$8.08 to US$31.25 (M = 11.35, SD = 2.38) for adults and from US$7.04 to US$24.60 (M = 10.53, SD = 2.70) for youth. Median earnings for adults and youth by year for the pre- and post-WIOA periods are presented in Figures 3 and 4, respectively. Table 4 provides results for the discontinuous growth models predicting log earnings for adults and youth.
Discontinuous Growth Models for Agency-Level Log Earnings.
Note. The dependent variable is log-transformed. The independent variables are in their original scales. Standard errors are in parentheses. WIOA = Workforce Innovation and Opportunity Act.
p < .05. **p < .01. ***p < .001.
Agency-Level Median Earnings for Adults Before and After the WIOA.
Agency-Level Median Earnings for Youth Before and After the WIOA.
In the unconditional means model predicting log earnings for adults, the between-agency variance was 0.0204 (SE = 0.0043), and the within-agency variance was 0.0132 (SE = 0.0009). The ICC of 0.61 suggests that most of the variability in adult earnings was due to between-agency differences. In Model 1, median earnings decreased significantly by 0.9% per year during the pre-WIOA period. Immediately following the WIOA transition period, earnings increased significantly by 7.9% relative to the expected value. The linear post-WIOA slope for earnings was negative and nonsignificant, but the significant positive quadratic trend indicates a subsequent increase in the rate of change. In Model 2, the significant interaction between agency type and WIOA indicates that the change in post-WIOA earnings differed by agency type. Immediately following WIOA, median earnings increased by 5.7% for combined agencies and by 10.9% for separate agencies.
In the unconditional means model predicting log earnings for youth, the between-agency variance was 0.0089 (SE = 0.0028), and the within-agency variance was 0.0411 (SE = 0.0029). The estimated ICC of 0.18 suggests that between-agency differences accounted for substantially less variability in youth earnings than within-agency differences. Model 1 indicates that youth earnings were stable during the pre-WIOA period and did not change immediately after WIOA. During the post-WIOA period, youth earnings increased by 6.5% per year relative to the pre-WIOA slope. Model 2 indicates that the impact of WIOA on youth earnings did not differ by agency type.
Discussion
The WIOA represents a substantial change to the state-federal VR system in multiple areas, as previously presented. One of the most substantial changes is the increased focus on prioritizing services to youth, or students, with disabilities. Because a great majority of people who are B/LV are adults, this change represented a particular concern for the provision of VR services to this population. Therefore, we investigated the impact of WIOA on agency-level outcomes for youth and adults separately and the differences in WIOA impact on separate and combined agencies.
Reduced services for adults were a concern given the need to prioritize funding for youth, and number of adult cases closed after receiving services decreased immediately post-WIOA. However, the number of adult closures then increased substantially in PY 2018, followed by another decrease in PY 2019. This pattern may be associated with changes to RSA reporting requirements: a large number of cases were closed immediately prior to PY 2017 when data reporting requirements became more extensive (U.S. Department of Education, 2020). The reporting requirements for RSA-911 data have again changed (PY 2020; RSA, 2019), which may explain some of the PY 2019 decrease in cases closed. Low case closures in PY 2019 may also be associated with the lack of employment opportunities during the COVID-19 pandemic, which began in the United States 3.5 months prior to the end of this PY. Additional years of post-WIOA data will be needed to evaluate post-WIOA changes in case closures for adults with B/LV. It is interesting to note that the number of case closures for all consumers served by VR did not appear to follow a similar pattern as observed for adults with B/LV, based on data presented through FY 2019 (U.S. Department of Education, 2020).
Post-WIOA and prior to the pandemic, the U.S. economy was growing, and unemployment rates were very low, yet significant decreases in competitive employment rates for both adults and youth were observed in this study. This finding coincides with RSA-911 data for all consumers served, although it is not clear how the employment rate was defined for those estimates (U.S. Department of Education, 2020). In our study, we held the definition of competitive employment constant across the time periods; therefore, homemaker closures would not have had an impact on our rates. In fact, the elimination of the homemaker closure as a successful closure could have increased competitive employment rates for agencies that formerly closed a portion of their B/LV consumers as homemakers. A possible explanation for lower post-WIOA employment rates is the more extensive documentation and requirements to “count” a closure as CIE; RSA has issued five guidance documents regarding the definition of CIE and supporting documentation required. Order of selection requirements may have influenced competitive employment rates, as agencies could be serving more consumers with blindness and less with low vision, or more with multiple disabilities, who may have more difficulty obtaining CIE. In addition, with the improved economy, some individuals who would have traditionally been served by VR may have obtained employment without VR support. VR may, in turn, have been working with consumers with more barriers to employment who were harder to place into employment, and this, in part, could explain a decrease in CIE.
We anticipated that employment outcomes might worsen for adults, with resources being shifted to youth. Some agencies have reported difficulty meeting adult consumers’ needs due to money and time spent on youth (U.S. Department of Education, 2020), and many reported concerns about this soon after WIOA implementation (McDonnall et al., 2018). Yet decreases in employment rates were more extreme for youth than adults after WIOA, despite increasing pre-WIOA rates for youth over time. This decrease is of particular concern because these youth were eligible for more services than ever, as agencies expanded services for youth and created many new programs in response to the pre-ETS 15% requirement (McDonnall et al., 2018). Agencies prioritizing group pre-ETS programs over individualized services could potentially explain some of the reduction in youth employment rates.
A positive finding from this study is the increase in median earnings after WIOA, for both adults and youth. An increase in median earnings was also exhibited for all consumers served by VR after WIOA (U.S. Department of Education, 2020). Two new VR agency performance measures may have contributed to this finding: median earnings in the second quarter after case closure and measurable skills gains. Agencies have heightened their focus on achieving in these areas now that they are formally evaluated on them. These measures coincide with the general goal of WIOA: to increase the quality of employment for participants. Measurable skills gains by VR consumers increased substantially from PY 2017 to PY 2019 according to the RSA WIOA Annual Reports, and skill gains should contribute to consumers’ ability to earn a higher salary. While this finding is certainly positive, one consideration to keep in mind is that state minimum wage increases may explain part of the average increase in median wage of VR consumers. More than half of the states (27 out of 51) had an increase in their minimum wage during the post-WIOA period (U.S. Department of Labor, 2021). Although a few states had small increases (less than US$1.00/hr), most increases were larger, and 13 states had increases of US$2.00/hr or much more (e.g., Maine increased from US$7.50 to US$12.00 and Washington increased from US$9.47 to US$13.50).
A concern about the potential for a particularly negative impact of WIOA changes on separate agencies for the blind prompted us to investigate the interaction between agency type and WIOA effects. There were differences in both outcome measures for adults served by separate agencies: the initial impact of WIOA on employment rate was more adverse for separate agencies than for combined agencies, and the increase in median earnings after WIOA was higher for consumers served by separate agencies. There were no significant differences in the impact of WIOA by agency type for youth. The difference in the employment rate for adults served by separate agencies may be associated with the shift in resources to youth and also the decrease in resources as WIOA compelled agencies to spend funds on several activities not required prior to WIOA (U.S. Department of Education, 2020). Each agency must use resources for these additional activities, which could have a more detrimental impact on adults served by separate agencies than those served by larger combined agencies.
Our analyses provided an aggregate picture of changes in outcomes post-WIOA for agencies serving consumers who are B/LV, and our results document the varied impact of WIOA on these agencies. Adult and youth outcomes varied significantly by the agency in terms of employment rate after WIOA. Adult employment rates remained stable or increased in about half of the agencies and decreased in the other half. Some agencies exhibited increases in youth employment rates after WIOA, while most exhibited decreases. This variability is not surprising as agencies utilized many different strategies for implementing and managing the new WIOA requirements, which ultimately may impact consumer outcomes (Honeycutt et al., 2019; McDonnall et al., 2018; Miller et al., 2018). However, it would be valuable for each agency to evaluate its consumers’ outcomes before and after WIOA and consider how changes they have implemented associated with WIOA may have contributed to any differences in outcomes. This assessment would be particularly important for agencies that have experienced sharp declines in employment rates.
Limitations and Future Research
Several limitations of this study are important to recognize. First, although WIOA was the major VR-related event that occurred between our pre- and post-WIOA periods, it is possible that other environmental factors may have also influenced the changes observed between these periods. Second, some characteristics of the data, such as outliers and the change in agency structure in Texas, may have influenced the model estimates. Third, despite our attempt to clearly define the pre- and post-WIOA periods, some consumers with PY 2017–2019 closures may have received services during both periods.
Several avenues for future research would clarify and extend our findings. Examining VR service data across multiple years would provide more information about the impact of WIOA on service provision for adults and youth with B/LV. Additional longitudinal research is needed to evaluate the long-term impact of WIOA on employment outcomes for consumers with B/LV. It would also be important to investigate the quality of services and other factors that may explain the variability in post-WIOA agency-level outcomes for this population. Finally, exploring changes in employment rates within each competitive employment category (e.g., employment without supports, self-employment, etc.) may provide further insight into these varied outcomes.
Conclusion
Overall, the impact of WIOA on outcomes for VR consumers with B/LV to date appears to be mixed at best, and the impact is surprisingly similar for youth and adults. Both groups experienced a significant decrease in competitive employment rate after WIOA, and this decrease was unexpectedly more profound for youth. Both groups also experienced a significant increase in median earnings after WIOA. An increase in quality employment outcomes was certainly one intent of the law but not at the expense of a substantially lower percentage of consumers who receive services exiting with employment. Interestingly, studies document that VR professionals report they are providing a lower quality of services due to additional demands of their jobs associated with WIOA (Sherman et al., 2019; U.S. Department of Education, 2020), perhaps explaining the decrease in employment rates.
Despite more than 6 years having passed since WIOA’s enactment, we still do not know the ultimate impact of this law on the VR program and services for consumers with B/LV, and the influences of WIOA and the COVID-19 pandemic on VR services and outcomes may be difficult to disentangle in the upcoming years. This study provides information about the status of the VR program through mid-2020, with results indicating mixed effects of WIOA on consumers with B/LV on average, with substantial variability in employment rates across agencies. The U.S. Department of Education continues to issue guidance on the implementation of WIOA (such as the February 28, 2020 notice of interpretation about the use of VR funds reserved for pre-ETS); consequently, the impact of WIOA will continue to evolve with changes such as these.
Footnotes
Declaration of Conflicting Interests
The author(s) declared no potential conflicts of interest with respect to the research, authorship, and/or publication of this article.
Funding
The contents of this manuscript were developed under a grant from the U.S. Department of Health and Human Services, NIDILRR grant 90RT5040. However, these contents do not necessarily represent the policy of the Department of Health and Human Services and should not indicate endorsement by the Federal Government.