
Abstract
The U.S. Department of Education’s Office of Special Education Programs has adopted a Results Driven Accountability (RDA) framework to support state education agencies (SEAs) in improving results for students with disabilities. RDA directed SEAs to focus on measurable outcomes. A leadership team in a large Midwestern state in the United States partnered with an institute of higher education implementation science purveyor team to systematically apply a particular approach, the Active Implementation Frameworks (AIFs), to build capacity, effectively implement, and scale an evidence-based program, Check & Connect, to improve statewide graduation rates for Black and American Indian students with disabilities. The presented case example illustrates how the SEA partners with local education agencies’ district teams to continuously measure and manage changes in (a) system capacity and (b) practice fidelity to improve graduation rate outcomes. Application of the AIFs in education, measured implementation progress and preliminary outcome data, and implications for policy for individuals with disabilities are discussed.
Keywords
Public schools are responsible for educating all students, including students with disabilities (SWD). The Elementary and Secondary Education Act requires school personnel to use evidence-based practices (EBPs) to address the learning needs of their students. In 2014, the U.S. Department of Education’s Office of Special Education Programs adopted a Results Driven Accountability framework to target work and investments to support states in improving results for SWD. The Office of Special Education Programs requires each state education agency (SEA) to develop a State Systemic Improvement Plan (SSIP) describing a comprehensive and multi-year strategy to achieve these outcomes. The multiyear nature of the state systemic improvement plan creates an opportunity for SEAs and local education agencies (LEAs) to build infrastructure to implement, sustain, and scale EBPs and inform enabling policies. The purpose of this article is to illustrate, by way of a case example, the use of an implementation science approach applied to Check and Connect (Christenson et al., 2012), an evidence-based practice, to improve outcomes for SWD, specifically, 6-year graduation rates of Black and American Indian students enrolled in special education.
Implementation Science Approach: Active Implementation Frameworks
Education systems struggle to transfer research-based practices into educators’ everyday skill sets (Madon et al., 2007). Implementation science addresses this challenge by determining conditions and activities that facilitate the use of EBPs. Implementation science is the study of “methods or techniques used to enhance the adoption, implementation, and sustainability of an intervention” (Powell et al., 2015). The Active Implementation Frameworks (AIFs), (Fixsen et al., 2005, 2019) are the selected implementation science approach used in this article. The AIFs have a history of applied use across disciplines, including education (Horner et al., 2017); across operationalized practices; and include accompanying capacity assessment measures to evaluate progress, (Blase et al., 2012; Fixsen et al., 2015; Metz & Bartley, 2012).
Problem Addressed: High School Graduation Rate of Students With Disabilities
According to the National Center for Education Statistics (2015), only 65% of SWD graduate on time, well below the 84% 4-year rate for students without disabilities. Disaggregating these data by race, the percentage of SWD who graduated with a regular high school diploma, received an alternative certificate, or dropped out, is equally disappointing. Black SWD had the lowest 4-year graduation rate with a regular high school diploma (62%). According to the same report, the percentage of students who received an alternative certificate was highest among Black students (14 %) and lowest among American Indian/Alaska Native students (5%). In addition, 29% of American Indian/Alaska Native SWD drop out of school suggesting the possibility of an even larger graduation gap for this population.
In one Midwestern state, a comprehensive data analysis of statewide graduation rates revealed a need to improve graduation rates for Black and American Indian SWD. Using these data, the SEA identified LEAs with large populations of Black and American Indian SWD (see Table 1). Four districts were willing to engage in a 5-year partnership with the SEA to use the AIFs to establish, manage, and measure implementation capacity to support and sustain use of an EBP to collectively improve this important outcome.
Demographics for the State Education Agencies and Four Participating Districts.
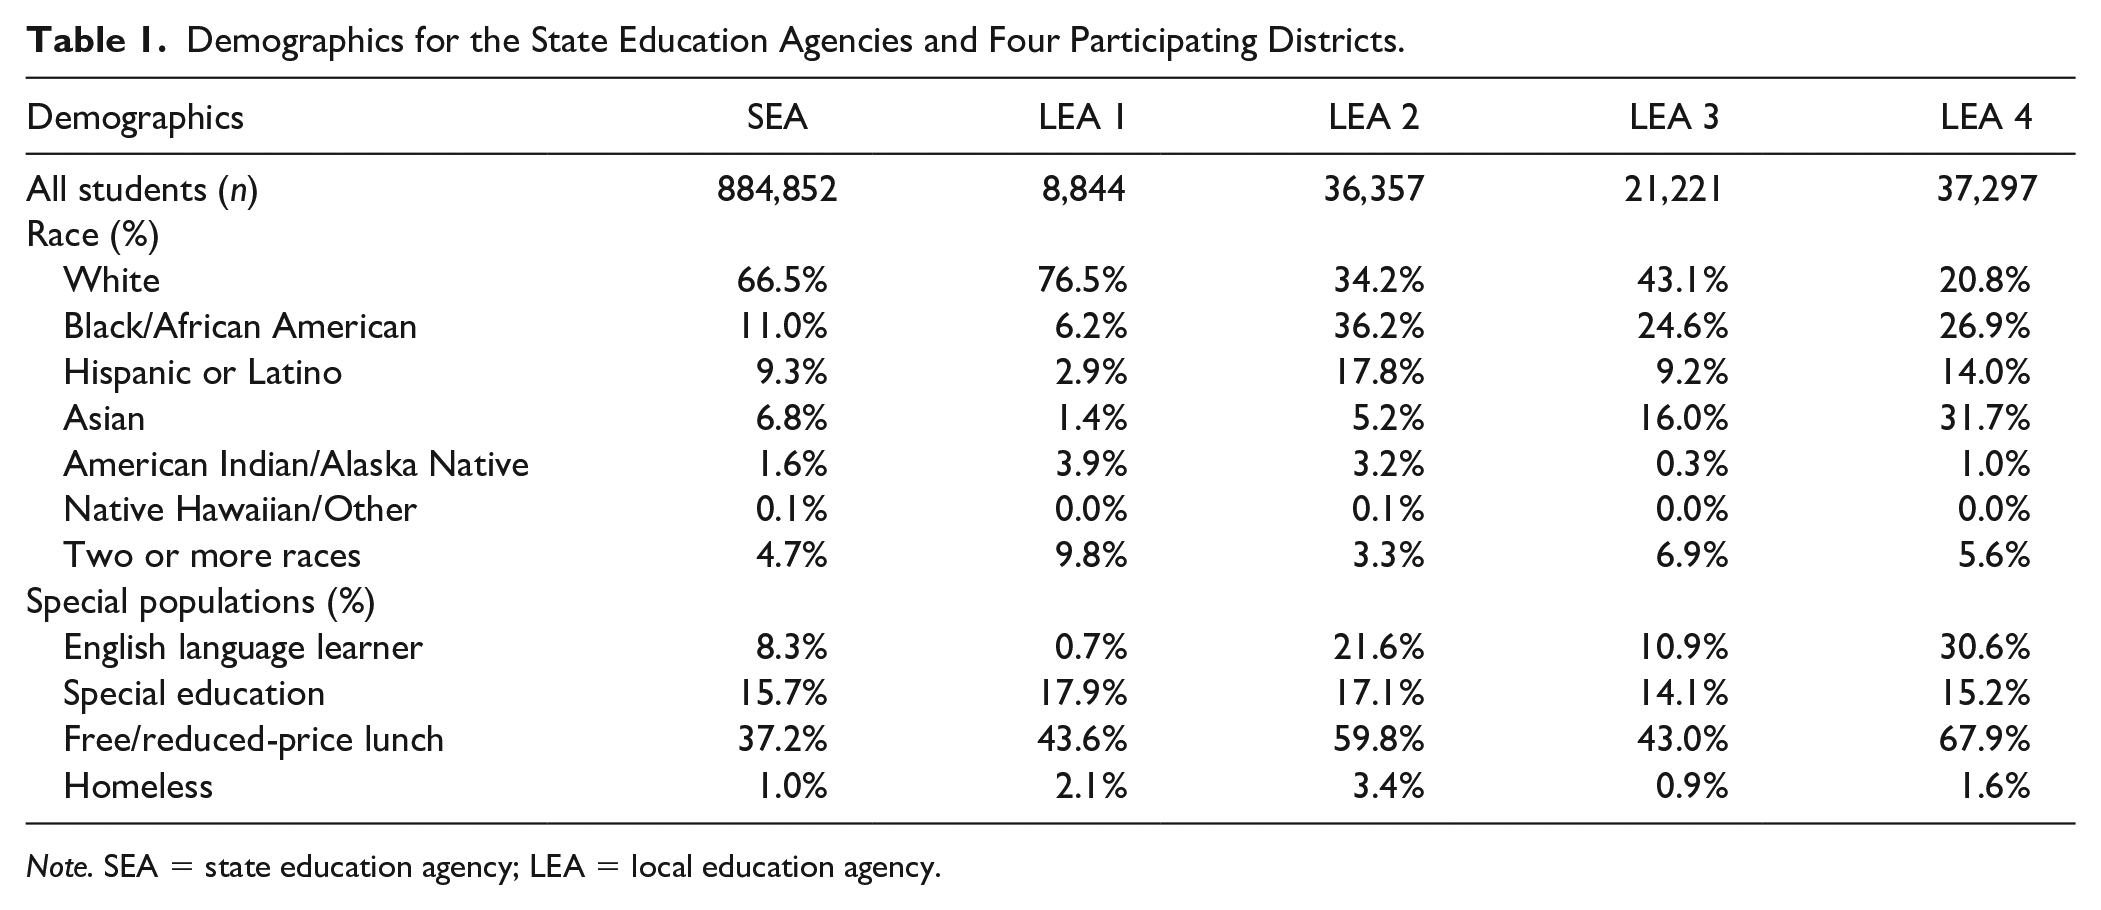
Note. SEA = state education agency; LEA = local education agency.
Selecting the EBP to address the problem: Check & connect
Each LEA team engaged in a systematic process, using the Hexagon Tool (Blase et al., 2013), facilitated by a SEA implementation specialist, to select an EBP matched to the data identified problem. The Hexagon Tool helps teams evaluate factors related to the practice (e.g., evidence, supports, usability) and the implementing sites (e.g., need, fit, and capacity). The process guides practice selection and team consensus regarding preparation to use the practice. Initially, the LEA scans existing practices and implementation quality to identify potential gaps or ineffective use. Next, a review of evidence-based clearinghouses is conducted (e.g., What Works Clearinghouse) to identify potential practices or programs to assess. LEA team members gather information on each of the factors in the Hexagon related to the practice and factors related to the district. Each LEA used the Hexagon Tool and independently chose the Check and Connect Intervention (C&C; Christenson et al., 2012) to reduce dropout and improve high school graduation rates for Black and American Indian SWD.
The C&C intervention, specifically designed to reduce school dropout, includes the core features of monitoring school performance, mentoring, and case management. A case manager “checks” by systematically monitoring the student’s academic, attendance, and behavior performance. The case manager “connects” by mentoring, providing basic interventions on problem-solving and coping for challenges, coordinates intensive interventions if needed, and engages with families. The trained C&C mentor meets with students twice monthly or more based on need (Christenson et al., 2012).
C&C has been found to have a positive effect on staying in school and potentially positive effects on progressing in school. In two studies with students who have social and emotional disabilities, Sinclair and colleagues (1998, 2005) found that students receiving C&C were significantly less likely to have dropped out following their fourth follow-up year (i.e., typical graduation time for normally progressing students). In the 2005 study, however, there was no statistically significant effect on high school completion. A randomized control trial by Guryan and colleagues (2020) found that participation in C&C significantly decreased absences for middle school age students by 20%, as well as significantly decreased the number of courses failed. Since C&C has a positive effect on factors associated with graduation, the SEA focused on the role of implementation (both system capacity and practice fidelity) over time to demonstrate impact on graduation.
Theory of Action and Research Questions
A theory of action was developed to guide this complex work. To improve outcomes, the SEA needed to (a) use data to identify a population and area for improvement, (b) select EBPs to address this need, (c) establish linked implementation teams at the SEA and LEA levels to support EBP delivery, (d) scale implementation of the EBP (e.g., more trained staff, more implementation sites and ultimately serve more students), (e) continuously monitor implementation data and intermediate progress benchmarks (3–5 years), and (f) once EBP is being implemented at scale, with consistent fidelity and sufficient time, demonstrate positive impact on student outcomes (full implementation = 6–10 years). Using this theory of action, the following case study is in its fifth year of implementation. The following research questions will be addressed:
Method
Participants
The participating U.S. Midwestern SEA serves 884,852 students. In 2015, the SEA examined statewide data trends (e.g., graduation rates, dropout data, discipline data, achievement data) to set a State Identified Measurable Result (SIMR) to increase 6-year graduation rates for Black and American Indian SWD. The SEA selected 6-year rates to highlight that improved graduation outcomes for SWD may take more than 4 years. The SEA collects, analyzes, and uses 4-year graduation rate data, but its staff reasoned that limiting evaluation to 4-year rates would preclude the inclusion of successful outcomes that take more time. Four districts serving a large population of students within this group were identified (see Table 1). Additional data considered included SEA’s school Multiple Measurements Rating status within targeted districts, type of LEA (e.g., public school districts, charter schools), geographic location (e.g., urban, suburban), and receptivity to a 5-year partnership with the SEA. The SEA engaged in exploration activities with the districts to ensure mutual selection and understanding of participation expectations.
Procedures: AIFs in Action
Implementation is a process involving multiple decisions and actions interacting over time. The AIF stages articulate phases of work, or stages, which build upon each other. These phases are not linear, but additive, recursive, and responsive to continuous flow of data. Using the implementation stages as a guide, teams develop a collective understanding of the time and requisite activities needed. A timeline of key activities by implementation stage and state activities are discussed below and appear in Figure 1. Currently, the SEA and LEAs are engaged in full implementation stage activities.
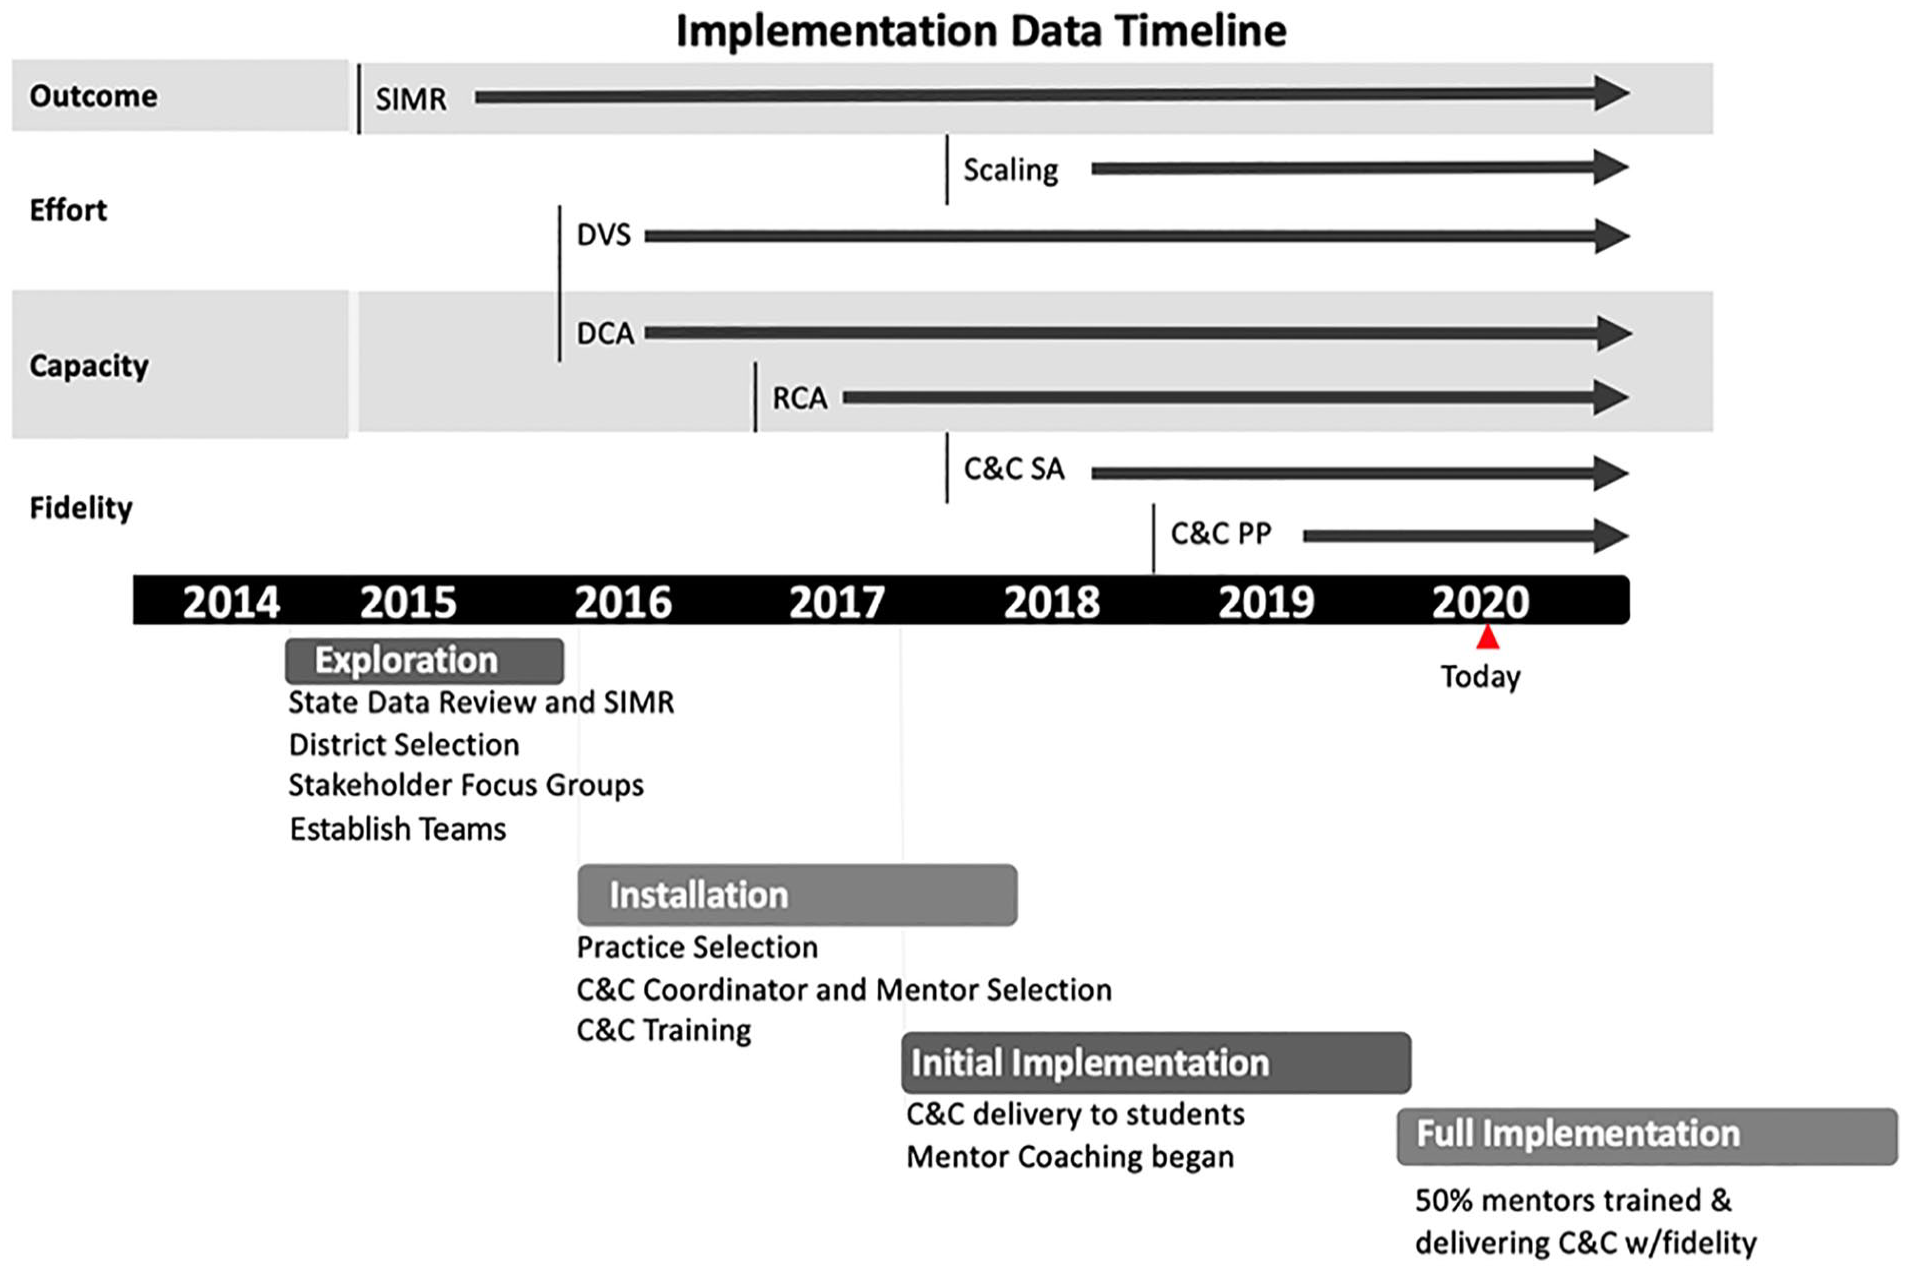
Timeline of implementation activities and data.
Exploration stage
During exploration, the SEA and LEAs developed implementation teams with sufficient decision-making authority to identify shared outcomes, obtain stakeholder input, review data, determine needs, and assess feasibility and fit, including potential challenges.
AIF: Implementation teams
The SEA and each LEA established implementation teams (Higgins, et al., 2012) and linkages to each respective agency’s leadership/management team. An implementation team is an organized group of representative competencies and perspectives collectively accountable for supporting and monitoring implementation. Two linking teams were established at the SEA level. One was a management team (MT), composed of core special education leadership with resource allocation, federal reporting, and decision-making authority (e.g., director and supervisory level staff). This team was accountable for alignment across projects within the division and across the agency, data-based decision-making, and stakeholder engagement. The MT was also responsible to support a second team, the Transformation Zone (TZ) implementation team, consisting of 16 SEA staff (i.e., 4 members for each LEA). The smaller subsets of TZ team members met monthly with district teams to support data-based decision-making, address barriers, and improve communication and systems to support EBP implementation (e.g., common procedures, tools, and processes) within the local context of the district.
Installation stage
The installation stage began after C&C was selected. Key actions included identifying practitioners (e.g., position descriptions, protocols to guide selection or recruitment), developing training and coaching systems, building data systems to support team decision-making, instituting communication plans, and initiating practitioner training. During installation, monthly meeting agendas between the LEA and TZ teams focused on analyzing installation data (e.g., hiring mentors and coordinators, scheduling trainings) and surfacing real-time needs or barriers. Information from these meetings was used to improve SEA support (e.g., use of funds, partnering with purveyor, identifying policies affecting hiring decisions).
AIF: Implementation drivers
The implementation drivers are core mechanisms needed to support practice, organizational, and systems change (Fixsen et al., 2005; Metz & Bartley, 2012) across stages and are developed during installation. There are two categories of drivers supported by leadership: Competency and Organizational. Competency Drivers are the mechanisms to support, develop, improve, and sustain practitioners’ use of the EBP. These include practitioner selection, training, and coaching, as well as the continual measurement of practice fidelity. Organizational Drivers address agency processes and procedures to inform decision-making, and systematically manage both internal and external implementation barriers. During installation, SEA and LEAs collaboratively developed selection processes for C&C Mentors contextualized to each LEA (e.g., paraprofessional staff, volunteers, classified or licensed staff). To ensure model consistency across LEAs, the SEA contracted with the program developer to establish a regular contact person and ensure a standardized training and coaching model (e.g., content, forms, and tools) and use of practices. Each district also identified a C&C coordinator responsible for working with the program contact, coaching individual mentors, and managing implementation data. Practice fidelity was measured to inform coaching to improve each mentor’s ability to deliver C&C delivery skillfully to students.
The SEA and LEA teams also established a predictive decision support data system (DSDS) process. The data system is illustrated by a common data calendar to iteratively cue the collection and use of effort, fidelity, capacity, and outcome data. Most LEAs have experience using outcome data (e.g., via Student Information Systems, SIS); yet the continuous use of these other implementation data is rare. Existing SIS do not measure capacity progress benchmarks to provide teams with data to make timely implementation decisions. The current project’s DSDS helped monitor progress benchmarks and align meeting agenda to review (a) effort data, such as how many trained, number of trained mentors not assigned, or number of students receiving C&C each quarter; (b) fidelity data; and (c) district and regional capacity assessment results to review infrastructure development.
Initial implementation
Initial implementation starts when students begin to receive service from mentors trained to deliver C&C. This is often a fragile stage, when newly trained practitioners may be using new skills for the first time. During this stage, coaching is a key activity to support practitioners’ skill development using fidelity data.
AIF improvement cycles
The AIFs use the Plan-Do-Study-Act Cycle (PDSA cycles; Deming, 1986) to support the use of data to improve implementation capacity and practice delivery. Clarity about what constitutes an improvement cycle and how to implement something as deceptively intuitive as a PDSA cycle requires systems coaching at both the SEA and LEA levels. A meta-analysis of peer-reviewed research on PDSA cycles revealed <20% of studies fully documented the application of a sequence of iterative cycles (Taylor et al., 2014). The “cycle” part of PDSA cycle was identified as the most overlooked critical feature of this framework. Unfortunately, in large complex systems, like SEAs, “celebrations” may happen before a first cycle is even completed. For example, identifying a data-based need and engaging teams to develop a plan become inadvertently reinforced as the end goal, rather developing an organizational habit of engaging in multiple improvement cycles. Developing and improving data systems and visualization feedback for implementation data, along with action planning, helps teams anticipate and engage in multiple cycles of improvement.
Incoming effort, fidelity, capacity, and student data start to inform ongoing selection, training, and coaching processes, and surface barriers to be addressed. Feedback from the practice level informs implementation teams on how well policies, procedures, and resources affect implementation. PDSA cycles also help organizational policymakers use data to develop or improve systems alignment within their purview. To capture qualitative aspects being learned, the TZ team documented informal feedback through a standard meeting summary format called a District Visit Summary form (DVS). The DVS provided broad categories of information (e.g., Top 3 Takeaways, implementation data highlighted, stage-based agenda items, specific AIF discussed, implications for next meeting) to share across TZ district teams. These were reviewed annually by the SEA to find qualitative patterns (e.g., data being used consistently, non-linear aspect of stage-based work in response to turnover) and inform supports from the SEA.
Full implementation
The LEAs have reached full implementation. The AIFs define full implementation as when 50% or more of the intended practitioners are using the EBP with fidelity and achieving intended outcomes. The EBP becomes integrated into the agency’s practices, policies, and procedures, and becomes “standard practice” (Faggin, 1985). To support sustainability during full implementation, continuous monitoring of implementation data to manage expected variance across sites continues as more students are served and staff turnover and improvement cycles continue. This stage requires these features to be continuously tracked.
Measures
Capacity assessments
The SEA’s and LEAs’ use of the AIFs is measured by annual capacity assessments conducted between February and April. The LEA and SEA teams use these data to mark implementation progress and guide action planning. Each assessment is completed by a trained administrator with a facilitator and team of respondents. The administrator introduces the assessment (e.g., description and purpose), reviews the consensus scoring process, then administers each item, with time provided for respondents to review the operationalized criteria and evidence sources for the item in the scoring rubric. The designated facilitator provides any needed local clarification or context, and then respondents are cued to vote simultaneously. If there is an agreement, the score is recorded, and the next item is administered. If there is not agreement, the administrator facilitates a discussion with respondents sharing information supporting their score. Following discussion, the administrator calls for a second vote. If there is still not agreement, respondents are asked for consensus, defined as the few being able to publicly support the majority score. Notes are taken to capture discussion and actions. Using a simultaneous scoring process helps mediate the potentially weighted impact of respondents with positional authority and creates shared understanding of implementation progress. The process has been found to be reliable through test–retest reliability testing procedures (Ward et al., 2022). The specific assessments are described next.
The District Capacity Assessment (DCA; Ward et al., 2015) consists of 26 items scored on a three-point scale (2 = fully in place, 1 = partially in place, 0 = not in place). A total score and three subscale scores (i.e., Competency, Leadership, and Decision Support Data System) are generated. The DCA is designed to guide LEA teams to align implementation efforts and resources around a selected practice (e.g., C&C). The DCA also evaluates potential external supports needed from the SEA TZ team. Psychometrically, the DCA’s content validity has been established. It has an adequate internal structure (root mean square error of approximation (RMSEA) = .071, comparative factor index (CFI) = .93, Tucker-Lewis Index (TLI) = .92), internal consistency (Cronbach α of 0.91 for the total score and 0.79–0.81 for the subscale scores), and test–retest reliability (r = .98 for Leadership, .78 for Decision Support Data System and Competency scales; Ward et al., 2022).
The Regional Capacity Assessment (RCA; St. Martin et al., 2015) was conducted with the SEA’s TZ team to help inform capacity and support efforts from the SEA Management team. The RCA consists of 28 items, each scored on a three-point scale (2 = fully in place, 1 = partially in place, 0 = not in place). A total score and four subscale scores (i.e., Competency, Leadership, Organizational, and Stage-based Functioning) are generated. The RCA was used since the SEA’s collective TZ team functions as a regional implementation team supporting multiple districts. Psychometrically, the content validity of the RCA has been established. Current research is underway to establish the RCA’s internal structure, internal consistency, and test–retest reliability.
Fidelity assessments
The C&C Mentors Self-Assessment (C&C SA) was used to measure fidelity (i.e., adherence to program core components). The C&C SA requires mentors to self-evaluate the level of implementation of the four core components of C&C (i.e., mentor behaviors, check-in activities, connecting with students, and engagement with families). Mentors rate the level of implementation using a four-point scale (1 = not happening; 2 = plans are in place to implement but has not begun; 3 = beginning to be implemented; 4 = in place and evidence that it has occurred). In the first year, 17 mentors completed the C&C self-assessment annually (January–February). Fifty mentors across the four districts completed the C&C self-assessment annually (January–February) in Year 2 of initial implementation, and 54 mentors completed the self-assessment annually in Years 3 and 4 of initial implementation.
As part of a PDSA cycle, an opportunity arose between the partnership of the SEA and C&C program developer to improve the quality of evaluating how well program components were being demonstrated in addition to a self-assessment. The C&C Practice Profile was developed by the C&C purveyor to guide a coach in how to observe and support mentors in their use of program components. It is completed by both the mentor and the coordinator twice a year and examines demonstrated proficiency on 10 practices. These practices include building relationships with students; systematic monitoring and analysis of student-level “check” data; providing personalized “connect” interventions; and engaging with families. Eighty percent was identified as a targeted level of proficiency. The concept of fidelity of practice was informed by these sources of information, in direct consultation with the C&C program developer.
Scale measure
C&C scaling data were used to measure the extent to which C&C was expanding across each LEA. A Student/Mentor Scaling Form was developed by the SEA and used quarterly by the LEAs to regularly document how many students and mentors entered, continued, or exited C&C. Districts updated the data every 3 months and the SEA aggregated the data at a state level to look at scaling trends over time.
Results
Given the case study approach, analyses of data from all measures (e.g., capacity assessments, fidelity measures, DVS summaries, and other student and stakeholder information) consisted of descriptive analyses and calculating differences between time points of data collection, depicted in graphs and figures for review. These analyses were used to capture how implementation infrastructure simultaneously evolved along with improved practice delivery to positively affect student outcomes.
SEA Team Capacity
Results of the RCA indicate that the SEA is expanding its capacity to develop and use an implementation infrastructure. The goal of the RCA for is for regional teams to be at or above 80% by the end of Year 3. The SEA exceeded that goal with a total score of 95% in Year 4 (see Figure 2). Baseline RCA results identified strengths across all implementation driver areas (Competency, Leadership, and Organizational) to build upon. SEA capacity to support multiple districts across stages was an area of strength, while coaching was highlighted as a need. Over the next year, a coaching system was developed through the SEA’s partnership with the program developer of C&C, to provide external coaching to coordinators and mentors. The subsequent RCA administration highlighted multiple areas of growth including the targeted area of coaching. A decrease was seen in Leadership. Specifically, a need was identified for the management team to establish more explicit standardized implementation guidance (e.g., written implementation plan) to support the TZ team. The third RCA resulted in growth in the previously prioritized area of leadership and stability in Organizational functioning, but dips in the competency and stage-based functioning items due to the need for improving collection and use of coaching effectiveness data. By the fourth administration, all total and scale scores showed growth and met the goal of being at 80% or greater by the end of year 3 of implementation.
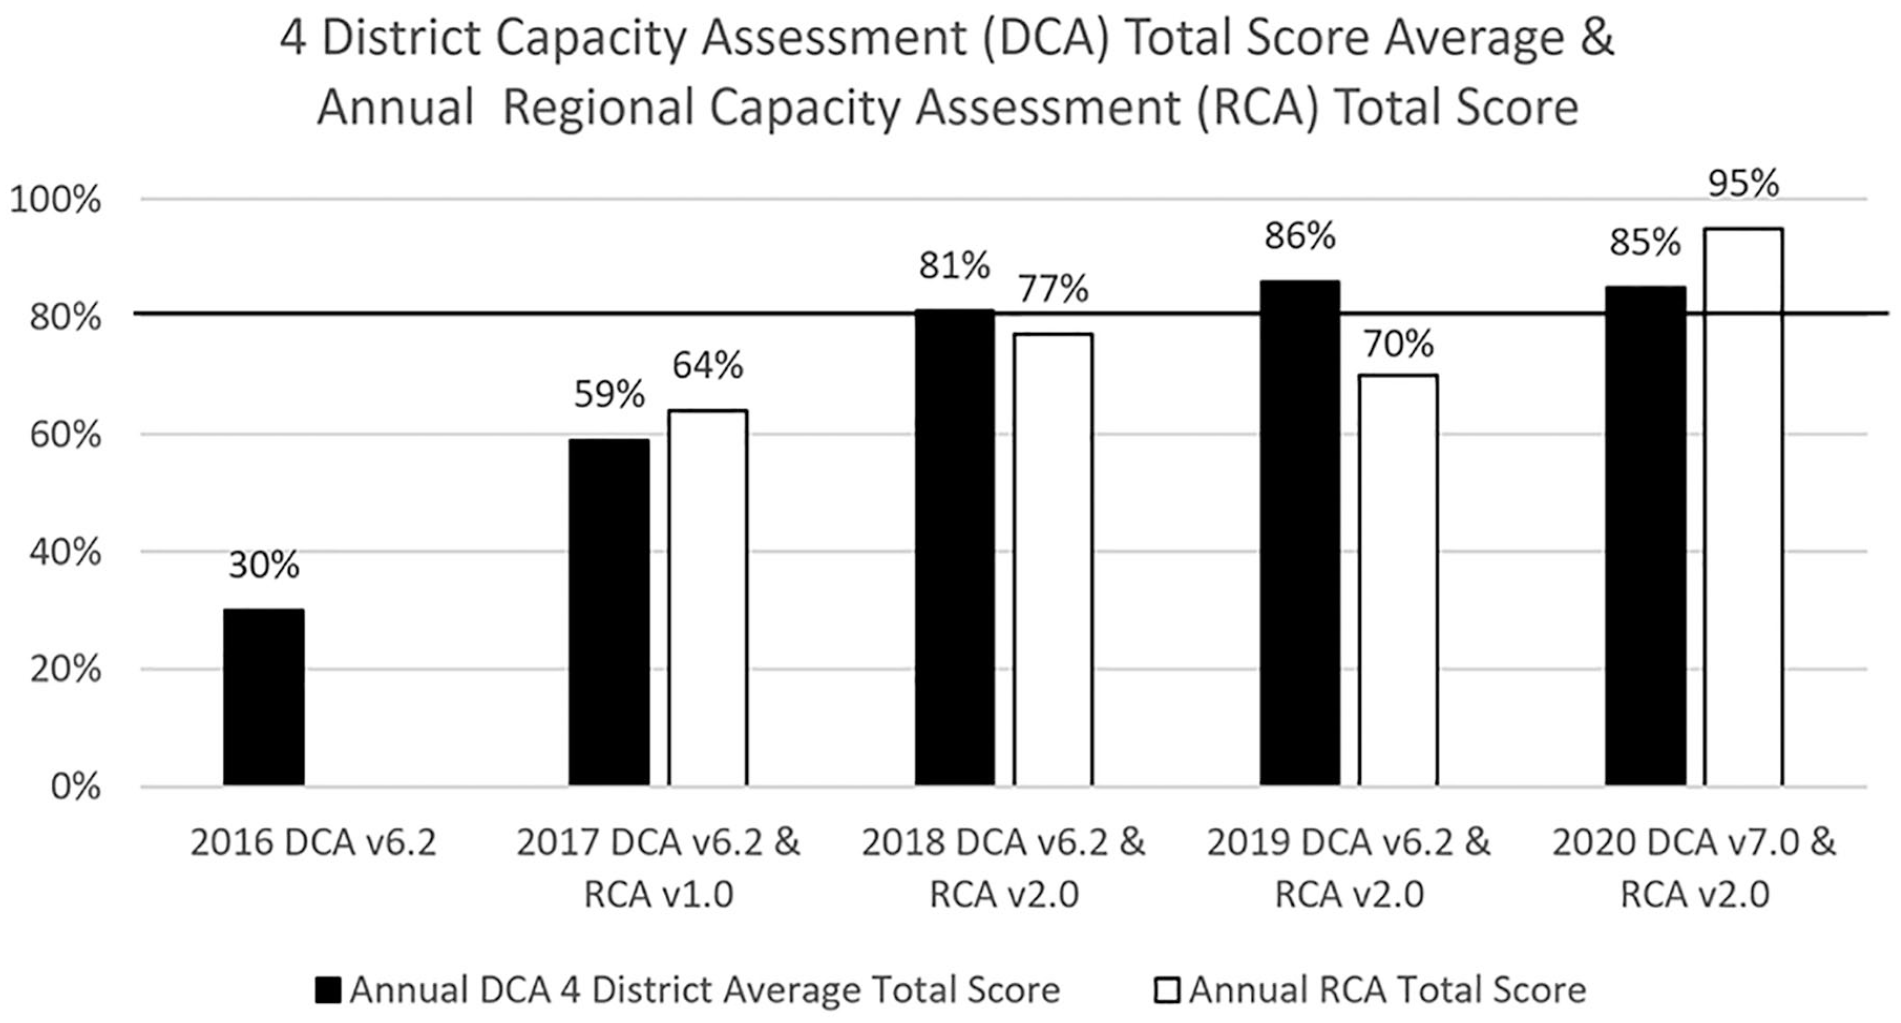
Annual linked team capacity assessment data comparison: 2016–2020.
Based on a review of the DCA results (see Figure 3), all districts demonstrated a high level of overall capacity to implement C&C. Although variance is evident and continues to be expected across districts, the common trend was a mean increase in DCA total scores with three of four districts meeting the 80% target goal and an average total score across districts of 85%. When reviewing the changes in capacity across districts, patterns were observed in key areas. Leadership scores within the LEAs grew steadily over the first 2 years and have been independently sustained in all districts. Another pattern was an incremental increase in Competency drivers as training and coaching activities were implemented and improved. The SEA’s contractual partnership with the program developer continues to support consistent district training, coaching, and evolving fidelity measures. The largest area of growth across LEAs was in Decision Support Data Systems. It should be noted that due to the closure of schools during the coronavirus disease 2019 pandemic, one district’s fourth data point was conducted virtually in May 2020.
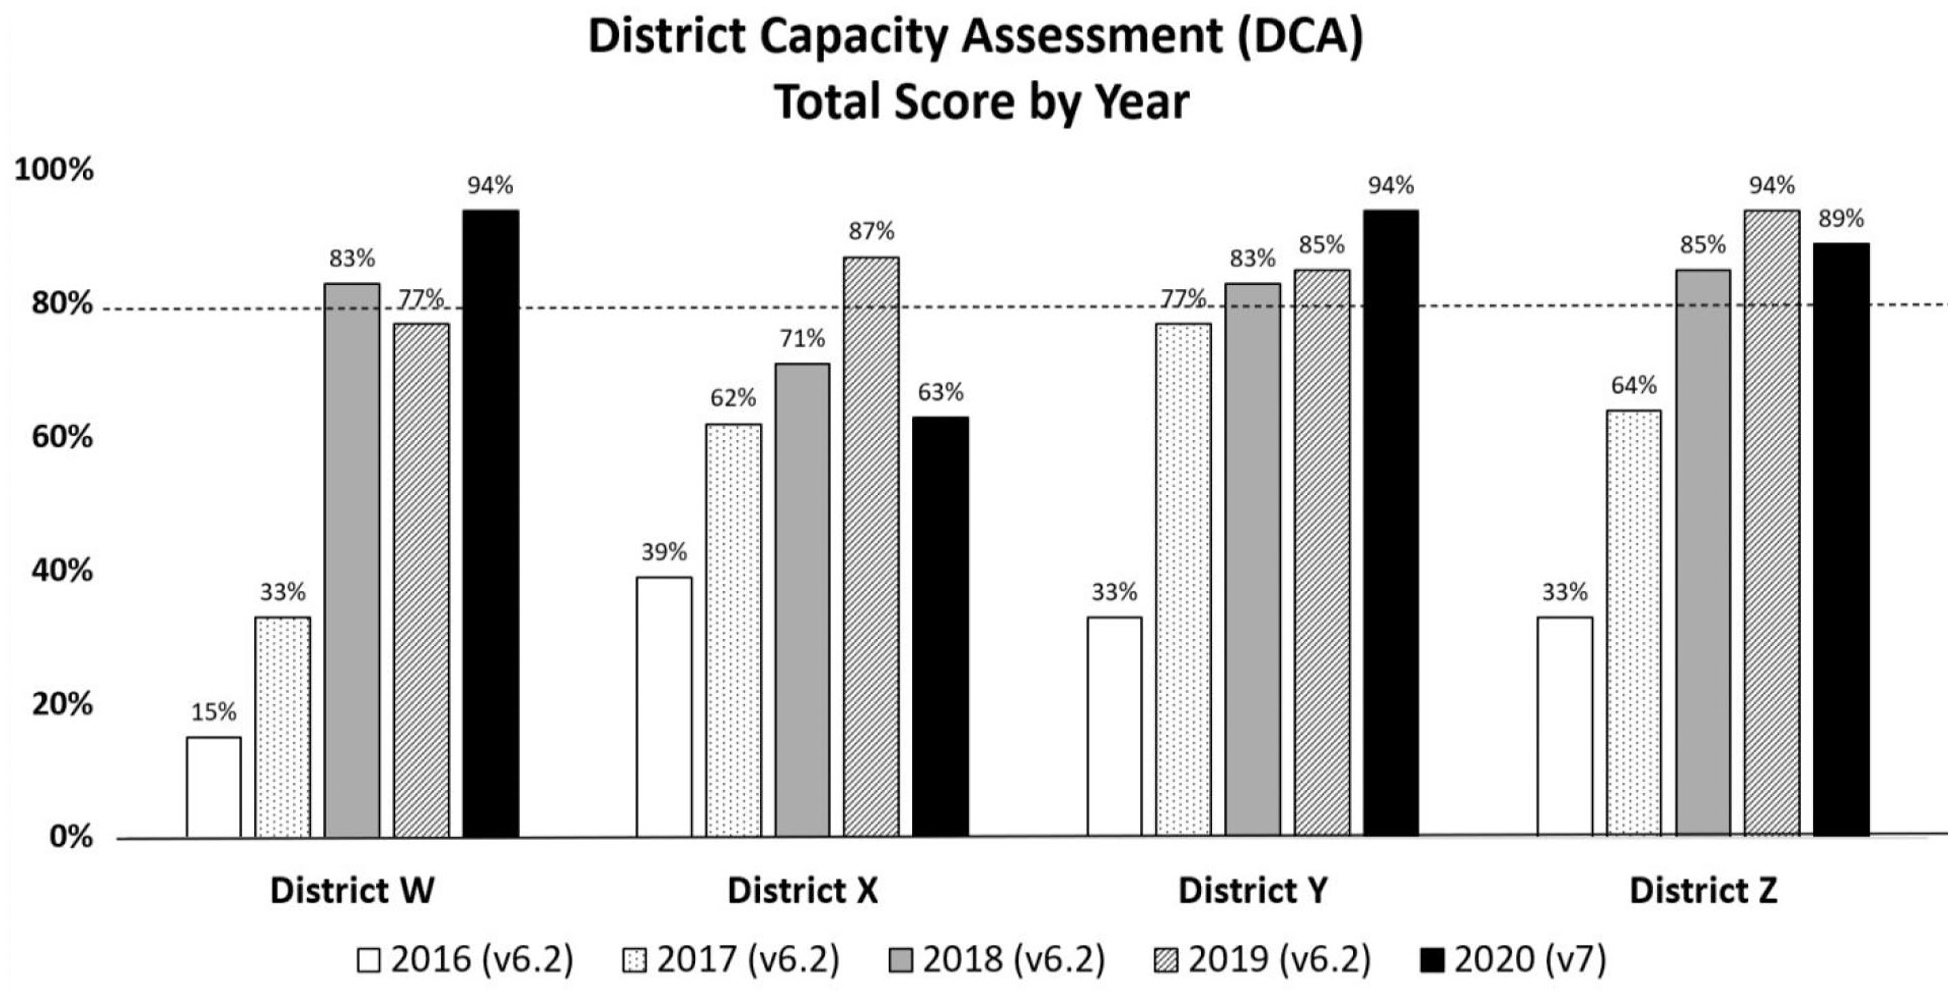
District capacity assessment results.
Fidelity
Results reflect improvement in the adherence to the four components of C&C (i.e., mentor, check, connect, and engage family) as indicated on the C&C Self-Assessment and the C&C Mentor Practice Profile. By Year 4, most mentors reported completing the required components of “Check” and “Connect” on a regular basis on the Self-Assessment. Specifically, for the Mentor component, the percentage of mentors reporting the component to be in place with evidence increased over time (Year 1 = 45%, Year 2 = 40%, Year 3 = 71%, Year 4 = 78%). This growth was also seen for percentage of mentors reporting the Check component to be in place with evidence (Year 1 = 47%, Year 2 = 68%, Year 3 = 79%, Year 4 = 91%). The Connect and Engagement components also saw growth over time but are still noted as areas of improvement for some mentors. Specifically, for the Connect component, the percentage of mentors reporting the component to be in place with evidence grew from 40% in Year 1% to 67% in Year 4 (Year 1 = 40%, Year 2 = 29%, Year 3 = 45%, and Year 4 = 67%). For the Engagement component, 6% of mentors in Year 1 reported this component to be in place with evidence. By Year 4, 56% of mentors reported this component to be in place with evidence (Year 1 = 6%, Year 2 = 30%, Year 3 = 44%, Year 4 = 56%). Some variability was seen in data due to an increase in the number of mentors providing services and the wide range of mentor experience providing C&C services (i.e., novice to 2 or more years of experience).
On the C&C Mentors Practice Profile for 54 mentors across four partner districts in Years 3 and 4, 41% of mentors rated themselves proficient on 8 or more of the 10 practices at time two administration. This was an increase of six percentage points from the first administration. In general, data from these two measures (C&C Self-Assessment and Practice Profile) suggest mentors are becoming more proficient.
Scale
From Year 1 to Year 2 of initial implementation, there was a 77% increase in the number of African American and American Indian SWD receiving C&C services. There was a 78% increase in the number of trained mentors. By the end of the first academic year in which students were being served, 48 students were served by 12 mentors across 12 schools within the four LEAs. This increased to 209 students served by 55 mentors across 12 schools by February of the subsequent academic year. In Years 3 and 4, there has been an 11% decrease in the total number of students being served, which is primarily due to one district’s change in their mentor model and capacity to serve students (n = 185). Three districts have continued to increase the number of mentors trained in anticipation of scaling services within current schools and adding new schools to the Check & Connect program. As a result of turnover in mentors, the district is planning to change the type of mentor used, from volunteers to permanent employees, to improve sustainability and maximize the efficient use of training and coaching resources.
Graduation Rates
A review of the 6-year graduation rate for Black and American Indian SWD indicated that the SEA met the statewide SSIP goal for Year 4 (i.e., 1% increase per year; statewide baseline data in 2013 was 53.1%, increased to 58.9% in 2019). The baseline graduation rate in 2013 for the four participating districts was 47.6%, and this increased to 57.0% in 2019. Graduation outcomes will cascade over time and extend beyond the SSIP time frame (2015–2021). Early examples of successful graduations have occurred on a small scale. These data are included in 4-year graduation rates in 2017 and 4- and 5-year graduation rates in 2018. Since the SIMR is based on 6-year graduation rates, the first small-scale results supported by this project will contribute to 6-year graduation rates in 2020. The window for state-wide impact (i.e., graduation rates showing up in the SIMR) will be from 2020 to 2023. While promising, we understand these remain preliminary results. We anticipate long-term impact on targeted outcomes in 2022, after C&C has been in place over time, with fidelity, and at scale.
Discussion
Summary and Limitations
The project has entered Full Implementation and will require continued investment in improvement informed by implementation capacity growth, practice fidelity, and outcome data over the next several years. Once we can establish that a sufficient number of students are receiving and benefiting from the EBP, we can then evaluate the effectiveness and efficiency of this comprehensive approach to achieve student outcomes at scale. To assist with this, additional qualitative data are being collected by external program evaluators (e.g., focus group interviews with LEA team members were transcribed to identify common or repeated themes) as part of a broader program evaluation.
Several limitations exist for this implementation demonstration. For future research, additional rigorous testing of the AIFs’ validity, and other models of implementation science, in education is needed to continue expanding knowledge about the value of implementation science for the promotion of EBPs in education. Also, continued validity studies of the implementation capacity measures (DCA and RCA) and fidelity measures are needed to explore their use and efficacy in education. Finally, evaluation of the resources necessary to apply the AIFs within the context of low-resource settings (e.g., rural, limited district funding) is warranted for continued learning and generalizability. The current project was strategic in aligning and leveraging current efforts and resources (e.g., grant funds) and establishing a contractual agreement with the program developer (Horner et al., 2018). Given competing needs to use limited resources wisely, the value of this approach might also benefit from research that focuses on calculating the return on investment.
In summary, our data suggest that using the AIFs to guide capacity development of SEAs and LEAs supported the establishment of an implementation infrastructure for the use of EBPs. Evidence of effective implementation of the selected EBP, C&C, to positively affect student graduation rates is beginning to emerge. Sustained full implementation, as evidenced by continued implementation and outcome data as SEA supports lessen, will provide evidence of the sustainability of this type of model to affect graduation rates of Black and American Indian SWD.
Footnotes
Acknowledgements
The authors would like to acknowledge the Minnesota Department of Education’s Special Education Division, including Robyn Widley, Carolyn Cherry, MDE Implementation Team members, and participating district team members for their significant contributions and Karen Blase, co-founder of the National Implementation Research Network, for her relentless and effective support of implementation capacity development in education.
Declaration of Conflicting Interests
The author(s) declared no potential conflicts of interest with respect to the research, authorship, and/or publication of this article.
Funding
Preparation of this article was supported, in part, by a grant from the U.S. Department of Education, number H326K080001, Jennifer Coffey, Project Officer. However, the contents do not necessarily represent the policy of the U.S. Department of Education, and endorsement by the federal government should not be assumed. The funder had no role in writing the manuscript or the decision to submit it for publication.