
Abstract
Using restricted data from 2011 to 2014, this study examines whether neighborhood immigrant concentration and survey interview language are associated with participation in the National Crime Victimization Survey (NCVS). The findings show that survey participation in the NCVS during the study period did not differ appreciably among households and persons sampled from neighborhoods with larger shares of immigrants. This suggests that the NCVS can contribute meaningfully to knowledge about the relationship between neighborhood immigrant concentration and levels of crime, providing an important complement to studies based on crime data collected by law enforcement agencies. Interview language had a minimal impact on nonresponse among Hispanic respondents in the NCVS, but the study revealed much higher rates of nonresponse across waves among Asian household respondents who completed the NCVS in a non-English language, especially among those from neighborhoods with relatively low immigrant concentration. This suggests that greater translation support for Asian respondents could increase NCVS response rates. Replicating and extending our research with more recent NCVS data, and incorporating the new item on citizenship status, would be valuable given the continued growth in the immigrant population, increased share of immigrants who routinely speak a language other than English at home, and social and political changes that have corresponded with observed reductions in nonresponse in government-administered surveys. We encourage the Bureau of Justice Statistics (BJS) to facilitate such research by routinely making the restricted NCVS data available for researchers to use within the nation’s Federal Statistical Research Data Centers and by adding interview language as a permanent fixture of the data.
Introduction
The study of immigration and crime has emerged as a significant area of inquiry over the past few decades, with much of the research devoted to assessing the impact of neighborhood immigrant concentration on levels of crime. The collective conclusion that has emerged from that research is that immigrant neighborhoods exhibit crime rates that are, on average, slightly lower than rates observed in other neighborhoods (Ousey & Kubrin, 2018). The underlying research on which that conclusion is based is sophisticated in several respects, but almost all of it has relied on data from the Uniform Crime Reporting (UCR) program, which reflects crimes reported to and recorded by local law enforcement agencies. Although the UCR Summary System and its replacement—the National Incident-Based Reporting System (NIBRS)—are valuable components of the nation’s crime data infrastructure, research suggests that residents of immigrant communities may be reluctant to report crimes to police (Gutierrez & Kirk, 2017; Xie & Baumer, 2019). That possibility highlights how the exclusive use of data collected by the police may yield an incomplete portrait of the relationship between neighborhood immigrant concentration and crime. Alternative data collection systems, such as the National Crime Victimization Survey (NCVS), may offer an important complementary data source. Yet, fundamental questions also arise about the utility of the NCVS for measuring crime experienced in immigrant communities. Perhaps most fundamentally, the NCVS could yield misleading results if neighborhood immigrant concentration strongly influences survey participation.
The pertinent theoretical and empirical literature supports the possibility that residents of immigrant neighborhoods may be more, or less, likely to participate in government-administered surveys, and suggests that the language proficiency of sampled respondents—and ultimately, the language in which the survey is administered—could be a key consideration (National Research Council, 2013; Zhang et al., 2009). To the best of our knowledge, no research has examined these issues explicitly in the NCVS.
This paper breaks new ground by examining the influence of neighborhood immigrant concentration and interview language on participation in the NCVS. The study adds to existing knowledge about survey response patterns in the NCVS by highlighting previously unaddressed questions about the potential importance of neighborhood immigrant concentration and interview language. This is an important contribution because, as elaborated below, the theoretical literature suggests that neighborhood conditions, including levels of immigrant concentration, may influence survey participation (National Research Council, 2013). In addition, language barriers have been found to impact the quality of survey estimates (e.g., Panel Study of Income Dynamics [PSID], 2019; Sastry & Pebley, 2003; Sha & Gabel, 2020; Wenz et al., 2021). Although non-English interviews in the NCVS are relatively rare overall—about 4% of sampled person respondents (Bureau of Justice Statistics, 2014)—the data analyzed for this study reveal that they represent more than one-quarter of interviews among Hispanic respondents and about 8% of interviews among Asian respondents. Given that the U.S. population has become more ethnically diverse and multilingual over the past three decades (Frey, 2020), with the share of people speaking a language other than English more than doubling during the period (Dietrich & Hernandez, 2022), more attention should be given to language issues and their challenges in surveys conducted by federal and local governments and other entities. Doing so in the present study not only extends previous assessments of nonresponse in the NCVS (Zhang et al., 2009) but also contributes more generally to knowledge about how survey nonresponse patterns may differ among racial/ethnic minorities (Ahlmark et al., 2015) and non-English speakers (Kleiner et al., 2015; Wenz et al., 2021). Illuminating such patterns is important given that survey nonresponse may bias point estimates and inferences about observed relationships (Groves, 2006; Massey & Tourangeau, 2013; Schoeni et al., 2013).
The present study was facilitated by access to restricted-use NCVS data from 2011 to 2014, a period bookmarked by the first year that the U.S. Census Bureau began recording interview language for all sampled respondents and the last year that the language data were made available for the research. To orient the study within the literature, we first describe relevant features of the NCVS design, which illuminate the key forms of nonresponse examined in the study and how we integrate our focal independent variables—interview language and neighborhood (i.e., census tract) immigrant concentration—in the analysis. Next, we discuss the myriad ways that these factors may theoretically influence survey nonresponse, followed by a summary of empirical evidence from prior research. After then describing the data and methods, we present the results of our analysis and close by discussing their implications and important next steps.
Background
Research Context
Before delving into relevant theoretical ideas and their implications for the present study, it is useful to describe the critical features of our planned analysis, including the forms of survey nonparticipation we examine and how we integrate our key measures into the analysis. This research context is integral to framing the ways in which participation in the NCVS may be affected by neighborhood immigrant concentration and interview language.
The NCVS employs a rotating panel design, with sampled households and eligible people within those households scheduled for interviews every 6 months over a 3-year period (Bureau of Justice Statistics, 2014; Lynch & Addington, 2007). Within this design, we distinguish between two forms of possible survey nonparticipation among household and person respondents. Figure 1 illustrates these dimensions of nonparticipation in the context of households sampled for inclusion in the NCVS (Panel A) and persons within participating households who are eligible for the NCVS (Panel B).

Dimensions of Household and Person Noncooperation and Nonresponse in the NCVS.
As summarized in Panel A, sampled households may be absent from the data due to household noncooperation (i.e., a sampled household never participates) or because participating household representatives do not complete one or more planned interviews during their time in the sample due to household panel nonresponse (i.e., household respondents who complete one or more interviews may not respond to other scheduled interviews). 1 In both cases, administrators of the NCVS distinguish between three reasons that sampled households are not interviewed: (a) the interviewer was unable to find the housing unit or it could not be reached due to impassable roads, nobody was home to complete an interview despite multiple contact efforts, the household representative refused, or language problems interfered with the interview (i.e., Type A noninterviews); (b) the housing unit was vacant, unfit for occupancy, or under construction (i.e., Type B noninterviews); or (c) the housing unit selected was demolished, moved, or condemned (i.e., Type C noninterviews). 2
As documented in Panel B, there are also two ways eligible people (i.e., those aged 12 and older) within participating households in the NCVS sample may be absent from the data. Specifically, persons who are eligible for the NCVS may be absent from the data because (a) they are never interviewed (i.e., person noncooperation) or (b) they complete one or more interviews but not others for which they are eligible during their time in the sample (i.e., person panel nonresponse). For age-eligible persons within households, the NCVS distinguishes between exclusions due to the potential respondent (a) refusing to do the interview, (b) being unavailable, or (c) being unable to complete the interview.
We consider several factors that may affect survey noncooperation and panel nonresponse in the NCVS, but we are particularly interested in neighborhood immigrant concentration and interview language. We examine the influence of neighborhood immigrant concentration on both noncooperation and panel nonresponse. In contrast, because interview language is unknown for households and persons who never participated in the survey, we limit our assessment of its impact on panel nonresponse across interview attempts among participating households and persons.
We provide greater detail about the specific measures in the data and methods section of the paper, but it is instructive to highlight three key features of our approach before reviewing relevant theoretical and empirical literature. First, we integrate a broad multi-item indicator of neighborhood immigrant concentration designed to capture contexts of heavier recent immigration in which English language proficiency tends to be more limited. We do so because such contexts are likely to present greater challenges for survey administration compared with other types of immigrant areas (e.g., those with large shares of foreign-born residents who have been in the country for a relatively lengthy period and who tend to be fluent in English).
Second, the NCVS is produced in written form in two languages—English and Spanish—and where relevant, letters introducing the survey also are available in other languages (Chinese, Korean, Vietnamese, and Arabic). Field interviewers may use an interpreter to complete the interview in a non-English language, if necessary (Bureau of Justice Statistics, 2014, pp. 34–35). This may be accomplished through the use of an official interpreter, neighbor, household respondent, or other family member. For those unable to complete the interview in English, proxy interviews are permitted only with the presence of a suitable interpreter (Bureau of Justice Statistics, 2014, p. 33).
As documented in Table 1, most household and person interviews in the NCVS during the study period were conducted in English, but non-English interviews were almost twice as likely among Asian household and person respondents, and they accounted for 16.4% of all interviews of Hispanic household respondents and more than one-quarter of interviews completed by Hispanic respondents within those households. 3 Comparing these figures to data on language use in the American Community Survey (ACS) suggests that those who complete the NCVS in a non-English language are likely to be foreign-born with limited or no English language proficiency. Indeed, while a majority of foreign-born persons in the United States have reported having high-English-speaking ability (Gambino et al., 2014) and are likely to complete the NCVS in English due to their preference or because this represents the modal procedure for field representatives when feasible, the overall prevalence of non-English interviews in the NCVS data reported in Table 1 approximates the percentage of ACS respondents who speak English “not well” or “not at all” (Gambino et al., 2014). This apparent overlap between NCVS interview language and limited English language proficiency is germane to our thinking about how it may affect survey participation in the NCVS.
Interview Language Among Participating Households and Person Respondents in the NCVS, 2011 to 2014.

Third, we organize our analysis to consider patterns of panel nonresponse separately for respondents who identify as Asian or Hispanic. We do so because, as noted above, the opportunity to complete the NCVS from a translated written instrument, and the corresponding prevalence of non-English interviews completed in the NCVS, differ significantly across these ethnic groups. In addition, Asian and Hispanic respondents exhibit meaningful variation on many other attributes, including neighborhood residential environments (Iceland, 2009), which may yield different considerations when deciding whether to participate in the NCVS. 4
Theoretical Models of Nonresponse
Survey methodologists have emphasized three core theoretical arguments to explain individual differences in nonresponse: leverage-salience theory, social exchange theory, and social capital theory (National Research Council, 2013). Each of these perspectives may be useful for understanding the potential role of neighborhood immigrant concentration and interview language on unit noncooperation and panel nonresponse in the NCVS.
Leverage-salience theory and social exchange theory consider the decision of whether to participate in a survey to be a rational calculus of the potential costs and benefits of doing so (Groves et al., 2004; Maynard et al., 2010). Social exchange theory emphasizes noneconomic exchanges that yield different assessments of costs and benefits associated with “maintenance of tradition, conformity to group norms, and self-esteem” (Homans, 1958; National Research Council, 2013, p. 36), which can manifest in myriad ways in a survey setting, including the time demands of responding and trust and rapport with the interviewer and surveying organization. Leverage-salience theory emphasizes these costs and benefits as well, along with tangible economic incentives (e.g., cash, the possibility of winning a prize), and it considers the salience of different costs and benefits as an important determinant of the ultimate choice. Within this framework, the decision about participation boils down to the relative leverage of perceived costs and benefits and their salience to the potential respondent.
A third perspective emphasizes the importance of levels of social capital in shaping decisions about survey cooperation and response (Brick & Williams, 2013). This social capital theory of nonresponse highlights “the trust that people gain through productive interaction and that leads to cooperation” (National Research Council, 2013, p.33) as instrumental in shaping whether people feel compelled to participate in surveys. From this perspective, social capital has been conceived of as an attribute of both individuals (Heyneman, 2000; Letki, 2006) and social collectivities (Brick & Williams, 2013; Putnam, 1995). The core argument is that the degree of trust and cooperation people have in one another and in survey sponsors and administrators will be inversely associated with levels of noncooperation and nonresponse in surveys.
In summary, the perceived costs and benefits that potential respondents have when deciding whether to participate in a survey, along with considerations of trust that they have in relation to the administration of the survey, emerge as prominent themes within theories of survey nonresponse. As we elaborate next, applying these insights to the present study yields ambiguous predictions for how neighborhood immigrant concentration and interview language may impact survey participation in the NCVS.
The Potential Role of Neighborhood Immigrant Concentration and Interview Language
The literature is ambivalent about the anticipated impact of neighborhood immigrant concentration and interview language on participation in the NCVS. Furthermore, there are compelling reasons to suspect that the influence of these factors may differ among the two largest-growing ethnic groups in America (i.e., people who identify as Hispanic or Asian) and that the role of language may depend on levels of immigrant concentration in the neighborhoods from which respondents are sampled.
Interview Language
Some studies have documented higher levels of government trust and civic engagement among immigrants (Baldassare et al., 2018; Nowrasteh & Forrester, 2019). From the standpoint of social capital theory, this could translate into higher response rates in government surveys such as the NCVS among persons from immigrant neighborhoods and those with limited English language proficiency. Yet, sampled respondents in the NCVS who would need or desire to do an interview in a non-English language may be more likely to be transient residents who are less consistently tied to a single household, which could reduce their selection into surveys. In addition, such individuals are more likely to be undocumented and less likely to have attained citizenship (Capps et al., 2020), which may increase the potential (real or perceived) costs of participating in a government-sponsored survey. From a theoretical vantage point, these costs may be most salient among Hispanic immigrants, especially those with limited English language proficiency, as they have borne the brunt of contemporary law enforcement policies (e.g., 287g, Secure Communities) aimed at identifying and removing undocumented immigrants (Martinez, 2022; Massey, 2012). Furthermore, the potential suppression of survey participation among those with limited English language proficiency would be expected to be amplified in contexts in which there are relatively few immigrants, where a support structure for immigrants might be lacking and there may be greater incentives to avoid unnecessary contact with survey administrators who represent the government.
Although there has been attention in prior research on how interview language affects item nonresponse and other indicators of survey data quality (see Sha & Gabel, 2020; Wenz et al., 2021), to our knowledge relatively few studies have examined how interview language impacts unit nonresponse. Data from European nations suggest higher nonparticipation among immigrant populations (Font & Méndez, 2013), but there is less directly relevant research in the United States and the available information is less definitive. Evidence from the PSID indicates that foreign-born respondents are slightly less likely to participate in surveys than the native-born (PSID, 2019), but related research on patterns of nonparticipation by race-ethnicity suggests that observed differences by nativity status are likely to be contingent on a variety of factors, including the immigrant group under investigation, interview topic, mode of survey administration, comparison group used, and period of investigation (Griffin, 2012a, 2012b). Our analysis is sensitive to these contingencies in the context of a government-sponsored survey on experiences with criminal victimization.
Neighborhood Immigrant Concentration
Similar to the theoretical expectations summarized for interview language, there are logical reasons one could expect either higher or lower rates of unit noncooperation and nonresponse in neighborhoods with greater immigrant concentration. Many scholars have argued that contemporary immigrant neighborhoods are more likely than other areas to exhibit strong and cohesive social networks (Kubrin & Desmond, 2015; Portes & Rumbaut, 2006), a prediction for which there is some empirical evidence (Feldemeyer et al., 2019). Through the lens of social capital theory, this could yield higher rates of survey cooperation among sampled households and persons, and higher rates of panel response among participating persons, sampled from immigrant neighborhoods. However, several other forces could reduce survey participation in immigrant neighborhoods because they may elevate the perceived costs of doing so beyond the perceived benefits. These forces include contemporary law enforcement policies (e.g., 287g, Secure Communities) that have targeted immigrant communities, which could dissuade participation in government-sponsored surveys among residents due to fear of placing themselves or family members and friends at risk of deportation. In addition, compared to neighborhoods with predominantly native-born residents, areas with a relatively large share of immigrants could manifest with higher levels of survey noncooperation and panel nonresponse due to limited English language proficiency. This may be most likely to occur among Asians sampled in the NCVS due to the unavailability of a survey instrument translated into relevant languages.
The empirical evidence remains mixed about the role of neighborhood immigrant concentration on survey response patterns. Bates and Mulry (2011) report slightly lower mail response rates in the 2010 Decennial Census in census tracts with a larger share of foreign-born. Salvo and Lobo’s (2006) analysis of census microdata for the Bronx, New York, also indicates slightly lower rates of mail survey responses in the 2000 Decennial Census, but they do not find any such differences in the 2005 ACS conducted in the same area. In another study, Sastry and Pebley’s (2003) analysis of data from the Los Angeles Family and Neighborhood Survey (LA FANS) suggests that overall household survey cooperation is slightly lower in neighborhoods with a larger share of foreign-born persons. However, their analysis shows that nonresponse among persons from participating households in such areas is on par with patterns found in other neighborhoods.
The Present Study
We contribute to the literature on survey participation in the NCVS, and more generally, by examining: (a) whether neighborhood immigrant concentration is associated with household and person noncooperation and panel nonresponse and (b) whether interview language is associated with household and person panel nonresponse.
Methodology
Data
The study employed a restricted-use version of the NCVS that contains all public-use variables in addition to the interview language and geographic codes that identify the census tracts and counties from which cases were sampled. These geographic codes enabled us to link to the NCVS records data from the ACS, which is the source used to measure neighborhood immigrant concentration and several other geographic variables that serve as controls for the analysis.
Measures
We considered four main dependent variables that reflect the different ways sampled households and eligible person respondents may be missing from the NCVS. Each of the outcomes is a binary indicator, with values of 1 indicating noncooperation/nonresponse, and values of 0 indicating cooperation/response. In supplementary analyses, we also examined outcomes that incorporated information about the recorded reasons households or persons may be missing from the data. We reference the results of these analyses when they provide additional context about our core research questions.
Neighborhood immigrant concentration and interview language are the key explanatory variables considered. Neighborhood immigrant concentration is a multi-item index that combines six variables that define respondents’ census tracts: % foreign-born, % noncitizen, % recent immigrant (year of entry: 2000 or after), % who speak English “not well” or “not at all” at home, % Latino, and % Asian (alpha = .94). The measurement of survey language varies across the unique samples and outcomes examined, but in each case, we contrast interviews conducted in non-English (coded 1) with those conducted in English (coded 0). For the analysis of household panel nonresponse, the measure represents the language in which the household respondent completed their initial interview. For the analysis of person panel nonresponse, the measure represents the language in which the person respondent completed their initial interview. When analyzing Hispanics separately, non-English is defined as “Spanish.” For the Asian sample incorporated in our analysis, the majority of non-English interviews were conducted in Mandarin or Cantonese, with the next largest representation being Vietnamese and Korean. For the overall sample, non-English interviews may reflect a wide range of languages, but the vast majority are conducted in Spanish (Bureau of Justice Statistics, 2014).
The study also included several other attributes of individuals, census tracts, and counties as control variables, which have been shown in prior studies to be associated with survey participation among households and individuals (Brick & Williams, 2013; National Research Council, 2013). These measures are described in greater detail in the Appendix. Note that, because limited information is known about households and persons who never participate in the NCVS, our analysis of survey noncooperation includes only the census tract and county attributes. In contrast, our analysis of survey panel nonresponse among participating households and persons incorporates all of the control variables.
Samples
During the study period (2011–2014), there were 152,000 households targeted for inclusion in the NCVS, which defines the maximum sample for our analysis of household cooperation. The participating households were scheduled for a total of 414,000 potential interviews during the period, which serves as our maximum sample for the analysis of household panel response. Our assessment of person-level cooperation focuses on the 257,000 eligible persons 12 and older who resided within participating households. Finally, we analyze person panel response across the 679,000 possible interviews scheduled for participating persons during their time in the sample. We extend our analysis of household and person panel nonresponse by analyzing sub-samples of scheduled interviews with participating Hispanic and Asian household respondents (Hispanic = 47,000; Asian = 16,500) and person respondents (Hispanic = 99,500; Asian = 32,000).
Analysis Strategy
We modeled the impact of neighborhood immigrant concentration and interview language on survey participation among sampled households and eligible persons in the NCVS using multivariable logistic regression, which is appropriate given the binary dependent variables considered (Long & Freese, 2014). The models for panel nonresponse entail multiple observations per household/person, and standard errors are clustered accordingly to account for this form of nonindependence. We apply the statistical framework articulated by Mize (2019) for assessing potential interaction effects, comparing and testing for differences in marginal effects of the focal variables across theoretically relevant values of potential moderators (see also Mize et al., 2019).
Results
Table 2 shows univariate rates of household and person noncooperation and panel nonresponse in the NCVS during the study period. As revealed in Panel A, 19% of sampled households and 6.5% of eligible persons within participating households completed none of the scheduled interviews between 2011 and 2014. Because interviews may be attempted with sampled units and eligible participants at multiple time points within the panel design used in the NCVS, there may be multiple (and different) reasons for noncooperation for a given unit. Overall, during the period, unit vacancies and refusals contributed about equally to household noncooperation, while person noncooperation was mainly a function of eligible participants being unavailable to complete interviews.
Univariate Rates of Survey Noncooperation and Panel Nonresponse in the NCVS, 2011 to 2014.
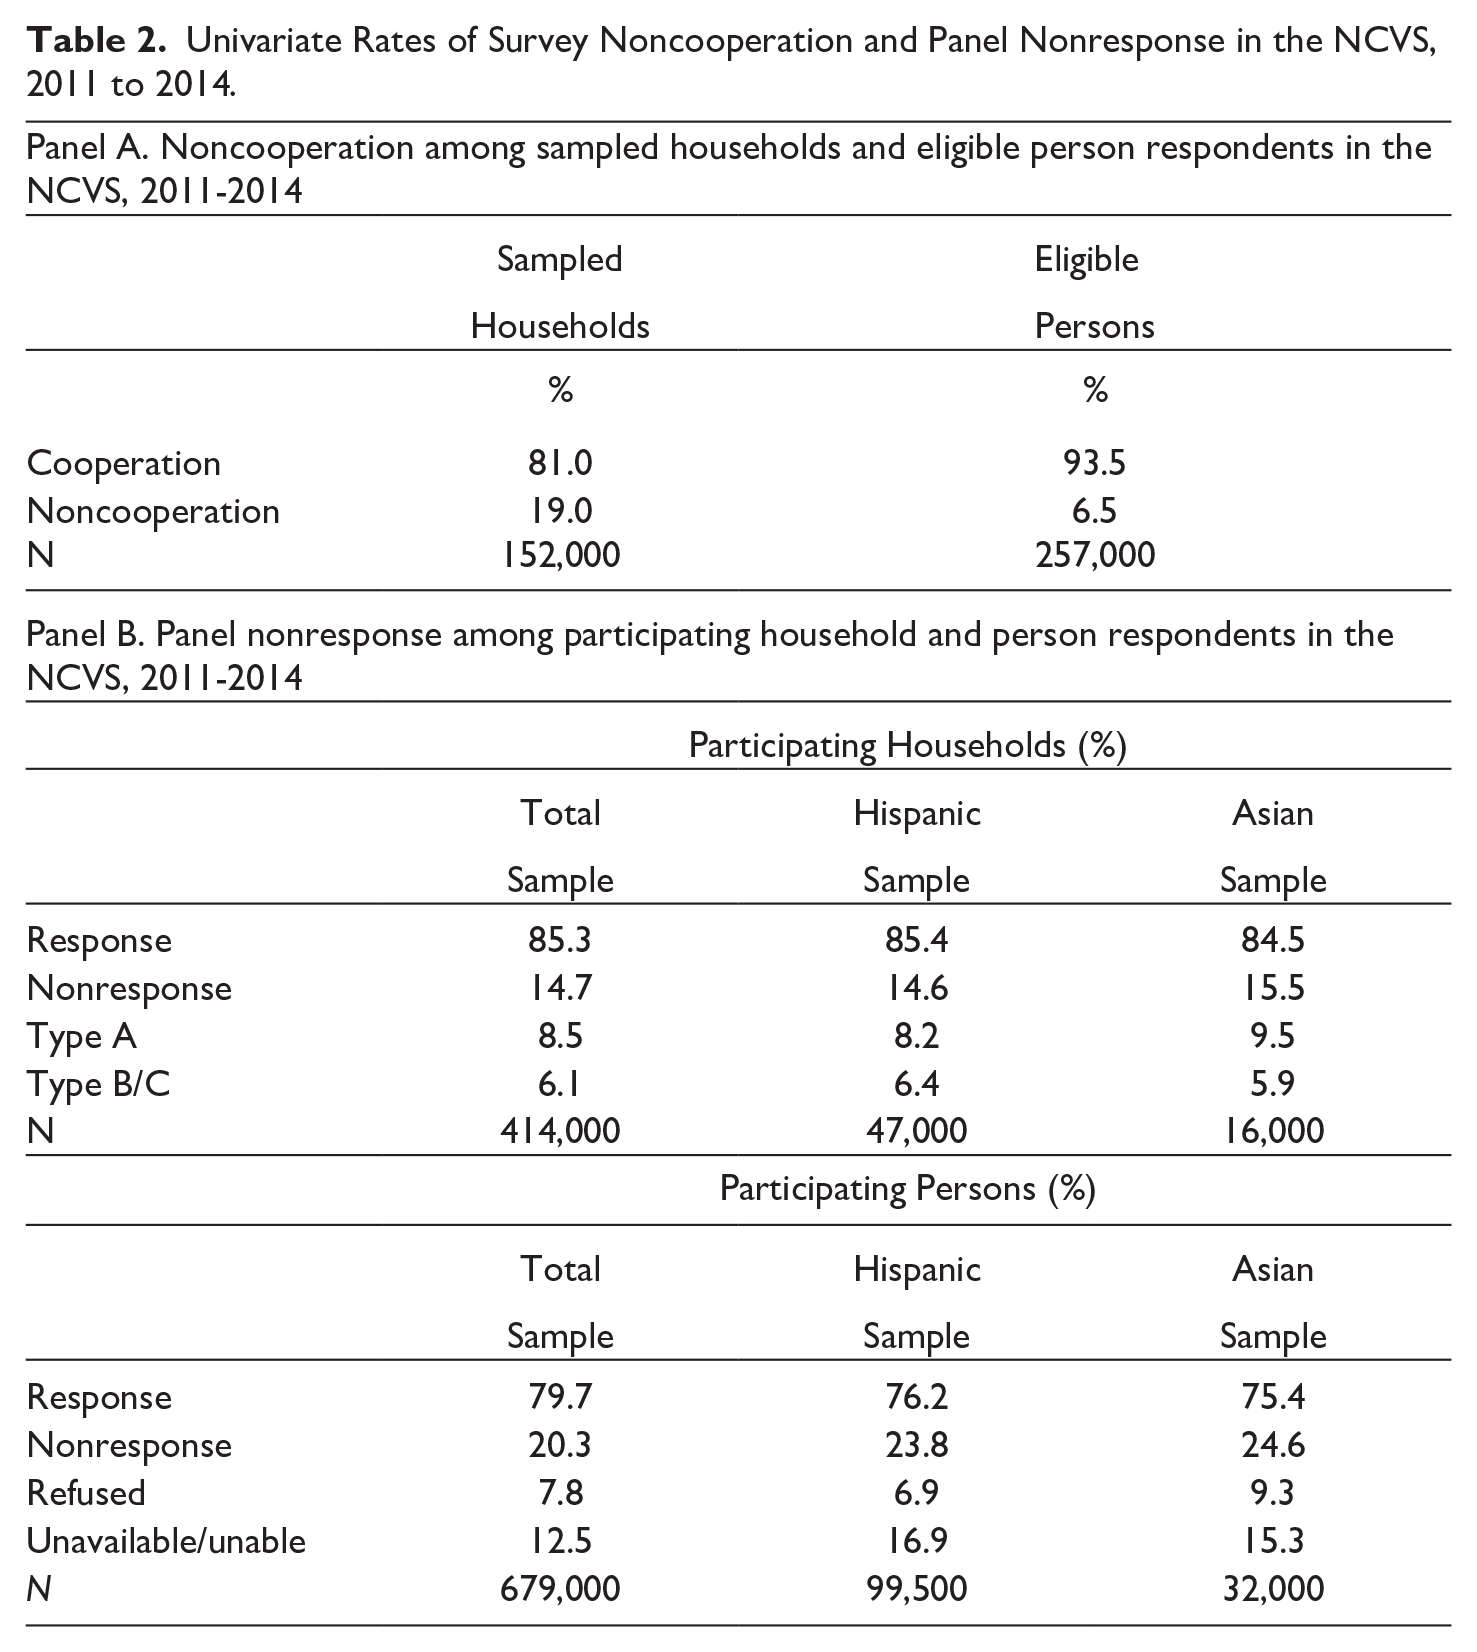
Panel B of Table 2 shows univariate rates of panel nonresponse among participating household and person respondents. Among participating households, the rate of nonresponse across potential interviews was about 15% overall, with comparable rates observed for both Hispanic and Asian household respondents. During the study period, Type A household nonresponses (e.g., nobody was home, or the household respondent refused) were slightly more common than Type B nonresponses, which mostly reflect instances where a housing unit was vacant (see, also, Bureau of Justice Statistics, 2014). 5 The rate of nonresponse across waves was higher among participating person respondents. Overall, 20.3% of eligible person interviews during the period resulted in a nonresponse, with somewhat higher rates observed for Hispanic (23.8%) and Asian (24.6%) respondents. The most common reason for nonresponse was a person being unavailable or otherwise unable to complete the requested interview.
The core issue addressed in the present study is whether participation in the NCVS is influenced by neighborhood immigrant concentration and interview language, which we examined in a series of multivariable logistic regression models that account for other potentially relevant factors. Table 3 presents the results for logistic regression models that document the association between neighborhood immigrant concentration and household (Model 1) and person (Model 2) noncooperation. Contrary to speculation about lower survey response rates in immigrant neighborhoods, the results show that household noncooperation is less common (Model 1) in such areas and that participation among eligible respondents is not significantly affected by levels of immigrant concentration (Model 2). An examination of the effect sizes indicates that neighborhood immigrant concentration has a minimal influence on whether sampled units are included in the NCVS: the corresponding estimated probability of household noncooperation in census tracts with very low immigrant concentration (10th percentile) is 19.7%, compared with 17.9% in census tracts with very high immigrant concentration (90th percentile).
Logistic Regressions of Nonparticipation Among Sampled Households and Persons in the NCVS, 2011 to 2014.

Note. AIC = Akaike information criterion; BIC = Bayesian information criterion.
p < .05. **p < .01. ***p < .001.
Table 3 shows that other geographic variables were significantly associated with whether households and persons participated in the NCVS, but only census tract vacancy rates exerted a substantively meaningful impact. To illustrate, while the overall rate of household noncooperation was 19% during the period (Table 2, Panel A), based on the estimates in Table 3, the predicted rate ranged from 13.5% among households in census tracts with very low vacancy rates (i.e., 10th percentile) to 24% among households in census tracts with very high vacancy rates (i.e., 90th percentile). Similar comparisons for the other geographic variables yielded much smaller differences (e.g., 1%–2%) in rates of noncooperation.
As noted above, because the NCVS uses a panel design, another form of nonresponse arises when participating household or person respondents do not respond to one or more of their scheduled interviews. We present the results of this form of household and person panel nonresponse for Hispanic and Asian respondents in Table 4. We focus on these two ethnic groups because they are much more likely than others to complete the NCVS in a non-English language and to live in neighborhoods with high levels of immigrant concentration (parallel results for the total NCVS household and person samples are provided in Online Supplement Table S1).
Panel Nonresponse Among Participating Hispanic and Asian Household and Person Respondents in the NCVS, 2011 to 2014.

Note. AIC = Akaike information criterion; BIC = Bayesian information criterion.
p < .05. **p < .01. ***p < .001.
Models 1 and 2 of Table 4 reveal that, for both Hispanic and Asian household respondents, survey panel nonresponse is significantly lower in immigrant neighborhoods and is significantly higher among those who complete an interview in a non-English language. While those patterns are counterintuitive on their face, extending the models to incorporate a product term between interview language and neighborhood immigrant concentration reveals a statistically significant two-way interaction that yields additional insights. The coefficients and standard errors for the interaction (not shown in tabular form) are not highly intuitive but following recommended practices (Mize, 2019; Mize et al., 2019), we summarize the implied patterns by plotting predicted rates of household nonresponse among those who did an interview in a non-English language (vs. English only) from neighborhoods with very low (10th percentile) and very high (90th percentile) levels of immigrant concentration.
As shown in Figure 2, completing the NCVS in a non-English language increases nonresponse for Hispanic (Panel A) and Asian (Panel B) households, and in both cases, this is more likely among those who reside in neighborhoods with relatively few immigrants. The figure also shows that doing an interview in non-English is much more likely to translate into subsequent nonresponse among Asian household respondents (Panel B) than Hispanic household respondents (Panel A). This difference could at least partly be a consequence of the NCVS being translated into Spanish, but not languages that would more readily facilitate interviews with Asian respondents with limited English language proficiency (e.g., Mandarin, Cantonese, Vietnamese, and Korean). Additional analyses (not shown) indicated that the higher nonresponse rates observed for Asian household respondents in areas of little immigration are driven mainly by higher refusal rates, which suggests that greater translational support in such areas could be beneficial for boosting participation among those with lower English language proficiency.
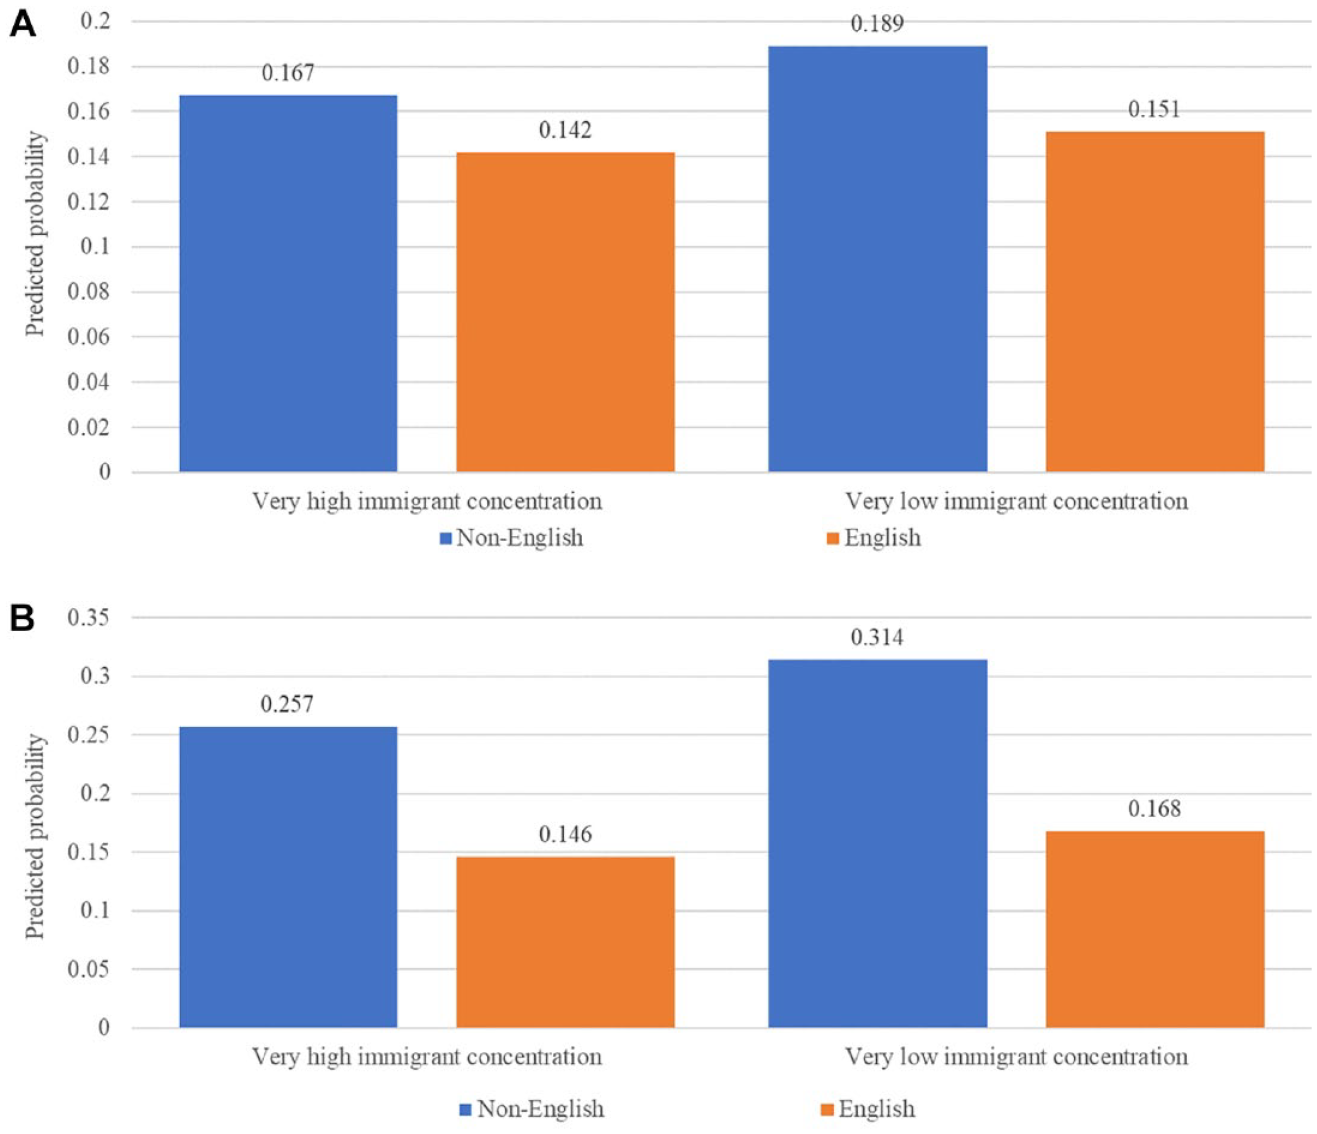
Predicted Probability of Nonresponse Among Household Respondents by Interview Language and Neighborhood Immigrant Concentration, NCVS 2011 to 2014. A. Hispanic household respondents B. Asian household respondents
Table 4 also presents results for panel nonresponse among eligible Hispanic (Model 3) and Asian (Model 4) person respondents in participating households. Overall, contrary to the results for household respondents, person nonresponse is not sensitive to levels of neighborhood immigrant concentration. In addition, overall, completing an interview in a non-English language increases nonresponse among Hispanic (Model 3) but not Asian respondents (Model 4). However, supplementary analyses again show more nuanced patterns, two of which are notable.
First, for Asians, there is a significant interaction between interview language and neighborhood immigrant concentration, which parallels the findings observed for Asian households. As summarized in Figure 3, while interview language is inconsequential for Asian response rates among those from neighborhoods with relatively high immigrant concentration, those from neighborhoods with relatively few immigrants who opt to do the NCVS in a non-English language exhibit significantly higher rates of nonresponse. This may reflect to some degree the increased challenges of finding a suitable translator to facilitate non-English interviews in such areas.
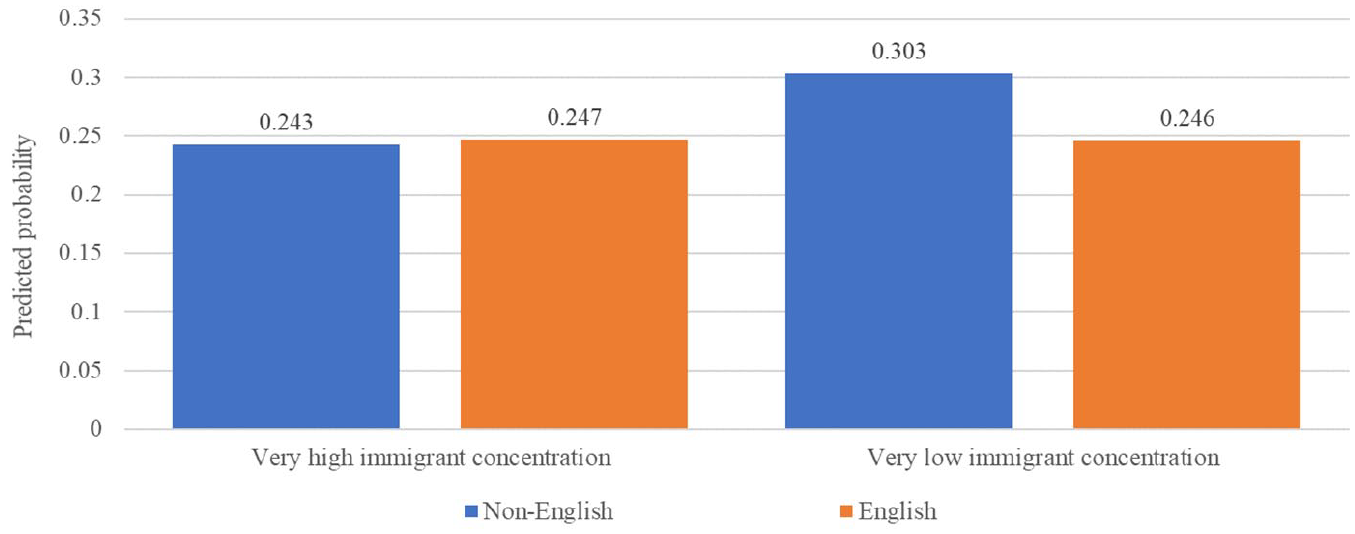
Predicted Panel Nonresponse Among Asian Person Respondents by Interview Language and Neighborhood Immigrant Concentration, NCVS 2011 to 2014.
Second, while the results in Table 4 indicate that completing the NCVS in Spanish increases subsequent nonresponse among Hispanic respondents overall, that finding masks divergent patterns across types of nonresponse (results not shown in tabular form). Specifically, as summarized in Figure 4, nonresponse due to refusals is slightly lower among those who complete an interview in Spanish, while nonresponse due to being unavailable is slightly higher among those who complete an interview in Spanish. The differences observed in Figure 4 are relatively small in both cases, but the noted divergence adds important context to understanding the source of the higher overall nonresponse observed among Hispanic respondents. 6
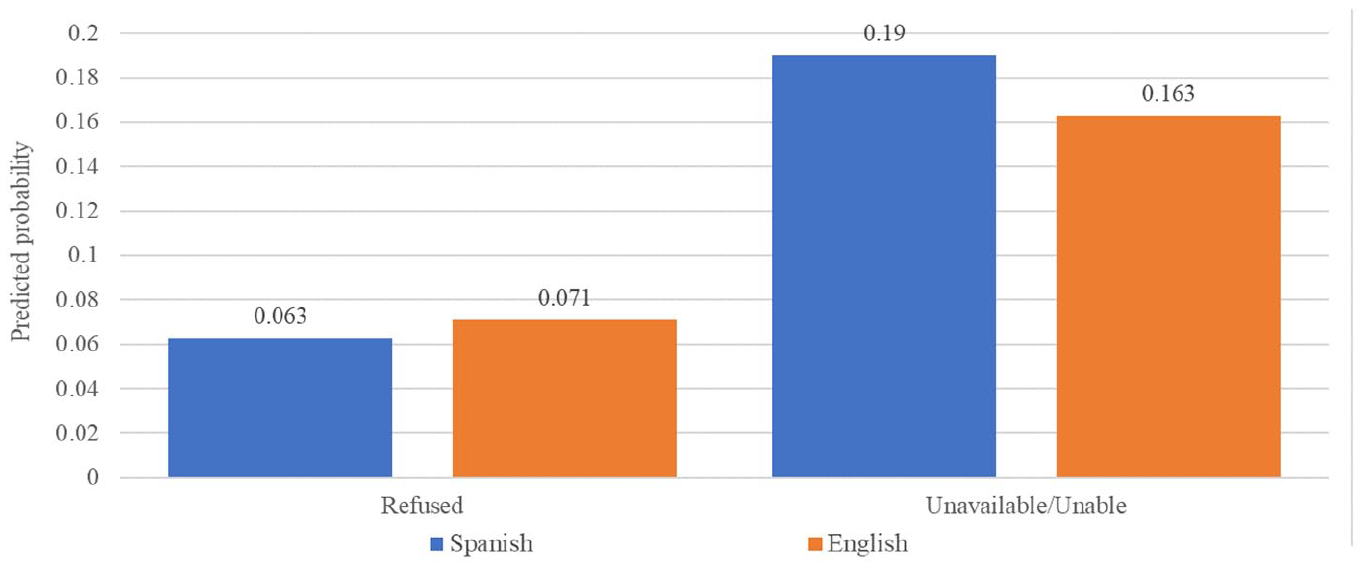
Predicted Panel Nonresponse Among Hispanic Respondents in the NCVS, 2011 to 2014, by Type of Nonresponse.
Discussion
This study examined the influence of neighborhood immigrant concentration and interview language on survey nonresponse in the NCVS. Increasing understanding of how these factors may affect survey response rates is critical given the substantial growth observed over the past several decades in the immigrant population and the share who routinely speak a language other than English at home (Dietrich & Hernandez, 2022; Frey, 2020; Migration Policy Institute, 2024).
Our assessment of restricted-use data from the NCVS revealed that rates of survey noncooperation and panel nonresponse during the study period (2011–2014) were very similar (i.e., within 1%–2%) in neighborhoods with a relatively small and relatively large share of recent immigrants with more limited English language proficiency. From a theoretical standpoint, this suggests that the cost-benefit calculation associated with survey response decisions is not strongly influenced by the share of immigrants in a community. More pragmatically, the limited impact of neighborhood immigrant concentration on survey response in our study affirms that the NCVS can contribute meaningfully to knowledge and ongoing debates about the association between neighborhood immigrant concentration and crime. Nearly all previous studies on the topic have relied on crime data gathered by the police, facilitated largely by crime reports made by the public (Ousey & Kubrin, 2018). That approach has most often shown lower crime rates in immigrant communities, but there is some uncertainty about the meaning of that pattern given that residents of communities with a large share of immigrants are less likely than others to report crimes to the police (Guttierrez & Kirk, 2017; Xie & Baumer, 2019). Meanwhile, research based on NCVS data also has revealed less crime in immigrant neighborhoods (Xie & Baumer, 2018), but as we noted at the outset, there is ambiguity about the meaning of that pattern as well, given the potential for lower rates of survey response in immigrant neighborhoods. Our findings show that such concerns are not substantial, lending support for the use of the NCVS as an important complement to police-based crime studies to examine the relationship between neighborhood immigrant concentration and crime. Indirectly, this bolsters confidence in prior evidence derived from the NCVS that reveals lower victimization rates among those who live in immigrant communities (Xie & Baumer, 2018), which in turn provides important external validation of similar findings that have emerged from studies based on data gathered by the police (Ousey & Kubrin, 2018). An important broader implication is that, while each of the nation’s two primary sources of crime data—the NCVS and data gathered by the police—has limitations and is subject to potential biases (Lauritsen et al., 2016), they reach the same general conclusion about the association between neighborhood immigrant concentration and crime: overall, there is slightly less crime in immigrant neighborhoods.
Our study also examined, for the first time, whether the language in which the NCVS is conducted affects nonresponse among participating household and person respondents. Although non-English interviews are relatively rare in the context of the full NCVS sample (Bureau of Justice Statistics, 2014), they are more common among Asian and Hispanic respondents. About 16% of Hispanic household respondents and 4% of Asian household respondents completed the NCVS in a non-English language during the study period. The use of non-English interviews is more pervasive among other members within participating Asian and Hispanic households, presumably because the household respondent may be selected in part because of their greater English language proficiency. During the study period, almost 8% of Asian person respondents and 26% of Hispanic person respondents completed the NCVS in a non-English language. The results show that interview language was consequential for patterns of panel nonresponse during the study period, though to different degrees among Hispanic and Asian respondents.
Hispanic household and person respondents who completed the NCVS in Spanish were only slightly more likely to exhibit nonresponse at other potential interviews during their time in sample. In contrast, during the study period, the data indicate substantially higher rates of nonresponse among Asian household respondents, especially among those from neighborhoods with relatively low immigrant concentration where it may be more difficult to locate suitable translators. Indeed, in such neighborhoods panel nonresponse was nearly two times higher among Asian household respondents who completed an NCVS interview in a non-English language (31.4%) than those who did not do so (16.8%). A similar, but less substantial, difference was observed among Asian person respondents within participating households from such areas who completed the NCVS in a non-English language (30.3% nonresponse) versus only doing so in English (24.6% nonresponse). An important implication of these findings is that greater translation support for Asian respondents with limited English proficiency may enhance NCVS response rates, especially in areas of relatively low immigration. This represents a unique survey challenge for administering the NCVS in an era where immigrants are increasingly geographically dispersed from traditional areas of immigration. In NCVS sample areas with many immigrants, it is sensible to employ multilingual field interviewers and there are also likely ample options for locating suitable translators to complete in-person interviews (e.g., neighbors). These options are less practical in areas of low immigration, but perhaps modern technologies that facilitate on-the-spot translation (e.g., artificial intelligence) could be added to the arsenal of tools available to field interviewers. In addition, the language in which previous interviews have been conducted could inform strategies employed when contacting respondents for subsequent phone interviews to ensure that the interview may be conducted in an appropriate language, if necessary.
While our study offers new insights about the role of neighborhood immigrant concentration and interview language on survey noncooperation and nonresponse, there are important limitations to acknowledge. One is that the data are a decade old, and since 2014, response rates in major government-administered surveys have further declined (Lauritsen, 2023; National Academies of Sciences, Engineering, and Medicine, 2023), including the ACS (United States Census Bureau, 2024) and NCVS (Krueger et al., 2023, p. 6), raising the need for analysis of more recent data. In addition, debates about immigration have intensified during the period, which could translate into lower rates of survey response among immigrants, and perhaps especially recent immigrants with lower English language proficiency. We are not aware of direct evidence that can speak to this, but it is noteworthy that a comparison of nonresponse patterns in the NCVS for 2017 (Bureau of Justice Statistics, 2018, p. 21) and 2022 (Krueger et al., 2023, p. 11) reveals that there have been increases in nonresponse among Hispanics in the NCVS. Thus, it would be valuable to reassess the findings that emerged from our analysis with more recent data.
A second limitation of our study is that, during the study period, the NCVS data did not include direct indicators of the immigrant status of respondents that could yield more nuanced information about survey response among sample members. Beginning in 2016, the NCVS began to record the citizenship status of respondents, distinguishing between U.S. citizens, naturalized citizens, and noncitizens. Although some research has examined patterns of missing data (i.e., item nonresponse patterns) for the new NCVS citizenship question (Xie & Baumer, 2021), to our knowledge, there has yet to be a detailed assessment of survey nonresponse (e.g., unit noncooperation and panel nonresponse) by citizenship status.
In conclusion, our study makes three important contributions: (a) it shows that survey noncooperation and nonresponse rates in the NCVS do not differ appreciably among households and persons sampled from neighborhoods with larger shares of immigrants; (b) it documents that panel nonresponse is only slightly higher among Hispanic respondents who complete an interview in Spanish; and (c) it reveals much higher rates of household panel nonresponse among Asian respondents who do the interview in a non-English language, especially within neighborhoods with relatively low immigrant concentration. The noted limitations of our study highlight the potential utility of reassessing patterns of noncooperation and nonresponse in the NCVS with more recent data. Integrating citizenship status with interview language and respondent race-ethnicity would yield a more comprehensive assessment of survey response patterns in the NCVS, while also enabling an examination of whether challenges associated with securing survey responses from those with limited English language proficiency have changed over the past decade. To facilitate such research, we encourage the BJS to add interview language as a permanent component of the restricted NCVS data and to regularly make the data available for researchers to use within the nation’s Federal Statistical Research Data Centers.
Such a commitment by BJS would represent an important contribution to broader efforts to forge a stronger national data infrastructure (National Academies of Sciences, Engineering, and Medicine, 2023).
Supplemental Material
sj-docx-1-ccj-10.1177_10439862241290351 – Supplemental material for Neighborhood Immigrant Concentration, Interview Language, and Survey Nonresponse in the National Crime Victimization Survey (NCVS)
Supplemental material, sj-docx-1-ccj-10.1177_10439862241290351 for Neighborhood Immigrant Concentration, Interview Language, and Survey Nonresponse in the National Crime Victimization Survey (NCVS) by Eric P. Baumer and Min Xie in Journal of Contemporary Criminal Justice
Footnotes
Appendix
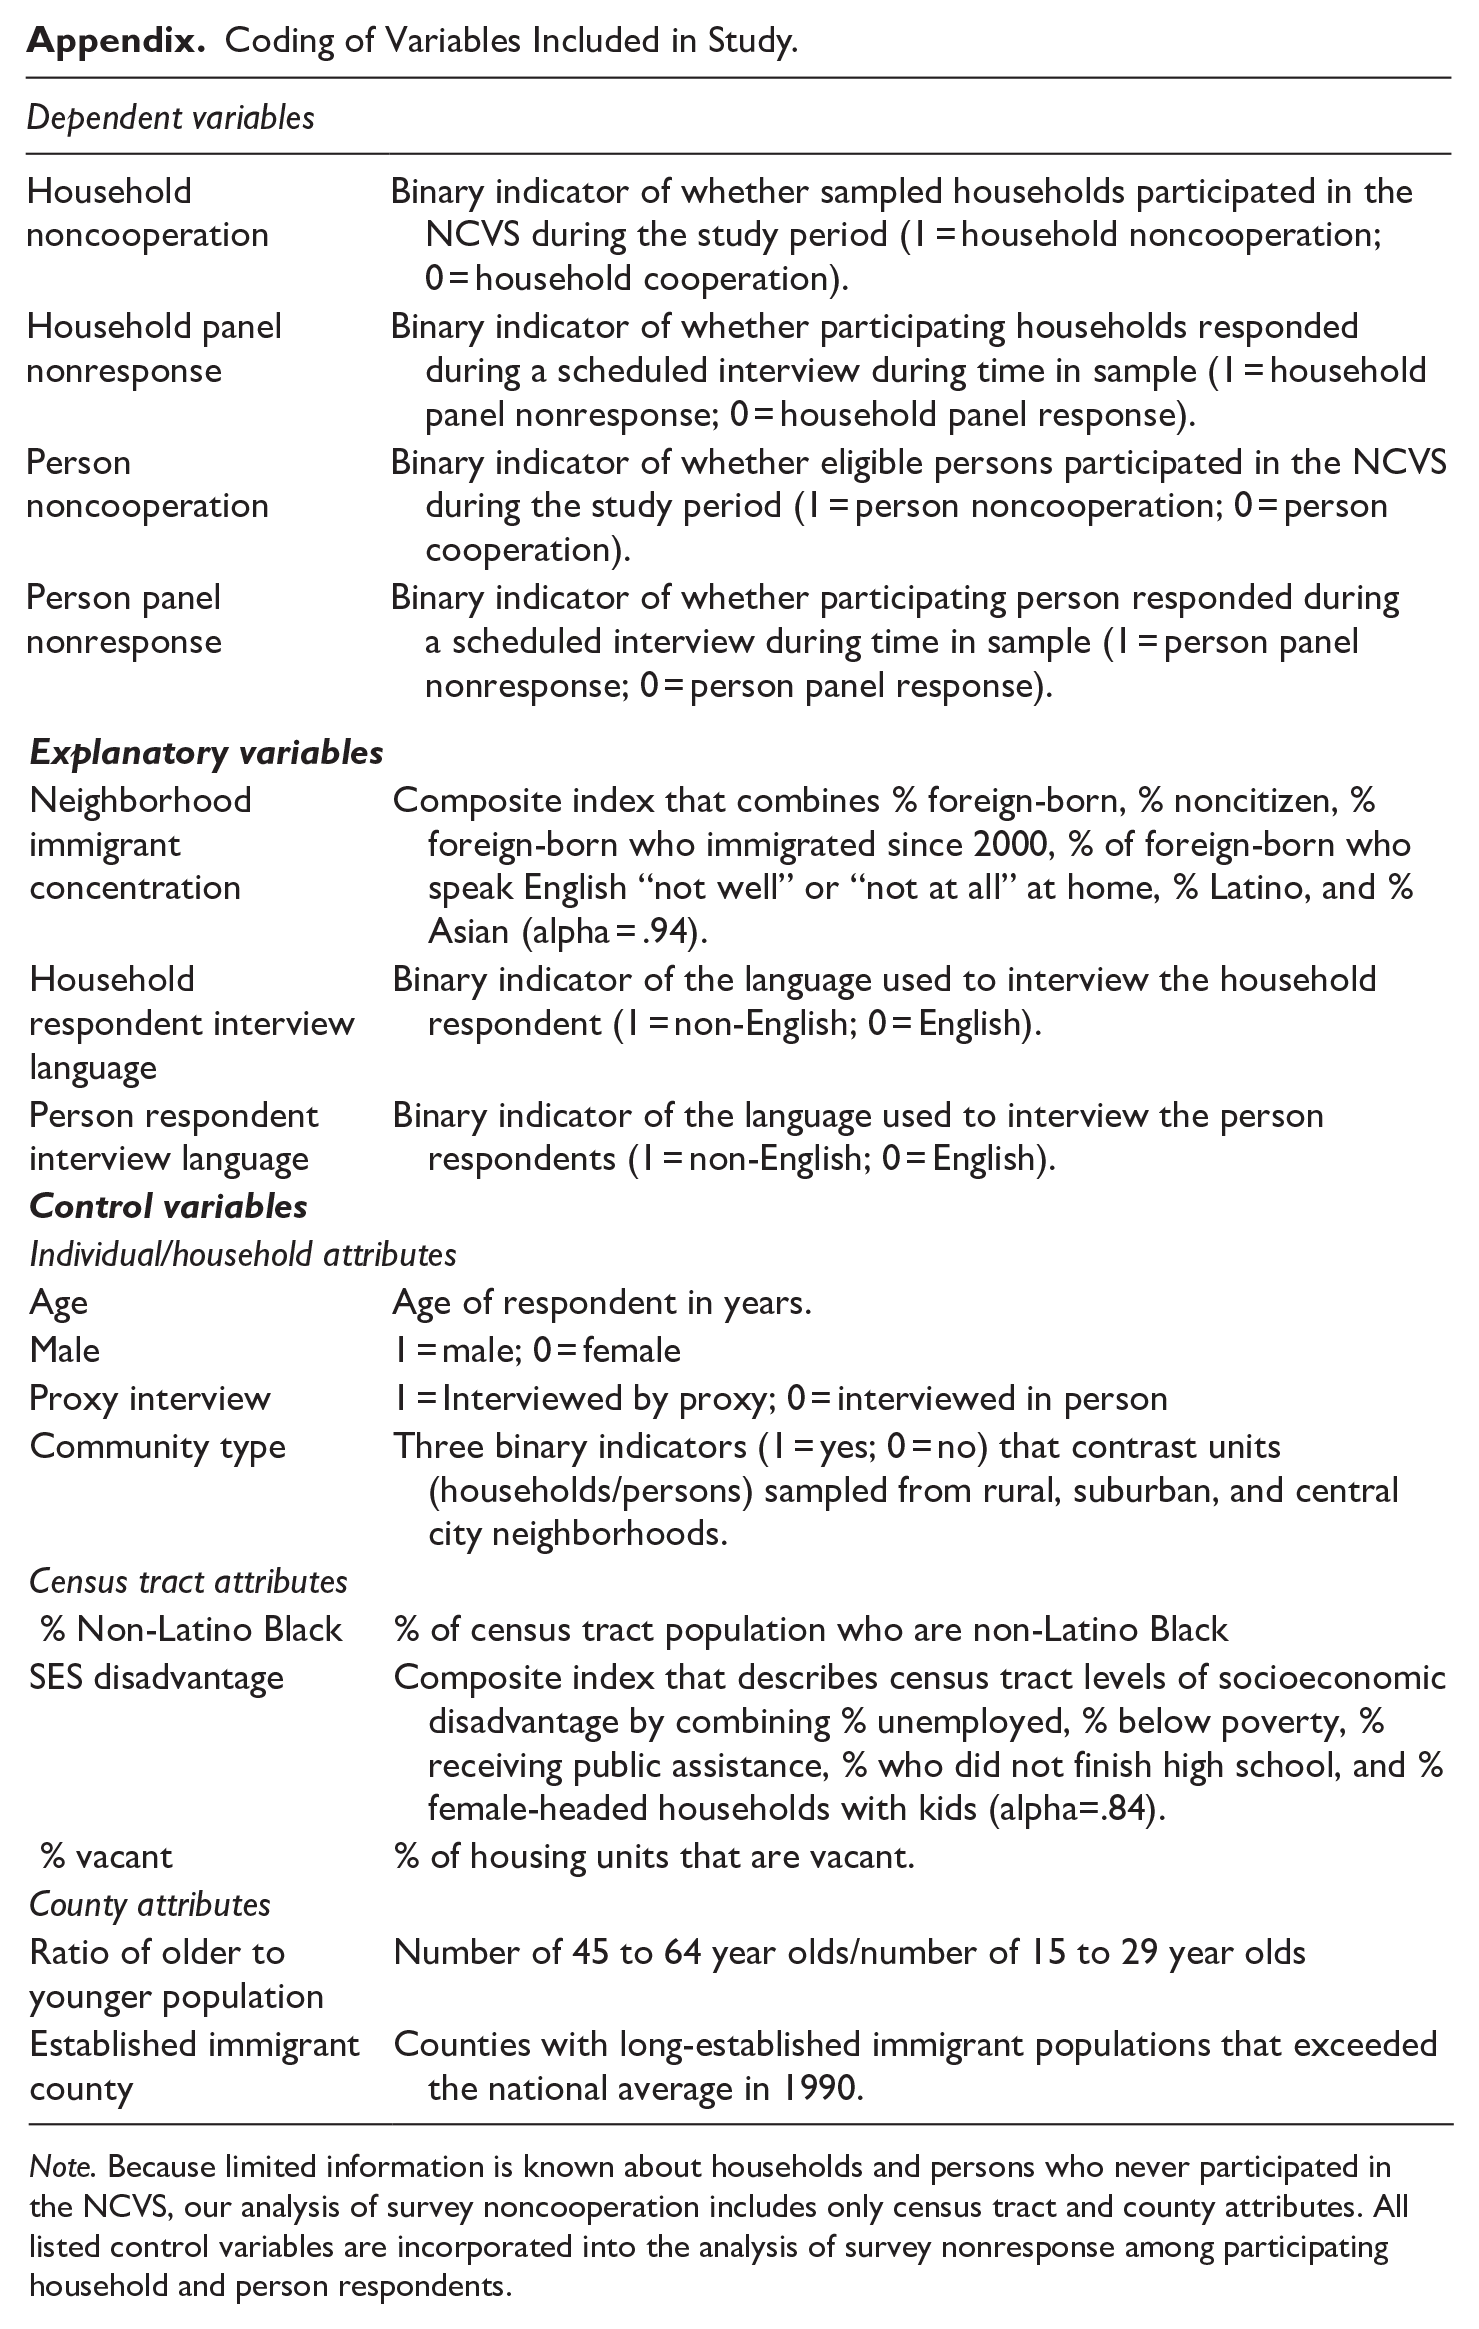
Coding of Variables Included in Study.
|
|
|
|---|---|
| Household noncooperation | Binary indicator of whether sampled households participated in the NCVS during the study period (1 = household noncooperation; 0 = household cooperation). |
| Household panel nonresponse | Binary indicator of whether participating households responded during a scheduled interview during time in sample (1 = household panel nonresponse; 0 = household panel response). |
| Person noncooperation | Binary indicator of whether eligible persons participated in the NCVS during the study period (1 = person noncooperation; 0 = person cooperation). |
| Person panel nonresponse | Binary indicator of whether participating person responded during a scheduled interview during time in sample (1 = person panel nonresponse; 0 = person panel response). |
|
|
|
| Neighborhood immigrant concentration | Composite index that combines % foreign-born, % noncitizen, % foreign-born who immigrated since 2000, % of foreign-born who speak English “not well” or “not at all” at home, % Latino, and % Asian (alpha = .94). |
| Household respondent interview language | Binary indicator of the language used to interview the household respondent (1 = non-English; 0 = English). |
| Person respondent interview language | Binary indicator of the language used to interview the person respondents (1 = non-English; 0 = English). |
|
|
|
| Individual/household attributes | |
| Age | Age of respondent in years. |
| Male | 1 = male; 0 = female |
| Proxy interview | 1 = Interviewed by proxy; 0 = interviewed in person |
| Community type | Three binary indicators (1 = yes; 0 = no) that contrast units (households/persons) sampled from rural, suburban, and central city neighborhoods. |
| Census tract attributes | |
| % Non-Latino Black | % of census tract population who are non-Latino Black |
| SES disadvantage | Composite index that describes census tract levels of socioeconomic disadvantage by combining % unemployed, % below poverty, % receiving public assistance, % who did not finish high school, and % female-headed households with kids (alpha=.84). |
| % vacant | % of housing units that are vacant. |
| County attributes | |
| Ratio of older to younger population | Number of 45 to 64 year olds/number of 15 to 29 year olds |
| Established immigrant county | Counties with long-established immigrant populations that exceeded the national average in 1990. |
Note. Because limited information is known about households and persons who never participated in the NCVS, our analysis of survey noncooperation includes only census tract and county attributes. All listed control variables are incorporated into the analysis of survey nonresponse among participating household and person respondents.
Declaration of Conflicting Interests
The author(s) declared no potential conflicts of interest with respect to the research, authorship, and/or publication of this article.
Funding
The author(s) disclosed receipt of the following financial support for the research, authorship, and/or publication of this article: This work was supported by the following entities: the Russell Sage Foundation (grant number 93-16-07) and the National Science Foundation (grant number 1917952).
Supplemental Material
Supplemental material for this article is available online.
Notes
Author Biographies
References
Supplementary Material
Please find the following supplemental material available below.
For Open Access articles published under a Creative Commons License, all supplemental material carries the same license as the article it is associated with.
For non-Open Access articles published, all supplemental material carries a non-exclusive license, and permission requests for re-use of supplemental material or any part of supplemental material shall be sent directly to the copyright owner as specified in the copyright notice associated with the article.