
Abstract
Chicago’s homicide arrest rate dropped from 91% in 1965 to 57% in 1994 and dropped still lower in recent years. This pattern mirrors the trend in the national homicide clearance rate. A plausible explanation for this great decline is the trend in homicide case mix, which arguably has made it intrinsically more difficult to solve homicide cases. Our analysis describes the change in case mix for the period 1965 to 2020 and analyzes the effect on the arrest rate for the first 30 years of this period, all by use of a unique homicide case microdata set. We document the large changes in case mix: for example, the percentage of all homicides in which a male victim was shot outdoors increased from 18% (1965) to 69% (2020). But the change in case mix does not account for Chicago’s great decline during the earlier decades, as we demonstrate by use of a novel arrest rate index. In fact, the arrest rates in each of the categories defined by location, sex, and weapon type exhibited similar declines through 1994. (Subsequent years of arrest data are unavailable for now.) Our preferred explanation for the great decline is that the operational standard for making an arrest increased during this period. That interpretation is well supported by evidence explaining the corresponding national trend, though direct evidence is lacking for Chicago. This interpretation challenges the use of the arrest rate as a police performance indicator and offers a positive interpretation of the great decline.
Overview and Motivation
In 1965, the Chicago Police Department (CPD) made an arrest in 91% of all murders and non-negligent homicide cases. Just 30 years later, in 1994, the arrest rate had dropped to 57%, and in subsequent years has dropped further. 1 There is no well-supported explanation for the 20th-century decline, but obvious reason for concern. A 34-percentage-point drop in the homicide arrest rate suggests a problematic reduction in the performance of the police with respect to the basic task of delivering justice to victims and their families. The decline may also have undermined public safety, since it suggests a sharp reduction in the likelihood of punishment and the corresponding preventive effects of punishment. But without a satisfactory explanation, it is premature to conclude that police investigations in 1994 or subsequently were inferior to an earlier era.
The remarkable decline in Chicago is not an isolated event. Indeed, the national homicide clearance rate in 1965 was 91%, and it too fell steeply till the end of the century. (“Clearance rates” are defined somewhat differently than “arrest rates,” but there is substantial overlap.) A recent analysis of this national trend serves as a companion to this report (Cook & Mancik, 2024). That analysis considers several possible explanations for the phenomenon, dubbing it the “great decline.” It is useful to conduct the same inquiry for Chicago; for one thing, we can utilize unique high-quality microdata, allowing a more reliable and fine-grained inquiry than is possible with available national data. Our results for Chicago are compatible with the national trends.
The most prominent line of inquiry in the criminology literature relevant to understanding the great decline focuses on the evolving mix of homicide cases (Alderden & Lavery, 2007; Ousey & Lee, 2010; Prince et al., 2021; Puckett & Lundman, 2003; Riedel & Jarvis, 1999; Wellford et al., 1999). For example, domestic homicides have a much higher solution rate than gang-related killings. The fact that nationwide (and also in Chicago) the prevalence of domestic homicides trended downward starting in the early 1960s, while the prevalence of gang killings increased, suggests that the average arrest rate would have declined even if the police performed equally well over time in investigating these two types of homicide. But the changing case mix, while real, does not appear to account for the national decline (Cook & Mancik, 2024). Attention to case mix in analyzing clearance rates is nonetheless justified, and indeed a logical place to begin.
The growing literature on how case mix influences homicide clearance draws on findings related to “solvability.” Several studies employ the same data set we use for the early years of our time series, namely the detailed data on Chicago homicides compiled by Richard and Rebecca Block for the years 1965 to 1995 (Alderden & Lavery, 2007; Block & Block, 2005; Jiao, 2007; Xu, 2008). We make several original contributions to the literature on Chicago homicide:
• Converting the Blocks’ data from victim level to incident level, and extending this series through 2020 by use of publicly available data from the CPD;
• Documenting the changing case mix for the entire period from 1965 to 2020;
• Documenting evolving patterns of “solvability” in the first three decades especially with respect to race and weapon type. The fact that the correlates of arrest are not entirely consistent over time may help explain some disparate findings in the literature;
• Defining and implementing an “arrest rate index” (ARI) that standardizes the observed arrest rate for case mix along three dimensions—weapon type, location, and sex of victim—thus answering the question of how observed arrest rates would have evolved if the case mix (so defined) had remained unchanged from the 1960s onward.
When we first undertook this analysis, we were able to combine the Blocks’ data for 1965 to 1995, with a similar data set made exclusively available to the University of Chicago Crime Laboratory by CPD. In August 2023, the new Chief Juvenile Court Judge of Cook County ordered a review of the agreement under which the Crime Laboratory could use these data for research purposes, and pending the outcome of that review banned the use of any records in the data set involving juveniles, either as victims or as arrestees. We were able to replace the protected data set with another CPD data set that is in the public domain, 2 and as a result are able to analyze the changing mix of homicides through 2020 for all homicide cases. Unfortunately, this public data set does not include arrest information. For that reason, our detailed analysis of homicide arrests only extends through 1994. Much of the great decline had occurred by then, so we believe that the analysis is useful.
Here is a brief recap of our findings. First, we document that the homicide arrest rate in Chicago did indeed decline sharply for the first 30 years of our time series. Second, the homicide case mix in Chicago has changed considerably with respect to such factors as location and weapon type. Yet the changing case mix accounts for little of the decline from 1965 to 1994. For example, outdoor shootings, which tend to have a relatively low arrest rate, became more prevalent—but it is also true that the arrest rate for just that category declined almost as much as for the whole. Third, our logit analysis of solvability documents a reversal in the influence of race: other things equal, cases with Black victims were more likely to be solved than others in the early years, but that pattern had reversed by 1990. Fourth, our ARI matches closely with the actual arrest rate until 1994, demonstrating that the changing case mix along the three dimensions we consider did not account for the drop.
Given that case mix does not explain the large decline in arrest rate from 1965 to 1994, what does? We discuss several possibilities and settle on the intriguing possibility that during that period homicide investigations became more lawful and the evidentiary standards for arrest were elevated. One test of this proposition is the trajectory of the likelihood of conviction given arrest. For much of this period, there are national data on the likelihood of a prison sentence given arrest; since most convictions (more than 90%) for murder and non-negligent manslaughter receive an active prison sentence, prison-admission data are almost equivalent to conviction data. The prison–arrest ratio trended strongly upward from 1970 to 2000 (Beck & Blumstein, 2012; Cook & Mancik, 2024; Travis et al., 2014), suggesting that the quality of arrests was increasing during this period. That result is a reminder that arrest is an intermediate step in the criminal justice system; to be fully successful, an investigation must end with a conviction. The arrest rate (or clearance rate) is at best a proxy for police performance, and a problematic one for understanding this history.
In what follows we begin with a discussion of the homicide arrest rate as a performance measure. Next, the section titled “Data and Empirical Strategy” describes the Chicago data and how it was processed. Subsequent sections utilize these data to document trends in homicide patterns (“Trends in Chicago Homicide”) and present a multivariate analysis of solvability. “Variation in Case Mix as an Explanation of the Trend in Homicide Arrest Rates” explains the ARI and compares its trajectory with that of the actual arrest rate. “Other Explanations” considers other explanations for the great decline. Our concluding section offers a bottom-line assessment about the performance of the CPD, with suggestions for future research.
The Homicide Clearance Rate as a Performance Measure
A primary responsibility for the police is to solve crimes, arrest culpable perpetrators, and prepare cases against them that will stand up in court. To the extent that the police are successful, the result is to prevent subsequent crime through several mechanisms: deterrence, incapacitation of active criminals, and preemption of retaliation.
Police departments and their leadership are often evaluated by the percentage of serious crimes that are “cleared” by arrest or exceptional means (Baughman, 2020). The downward trend in the homicide clearance rate over the last half-century suggests a decline in the performance of a key task. Recent research indicates that the police could solve more homicides through allocating more resources and making evidence-based reforms in organization, training, and investigation methods (Braga & Dusseault, 2016; Braga et al., 2019; Wellford et al., 2019). A low or declining clearance rate raises a legitimate question concerning the capacity and competence of any one police department, and given the national trend, of policing in general.
But rather than a decline in police competence to perform this task, the true explanation may be that the task has gotten intrinsically more difficult over time. Among the possibilities is changing case mix. Homicides differ widely with respect to “solvability.” A domestic killing often solves itself (i.e., a quick confession or suicide by the killer), while a drive-by shooting is typically much more difficult to solve. To the extent that the mix between easy and hard cases has shifted over time, the same police effort produces different results. The task may also have become more difficult due to elevated evidentiary standards for making an arrest.
As a result of these and other potentially confounding trends, it is possible that the decline in the clearance rate is not due to a decline in the performance of police departments in investigating homicides. A complete analysis of performance trends must account for external trends in crime, legal standards, and other external factors.
The clearance rate is not only used as a performance measure. It is also of interest as a measure of the likelihood that crime will result in legal consequences. A decline in the clearance rate suggests the possibility that would-be killers have less reason to consider the possibility that they will be punished. In the economics model of deterrence, the clearance rate (or arrest rate) has often been used as an indicator of the probability of arrest. But in that application as well, the clearance rate can be a misleading proxy for what we really want to know. The clearance rate is not the probability that a homicide will be solved, but rather the average of widely differing probabilities that depend on the specifics of the killing. In that respect, the clearance rate is greatly affected by case mix as between readily solvable homicides (such as those that involve intimate partners) and difficult-to-solve homicides (drive-by shootings) (Cook, 1979, 1980; Nagin et al., 2015).
Another problematic feature of using the arrest rate as a police performance measure is that an arrest does not necessarily demonstrate that the investigation was successful. It is quite possible that the wrong person was arrested, or that the evidence assembled by the police demonstrating that person’s guilt is too weak for prosecution purposes. In measuring police performance, a better end point than arrest would be conviction, but the relevant data are not generally available: Murder cases typically take years to dispose of, and in any event, court-disposition data are not routinely available. Even if the conviction rate is a more valid outcome, the use of an arrest rate (or clearance rate) for comparisons across agencies or over time can be justified if the ratio of convictions to arrests is constant. For much of the period that we are considering, however, the national ratio of convictions to arrests was increasing (Travis et al., 2014). In section “Conclusion,” we discuss that evidence and consider its implications. One reasonable conclusion is that the standard for making an arrest was trending upward. The result is both a decline in the arrest rate and an increase in the likelihood of conviction given arrest.
One lesson of this discussion of clearance rate is that for its credible use both as a performance measure and as a measure of the likelihood of legal consequences, it is essential to both adjust for case mix, and to consider other external factors that may be affecting the intrinsic difficulty of “success,” including the normative standards shaping investigation and arrest decisions.
Data and Empirical Strategy
For individual records of Chicago homicides occurring during the years 1965 to 1995, we utilize a well-known data set created by Richard and Carolyn Block, which includes the outcomes of police investigation (Block & Block, 2005). For the period 1996 to 2020, we utilize two data sets created from CPD records. 3 The first is a protected data set provided to the Crime Laboratory under a restricted data use agreement. As noted above, we are barred for the time being from using the data on cases involving juvenile victims or arrestees. It is technically possible to delete the data on cases involving juvenile victims, but not juvenile arrests; the result is that we make limited use of this data set in what follows. The second data set is in the public domain, housed in the Chicago Data Portal, and hence not restricted. It also provides detailed data on homicide cases but unfortunately without any information on arrest. For that reason, our analysis of arrest rates is limited to the Blocks’ data and covers the period 1965 to 1994. (We did not use the Blocks’ data set for 1995 for analyzing arrest patterns since some arrests for 1995 homicides occurred in 1996, after the Blocks stopped compiling these data.)
Data processing decisions were guided by the goal of making the Blocks’ data set consistent (“bindable”) with the CPD data sets. The supplemental appendix provides more detail about definitions and procedures (see Supplemental S.3 Data Documentation).
Data Processing
The data set for the years 1965 to 1995 was extracted and coded by the Blocks based on the Murder Analysis Reports maintained by the CPD Crime Analysis Unit since 1965 (Christakos & Block, 1997). The Blocks’ data are organized by homicide victim and include items on the demographic characteristics of the victim, the circumstances and location of the killing, the type of weapon, and the outcome of the police investigation.
The Blocks’ data set is available from the National Archive of Criminal Justice Data (NACJD) of the Inter-university Consortium for Political and Social Research (ICPSR) at the University of Michigan. The code book states that “to protect respondent privacy, certain identifying information is restricted from general dissemination. Specifically, day of death and day of injury were blanked and victim and offender ages were recoded to age categories for reasons of confidentiality.” 4 Moreover, the record division (RD) number of the case was also withheld from the restricted data. The data set excludes justifiable homicides. 5 It is unclear if involuntary homicides were also excluded; these homicides are dropped from the 1995 to 2020 CPD data sets that we bound to the Blocks’ data.
The Blocks’ data set is remarkably clean, but we did find a handful of inconsistencies among the 23,817 victim records. Details of how these were identified and rectified are included in the supplemental appendix.
Since our primary focus is on investigations, it was necessary for our purposes to use the incident or case as the unit of observation, even if there was more than one homicide victim in that incident. While the CPD data are readily organized by incident, that is not true for the Blocks’ data set, which has a record for each victim. Since there is no case ID included, it was necessary to find another way to match victims to cases. The Blocks did include a count of the number of victims in the incident associated with each victim record, and that provided an important clue in creating a file organized by incident.
We developed a unique case ID based on matching case characteristics with respect to month, year, time of day, district, type of place, clearance status, and number of victims. Victim records that have the same values in these fields are highly likely to be part of the same case. In a few instances, this process generated cases for which the number of victims was different than the victim count recorded in the relevant records; these instances were reconciled on a case-by-case basis (the details of this approach are provided in S.3 Data Documentation).
All three data sets include items for location but only the Blocks’ and protected CPD data provide information on the case circumstance/motive. We collapsed the numerous codes for each category to something manageable. Location was reduced to four bins: residence, indoor (away from residence), outdoor (away from residence), and vehicle transport. The circumstance category was reduced to five bins: gang/drug, domestic, altercation, robbery or other felony, and police/intervention or undetermined. These bins had a natural correspondence with the “motive” field in the CPD data. The similarities are documented in Supplemental Table A.8, and the detailed crosswalks for these variables are included in supplemental appendix, Supplemental Sections S.3.2 and S.3.6.
For the 726 incidents (1,655 victims) with multiple homicide victims in the Blocks’ data set, and for the CPD data sets, it was necessary to develop a simple coding scheme that would allow for the possibility that the multiple victims in a given incident had different characteristics. For example, a single drive-by shooting incident might result in the deaths of a Black man and a Hispanic girl. The same concern arises (albeit rarely) for location and weapon type. To code cases based on victim demographic characteristics, weapon type, and location, we used the following definitions, which apply to both single- and multiple-victim cases:
Weapon Type.
• Single binary variable, indicating whether at least one victim died of a gunshot wound
Sex.
• Single binary variable, indicating whether at least one victim is female
Youth.
• Single binary variable, indicating whether at least one victim is less than 15 years
Race. Four binary variables.
• White, if at least one White or Asian Pacific Islander/Other victim who is not Hispanic 6 ;
• Hispanic, if at least one victim is Hispanic and none are “White”;
• Black, if not White or Hispanic, and at least one victim is Black;
• Unknown, if all victims are of unknown race.
Location. Three binary variables
• Residence, if at least one victimization occurred inside a residence;
• Indoor away from residence, if not residence and at least one victimization indoors;
• Outdoor away from residence, if neither of the above and at least one victimization occurred outdoors. Victims who were in a vehicle at the time of the attack are included.
Circumstance: Five binary variables 7
• Gang or drug;
• Domestic;
• Altercation;
• Robbery or other felony;
• Undetermined or intervention.
The analyses that use circumstance indicators pulled from a binded data set of Blocks’ and protected CPD data. In compliance with the current restriction, this data set was filtered to exclude juvenile victims. This exclusion has implications for collapsing multiple-victim incidents to the case level because our processing decisions to preserve information (i.e., indicating “At least one female victim” in a case) are based on the remaining adult-victim data as opposed to the full sample of juveniles and adults.
Arrest Rate
The primary outcome measure used in our analysis is the percentage of homicide cases resulting in at least one arrest, regardless of when that arrest occurred. This measure differs in several ways from the Federal Bureau of Investigation (FBI) “homicide clearance rate.”
The FBI definition of case “clearance” for the Uniform Crime Reports is that a suspect has been arrested, charged and turned over to the court for prosecution—or that the case has been exceptionally cleared, meaning that the police have probable cause to arrest an individual but cannot do so for reasons beyond their control. The operational definition of the homicide clearance rate in the Uniform Crime Reports is the ratio of offenses cleared in a calendar year (regardless of when those murders occurred) to the number of homicide victims in that year (FBI, 2020) (note that if there is more than one homicide victim in a single incident, the FBI counts each victim as a separate “offense.”). For example, a suspect arrested in 2020 for a murder committed in 2019 would be counted toward the 2020 clearance rate.
Thus, the outcome measure used here, “arrest,” differs from the FBI clearance rate with respect to timing, and with respect to whether “exceptional clearances” are included (Jarvis et al. 2017; Riedel & Boulahanis, 2007). (The most common reason for recording an “exceptional clearance” in Chicago is that the prosecutor declined to prosecute the suspect despite what the police believe is a strong case.) There are also differences with respect to the unit of account: The FBI uses individual victims, while we use the homicide case. The case may include more than one victim, so there are fewer cases than victims.
To be precise:
FBI Homicide Clearance Rate, year t:
(homicide arrests and exceptional clearances, year t)/(homicide victims in year t)
Our Arrest Rate, year t:
(homicide cases in year t that resulted in at least one arrest)/(homicide cases in year t)
Logically, arrest is more closely related to crime prevention than is clearance, since exceptional clearances do not entail legal consequences. In any event, the police departmental use of “exceptional clearance” may be unreliable since there is some discretion in whether to code a case as exceptionally cleared, and varies widely in how it is used in practice. 8 It should be noted that arrest is primarily of interest because it is the precondition for conviction and punishment. Unfortunately, we lack information on the ultimate disposition of the case in court.
Analysis of the Effect of Case Mix On Arrest Rate
In this analysis, we seek to adjust the trend in arrest rates for intertemporal changes in the case mix. The literature on solvability in homicide cases identifies particular characteristics of a homicide case that are associated with or affect the ease of solution (Alderden & Lavery, 2007; Avdija et al., 2022; Jarvis et al., 2017; Prince et al., 2021; Wellford & Cronin, 2000; Wellford et al., 2019). These characteristics help answer the “who, where, and how” questions, and include weapon type, location, and demographic characteristics of the victim—all of which are almost always recorded regardless of the success of the investigation.
Other characteristics of a homicide also affect solvability but are often not known unless the investigation is successful. Among these characteristics are the victim–offender relationship, and the motivation for the killing. Since such items are not missing at random, they cannot credibly be used as an unbiased predictor of investigation outcome (Cook & Mancik, 2024; Trussler, 2010). For example, indicators for gang involvement or intimate partner violence may reflect rather than just predict the success of the investigation. If the investigation had been unsuccessful, it is more likely that the circumstances would have been coded as “undetermined.” In what follows, we do not use such circumstance codes as predictors, but do document their statistical relationship to the more reliable “who, where, and how” variables.
Trends in Chicago Homicide
Homicide rates have varied widely in Chicago since 1965. We begin by depicting the overall count from two sources: CPD data and data from the National Vital Statistics System (VS). The CPD and VS series serve as a check on each other, although there are minor differences in definition; most importantly, the VS data count homicide victims who are Chicago residents (regardless of the location of the killing), while the CPD data count homicides that occur within city limits (regardless of the victim’s place of residency). The two series, depicted in Figure 1, are very close for most of this period, but during the decade 1973 to 1982, the two series diverge. They follow different trends and exhibit annual gaps ranging up to 200 victims (in particular, the peak in the CPD data in 1974 has no counterpart in the VS data, while the peak circa 1980 in the VS data is scarcely visible in the CPD data). We have no explanation for the disparities during that one decade. The close correspondence for the remaining 46 years before and since that decade is reassuring. We proceed on the assumption that the CPD data are accurate.
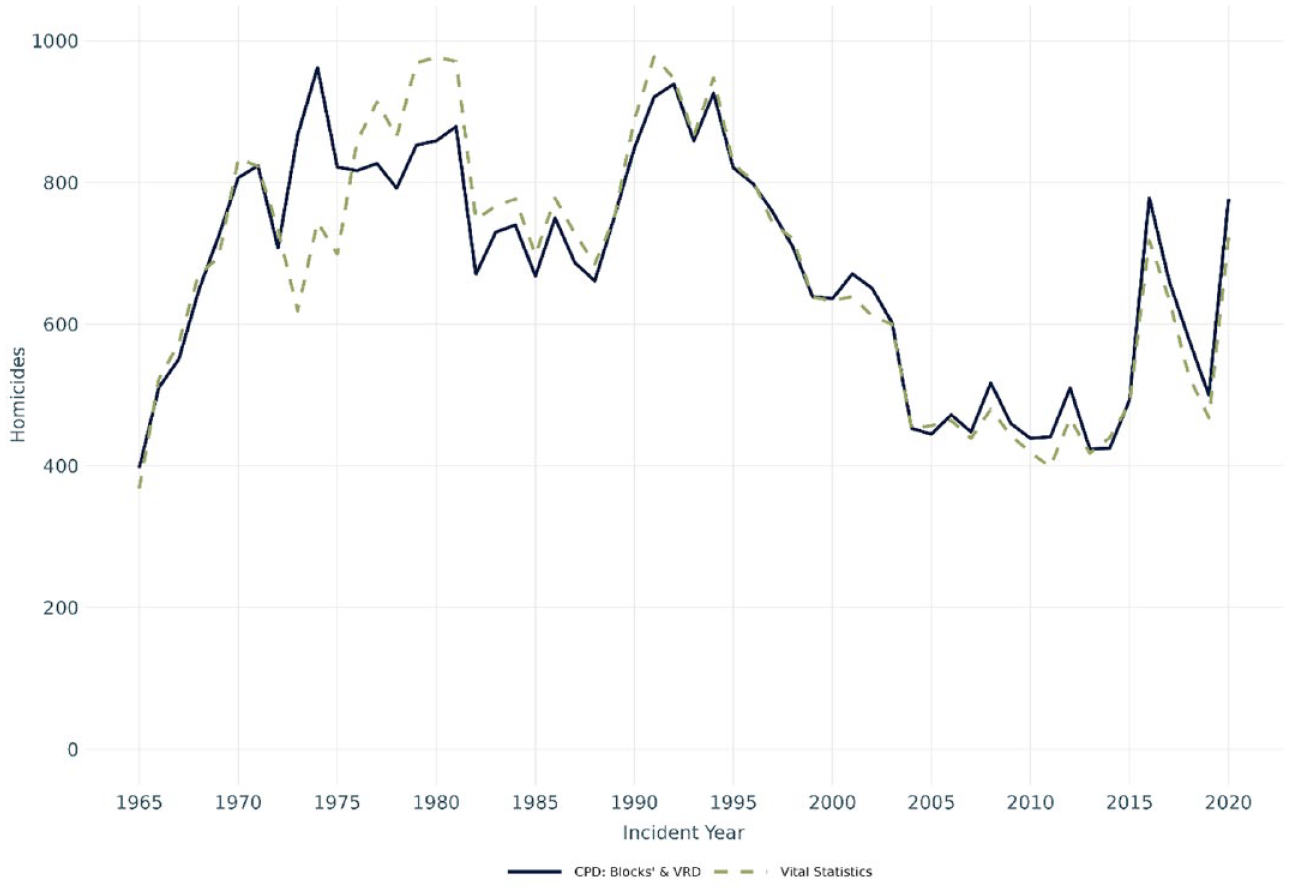
Chicago Homicide Offense Comparison, 1965 to 2020.
Figure 2 plots the CPD homicide rate adjusted for the city’s resident population. 9 The second line plots the national homicide rate, multiplied by 3. As shown, the homicide series in Chicago has a similar pattern to the national series, though the Chicago homicide rate is persistently about three times the national rate. The notable features of this series can be briefly characterized (Braga & Cook, 2023). The surge in homicides in the 1960s and early 1970s is associated with the heroin epidemic. After a brief lull, there was a subsequent surge associated with the powder-cocaine epidemic. Crack arrived in Chicago in the late 1980s (later than in the coastal cities); in Chicago as in the nation, the homicide rate peaked in the early 1990s (Cork, 1999; Hagedorn, 2006). It should be noted that the peak homicide rate in the early 1990s is close to the peak homicide count, which is noteworthy since the city had lost 600,000 residents since 1970. The “great crime drop” began in Chicago in 1995, in sync with national trends, and ultimately reduced the homicide count to less than half its peak level. That relatively peaceful period ended in 2016 with a large spike in homicide, repeated in 2020—both associated with the civil unrest following much-publicized homicides by police. 10 For the entire period, the homicide count ranged from 372 (1965) to 921 (1974), with the counts in 1991 to 1994 close behind that peak. Obviously, the overall workload for homicide detectives varied widely during this period.
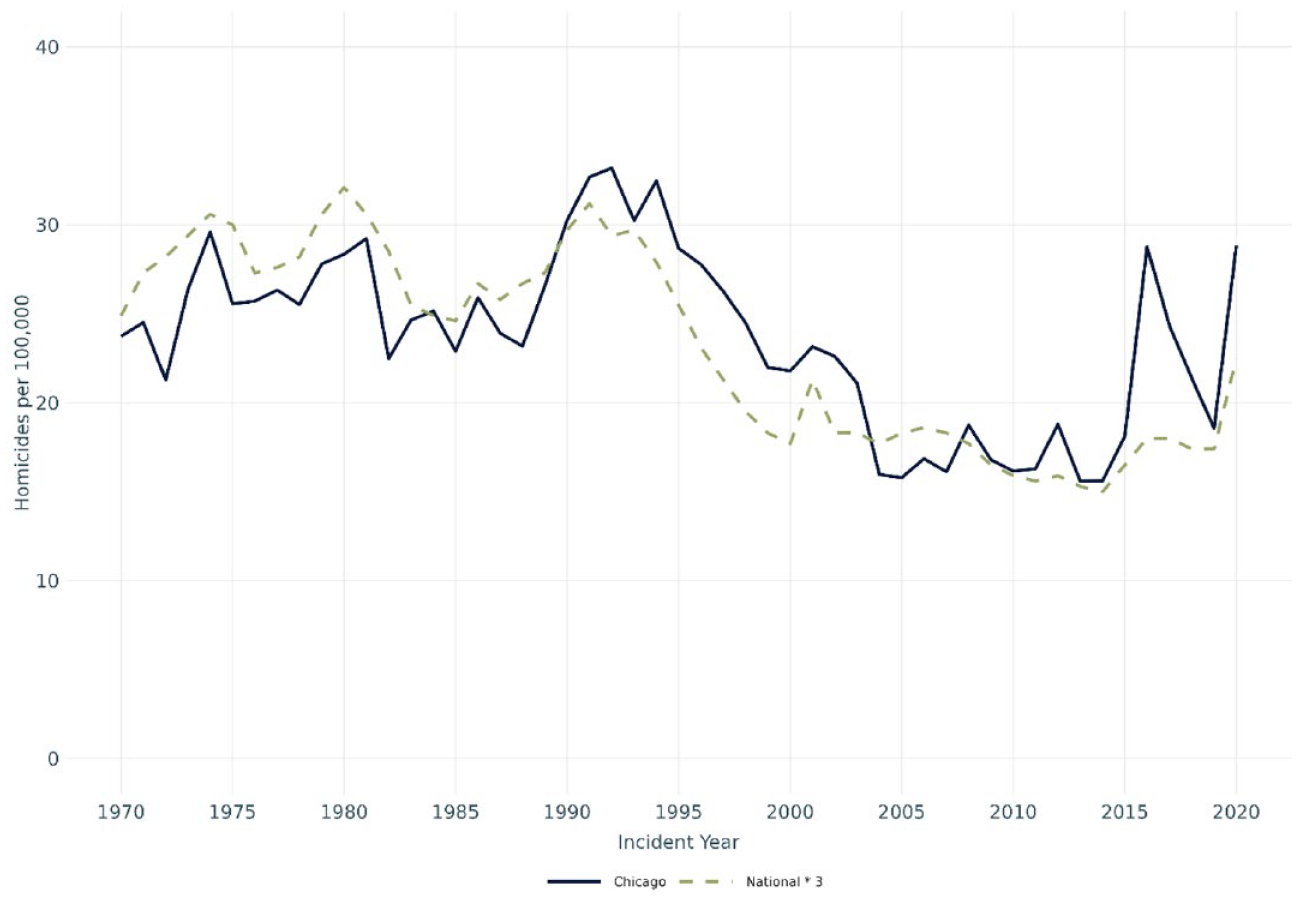
Chicago and National (X3) Homicide Rate per 100,000 Population, 1970 to 2020.
The case mix of homicide has also varied with respect to weapon type, location, and demographic characteristics of victims—as well as circumstances. Table 1 provides case-mix statistics for five intervals each of 10 or 11 years; we focus on weapon type, location, and victim sex and race/ethnicity.
Chicago Homicide Characteristics (Percentage of All Cases in Period).
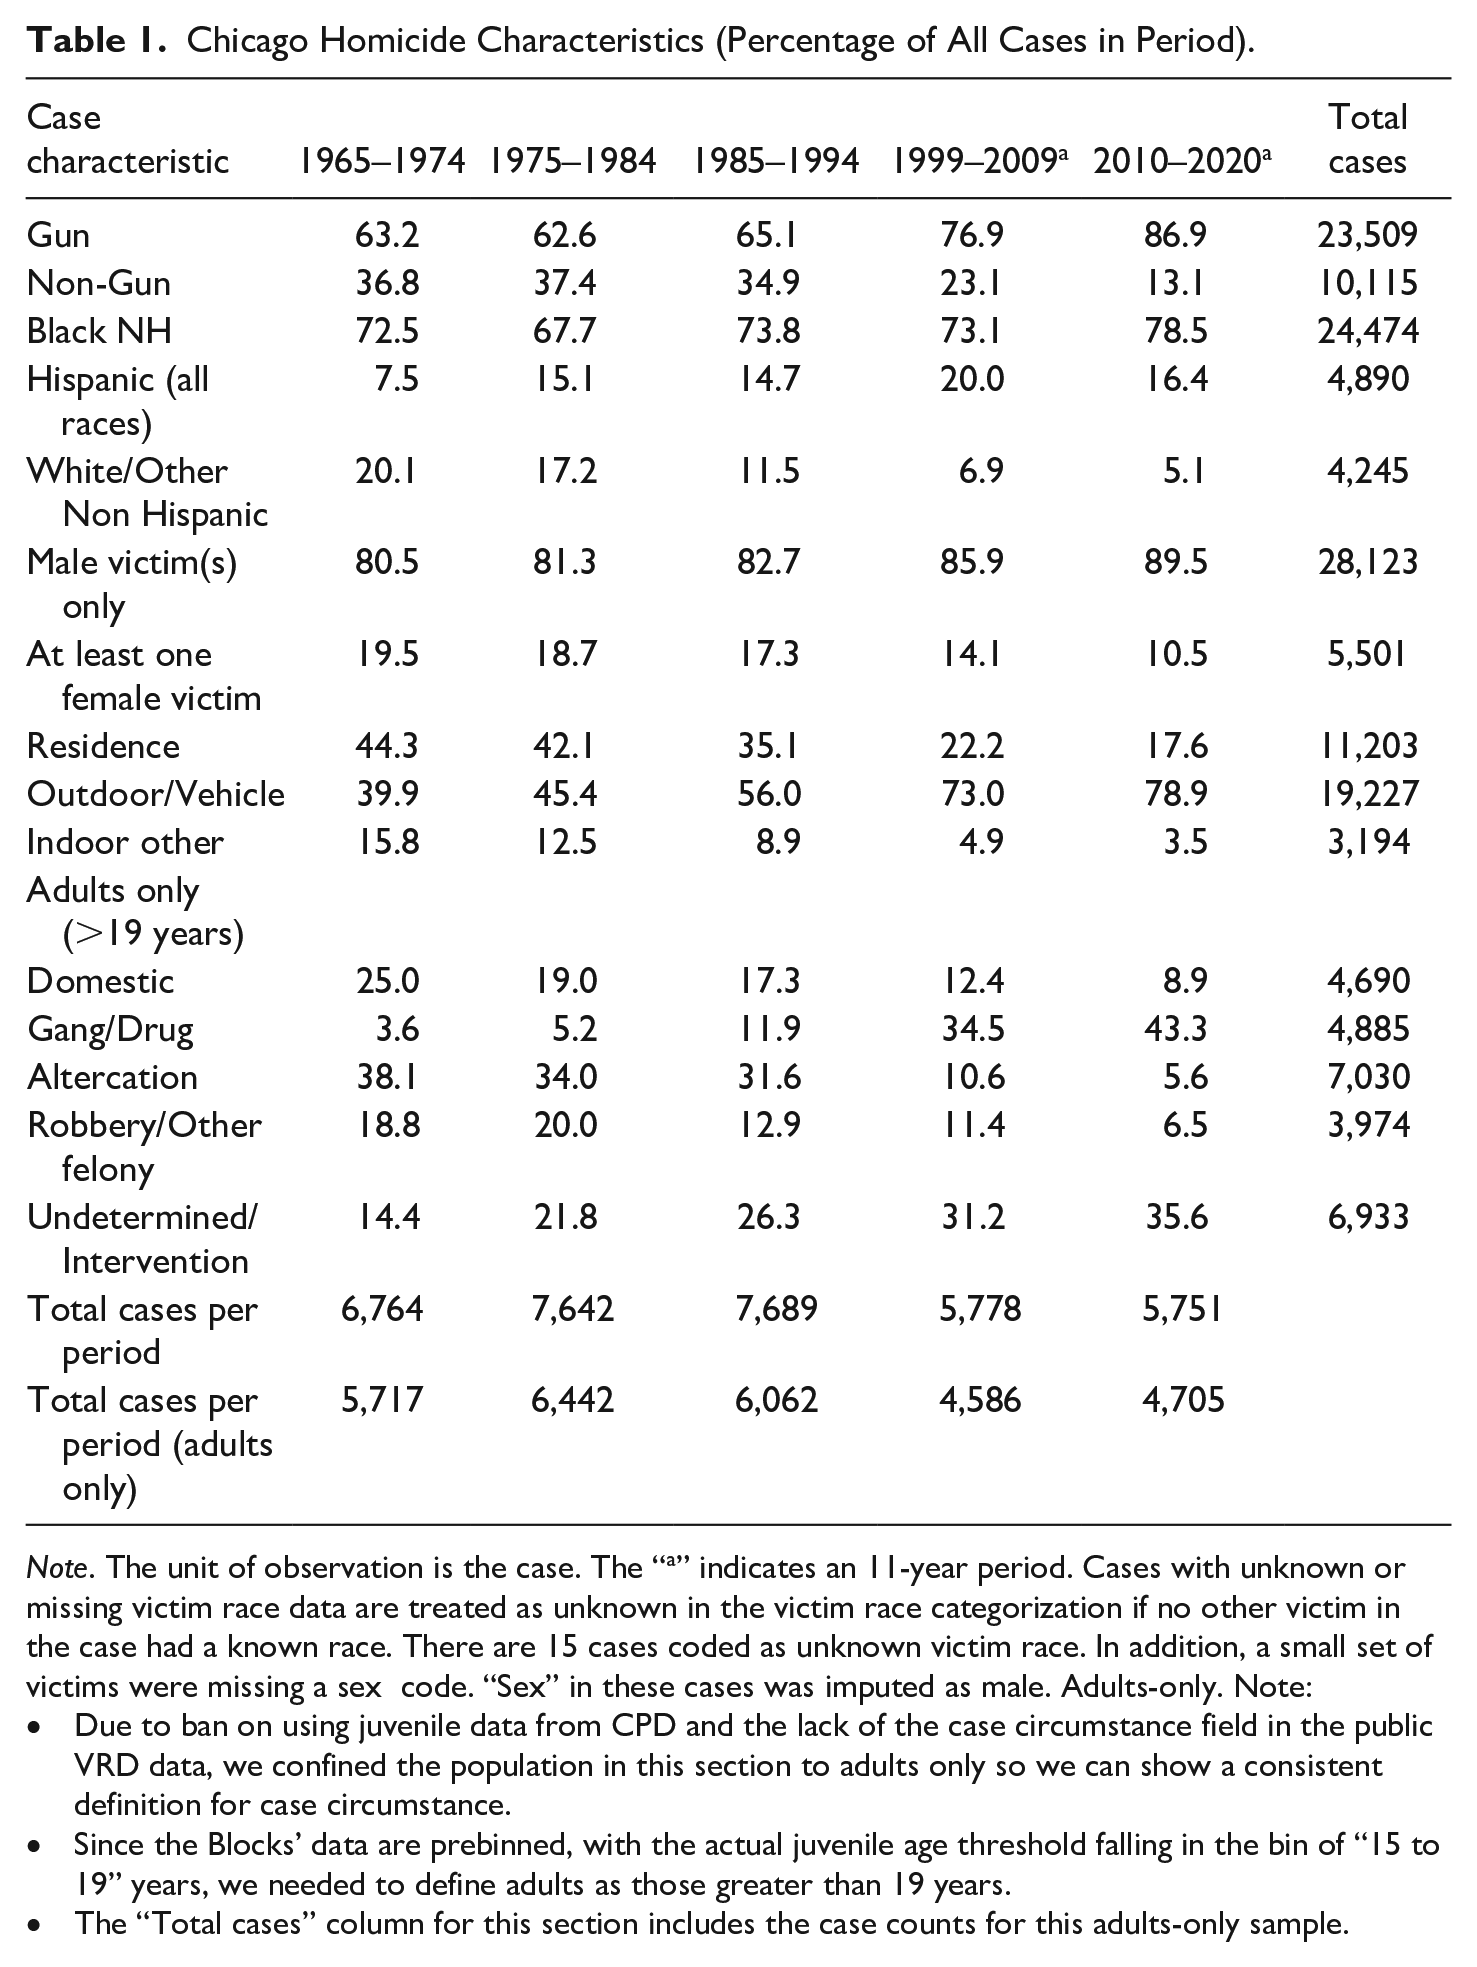
Note. The unit of observation is the case. The “a” indicates an 11-year period. Cases with unknown or missing victim race data are treated as unknown in the victim race categorization if no other victim in the case had a known race. There are 15 cases coded as unknown victim race. In addition, a small set of victims were missing a sex code. “Sex” in these cases was imputed as male. Adults-only. Note:
• Due to ban on using juvenile data from CPD and the lack of the case circumstance field in the public VRD data, we confined the population in this section to adults only so we can show a consistent definition for case circumstance.
• Since the Blocks’ data are prebinned, with the actual juvenile age threshold falling in the bin of “15 to 19” years, we needed to define adults as those greater than 19 years.
• The “Total cases” column for this section includes the case counts for this adults-only sample.
From Table 1, we see that in the overwhelming preponderance of cases in recent years (2010–2020), homicides were committed outdoors (79%) with a gun (87%). Victims were predominantly male (90%) and Black (79%). In all four dimensions (location, weapon, and victim’s sex and race), the concentration with these characteristics has increased over the half-century. The biggest change is that four out of five homicides are now committed outdoors; the outdoor percentage increased from 40% to 79%. In the 1960s, homicides were more likely to occur at the victim’s residence. Also, notable is the substantial increase in the prevalence of gunshot cases, which increased from 63% to 87%. As we discuss below, all of these characteristics are related to solvability.
Figure 3 provides the annual time series on prevalence with respect to weapon (prevalence of guns) and location (outdoor prevalence). Of particular interest is the jump circa 1990 in the prevalence of homicide cases committed outdoors, and those committed with guns. This crack-era-related shift did not subside, but rather has continued on a strong upward trajectory.
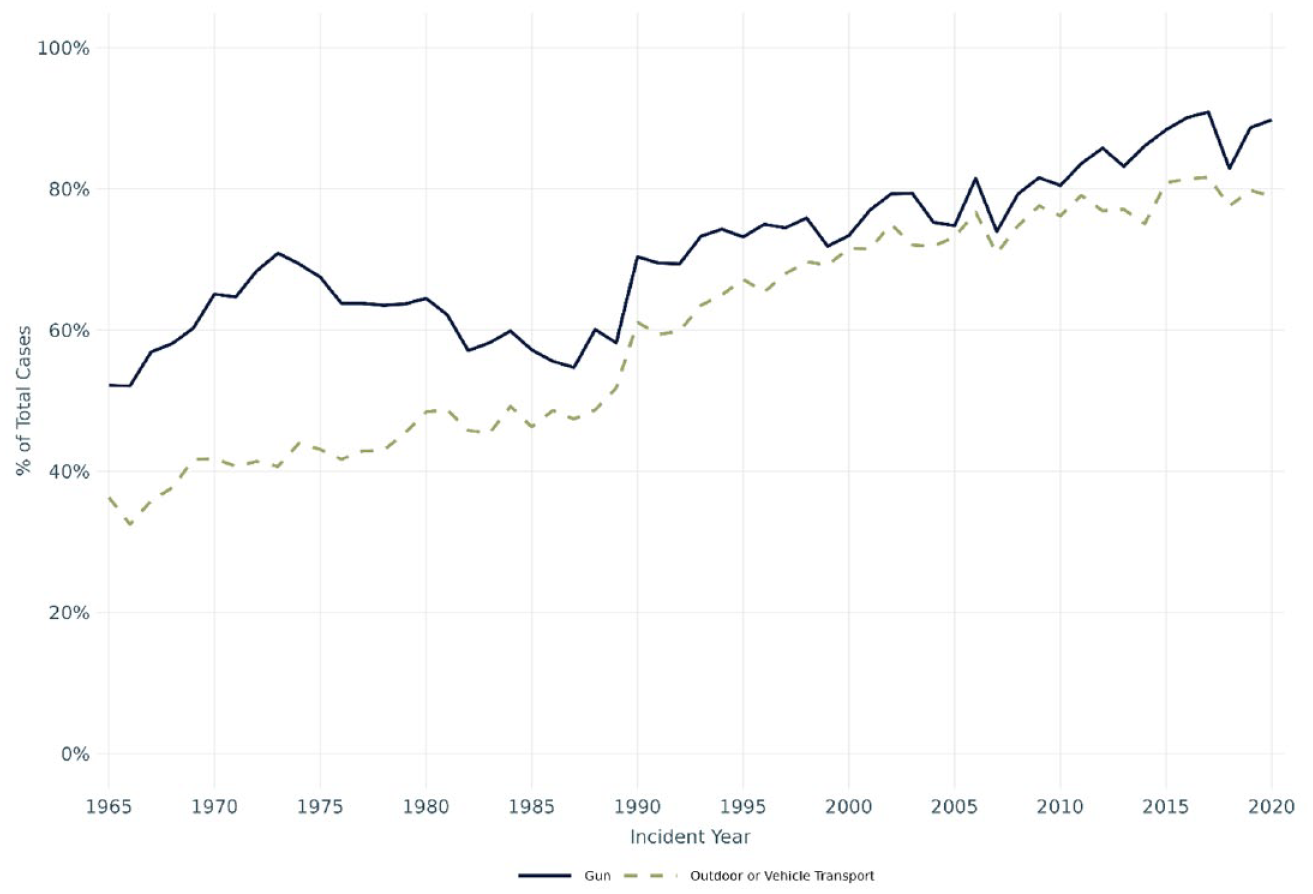
Chicago Prevalence of Gun Use and Outdoor Homicide Cases, 1965 to 2020.
One important trend that is not evident in the data on the prevalence of Black victims is the surge in the rate per 100,000 residents that occurred in recent years. That rate increased from 32 in 2004 to 73 in 2016, and then spiked again to 78 in 2020—substantially higher than the previous high during the crack-cocaine era. That pattern reflects both the increase in homicides with Black victims and a sharp decline in the Black resident population in Chicago since 2000. 11 Movements in all other homicides are far more subdued, as shown in Figure 4.
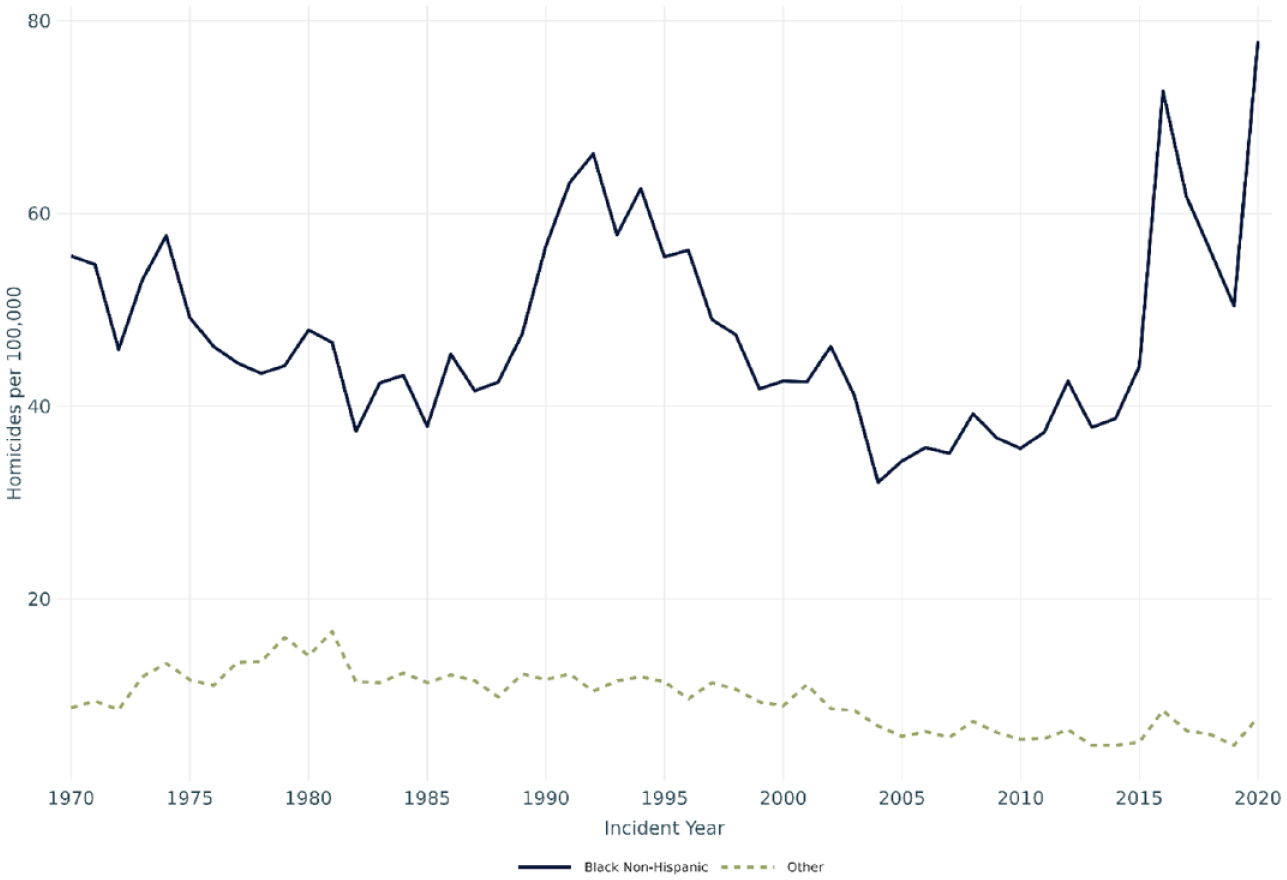
Chicago Homicide Cases by Victim Race per 100,000 Population, 1970 to 2020.
Association With Circumstances and Victim–Offender Relationship
Almost every homicide record includes basic information on when, who (the sex, age, and race/ethnicity of the victim), how many victims, where, and with what means the killing was accomplished. The data files include additional indicators suggestive of the victim–offender relationship and motive, but with a high percentage of missing data. These “circumstance” indicators do provide another picture of how the case mix of homicide has changed in Chicago over the last half-century.
We group the circumstance codes into five bins: Domestic, gang/drug, altercation, robbery or other felony, and undetermined-or-legal-intervention circumstance. Table 2 provides snapshots for two decades: 1975 to 1984 and 2010 to 2019. From this table, we see an increase in the prevalence of undetermined (from 22% to 35%) between the two periods. The predominant circumstances for the known cases were “altercation” in the early decade (44% of known cases) and gang/drug in the more recent decade (67% of known cases). Domestic cases declined from 24% of known to just 14%.
Adult Homicide Circumstance Distribution in Two Decades: 1975 to 1984 and 2010 to 2019.
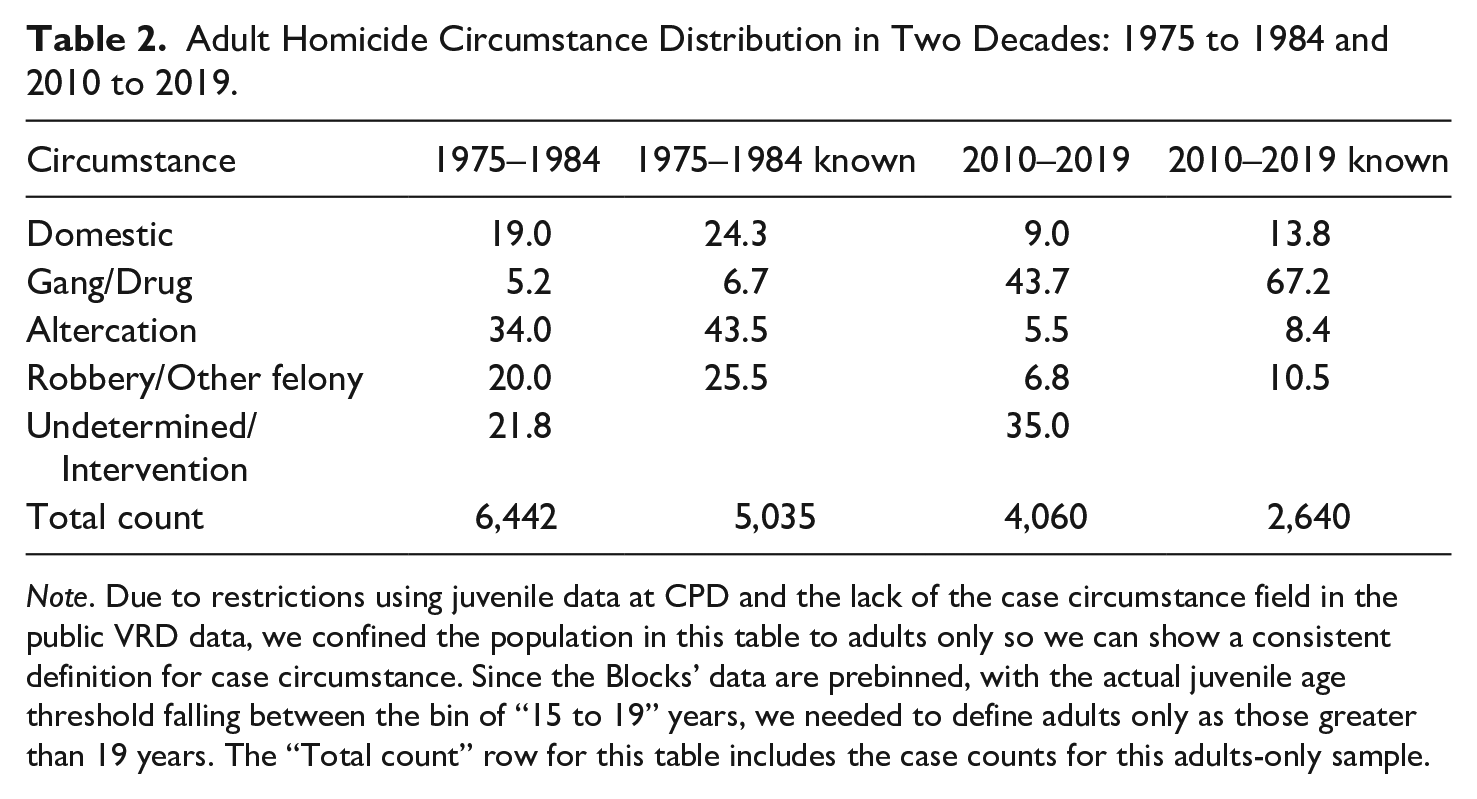
Note. Due to restrictions using juvenile data at CPD and the lack of the case circumstance field in the public VRD data, we confined the population in this table to adults only so we can show a consistent definition for case circumstance. Since the Blocks’ data are prebinned, with the actual juvenile age threshold falling between the bin of “15 to 19” years, we needed to define adults only as those greater than 19 years. The “Total count” row for this table includes the case counts for this adults-only sample.
Figure 5 provides a more comprehensive look at domestic, gang/drug, and undetermined circumstances. The patterns suggest that gang/drug and undetermined are substitutes for the past 20 years—both swing widely up and down, in opposite directions. It seems plausible that this pattern is not “real,” but rather the result of changes in coding conventions used by the CPD. 12
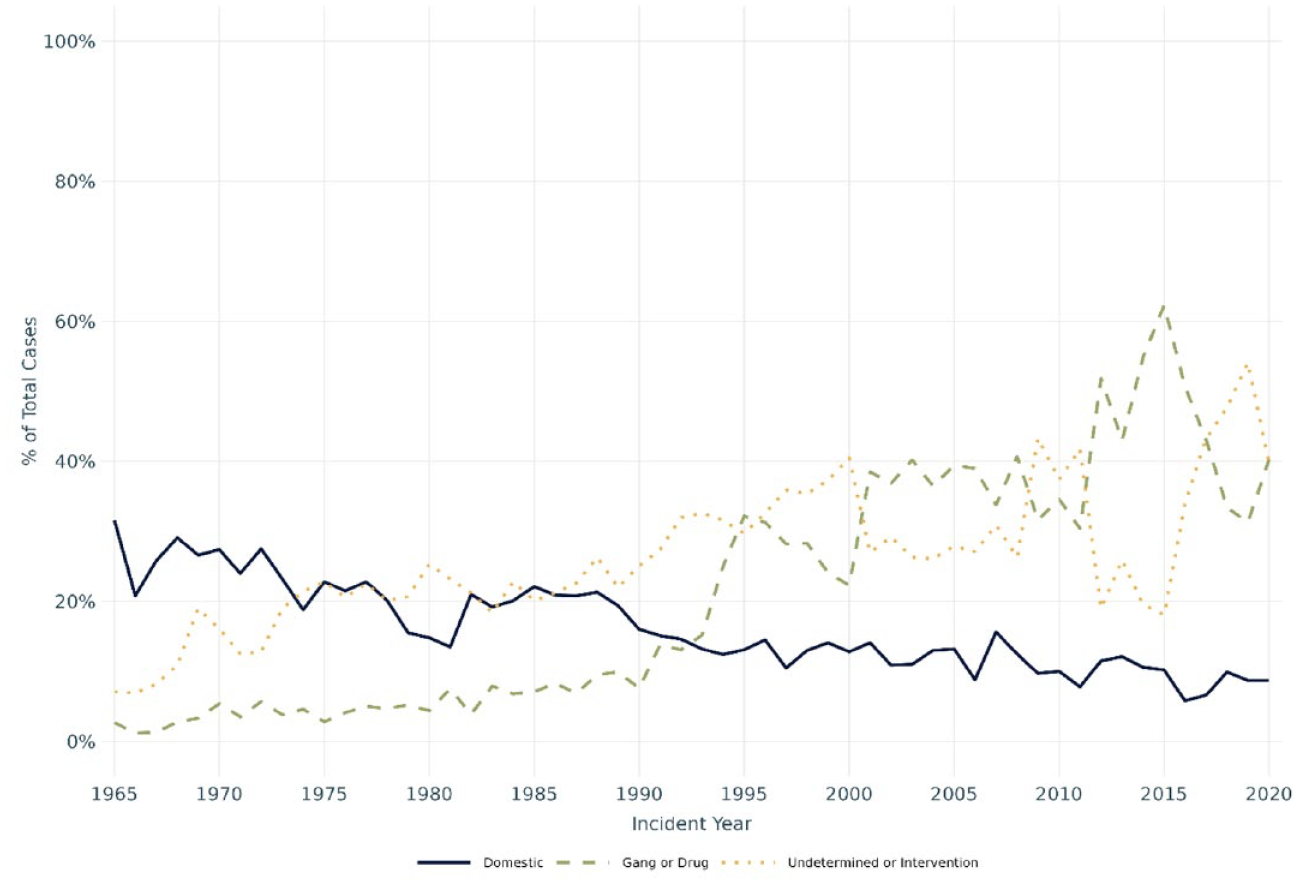
Chicago Adult Homicide Cases by Circumstance, 1965 to 2020.
While the circumstance bins provide some insight into the evolution of case mix during this half-century, the decision to code a particular circumstance (rather than “undetermined”) is often based on inference from scant evidence. Our analysis of case mix with respect to arrest and solvability is based on the more reliable indicators of weapon type, location, date, and victim demographics. Unlike the circumstance codes, those indicators are known for essentially every case, and in particular are observed independently of the success of the investigation.
It is true, however, that the more reliable indicators are highly correlated with circumstance (to the extent that the latter is known). For example, for the recent decade 2010 to 2019, 32% of residential homicides are domestic (nearly half the known cases), while just 4% of the outdoor cases are domestic. Similarly, 39% of the female cases and 38% of the nongun cases are domestic, compared, respectively, to 6% of the male cases and 4% of the gun cases. The circumstance labeled “Gang/Drug” is much more prevalent in outdoor (50%) than residential cases (18%), in male (47%) than female (19%), cases, and in gun (50%) than nongun (6%) cases. These and other results are shown in Supplemental Table A.8.
Solvability
Some homicides are intrinsically easier to solve than others. As noted above, there are cases that effectively solve themselves; we can imagine the extreme case, perhaps a domestic homicide, in which the contrite killer calls the police and confesses. At the other end of the spectrum are drive-by shootings and other gangland hits in which there is little in the way of crime-scene evidence and scant witness cooperation with the police investigation. In any case, the term “solvability” is defined from the perspective of the police department tasked with solving the crime, and relates to the external factors that affect the resources, investigation time, and skill that is required to solve a particular case.
The literature on solvability for homicide cases reports a variety of findings on categories of homicides. The typical analysis relates homicide characteristics to the likelihood of arrest or of clearance. One conceptual issue here is the distinction between intrinsic solvability and observed likelihood of solution—the difference being the effort actually expended in the investigation. High-priority cases, such as those that are particularly newsworthy, may have a higher arrest rate because the police department devotes extra resources to investigating such cases (Hawk & Dabney, 2014; Leovy, 2015; Vaughn, 2020). That may help explain why homicides of children have a higher-than-average arrest rate, although there too, such cases may garner greater community buy-in and cooperation, and thus be more intrinsically solvable. Since we have no direct measure of investigation priority, our analysis of actual clearance rates may confound solvability and investigative effort. But that is also true for other contributions to this literature.
In line with the discussion in previous sections, we focus on a few nearly universally recorded homicide characteristics: location, victim demographics, and weapon type (gun or not). Table 3 presents arrest rates for 1965 to 1994, partitioned into periods of 5 years, for various categories of homicide. Figure 6 graphs these trends in five panels.
Arrest Rates: 5-Year Periods for Categories of Homicide, 1965 to 1994.
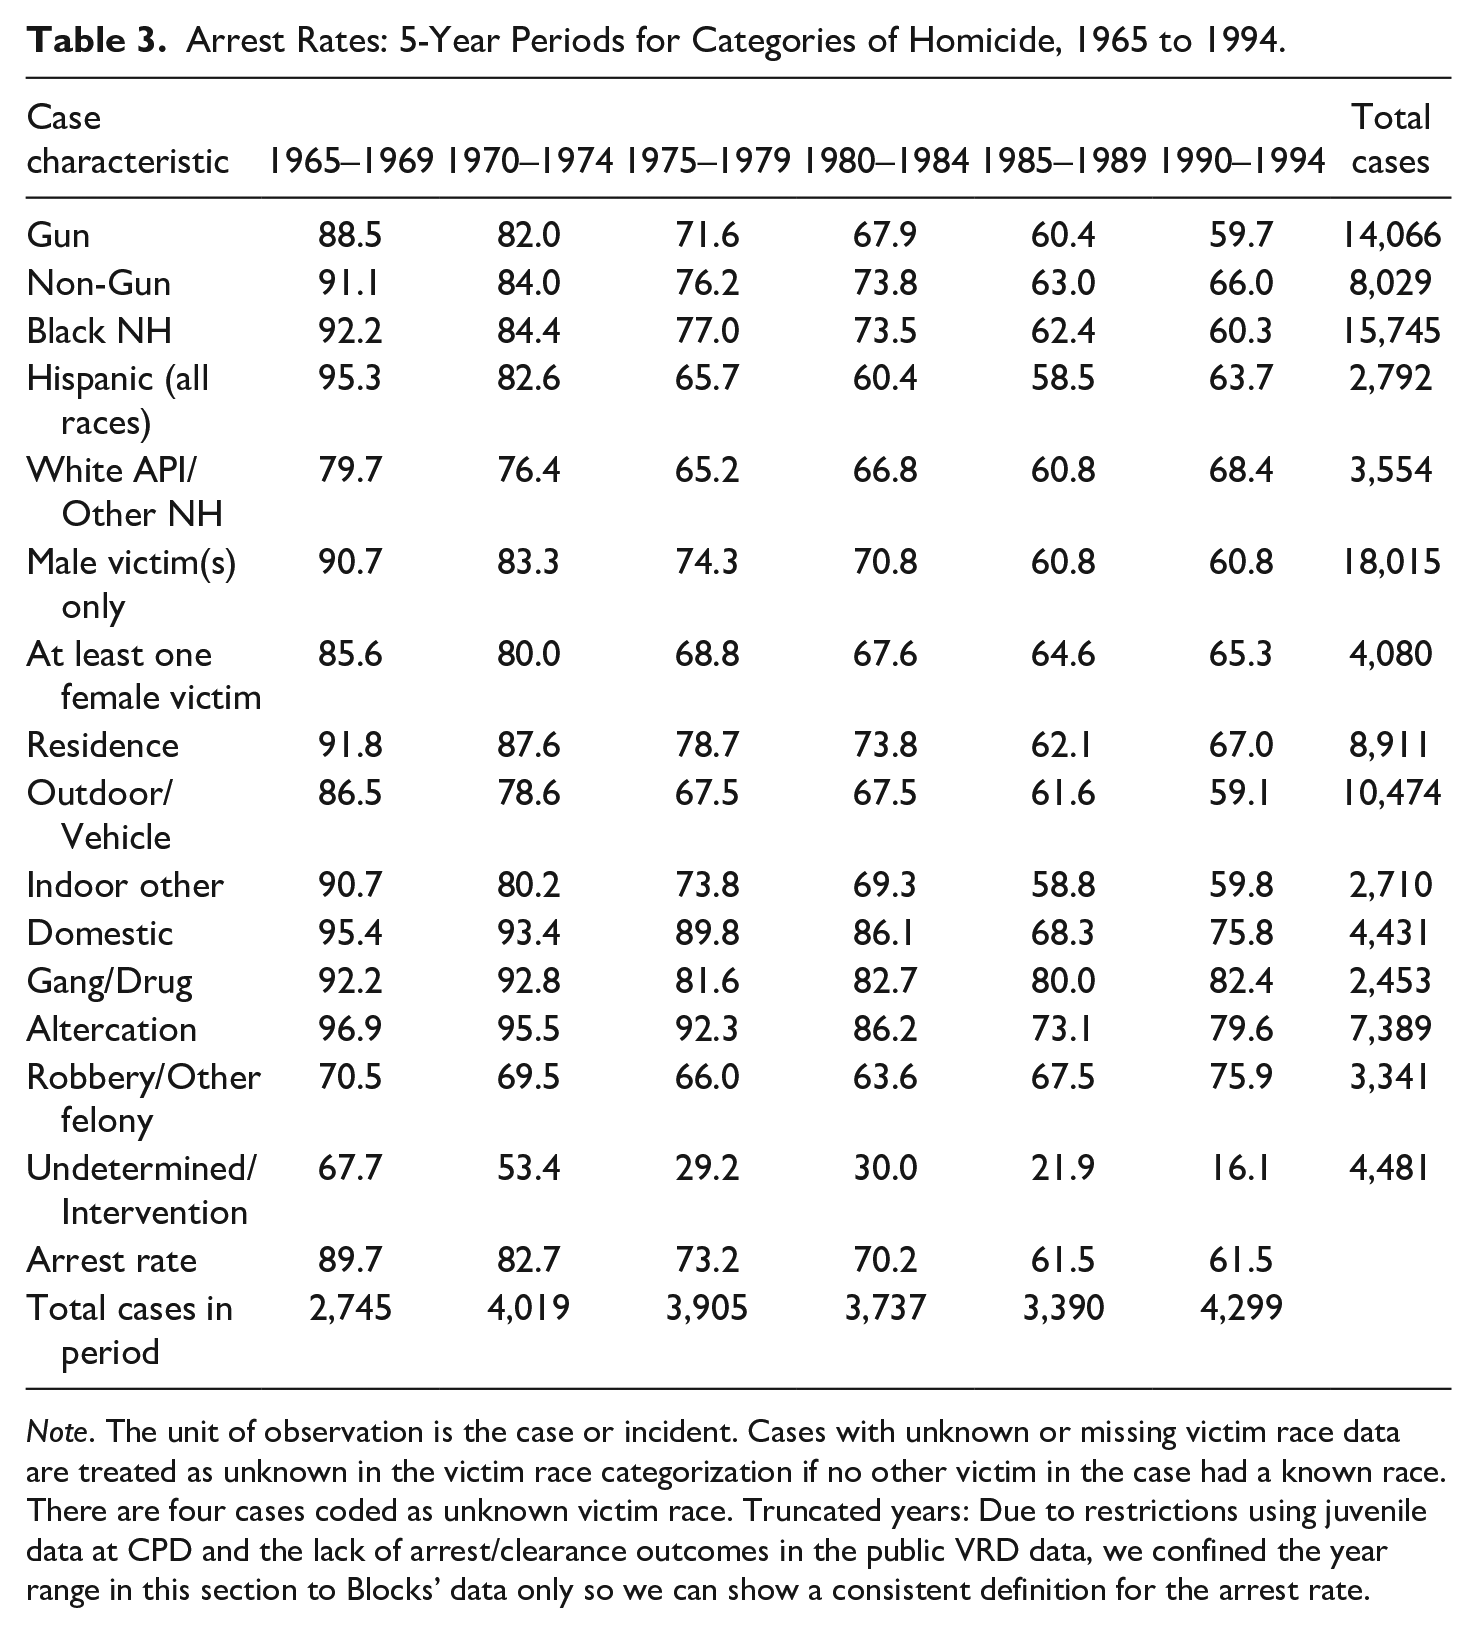
Note. The unit of observation is the case or incident. Cases with unknown or missing victim race data are treated as unknown in the victim race categorization if no other victim in the case had a known race. There are four cases coded as unknown victim race. Truncated years: Due to restrictions using juvenile data at CPD and the lack of arrest/clearance outcomes in the public VRD data, we confined the year range in this section to Blocks’ data only so we can show a consistent definition for the arrest rate.
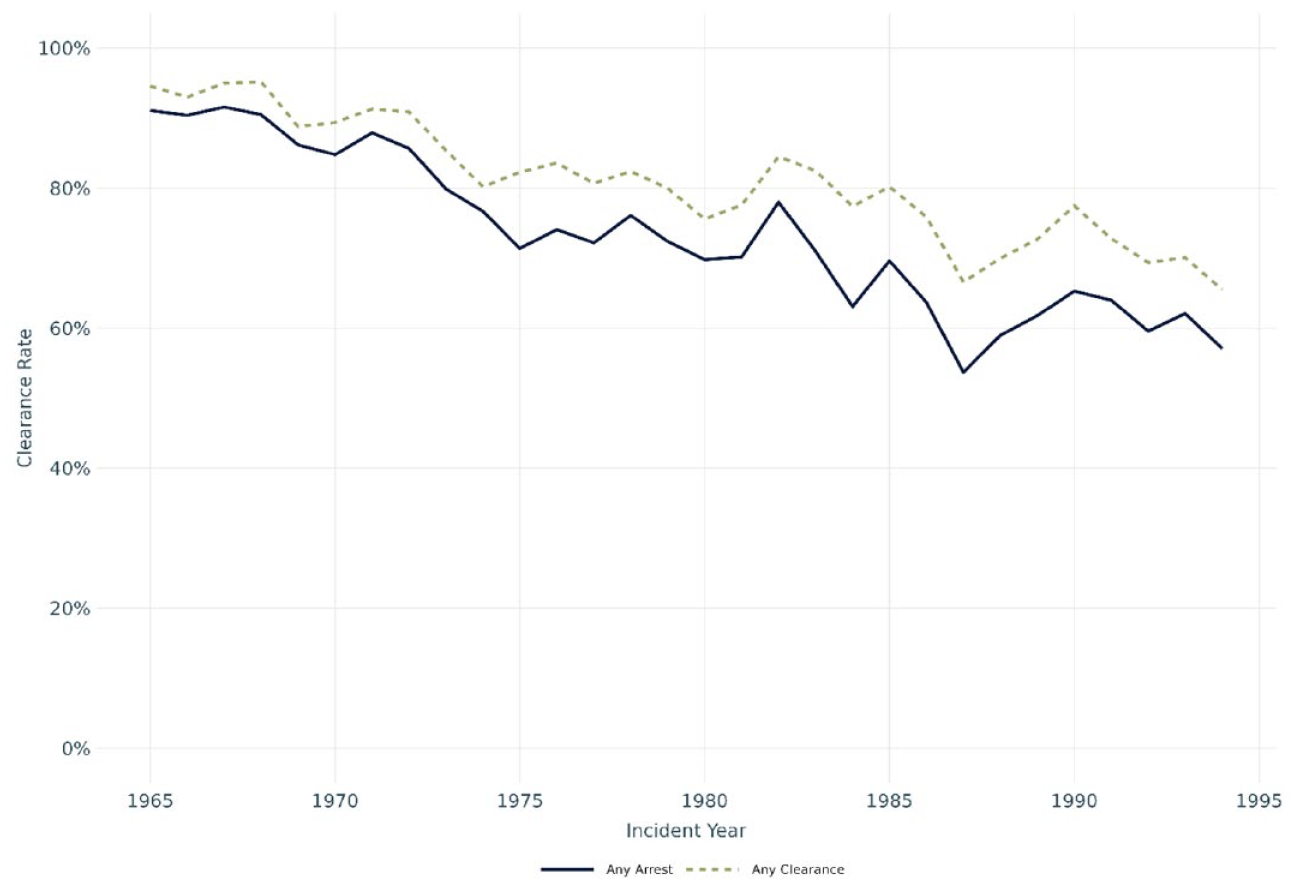
Chicago Homicide Clearance Rates, 1965 to 1994.
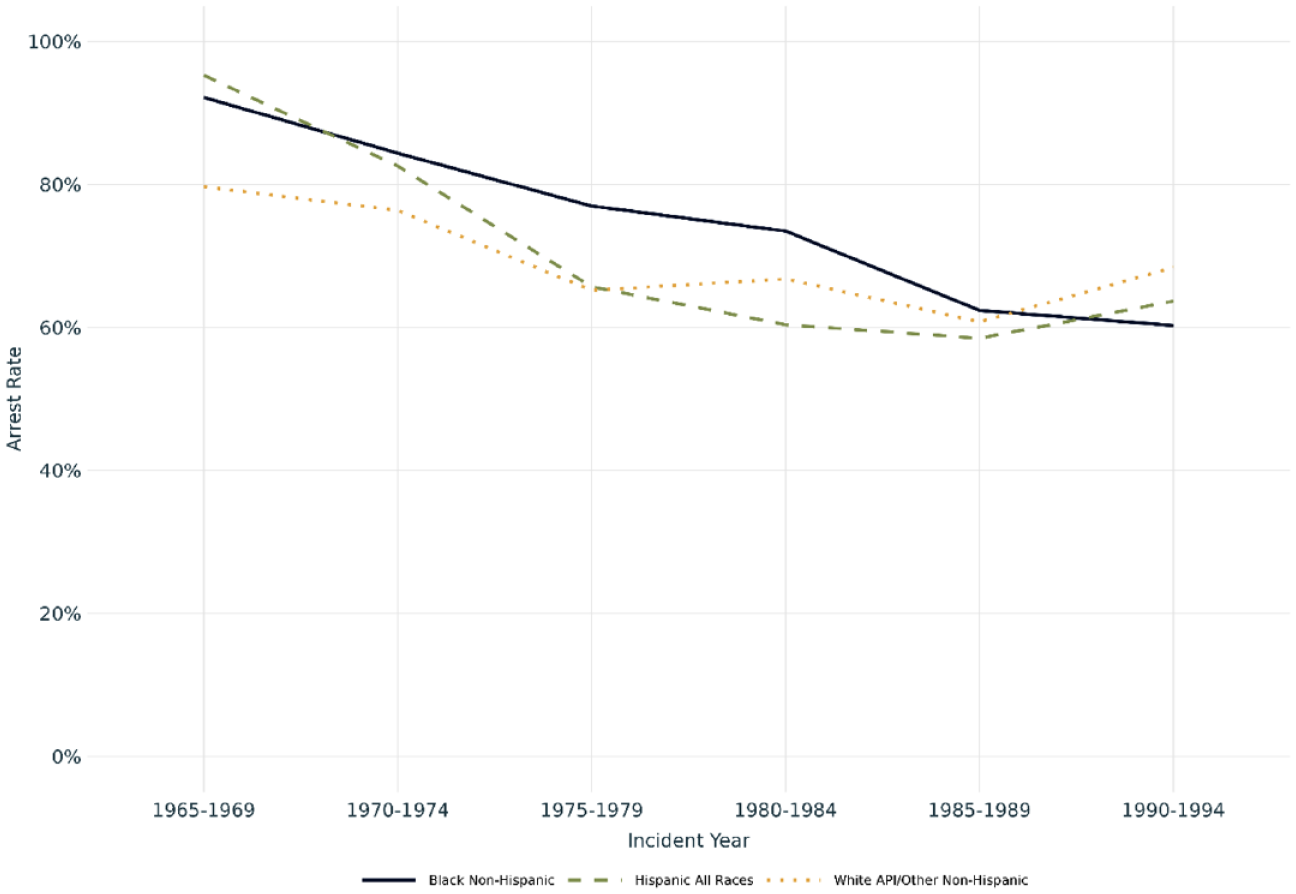
Chicago Homicide Arrest Rate by Victim Race, 1965 to 1994.
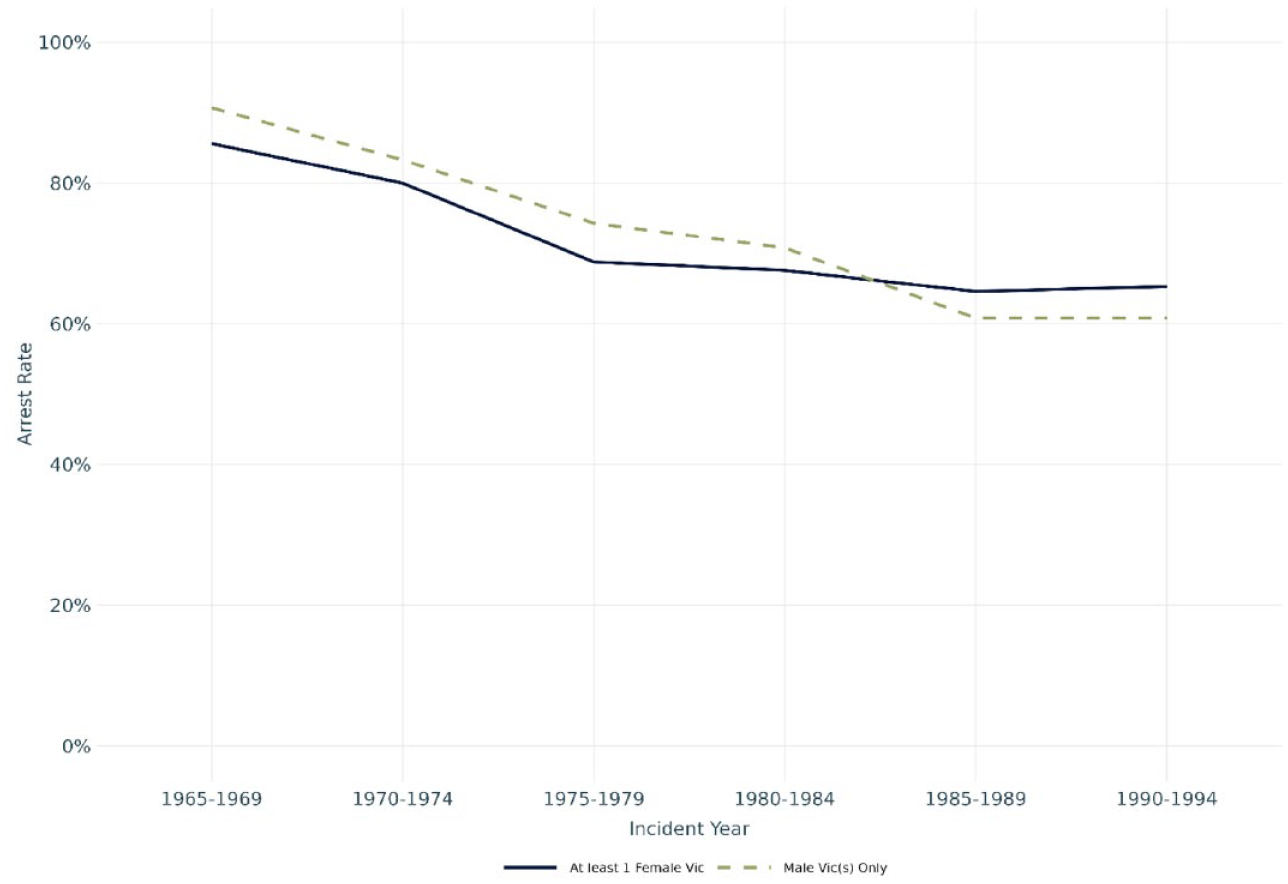
Chicago Homicide Arrest Rate by Victim Sex, 1965 to 1994.
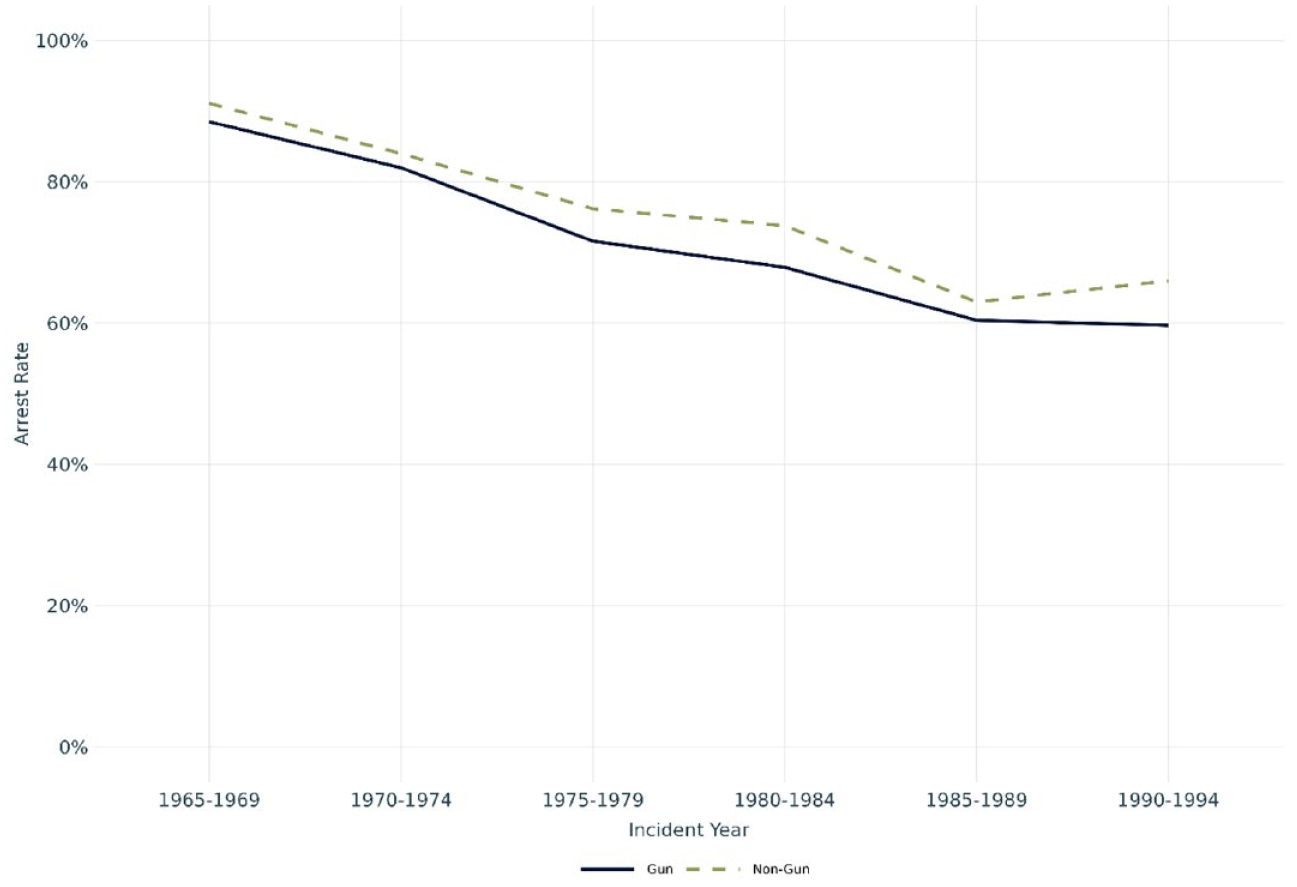
Chicago Homicide Arrest Rate by Weapon, 1965 to 1994.
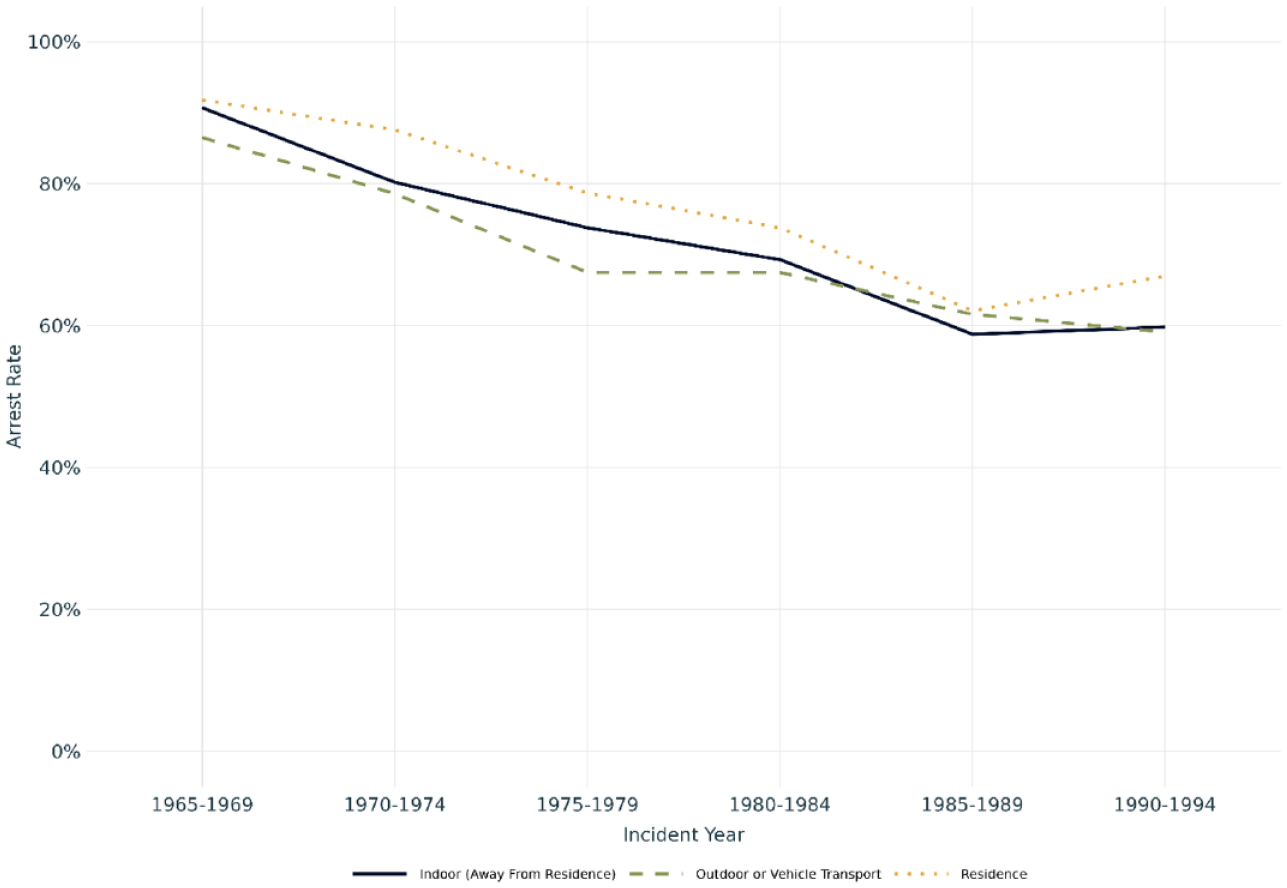
Chicago Homicide Arrest Rate by Location, 1965 to 1994.
Figure 6A depicts the time series for the homicide arrest rate and clearance rate. The two are highly correlated. The decline in the arrest rate is close to linear through 1994 (from 91% to 57%).
The remaining panels of Figure 6 depict the trends in the arrest rate, broken down by victim race and sex, weapon type, and location (outdoor/vehicle, residence, other indoor). In every case, the level and trend for the first three decades are very similar across categories. Perhaps most notable is that in the early years homicides involving Black victims were more likely to result in arrest than for White non-Hispanic victims.
Based on this preliminary analysis, changing case mix is an unlikely candidate for explaining the great decline through 1994. The case mix did change markedly during this period (as discussed above), but the main source of variation in the overall arrest rate is the decline within each category.
Multivariate Logit Analysis
We conducted a multivariate analysis to determine how the correlates of arrest have changed over the decades after accounting for collinearity. The results, included in the supplemental materials (Supplemental Table A.1), confirm what was suggested by the univariate results (above), that not only the level but also the structure of arrest rates across homicide characteristics has changed. During the first two decades (through 1984), homicides involving female victims had a significantly lower arrest rate than those for all male victims, but that difference disappeared in the following decade. Homicides involving Black victims had significantly higher arrest rates than for the default category (Whites/Asian/Other) in the first two decades, but lower in the third.
Variation in Case Mix as an Explanation of the Trend in Homicide Arrest Rates
To determine the extent to which the changes in case mix affected the homicide arrest rate in Chicago, we create an ARI for a standardized case mix. This approach is similar to the method used by demographers in comparing death rates after adjusting for the age composition of the population, or the method used by economists who seek to measure average price movements over time after standardizing for the mix of goods and services consumed.
The standardized case mix used here is equal to the actual case mix for the baseline period 1965 to 1974. Homicide cases are partitioned by type of weapon (gun or not), sex of victim, and location (residence, other indoor, outdoor/vehicle). The result is 12 mutually exclusive categories that include all possible cases. The baseline prevalence for each category is used as a weight in calculating values of the ARI in each period. By construction, the ARI is equal to the actual arrest rate in the baseline period, but may differ thereafter as the structure of homicides evolves. 13
The distribution of cases along the 12 cells for the baseline period is in Supplemental Table A.2, along with the arrest rate for each cell. The ARI using these baseline prevalence percentages is plotted against the actual arrest rate in Figure 7. The ARI is a near-perfect match for the arrest rate, since while case mix changed substantially through 1994, arrest rates remained quite homogeneous across categories (and declined together).
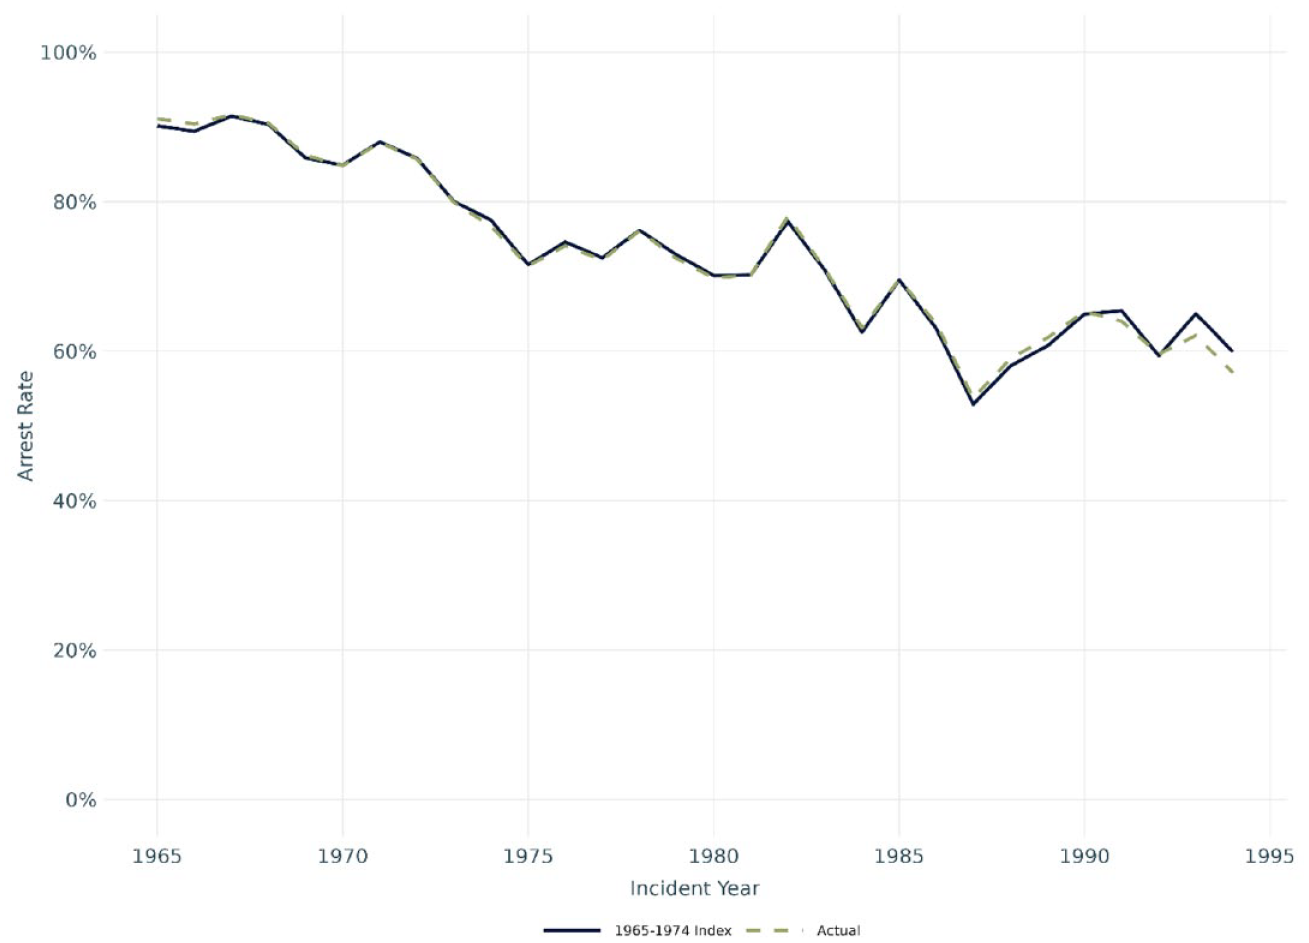
Chicago Homicide Index and Actual Arrest Rate Comparison, 1965 to 1994.
Thus, while case mix with respect to observed characteristics changed a great deal since the 1960s, that change had little influence on the observed arrest rate. Arrest rates were relatively homogeneous across categories. More detail is provided in Supplemental Tables A.5 and A.6.
Other Explanations
Since observed changes in the case mix cannot explain the decline in the homicide arrest rate during the 20th century, the mystery remains. It is logically possible that the trend in the clearance rate is an accurate reflection of the performance of police investigations, and that there really was a sharp decline—although that seems unlikely given the rapidly increasing budgets 14 and major technological innovations during that period (Keel et al. 2009; Lum et al., 2022; McEwen & Regoeczi, 2015; Schroeder & White, 2009). The companion article (Cook & Mancik, 2024) explored several other possible explanations for the national trend. It seems plausible that the ultimate explanation for Chicago’s version of the great decline has much in common with the explanation that emerged from analysis of national data.
Cook and Mancik (hereafter, CM) considered three types of explanation for the great decline after rejecting the “case mix” explanation:
• The trend in workload for police investigators;
• The trend in civilian reluctance to cooperate with police investigations;
• The trend in evidentiary standards for making an arrest in a homicide case.
Here, we consider each of these explanations as they relate to Chicago.
Workload
The question of whether investigation resources have much effect on clearance rates has been much debated in the criminology literature, although the current view has gravitated toward an affirmative answer (Cook et al., 2019; Eck, 1992; Mancik & Parker, 2019; Ousey & Lee, 2010; Roberts & Roberts, 2016; Wellford & Cronin, 2000; Wellford et al., 2019). When the CPD sought advice on how to improve their homicide clearance rate, the consulting report’s first recommendation was that it increases the number of detectives (Police Executive Research Forum, 2019).
Police budgets and staffing grew substantially during the period of the great decline in homicide clearance rates. CM demonstrate that the workload per sworn officer actually declined during this period, as indicated by two measures: the number of residents served and the number of homicides. The corresponding statistics for Chicago are shown in Figure 8. Residents per officer have a secular decline over the entire period. The number of homicides per 100 officers increased sharply in the late 1960s, but then hit a plateau (of about 6 per 100 officers) through 1993. In any event, there is no support from this figure that the great decline in Chicago was due to increased workload, except possibly during the first decade.
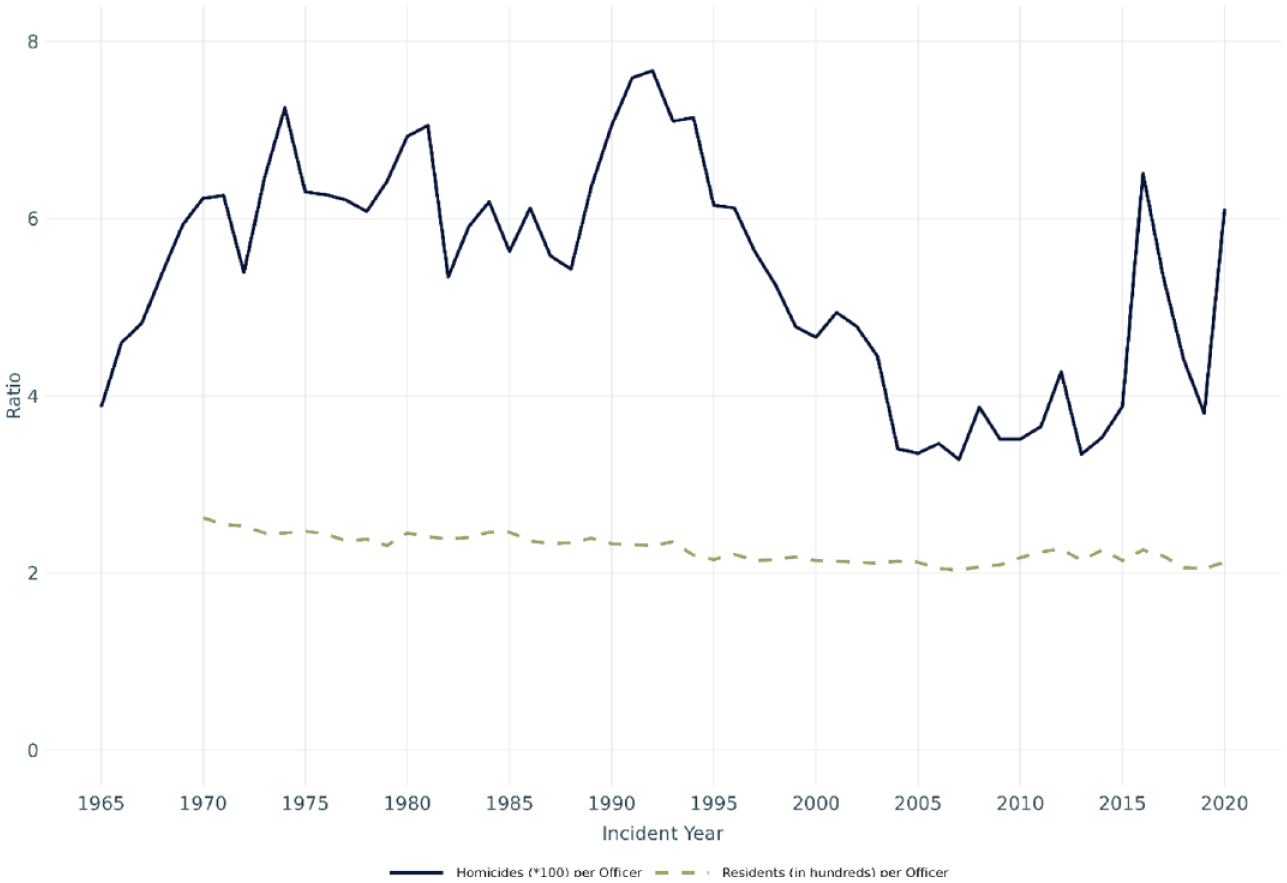
Workload per Chicago Police Department Officer, 1965 to 2020, Measured by Residents Served or Homicides.
It should be noted that these measures do not take account of departmental priorities, and in particular the number of homicide detectives and other resources available for homicide investigations. It is possible that a more refined analysis would provide a somewhat different picture.
Civilian Cooperation
Criminal investigation is a co-production process that depends critically on inputs from civilians and the police (Cook, 2011). Most serious crimes known to the police are reported by civilians, and civilian witnesses are key to the successful investigation and prosecution of a crime (Braga & Dusseault, 2016; Greenwood, 1979; Lum & Nagin, 2017; Mancik et al., 2018; Xu 2008). CM investigated the possibility that declining witness cooperation could provide an explanation for the great decline. The most direct measure is the percentage of crimes reported to the police, available since 1973 from the National Crime Victimization Survey (NCVS). For obvious reasons, the NCVS does not have data on homicide, but does ask about other types of violent crime. Respondents who report being victimized are asked whether they reported the crime to the police. For the period of the great decline, the time series of annual NCVS estimates suggests that reporting rates for aggravated assaults, and for violence crimes generally, actually increased. Thus, this national measure provided no support for the speculation that the propensity of civilian witnesses to cooperate was declining.
Changing Standards
In Chicago and nationwide, there is reason to believe that police investigations have become more lawful over time, and that the evidentiary standards for arrest and prosecution have increased. Supreme Court decisions of the 1960s were intended to curtail illegal searches and coercive interrogations. In particular, Mapp v. Ohio (1961) decreed that state prosecutors could not use evidence obtained through an illegal search, while Miranda v. Arizona (1966) barred use of a suspect’s confession unless the suspect had been informed of his or her right to remain silent during a police interrogation. The Court also established the right to counsel for state proceedings in Gideon v. Wainwright (1963) and subsequently asserted that such counsel must be “effective” (Strickland v. Washington, 1984). It appears that funding for indigent defense services may have grown rapidly during the great decline—one study found it more than doubled in real terms between 1982 and 1997 for the 21 states that financed indigent defense (DeFrances, 2001). Facing a higher quality of defense, prosecutors would be expected to require stronger evidence before agreeing to prosecute. The changing standards for prosecution would presumably have influenced police investigations.
Scientific advances in criminal investigations may also be an important influence on standards for arrest and prosecution. Increasingly common use of DNA evidence beginning in the 1990s and the vast expansion in digital (primarily video) evidence are more recent examples of technological advances that would not only increase the likelihood of a “good” arrest but also reduce the likelihood of false arrests. A recent case in point is the creation of the Area Technology Centers by the Chicago Police Department’s Bureau of Detectives in 2019 (Cook & Berglund, 2021). These centers have greatly increased the quality and quantity of video evidence in homicide investigations.
In sum, the great decline may have been the result, at least in part, of evolving norms for police investigations and a higher threshold for the evidence required for a successful prosecution. CM provide evidence in support of this speculation by documenting the strong national trend in the likelihood that a homicide arrest resulted in conviction and a prison term. The ratio of prison admissions to murders and non-negligent homicides was actually higher in the 1990s than in 1970—the reverse of the trend in the clearance rate. Unfortunately, the necessary data to replicate this analysis for Chicago are not available. But the trajectory of Chicago’s homicides and clearance rates paralleled the national rates, it is a reasonable presumption that the underlying causes are closely related.
If it is indeed true that the great decline in homicide arrest rates beginning in the 1960s was primarily due to a higher standard for arrests, the implication is that thousands of false arrests have been avoided. Since most suspects arrested for homicide in Chicago were African Americans, then as now, 15 the putative trend toward higher standards is an important improvement in racial justice. The narrative of the great decline is flipped from bad news to good.
Conclusion
What might explain the great decline in homicide clearance rates during the 20th Century? In particular, how could it be that the Chicago PD solved 9 out of 10 homicides in the 1960s, yet fewer than 6 out of 10 just 30 years later? We began this inquiry with the presumption that at least part of the answer was due to trends in case mix toward a greater prevalence of difficult-to-solve cases. While we confirmed the trend in solvability during this period, we determined that it does not in fact account for the overall decline in arrests—in fact, the decline occurred in lockstep across the spectrum of homicide circumstances.
Ruling out an explanation of the great decline in terms of case mix, and with reason to be skeptical of an explanation in terms of workload or declining cooperation from civilian witnesses, we are inclined to favor an explanation based on the lawfulness of police investigations and norms for making an arrest. At the national level, the tangible consequence was that the decline in the arrest rate was accompanied by an increase in the likelihood of an arrest’s resulting in a conviction and prison sentence. The net effect for much of this period was a positive trend in the likelihood that a homicide would result in a conviction and active sentence. While we lack comparable data for Chicago, it seems plausible that Chicago and Cook County shared in the national reform movements of that period. That interpretation reverses the usual narrative about the effectiveness of police investigations. The great decline is, at least in part, the result of a movement toward a higher evidentiary standard for making arrests.
This new account has implications for using the homicide arrest rate as a police performance measure. An arrest in 2000 or 2020 appears to mean something different, and more significant, than an arrest in the 1960s. The great decline is arguably not a decline in police performance during this period, but rather reflects the upward trend in standards for arrest.
The evidence for this conclusion is indirect and needs further buttressing to be persuasive. A deep dive into public records on conviction and imprisonment rates for homicide cases in the 1960s and 1970s would be a reasonable place to start. It would also be of great value to document investigation practices at various times through this historical period.
While getting this history right is certainly of some interest, the more pressing problem is to determine what investments will best serve the goal of improving homicide clearance rates going forward. In Chicago and many other cities, those rates are far too low—not necessarily by a historical standard, but to satisfy the causes of justice and crime prevention.
Supplemental Material
sj-docx-1-ccj-10.1177_10439862231219470 – Supplemental material for Explaining the Extraordinary Decline in Chicago’s Homicide Arrest Rates, 1965 to 1994 and Beyond: Trends in Case Mix Versus Standards for Arrest
Supplemental material, sj-docx-1-ccj-10.1177_10439862231219470 for Explaining the Extraordinary Decline in Chicago’s Homicide Arrest Rates, 1965 to 1994 and Beyond: Trends in Case Mix Versus Standards for Arrest by Philip J. Cook and Javier Lopez in Journal of Contemporary Criminal Justice
Footnotes
Acknowledgements
The authors thank the CPD for sharing their data and reviewing the analytical output for the publication. They are indebted to the research staff at the University of Chicago Crime Laboratory for their many contributions. Anthony Berglund, Ashna Arora, and Matteo Magnaricotte provided valuable feedback and helped explore the broader implications of our findings; Erin Wright and Matt Triano contributed domain knowledge and provided guidance on data processing decisions and interpretation of key variables; Emily Selch conducted quality assurance checks on the entire code pipeline. Pilar Kelly at Duke University provided able assistance in collecting data. Any oversights or omissions are ours.
Correction (June 2024):
Article updated to rectify the Funder’s name to “National Collaborative on Gun Violence Research” in Funding section.
Authors’ Note
This work was submitted for publication in a special issue of Journal of Contemporary Criminal Justice, edited by Richard Rosenfeld and Mark Berg
Declaration of Conflicting Interests
The author(s) declared no potential conflicts of interest with respect to the research, authorship, and/or publication of this article.
Funding
The author(s) disclosed receipt of the following financial support for the research, authorship, and/or publication of this article: The research was supported by a grant from the National Collaborative on Gun Violence Research to the University of Chicago Crime Laboratory.
Supplemental Material
Supplemental material for this article is available online.
Notes
Author Biographies
References
Supplementary Material
Please find the following supplemental material available below.
For Open Access articles published under a Creative Commons License, all supplemental material carries the same license as the article it is associated with.
For non-Open Access articles published, all supplemental material carries a non-exclusive license, and permission requests for re-use of supplemental material or any part of supplemental material shall be sent directly to the copyright owner as specified in the copyright notice associated with the article.