
Abstract
Victims’ willingness to report crime and their opinions about the police are important indicators of police performance, police legitimacy, and trust in the justice system. This study examines two decades of trends in police notification and victims’ perceptions of the police in the United States and major metropolitan areas since 2000, using data from the National Crime Victimization Survey (NCVS). In contrast to previous studies indicating an increase in police notification in the 1980s and 1990s, the present study shows a progressive decline in police notification observed in the last two decades, especially since 2010. Furthermore, there has been a marked increase in victims’ mistrust of police responsiveness since the mid-2000s. Using multivariable regression models that control for potential changes in the characteristics of crime and survey methodology, we find that the victims’ rising distrust of the police is widespread in many metropolitan areas, in all racial/ethnic and socioeconomic groups, and especially so for victims of theft, burglary, and simple assault. In the discussion, we suggest that the changing policing strategies and the evolving economic, political, and social environments of the 21st century may help explain the trends identified by this research. Understanding victim reporting trends and victims’ opinions of the police may affect data and policy and help the justice system to better serve victims and enhance public safety.
Criminologists and statisticians have long documented that more than half of crimes are not captured by official statistics, an issue known as the “dark figure of crime” (Biderman & Reiss, 1967; de Castelbajac, 2014). A great deal of empirical work has been conducted to uncover the incidence and characteristics of unreported crime (Baumer & Lauritsen, 2010; Berg et al., 2013; Buil-Gil et al., 2021; Felson et al., 2002; Mosher et al., 2010; Xie & Baumer, 2019a). This research underscores the importance of innovations in data collection and policy development. The period from the 1960s to the 1980s, for example, was the golden age of survey research that saw the invention and expansion of large-scale victim surveys in the United States and other countries (Cantor & Lynch, 2000; Van Dijk, 2015). Victim surveys—such as the National Crime Victimization Survey (NCVS)—are now a major component of crime statistics, as evidenced by government efforts to redesign and extend victim surveys for the modern age (Truman & Brotsos, 2022). Meanwhile, policy communities have sought to enhance crime reporting. Reforms of the sexual and domestic violence laws (Spohn & Horney, 1996), victims’ rights organizations (Mastrocinque, 2010), and community policing (Greene & Mastrofski, 1988) are all examples of movements that push for more crime reporting with mixed success.
The decades-long quests for data and policy innovations pose important questions for research: Has the rate of crime reporting improved over time and if so, what underlies the change? Because of the long existence of the NCVS (1973–present), the data are particularly useful for tracking long-term crime reporting trends. Using the NCVS data from 1973 to 2005, a comprehensive study by Baumer and Lauritsen (2010) found an often-overlooked but highly important trend toward increasing police notification for a wide range of crimes. The increase in reporting was found for burglary, motor vehicle theft, larceny, and violent crimes. For most crimes, the increase started from the mid-1980s, causing the estimated police notification rates to increase from 1973 to 2005 by about 12 percentage points for non-lethal violence and eight percentage points for property crimes (Baumer & Lauritsen, 2010). While the reasons behind the changes are yet to be determined, the findings hold important implications for policymakers. In a review, Reitler (2010) commented that “police notification rates are meaningful, especially in a community-policing era.” Encouraging more attention to this area of inquiry, Reitler noted optimistically that “increases in police notification might signal improved communications between the police and the community or increased trust and confidence in the police.”
After the turn of the century, little information has been available about whether the trend toward more police notification has continued. The 21st-century America has seen many developments that may shape crime reporting, including the increased focus on terrorism preparedness and police militarization in the post-911 security era (Cortright et al., 2020); the surging social discontent and political polarization following the 2008 financial crisis (Polavieja, 2013); the rise of smartphones, social media, and public attention to police brutality (Clark et al., 2017); and the Black Lives Matter movement (Phelps et al., 2021). Given the plethora of factors, it is challenging to predict how the trend of crime reporting will unfold (e.g., continue to increase, level off, or even reverse), especially when public views of the police have frequently been found to be negative (Brunson, 2007; Cobbina, 2019) or become more critical over time (Fine et al., 2020; Mourtgos & Adams, 2020). The current study empirically tests the trend of police notification in this period, with the results showing a downward, not upward, trend of crime reporting that has not been reported before. In addition, the investigation identifies a marked change in victims’ perceptions of the police. Specifically, from the mid-2000s onward, victims have become more likely to complain about police disinterest or ineffectiveness when asked about reasons for failing to call the police.
The paper is structured as follows. Section “Background” reviews the recent evidence on crime reporting and victims’ perceptions of the police. We argue that the changing landscape of 21st-century America provides a strong motivation for studying possible changes in crime reporting and victims’ trust in police. Section “Data and Methods” presents our data, variables, and research strategies in more detail. Section “Results” presents the empirical findings. Section “Discussion” provides a summary and some plausible explanations for these results. Section “Conclusion” concludes with takeaway messages and directions for future research.
Background
Recent Evidence on Crime Reporting and Victims’ Perceptions of the Police
Our research integrates two related bodies of literature. Since the 1960s, a substantial amount of research has been conducted to explore ways of measuring individuals’ attitudes toward the police, the factors that influence them, and their potential impacts on police legitimacy and public support for the police (e.g., see reviews by Alberton & Gorey, 2018; Brown & Benedict, 2002; Decker, 1981; Peck, 2015). Another body of literature focuses more explicitly on victims of crime, where much attention has been given to victim reporting and victim–police interactions (e.g., see reviews by Farrell et al., 2019; Xie & Baumer, 2019a). As extensive reviews are available, we will only briefly summarize the major themes of studies published since 2000. We found that much like earlier research in the field (see review by Baumer & Lauritsen, 2010), most contemporary studies on public perceptions of the police and crime reporting rely on cross-sectional data. These studies’ most common theoretical frameworks are the demographics model and procedural justice.
The Demographics Model
Studies using the demographics model suggest that perceptions of the police can vary based on respondents’ demographic characteristics, and the research is mostly centered around race. Results consistently found that White respondents are more likely to have general, positive attitudes toward the police compared with non-White respondents (Bolger et al., 2021; Brunson & Weitzer, 2009; Callanan & Rosenberger, 2011; Haberman et al., 2016; Rosenbaum et al., 2005; Sanden & Wentz, 2017). In addition, Whites have reported higher satisfaction with overall police services and personal interactions with the police than racial/ethnic minorities (Bolger et al., 2021; Weitzer & Tuch, 2005).
The associations between race/ethnicity and crime reporting are less clear. In some studies, respondents’ race is not significantly related to crime reporting intentions (Rengifo et al., 2019). The research is also mixed on whether racial and ethnic concentrations in a community are associated with reporting intentions (Slocum et al., 2010). In contrast, using an intersectionality approach that considers gender and race, Zaykowski et al. (2019) found that Black females in poverty and Black females with less than a high school education had the highest probability of reporting victimization to the police, whereas Black and Hispanic males were the least likely to report their victimization. Considering the race of both the victim and offender, Xie and Lauritsen (2012) and Powers et al. (2020) found that Black-on-White and Black-on-Black crimes were more likely to be reported than White-on-White crimes.
The demographics model helps disentangle the complex mechanisms of how social structural factors and individual characteristics shape crime reporting. Xie and Lauritsen (2012), for example, found that racial inequality in crime reporting is greater in places where Blacks experience greater economic disadvantage or segregated living situations. Besides these ecological factors, Alberton and Gorey (2018) suggest that to understand how race matters in attitudes toward police, we need to include research that explores public–police contacts from the procedural justice perspective.
Procedural Justice
Procedural justice is closely tied to perceived police legitimacy (Tyler, 2003). Respondents who do not view the police as legitimate are expected to have less favorable attitudes toward the police (Brunson & Weitzer, 2009; Haberman et al., 2016). Concerns about police effectiveness may arise from experiencing direct unjust interactions, witnessing unjust interactions, and hearing about unjust incidents in the community and media (Bridenball & Jesilow, 2008; Rosenbaum et al., 2005; Sanden & Wentz, 2017). A positive personal or vicarious experience conversely is associated with increased positive attitudes toward the police (Rengifo et al., 2019; Rosenbaum et al., 2005; Sanden & Wentz, 2017).
In contrast, we know less about the links between perceived police legitimacy and victims’ reporting behaviors. Some research suggests that negative perceptions of police legitimacy and effectiveness predict a lower likelihood of crime reporting (Desmond et al., 2016; Rengifo et al., 2019; Slocum, 2018). For example, Desmond et al. (2016) found that media coverage of incidents of police violence had a dampening effect on crime reporting across the city of Milwaukee, with the effect being more pronounced in Black neighborhoods. Young Black men hesitate to file formal complaints against police officers due to a belief that the officers will not be held accountable (Brunson & Weitzer, 2009). However, studies have also shown that victim reporting or victim support for tougher law enforcement can be high even among those who hold negative perceptions of the police (e.g., Carr et al., 2007; Khondaker et al., 2017).
Trend Data on Perceptions of the Police and the Changing Policing Landscape
We identified few longitudinal studies of changing crime reporting patterns, with data suggesting a recent decline in favorable attitudes toward police in the general public. Monitoring the Future, a long-term study of American youth in schools, found an increase in positive perceptions of police performance among high school seniors from 1991 to 2003 (Pastore & Maguire, 2005). Supporting this trend, the Gallup Polls from 1977 to 2001 suggest a general increase in the American public’s perceived honesty and ethics of the police (Saad, 2015). However, from 2001 to 2015, there was an overall decrease in the public’s ratings of the police as honest and ethical (Saad, 2015).
Besides the changing perceptions of the police, scholars have noted the changing policing strategies in the United States, especially their evolving relationships with the communities (Lum et al., 2011; Maguire et al., 2003; Reiss, 1992; Willis & Mastrofski, 2012). As Crowl (2017) discussed, although the popularity of community policing boomed in the 1990s, concerns about police-community detachment and reactive policing date back to the 1960s. During the 1970s and 1980s, policing research explored the role of the community in crime-solving (Rosenbaum & Lurigio, 1994). Such discussions were followed by police departments experimenting with community-based policing as its popularity increased among managers, citizens, and politicians. The 1994 Violent Crime and Law Enforcement Act provided federal funding for community-policing initiatives and evaluations (Skogan, 2019), although critics suggest that most police departments that claim to have adopted community policing have failed to shift their operations or to develop relationships with residents (Crowl, 2017; Mastrofski, 2019).
Following the 1994 Crime bill, community policing has faced challenges for several reasons. Community policing is now competing for federal funding and attention with numerous other initiatives, such as the war on drugs, the war on terror, and zero-tolerance enforcement (Skogan, 2019). The rise of CompStat has also prioritized data-driven initiatives over the community (Willis & Mastrofski, 2012). Concerns about police conduct, especially toward marginalized communities, and officer pushback have decreased support for community policing (Skogan, 2019). The heavy demand for resources paired with the inconsistent results of community policing may encourage investments in other strategies (Mastrofski, 2019). The future of community policing will heavily rely on more encompassing evaluations of program implementation and impact.
Research Objectives
Overall, despite the theoretical and empirical progress made to date, the majority of research on crime reporting is cross-sectional in nature, and there is very limited knowledge about long-term trends in victim reports of crime, against the changing economic, sociopolitical, and policing environments of 21st-century America.
In this study, we intend to close this gap and provide an up-to-date overview of the changing crime reporting patterns in the United States, as well as the victims’ changing perceptions of the police. In addition to assessing trends at the national level, we examine whether the trends are upheld for the majority of locations (the major metropolitan areas), crime types (specific types of violent vs. property crimes), and demographics (race/ethnicity, gender, age, and socioeconomic status).
Data and Methods
The NCVS National (1993–2021) and Metropolitan (2000–2015) Data
The NCVS—along with its predecessor, the National Crime Survey (NCS)—is the largest and longest running victim survey in the United States (Lynch & Addington, 2007). Since its beginning in 1973, the Census Bureau and the Bureau of Justice Statistics (BJS) implemented the survey to detect non-lethal violent and property victimizations, both reported and not reported to the police (Truman & Brotsos, 2022). The NCVS sample sizes varied over time (BJS, 2022a). From 1993 to 2021, the survey used a stratified multistage cluster design to obtain a sample of about 70,000 to 150,000 civilian noninstitutionalized households per year. All household members aged 12 years and older were eligible for interviews, yielding a total of about 137,000 to 300,000 persons interviewed per year. Response rates were high, as an average of 84% of eligible households and 87% of age-eligible household members completed interviews in 1993–2021 (BJS, 2022a). To enhance the quality of recall responses and to improve the cost-effectiveness of interviews, the NCVS uses a panel design whereby information on criminal victimization is gathered for each person or household through repeated interviews at 6-month intervals for a period of 3 years (Lynch & Addington, 2007). We are mainly interested in the NCVS incident files, which contain information on the characteristics of victimization experiences, including victim and offender characteristics and whether the police were notified.
Specifically, our analyses use two versions of the NCVS data files. The national public-use incident files (1993–2021) allow us to see crime reporting trends in the most recent years for which data are available (BJS, 2022a). The metropolitan public-use data (2000–2015) are a special subset of the NCVS data created by the BJS and the Census Bureau for the largest 52 metropolitan statistical areas (MSAs) to allow the investigation of victimizations at the MSA level (BJS, 2022b). 1 From 2000 to 2015, the 52 MSAs represented about 56% of the U.S. population, and victimizations from the MSA file accounted for about 54% of victimizations in the NCVS national file. The five largest MSAs—New York City, Los Angeles, Chicago, Dallas, and Houston—represented about 18% of the U.S. population and 16% of victimizations in the NCVS.
Research Objectives and Study Variables
Objective 1: Trends in Police Notification
Following Baumer and Lauritsen (2010), we used a two-step strategy to examine trends in police notification. First, as an exploratory tool, we calculated the percentage of victimizations reported to the police over time for both the United States and the 52 MSAs. 2 The annual rates were smoothed using 3-year moving averages to reduce the influence of year-to-year fluctuations.
Second, to better understand trends at the MSA level, we used logistic regression models to estimate temporal changes in the likelihood of reporting, controlling for expected changes in crime, victim, and offender attributes and survey methodology. The dependent variable, police notification, was a dichotomous indicator of whether an incident was reported to the police (1 = yes and 0 = no). The key independent variables were the year in which the incident occurred (used to test for trends in police notification) and MSA locations (used to test for variation in police notification across MSAs). Similar to previous studies of trends (Baumer & Lauritsen, 2010), year squared and year cubed terms were added in the models to measure any nonlinear effects of the year variable. 3
The control variables used for the analyses are presented in Online Appendix 1. For violent crimes, the factors that may influence crime reporting include crime type (robbery, rape/sexual assault, aggravated assault, and simple assault), crime severity (type of weapon, the use of physical force, and injury type), the victim–offender relationship (intimate partner, family member, acquaintance, and stranger), whether the incident occurred in a private location, and whether the incident was a series crime according to the NCVS classification (Felson et al., 2002; Lauritsen & Rezey, 2018). 4 The characteristics of victims include gender, age, race/ethnicity, marital status, household income, education, and homeownership (Dugan & Apel, 2003; Schreck & Fisher, 2004). 5 Offenders’ gender, race, and age are also controlled (Powers et al., 2020; Rennison, 2007).
For property crimes, offender information was typically unknown in the NCVS. Instead, control variables were used mainly to account for differences in victim characteristics and the characteristics of the incidents, including crime type (burglary, motor vehicle theft, and theft), whether any property was taken or damaged, whether the victim or a household member was present during the incident, and whether the crime was a series incident.
To control for survey methodology, we include whether an interview was conducted by phone or in person, and whether someone besides the respondent was present during the interview. These administration methods may affect responses to questions about victimization or the corresponding coping strategies (Cantor & Lynch, 2000). Their inclusion is therefore relevant in the study of police notification. 6
Objective 2: Trends in Victims’ Perceptions of the Police
To assess whether there were systematic changes in perceptions of police by victims in the post-2000 period, we examined victims’ reasons for reporting and not reporting crimes to the police. The data, as previous studies have shown, are a valuable resource for tracking how victims evaluate the police in deciding the incentives and costs of crime reporting (Felson et al., 2002; Slocum, 2018; Xie, 2014). Our analyses focus on “police wouldn’t help,” an indicator of negative police perceptions coded 1 if a victim did not call the police because “police wouldn’t think (the crime) was important enough,” “police would be inefficient,” or “police would be biased” (see Online Appendix 2 for a list of all categories of reasons given by victims in the NCVS MSA file). 7
Using a similar two-step research strategy, we first plotted the changes over time in the percentages of victimizations in which victims thought “police wouldn’t help” for both the United States and the 52 MSAs, using 3-year moving averages. Second, we modeled victims’ perceptions using logistic regression analyses and explanatory variables, outlined in Online Appendix 1, to control for the influence of crime, victim, offender, and survey methodology characteristics on the judgment that “police wouldn’t help.” 8
Results
Declining Rates of Crime Reporting in the United States and MSAs
In Figure 1A, we see a change in crime reporting rates: the national 3-year average rates stopped rising in 2003, after which they started to decline, most notably after 2009, presenting a downward trend into 2021. Figure 1B shows that both non-lethal violence and property crimes followed this trend, though with some minor differences in the timing of the decline. Property crimes’ reporting rates stayed relatively stable from 2003 to 2009, before the decline after 2009. Violent crimes’ reporting rates were more volatile—they started to move downward after 2003, but then the rates bounced back in 2009–2011. The reporting rates of violent crimes then declined steadily after this, following a downward path similar to that of property crimes.
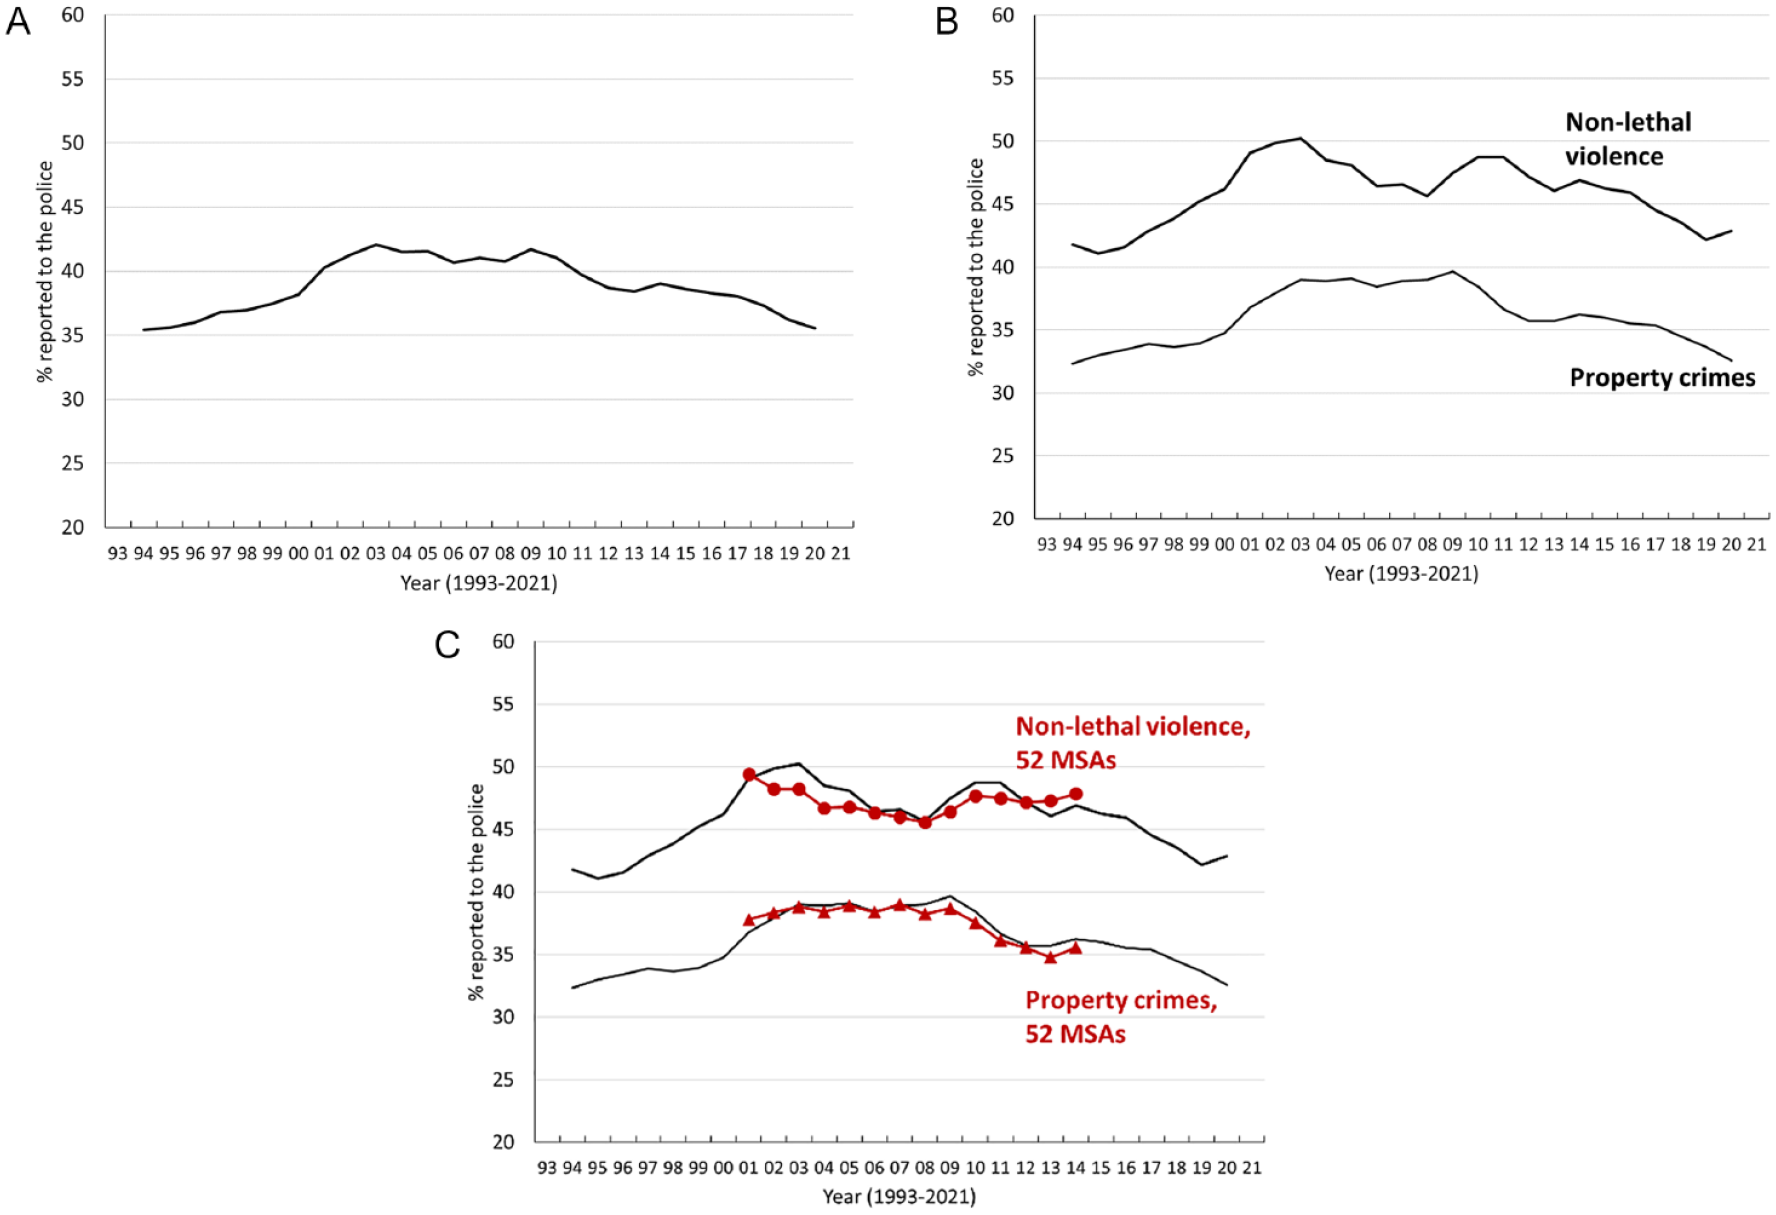
Rates of Crimes Reported to the Police in the United States and 52 MSAs in the NCVS, 3-Year Moving Averages: (A) National Rates, Total Crimes; (B) National Rates, by Crime Type; and (C) National Versus MSA Rates.
From Figure 1C, we can see the MSAs, when pooled together, showed trends largely consistent with the national trends. We do not have MSA data for the years after 2015, but we used the available MSA data to assess the within-country geographic variation of crime-reporting trends, which cannot be done with the NCVS national data.
Model-Predicted Probabilities of Crime Reporting in MSAs: More Evidence of Declines
Using survey-weighted logistic regression, we report in Table 1 the association between police notification and each of the Year and MSA variables, net of controls for variables in Online Appendix 1. Table 1 comprises two parts. In Panel A of Table 1, we report the results with all MSAs pooled together. Eight models are reported, one for each crime type. 9 In Panel B of Table 1, we report the results for each of the five largest MSAs. In all models, high-order polynomial year effects are reported only when they significantly improved model fit. To help visualize the trends, Figure 2 shows the model-predicted probabilities of reporting from 2000 to 2015, holding the other covariates at mean values.
Survey-Weighted Logistic Regression Models for Police Notification, 52 MSAs (2000–2015).
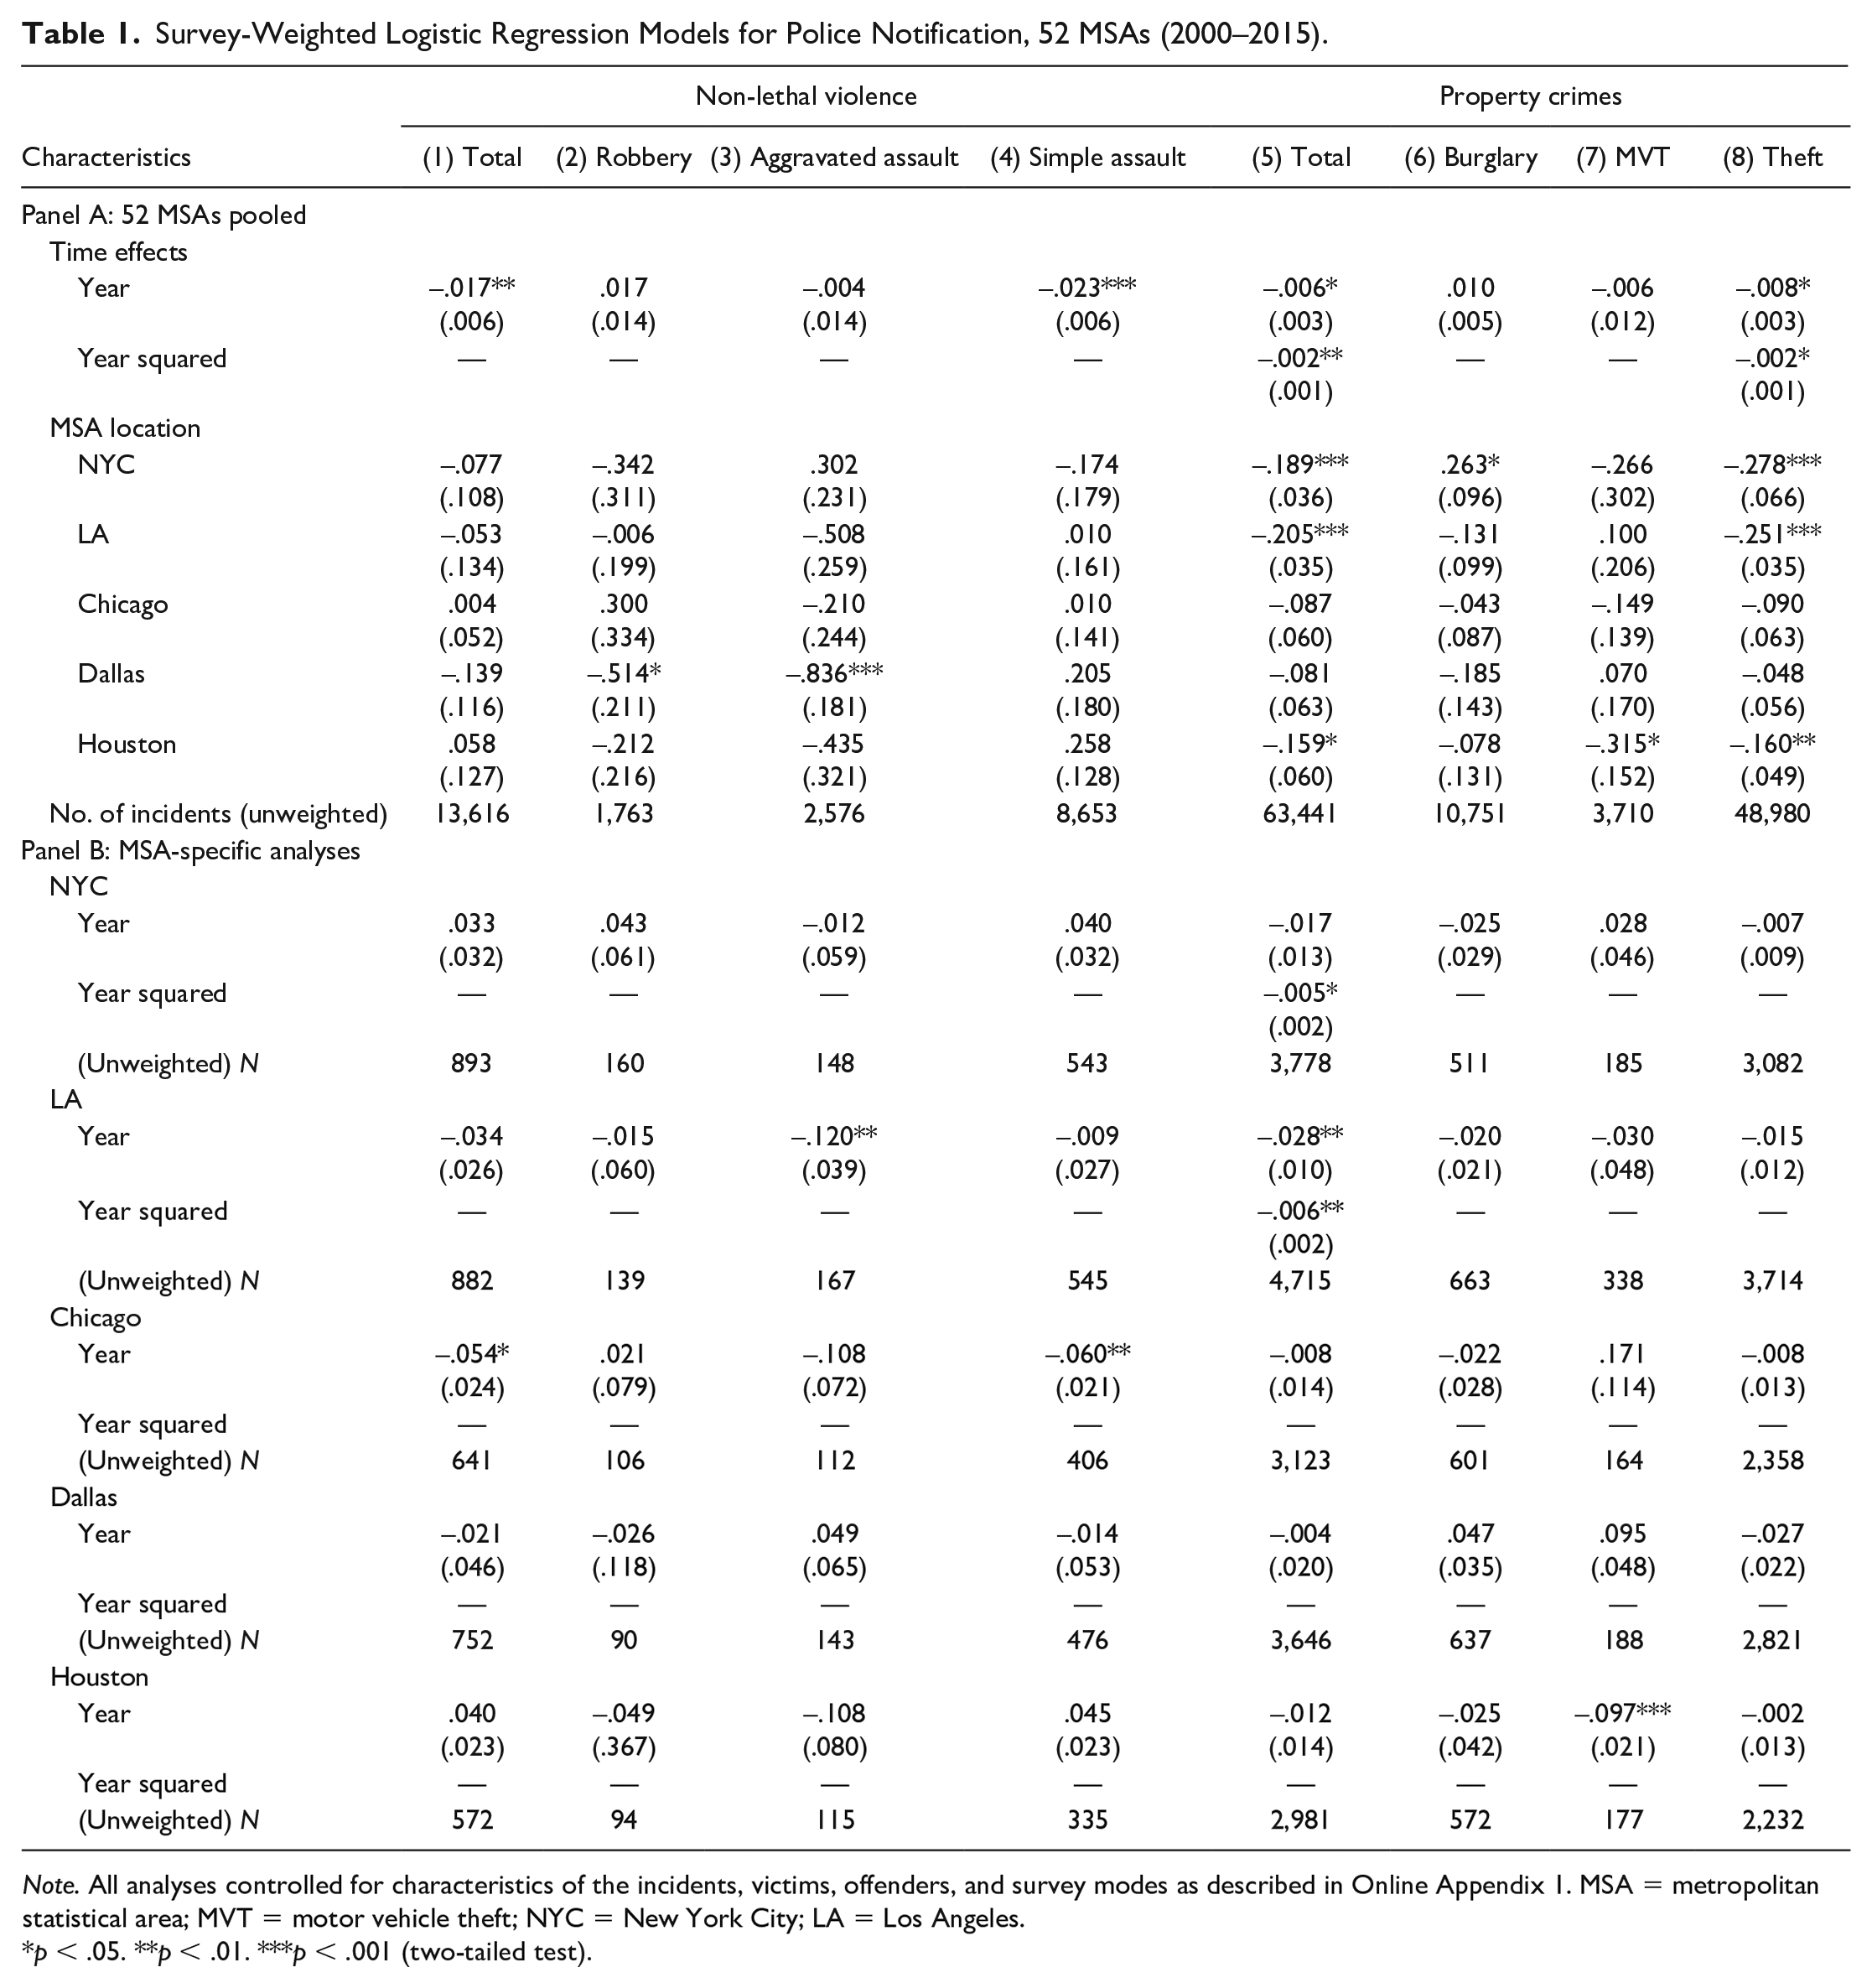
Note. All analyses controlled for characteristics of the incidents, victims, offenders, and survey modes as described in Online Appendix 1. MSA = metropolitan statistical area; MVT = motor vehicle theft; NYC = New York City; LA = Los Angeles.
p < .05. **p < .01. ***p < .001 (two-tailed test).
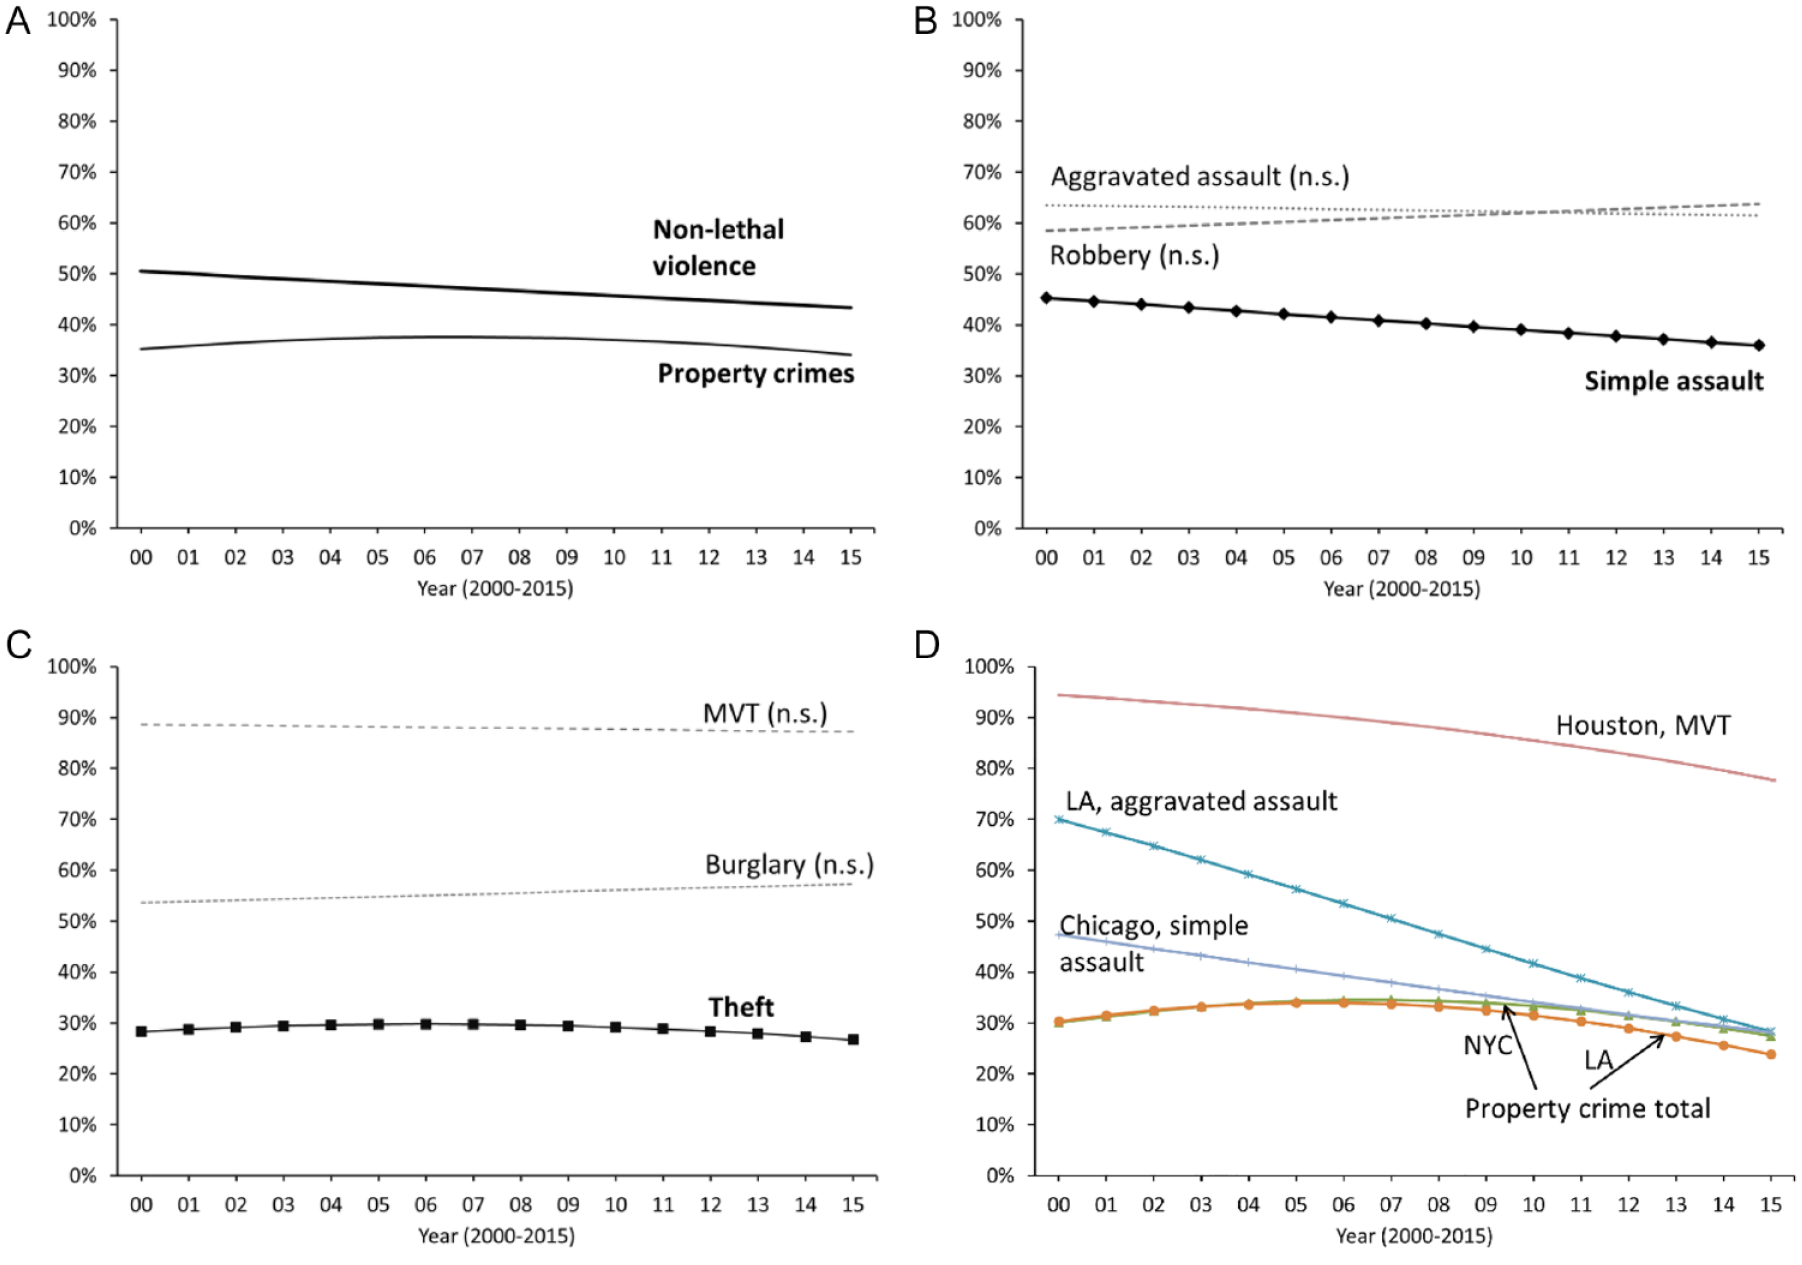
Model-Predicted Probability of Police Notification for Victims With Mean Characteristics, 52 MSAs (2000–2015): (A) All Crimes; (B) Non-Lethal Violence; (C) Property Crimes; and (D) Five Largest MSAs, Significant Trends Found.
As shown in Figure 2A, when the MSA data were pooled, statistically significant year effects were observed for “total non-lethal violence” and “total property crimes,” though the effect sizes were not large for the study period (2000–2015). When each crime type was assessed individually, significant time trends were found for simple assaults (Figure 2B) and thefts (Figure 2C), not for other crime types (indicated by the dotted lines). Interestingly, however, when we analyzed crimes in the five largest MSAs, some MSAs showed sizable declines in reporting as indicated in Figure 2D. For example, motor vehicle thefts in Houston, aggravated assaults in Los Angeles, and simple assaults in Chicago all exhibited large reductions in the estimated probabilities of police notification from 2000 to 2015. These declines were not widespread across all MSAs as the coefficients in Panel B of Table 1 indicate. However, the fact that all lines in Figure 2A to D have either flat (not statistically significant at .05 level) or downward slopes suggests that the trend of crime reporting has indeed reversed—going from increases in the 1990s as past research found, to decreases as the present study shows—and this change is not an isolated event in a single location.
Large Changes in Victims’ Perceptions of the Police
Using 3-year moving average rates, Figure 3 shows that at both the national and MSA levels, the proportions of victims who did not call the police because “police wouldn’t help” increased significantly after 2005. Before 2005 (Figure 3A), the levels of these perceptions were low among crime victims: the rates hovered around 8%, and had shown very little changes since the 1970s, as our analysis of the NCVS national data reveals (results unreported but available upon request). 10 As shown in Figure 3B, the increase in victims’ concerns about police helpfulness was common among both non-lethal violent and property crimes. From 2005 to 2021, the national 3-year average rate of “police wouldn’t help” rose from 9% to 18% for victims of property crimes and from 6% to 12% for victims of non-lethal violence. In Figure 3C, we see that the MSA trends (all 52 MSAs pooled together) and the national trends are similar. We next use the MSA data to assess the geographic variations in victims’ perceptions.
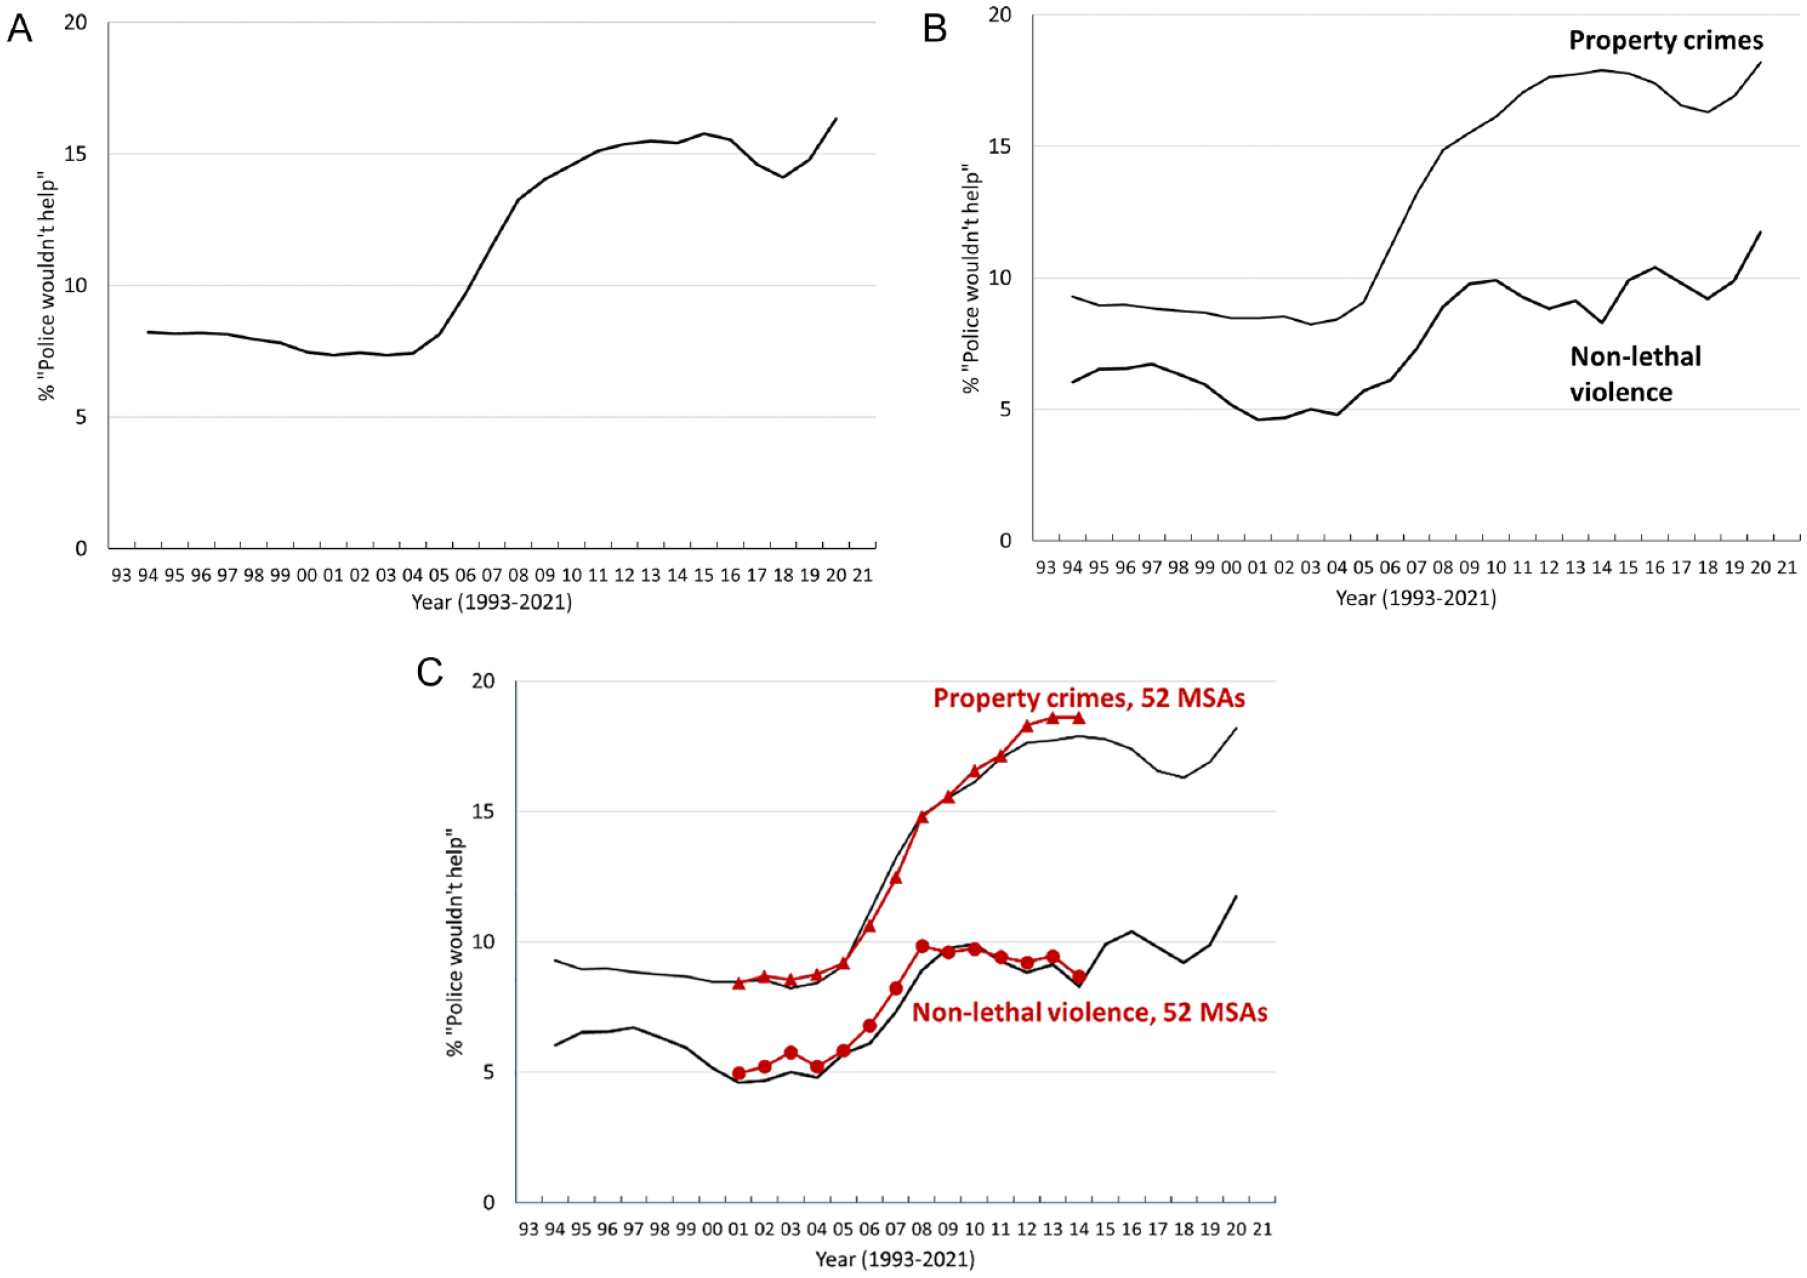
Percentages of Crimes in Which Victims Did Not Call the Police Because “Police Wouldn’t Help,” 3-Year Moving Averages: (A) National Rates, Total Crimes; (B) National Rates, by Crime Type; and (C) National Versus MSA Rates.
Model-Based Evidence of Widespread Changes in Victims’ Perceptions Across the MSAs
Table 2 presents the key findings of survey-weighted logistic regression analyses, with Panel A showing the results for all MSAs pooled together, and Panel B the results for each of the five largest MSAs. In Panel A of Table 2, we see that victims of simple assault, burglary, and theft were significantly more likely to complain about “police wouldn’t help” in 2015 than in 2000, as we show in Figure 4B and C. The year coefficients are also positive but not statistically significant for robbery, aggravated assault, or motor vehicle theft, as the dotted lines in Figure 4 show.
Survey-Weighted Logistic Regression Models for “Police Wouldn’t Help,” 52 MSAs (2000–2015).
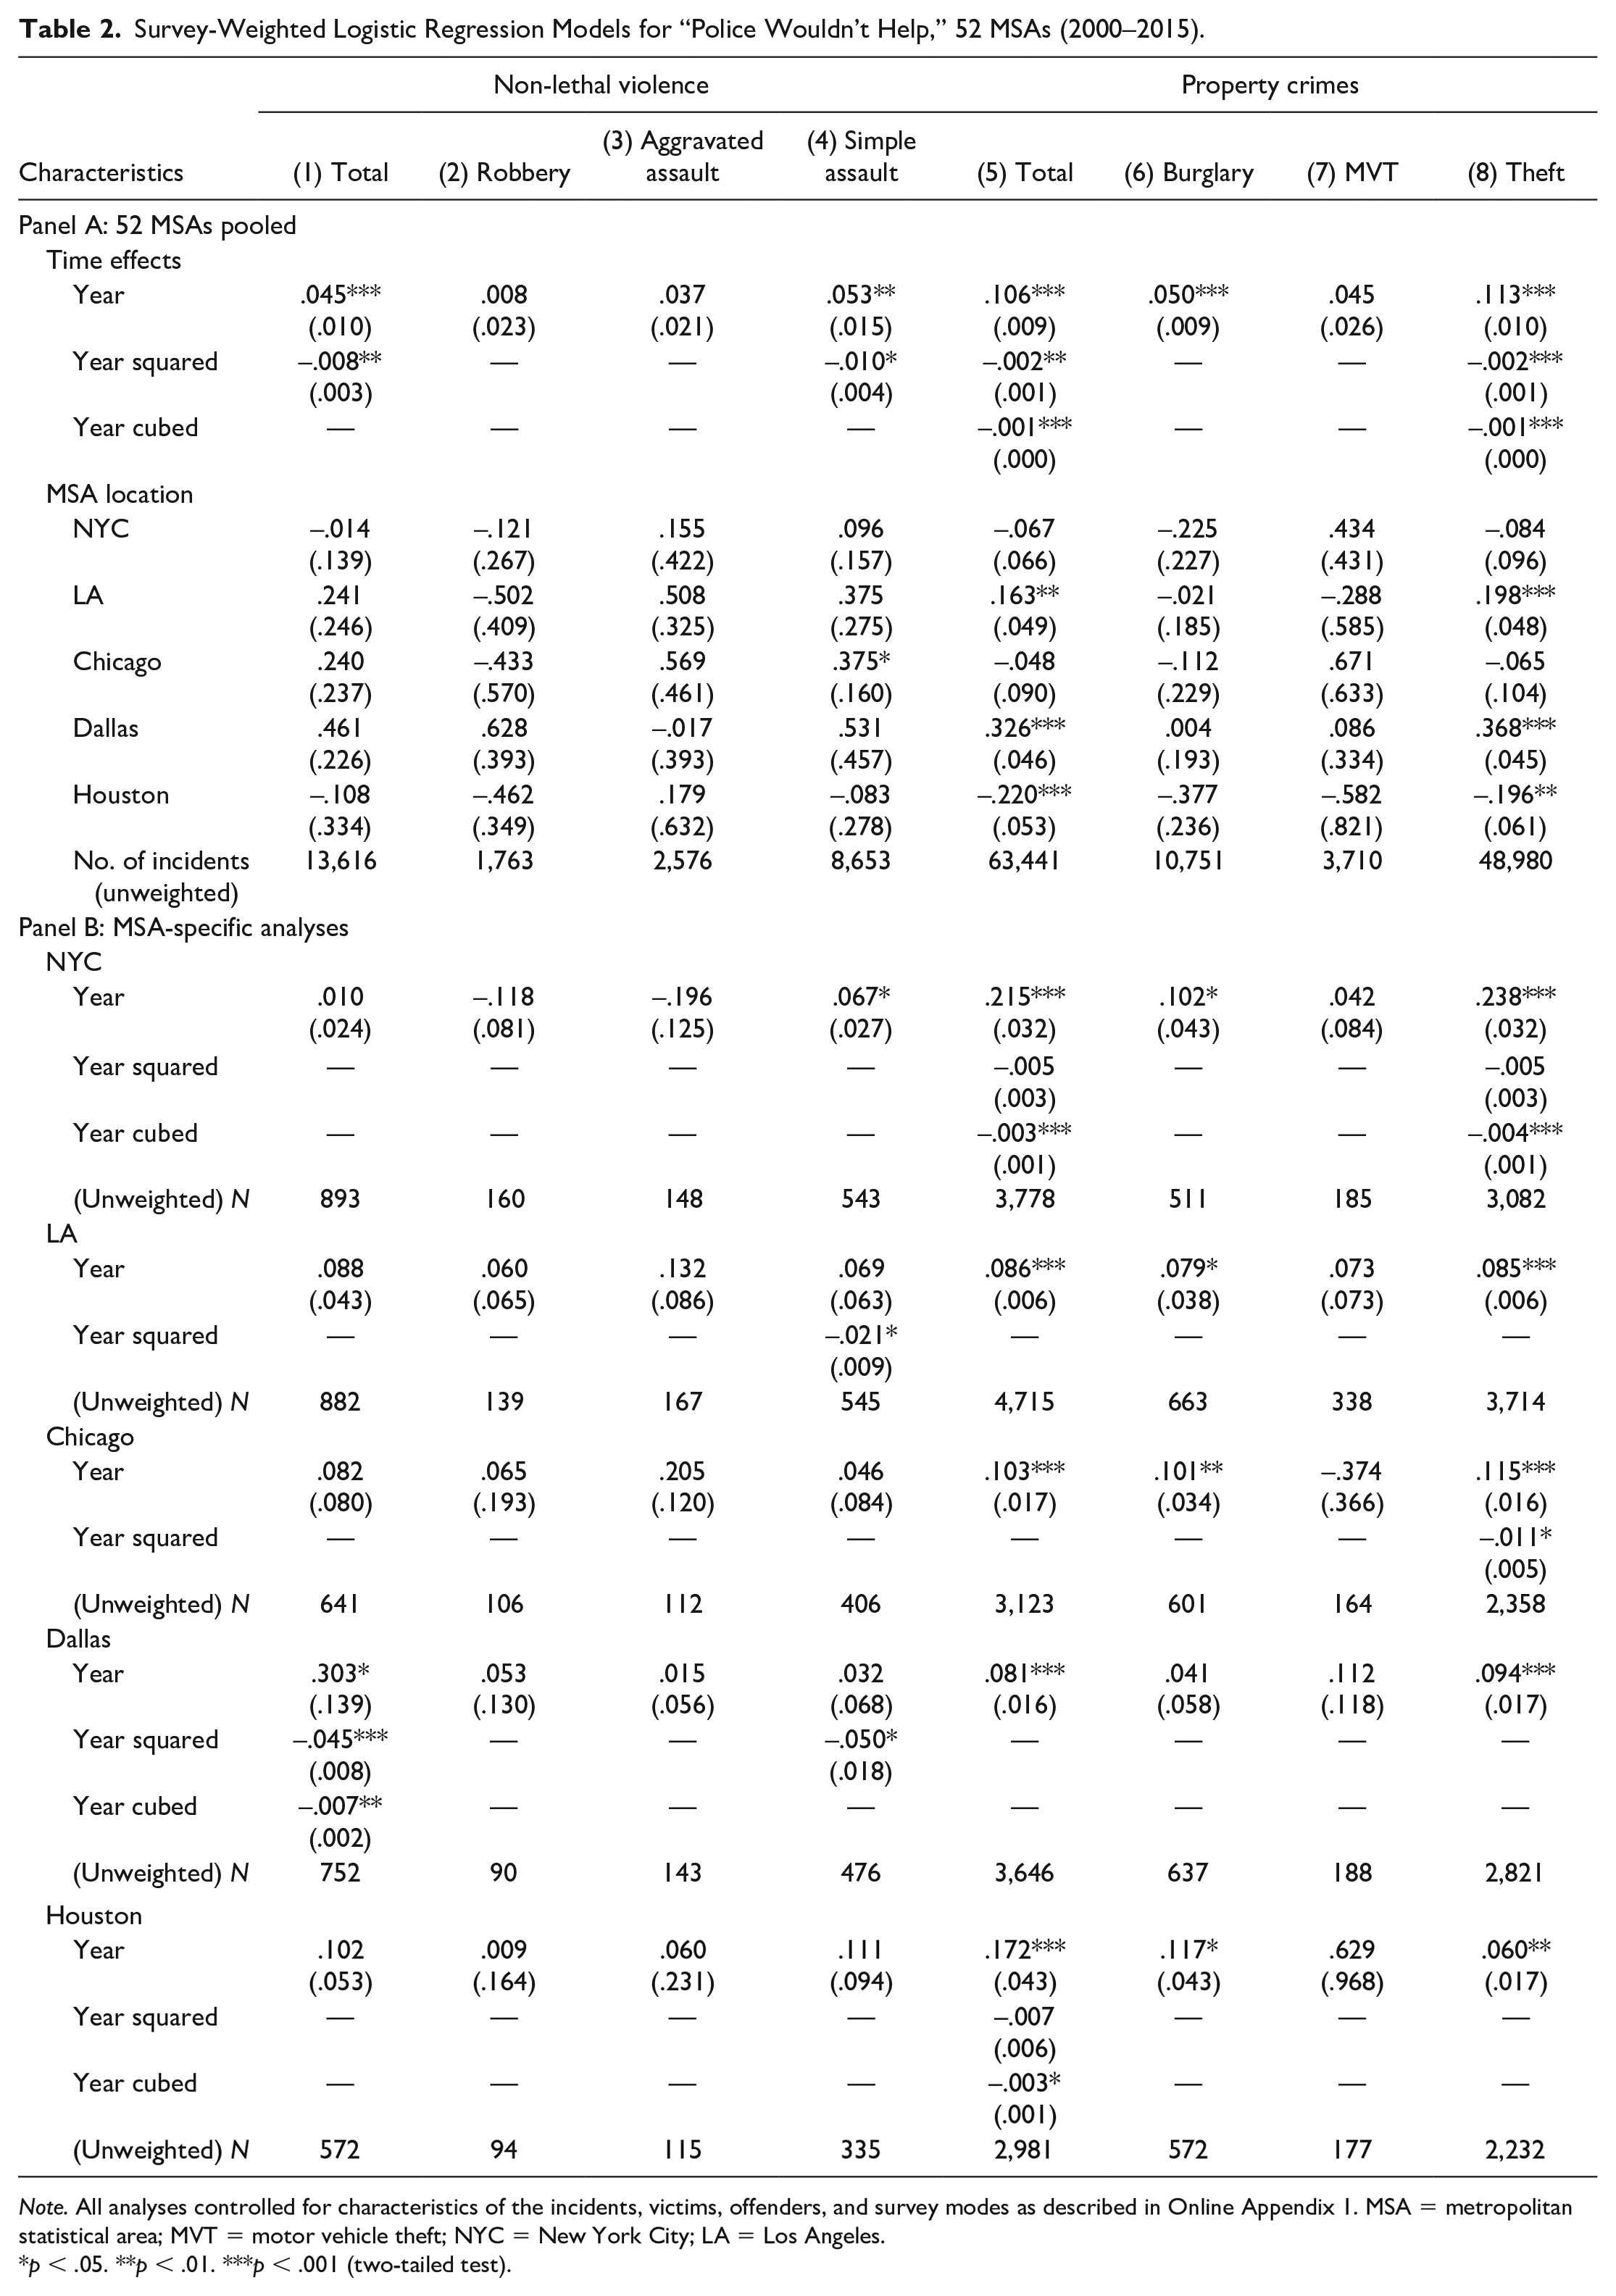
Note. All analyses controlled for characteristics of the incidents, victims, offenders, and survey modes as described in Online Appendix 1. MSA = metropolitan statistical area; MVT = motor vehicle theft; NYC = New York City; LA = Los Angeles.
p < .05. **p < .01. ***p < .001 (two-tailed test).
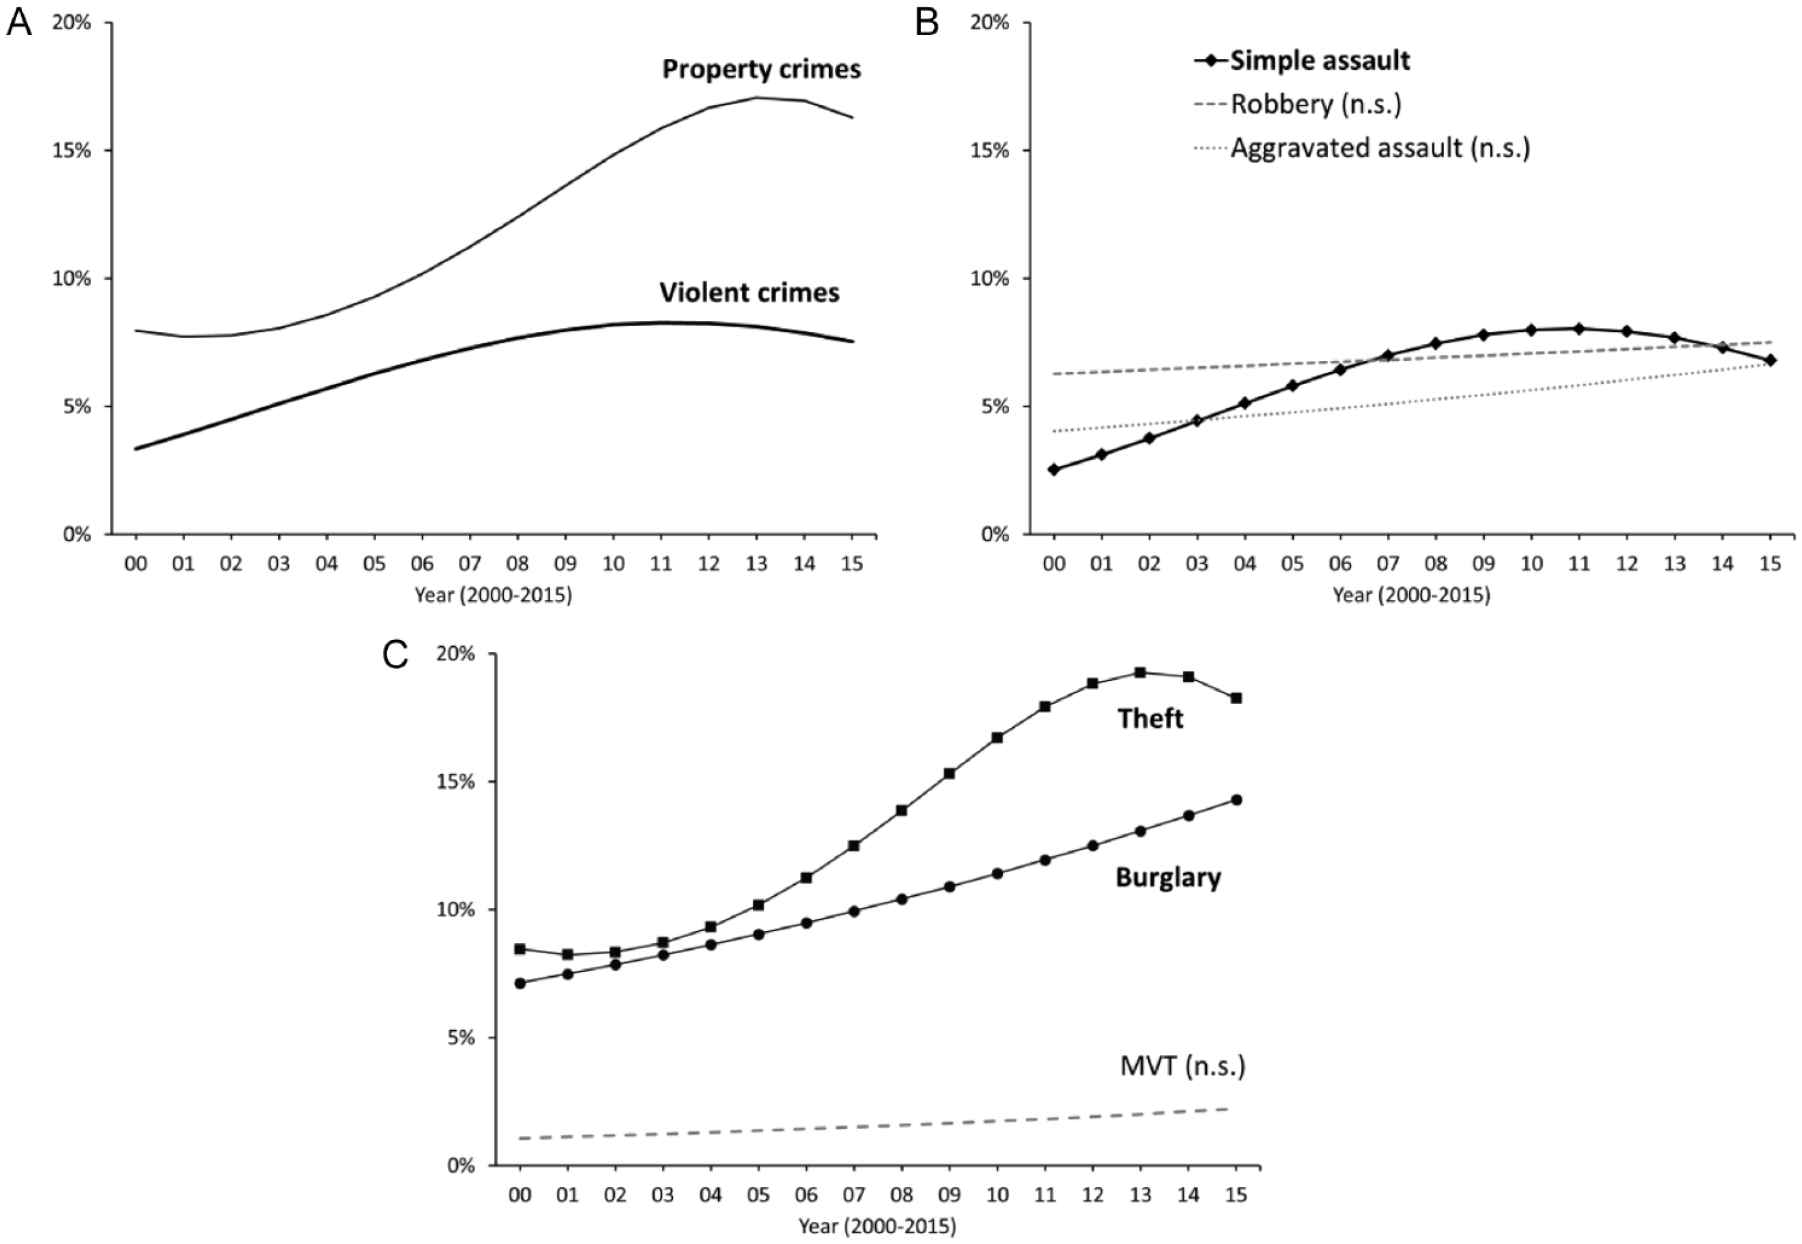
Model-Predicted Probability That Victims With Mean Characteristics Believe “Police Wouldn’t Help,” 52 MSAs (2000–2015): (A) All Crimes; (B) Non-Lethal Violence; and (C) Property Crimes.
The MSA-specific analyses in Panel B of Table 2 largely support the results observed in Panel A of Table 2. Specifically, in Figure 5, one can see clearly that for simple assault (Figure 5A), theft (Figure 5D), and burglary (Figure 5E), many MSAs showed significant increases over time in victims’ distrust of police, even though the pace of the increase may not be the same across the MSAs. In comparison, for victims of aggravated assault, robbery, and motor vehicle theft, the year coefficients were largely statistically insignificant (Figure 5B, C, and F). Interestingly, there was a small yet statistically significant increase in victims’ complaints about the police for motor vehicle theft victims in Los Angeles during the study period (Figure 5F). Still, the increase in victims’ complaints was largely concentrated among victims of simple assault, theft, and burglary.
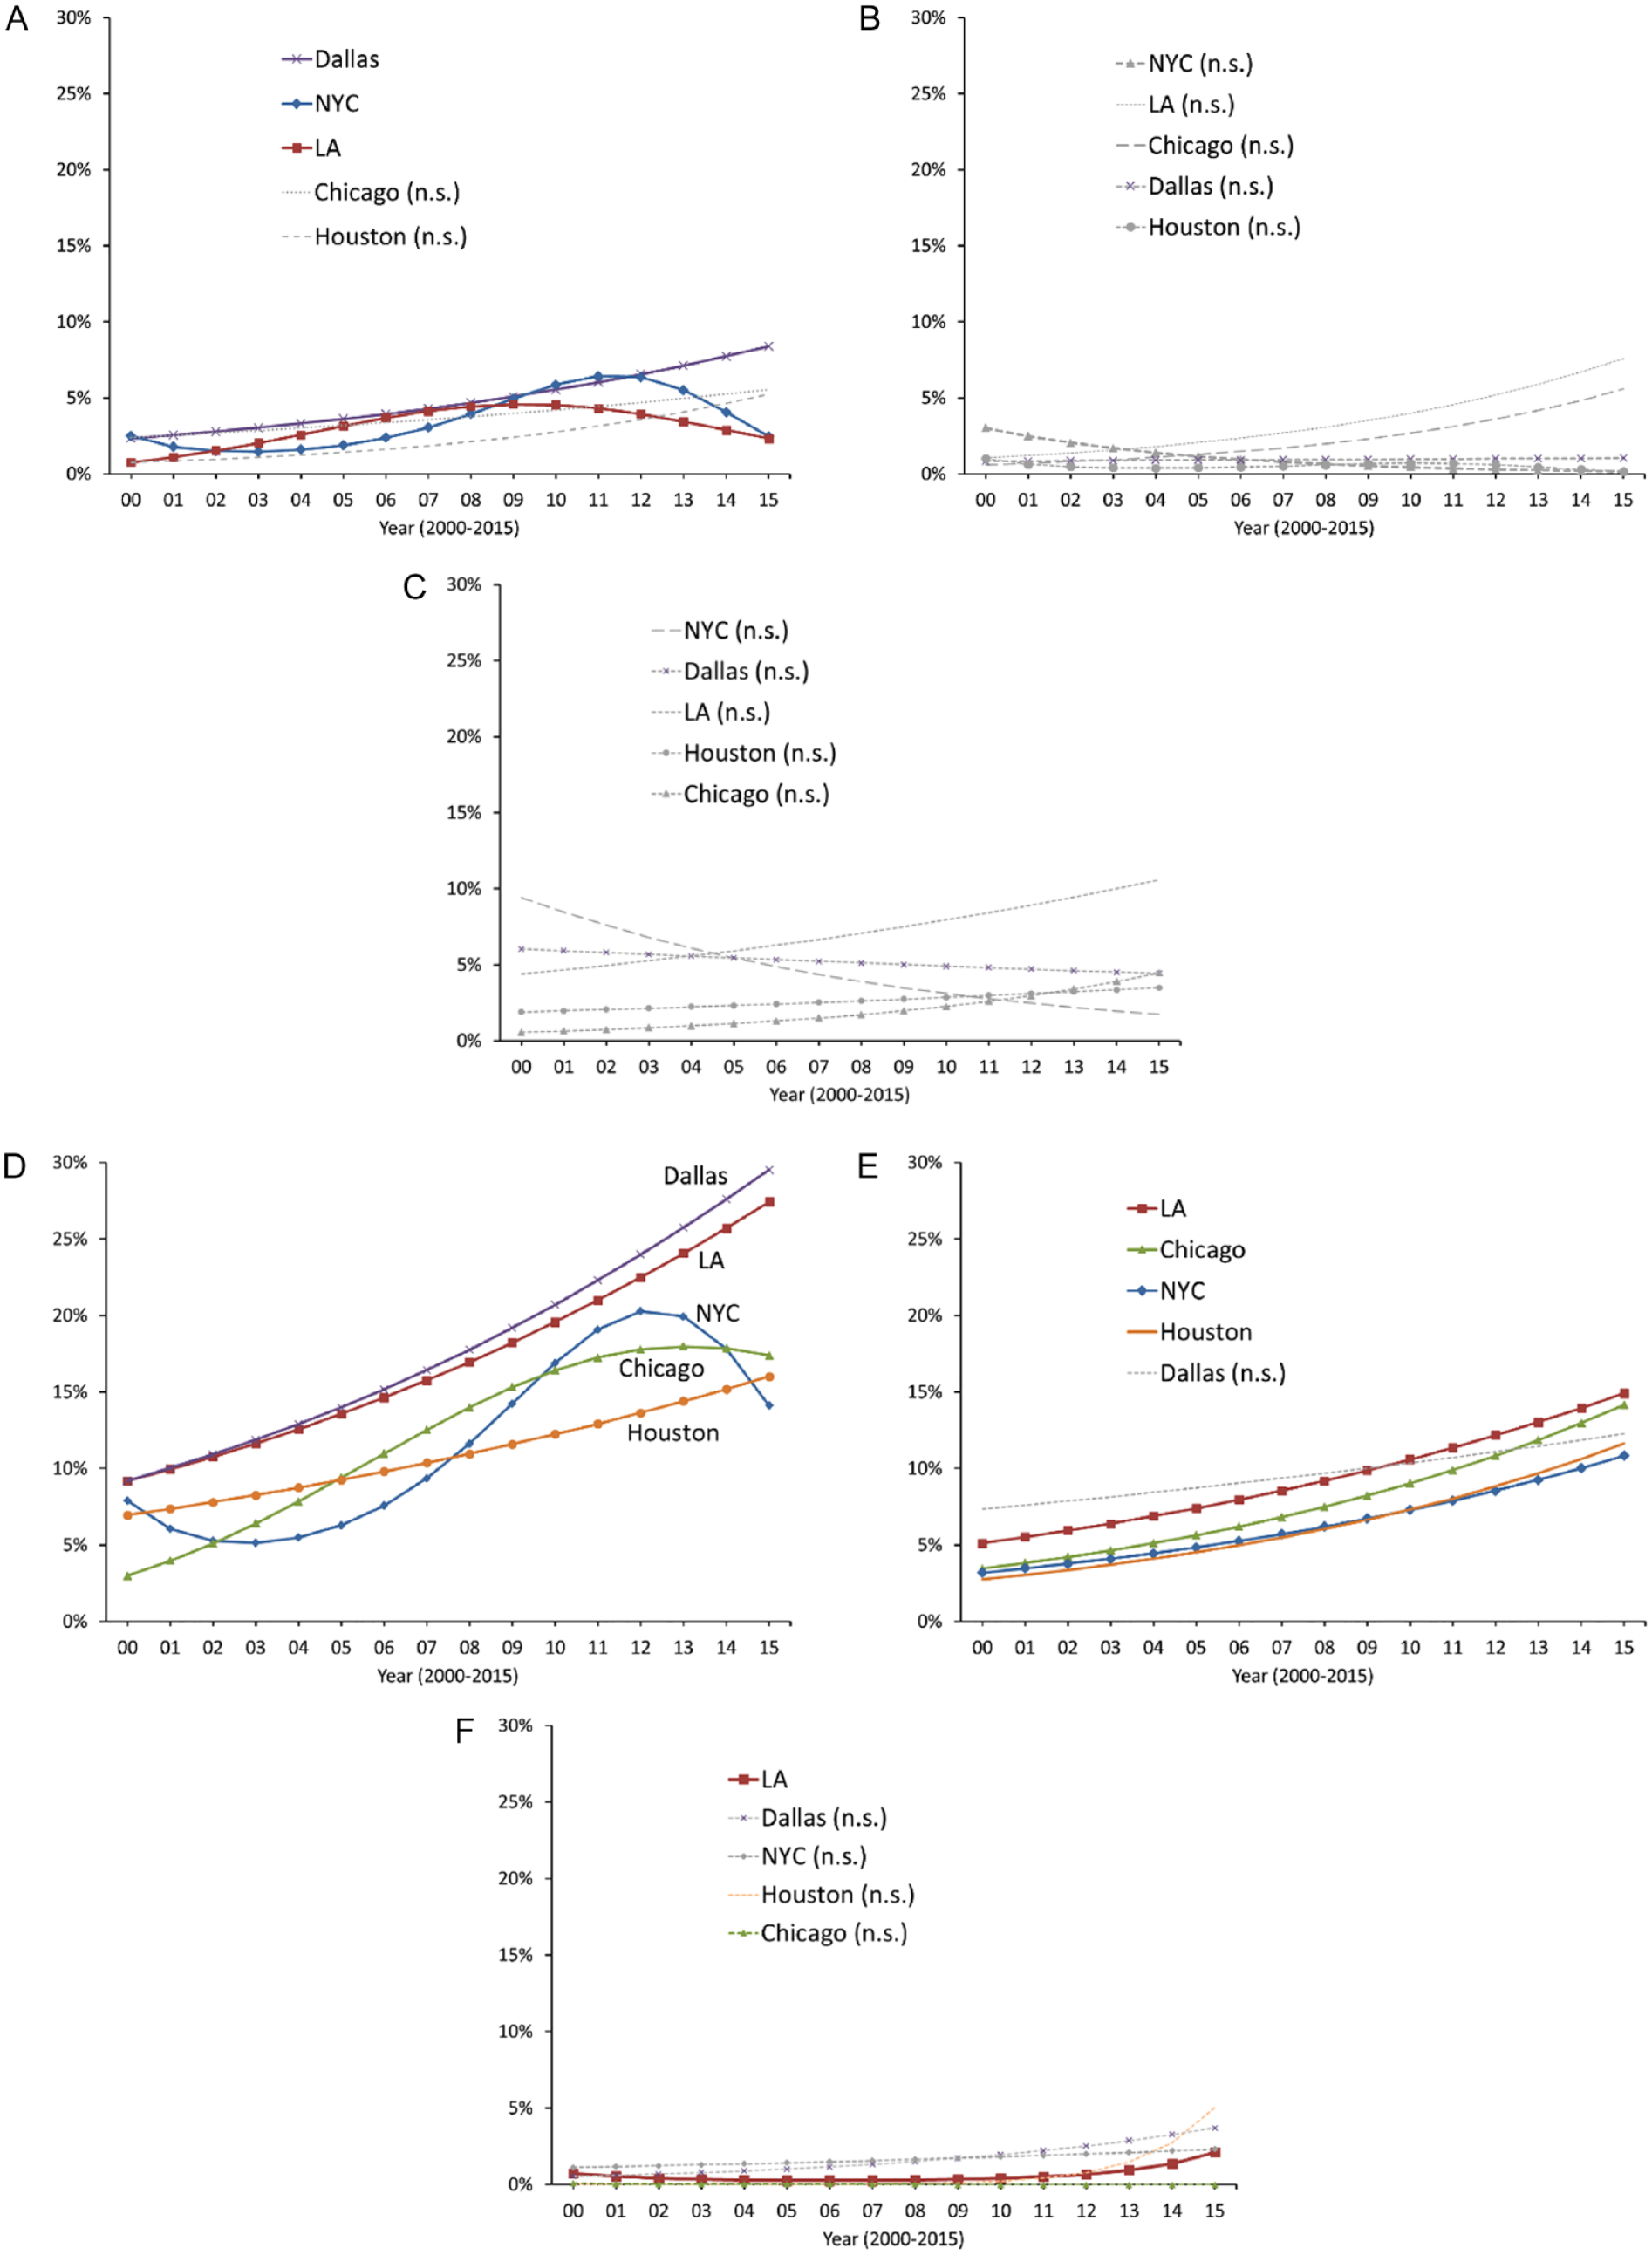
Model-Predicted Probability That Victims With Mean Characteristics Believe “Police Wouldn’t Help,” 5 Largest MSAs, by Crime Type (2000–2015): (A) Simple Assault; (B) Aggravated Assault; (C) Robbery; (D) Theft (E) Burglary; and (F) MVT.
Large Changes in Victims’ Perceptions Across Sociodemographic Groups
As a robustness check, we performed group analyses (Table 3, Models 1 through 19) based on victims’ race/ethnicity, gender, age, income, education, and homeownership. We separately analyzed non-lethal violence and property crimes, but because of sample size limitations, we did not disaggregate the data to more detailed crime types.
Estimated Time Effects in Survey-Weighted Logistic Regression Models for “Police Wouldn’t Help,” by Sociodemographic Characteristics of Victims, 52 MSAs (2000–2015).
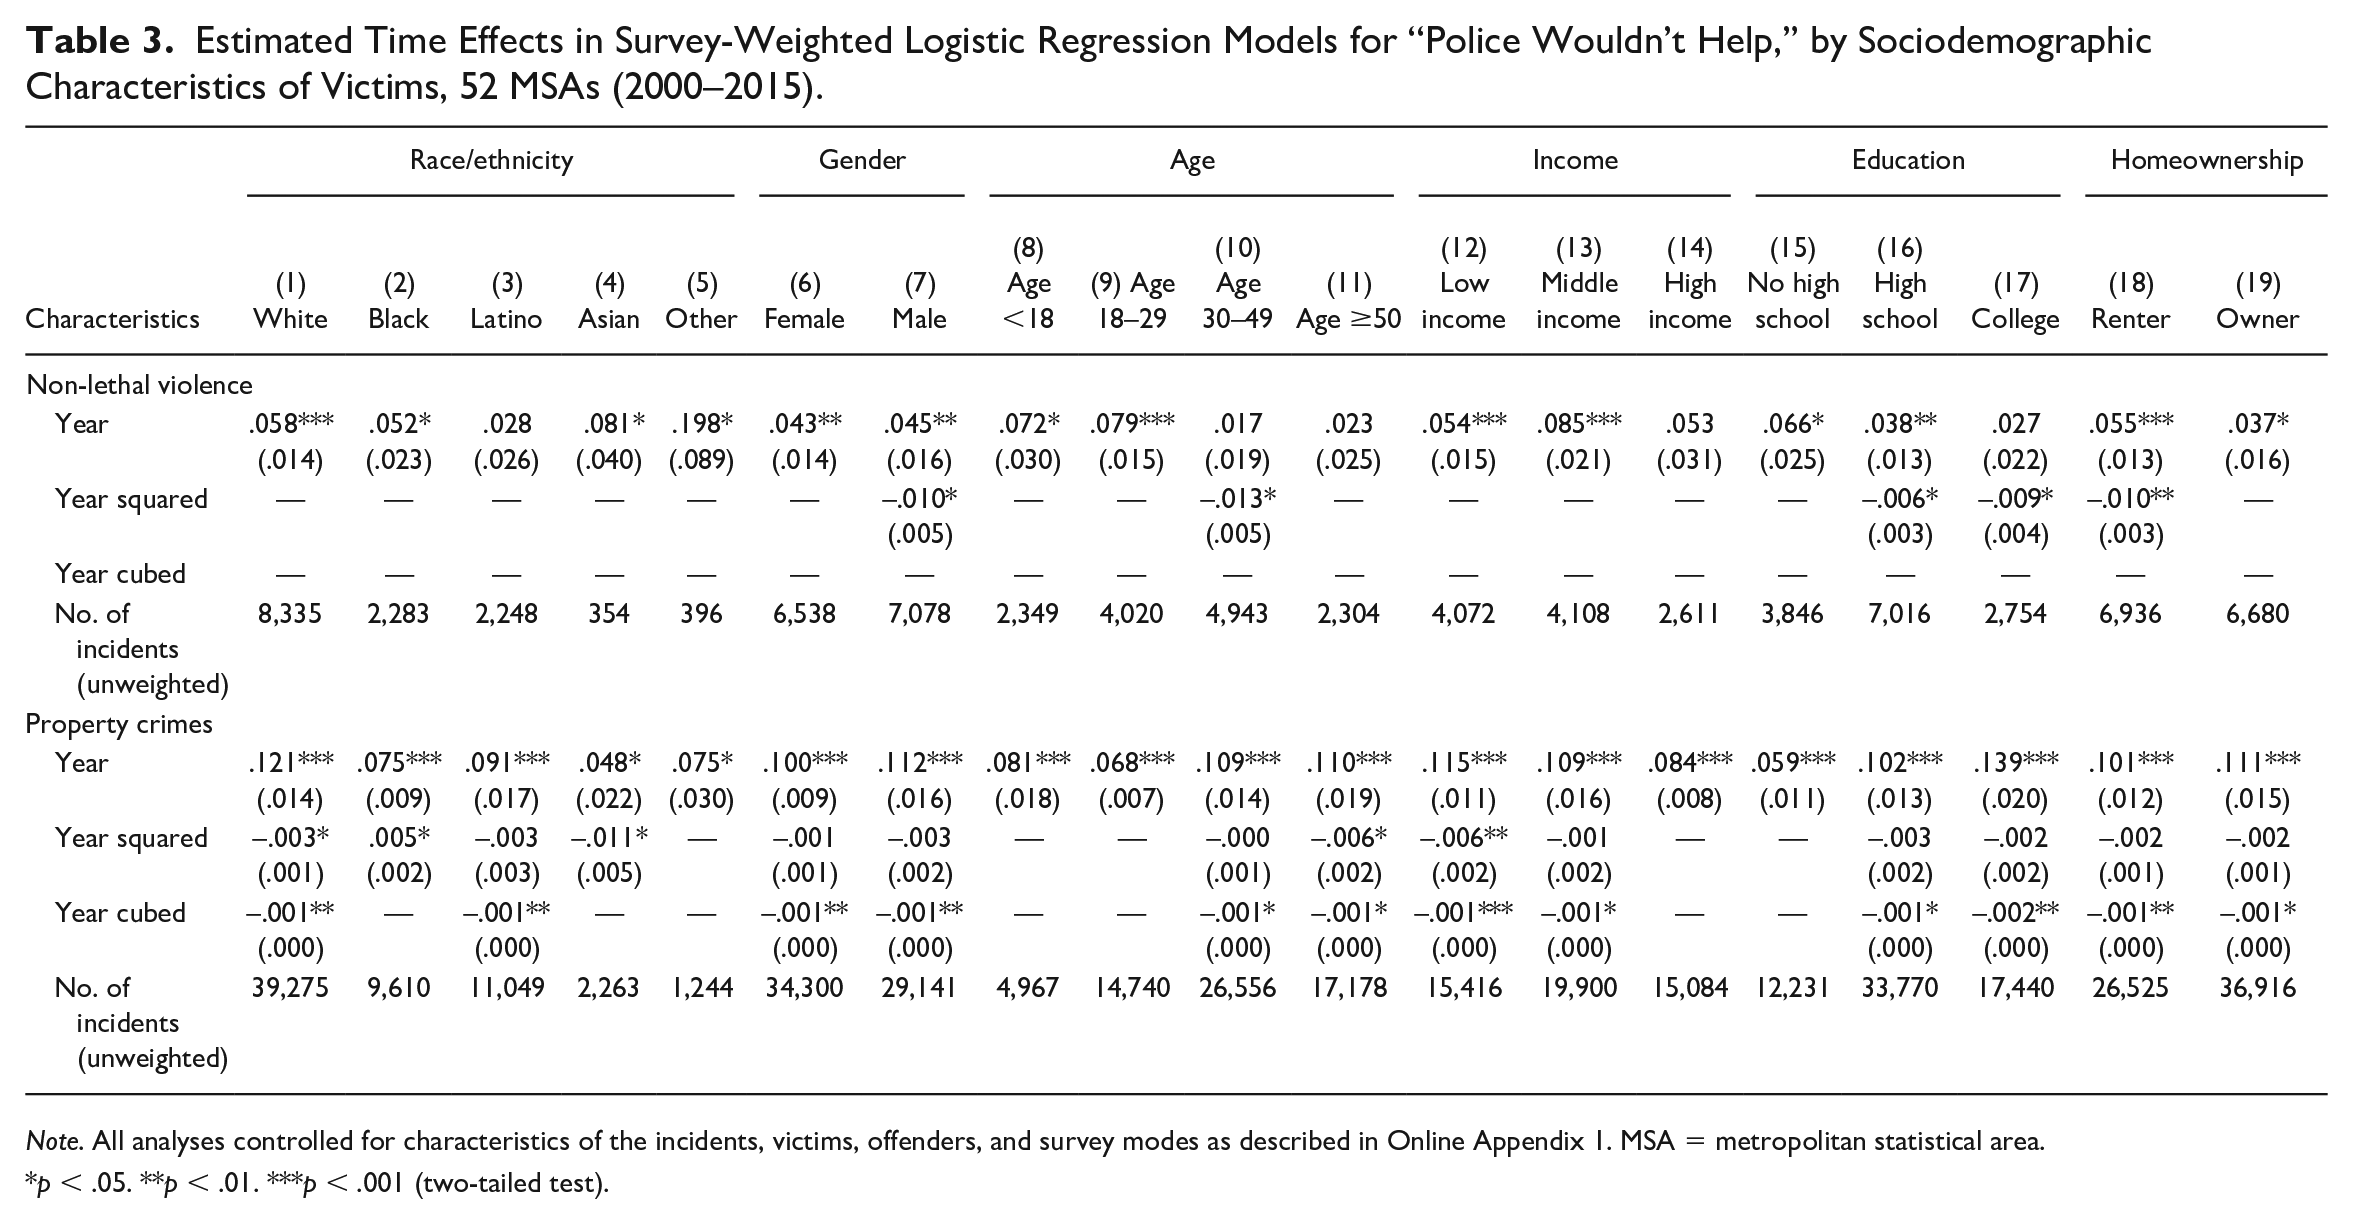
Note. All analyses controlled for characteristics of the incidents, victims, offenders, and survey modes as described in Online Appendix 1. MSA = metropolitan statistical area.
p < .05. **p < .01. ***p < .001 (two-tailed test).
In almost all sociodemographic groups in Table 3, statistically significant year effects were observed after controlling for relevant covariates. Figures 6 (non-lethal violence) and 7 (property crimes) display the relationships by plotting the predicted probabilities of victims reporting that “police wouldn’t help,” holding other variables to mean values.
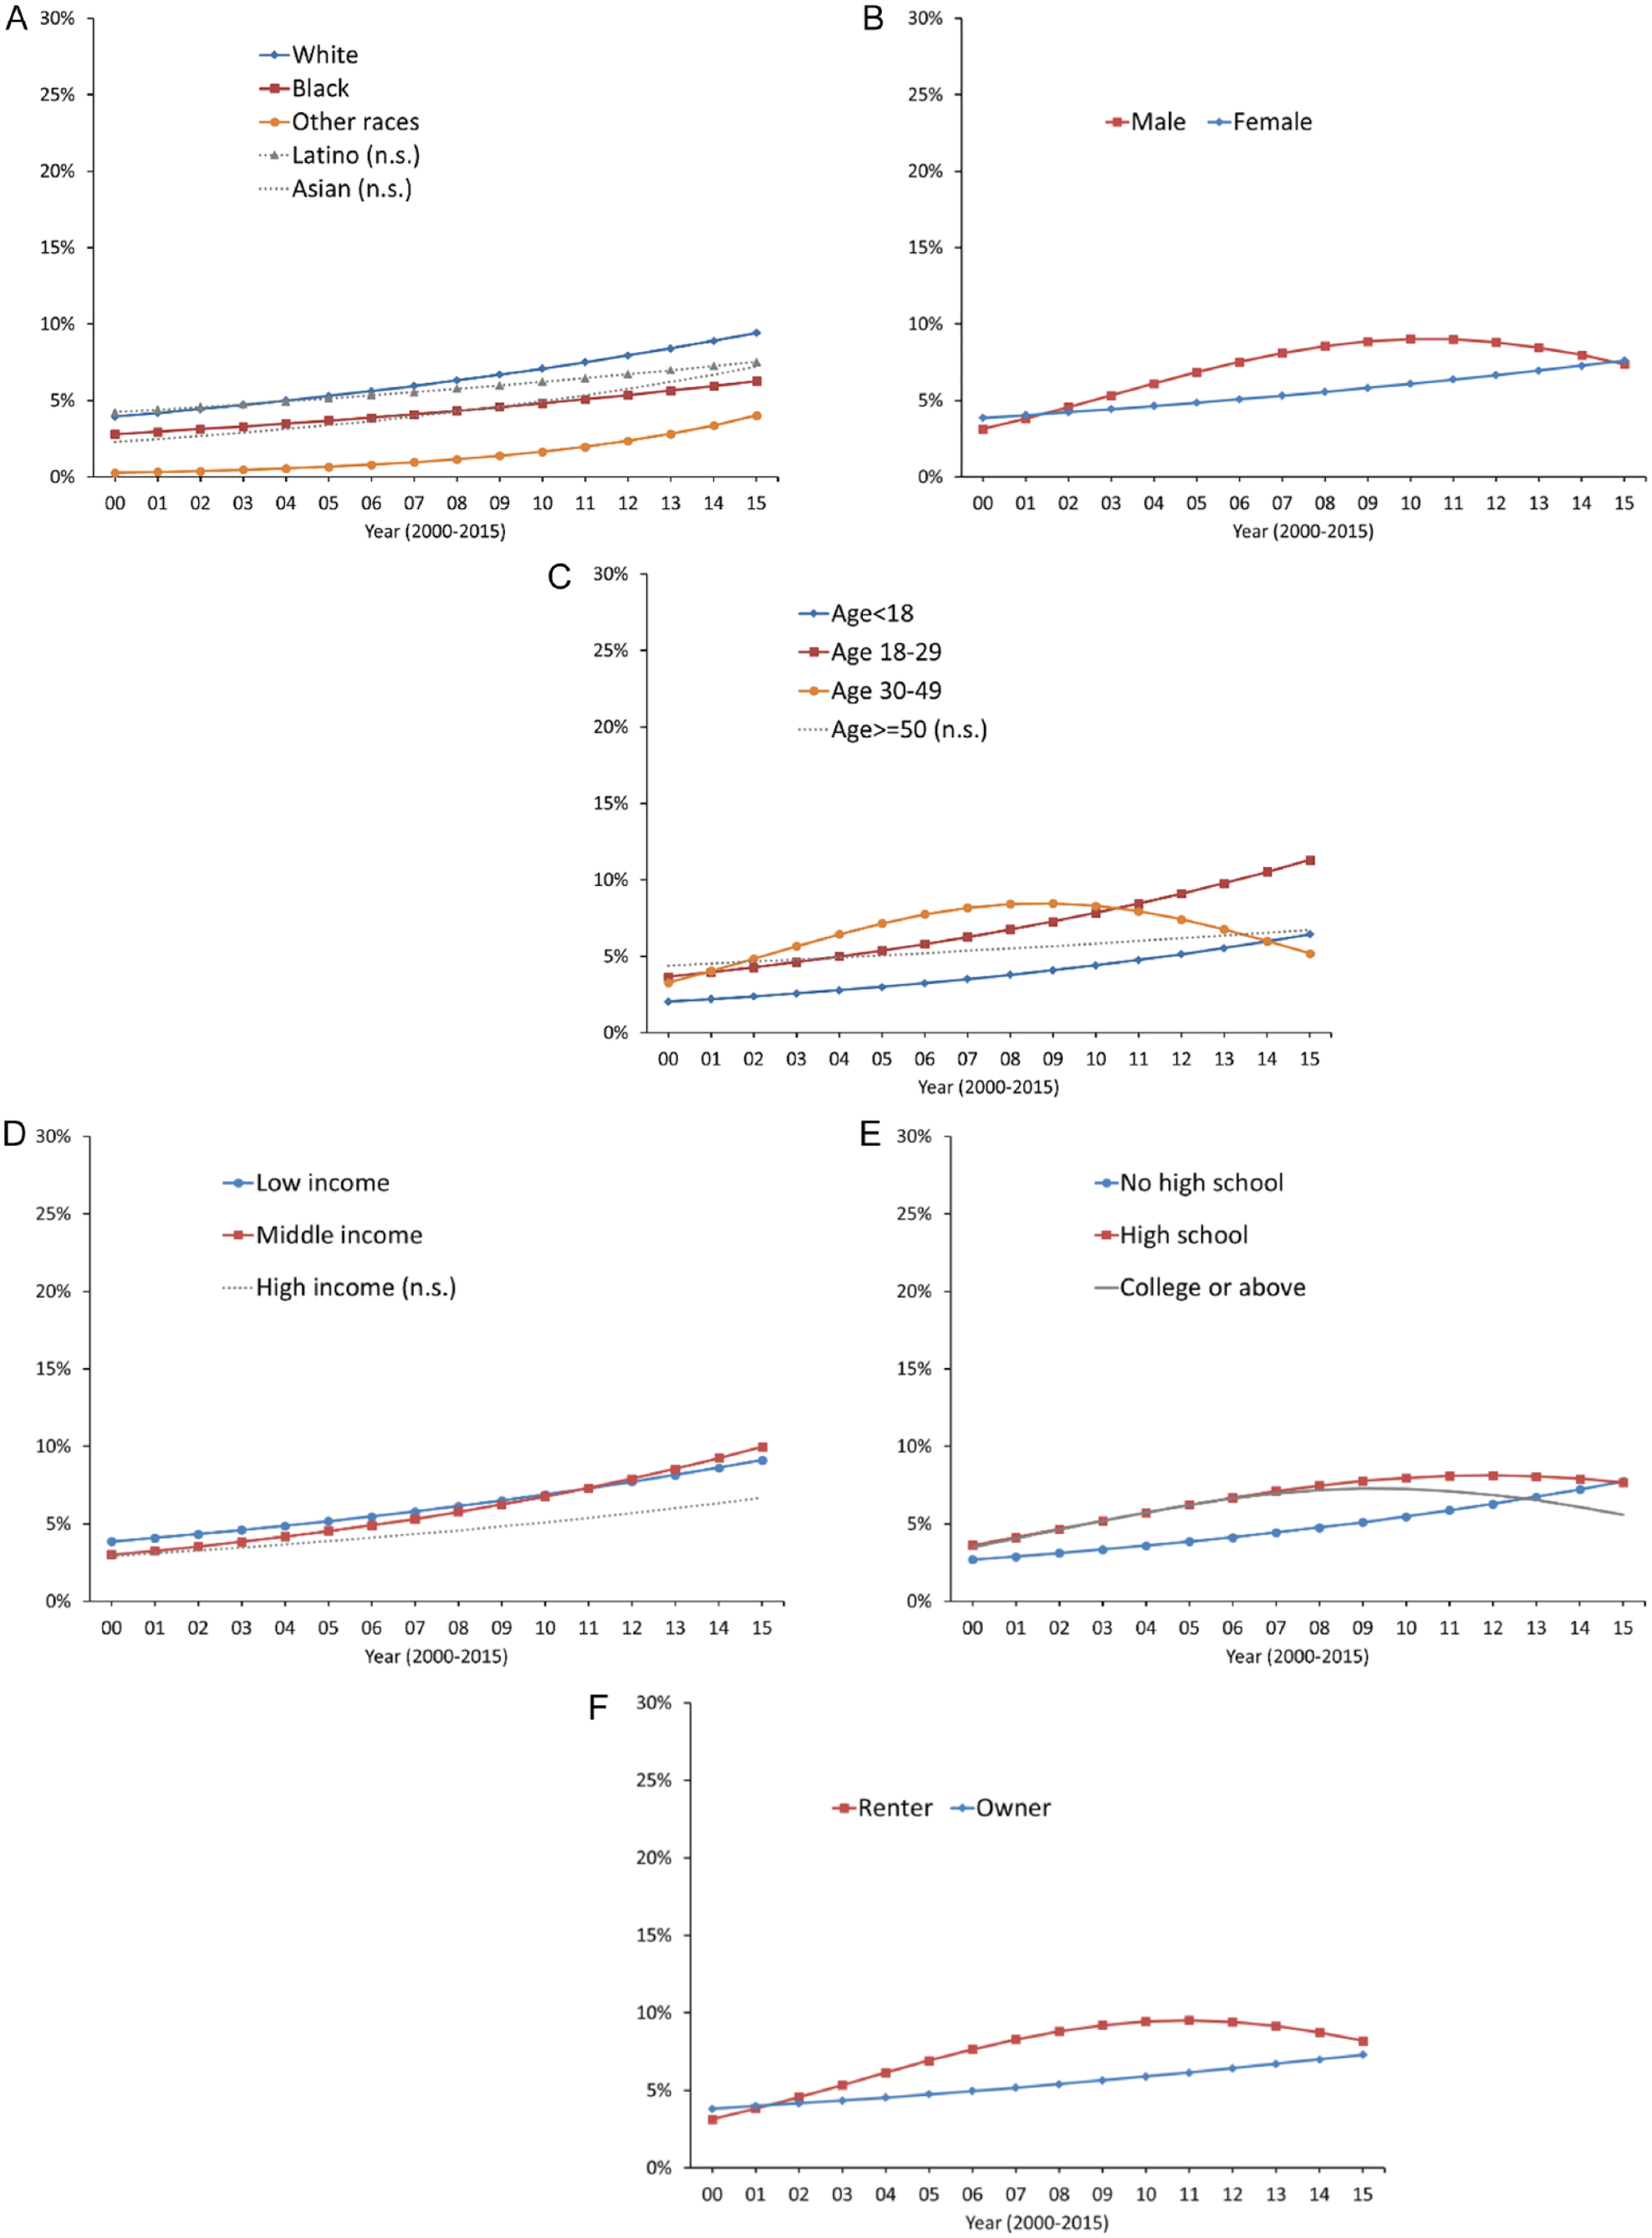
Model-Predicted Probability That Victims With Mean Characteristics Believe “Police Wouldn’t Help,” 52 MSAs (2000–2015), by Sociodemographic Characteristics of Victims, Non-Lethal Violence: (A) Non-Lethal Violence, by Race/Ethnicity; (B) Non-Lethal Violence, by Gender; (C) Non-Lethal Violence, by Age; (D) Non-Lethal Violence, by Income; (E) Non-Lethal Violence, by Education; and (F) Non-Lethal Violence, by Homeownership.
Combining Figures 6 and 7, we can say that over the study period (2000–2015), the increase in victims’ distrust of police effectiveness was widespread. For non-lethal violence (Figure 6), the only groups that had insignificant relationships were Latinos, Asians, victims aged 50 years or older, and victims with high income ($75,000 or more). For property crimes (Figure 7), all groups, including those just mentioned, were more likely to complain about the police in 2015 than in 2000. As past research has suggested, sociodemographic characteristics are associated with people’s perceptions of the police. For example, as shown in Figure 7, the levels of complaints tend to be higher among males than females (Figure 7B), among low-income victims than high-income victims (Figure 7D), and among renters than homeowners (Figure 7F). Despite these differences, these groups all exhibited increases in victims’ belief that “police wouldn’t help.” The magnitude of change, for all groups, was greater in property crimes than in non-lethal violence (comparing Figure 7 with Figure 6), a pattern similarly observed in Figures 3 through 5.
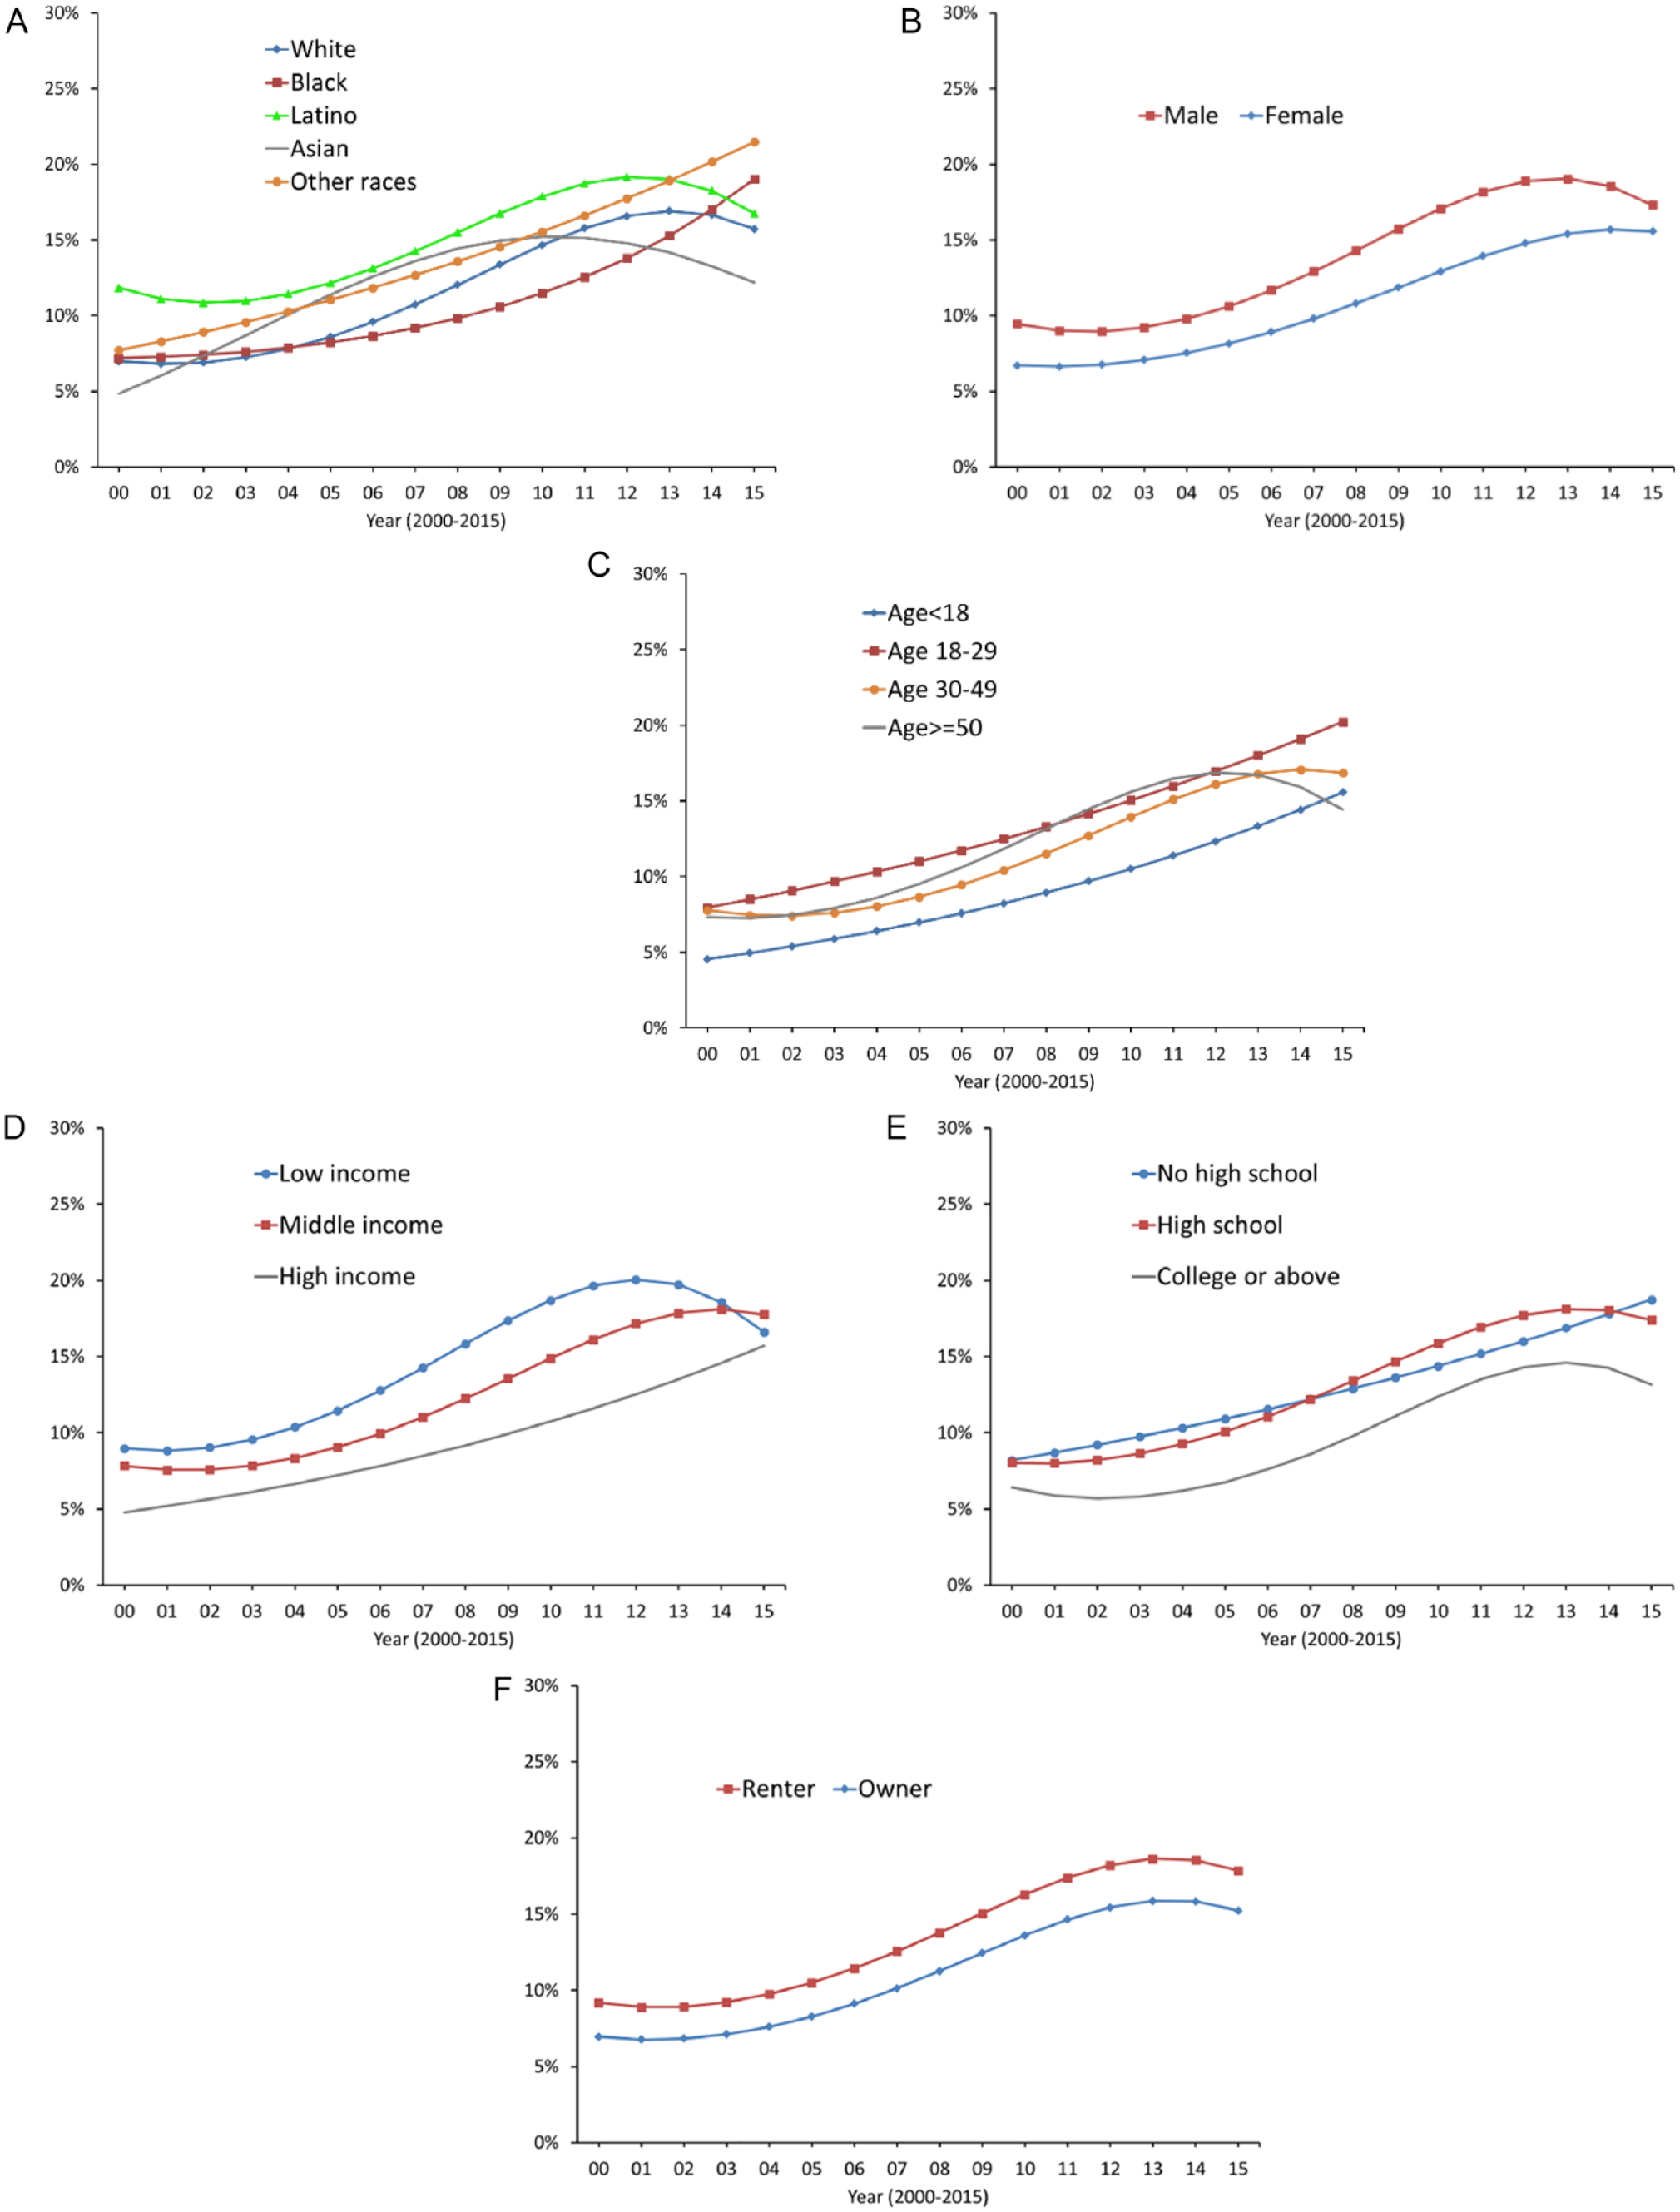
Model-Predicted Probability That Victims With Mean Characteristics Believe “Police Wouldn’t Help,” 52 MSAs (2000–2015), by Sociodemographic Characteristics of Victims, Property Crimes: (A) Property Crimes, by Race/Ethnicity; (B) Property Crimes, by Gender; (C) Property Crimes, by Age; (D) Property Crimes, by Income; (E) Property Crimes, by Education; and (F) Property Crimes, by Homeownership.
Discussion
By using more recent NCVS data, from 2000 to 2021, this study presents important new evidence that crime reporting and victims’ perceptions of the police have changed in the United States in the last two decades. A summary of our key findings is presented in Table 4, which compares our findings side by side with those of earlier studies. Instead of finding an increase in crime reporting (Baumer & Lauritsen, 2010), a decrease was the most commonly observed change in the last 20 years. Instead of having a relatively small proportion of victims not calling the police because “police wouldn’t help” (Xie, 2014), the percentage of victims holding this negative view more than doubled in simple assault, theft, and burglary cases from 2000 to 2015, a level maintained with some stability into 2021.
Summary of Key Findings, Compared With Past Research.
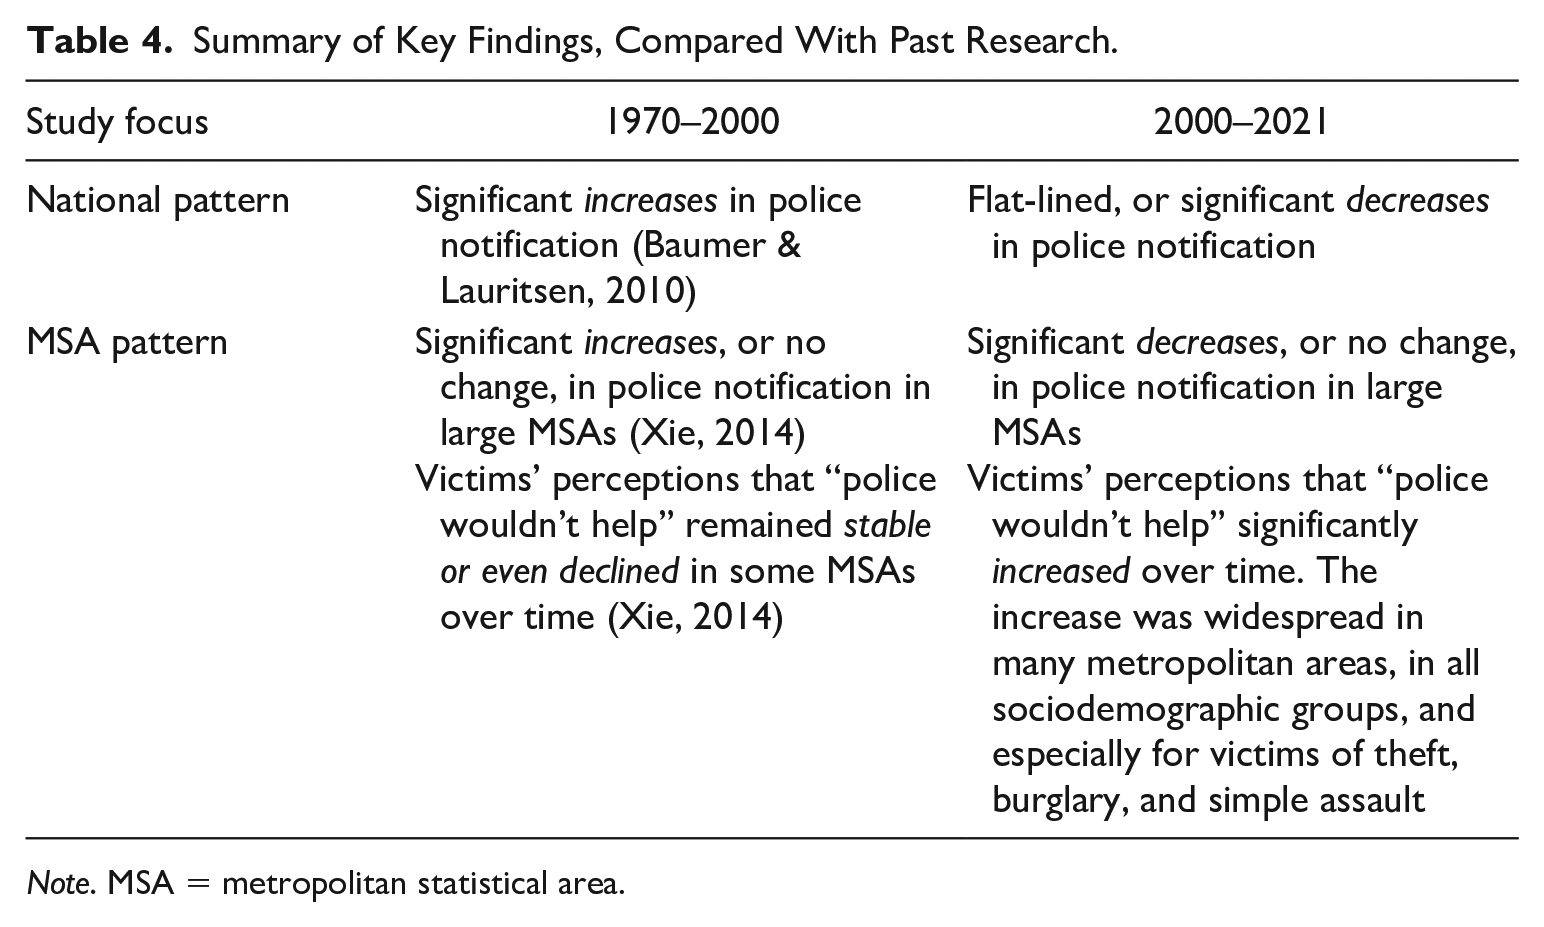
Note. MSA = metropolitan statistical area.
Our findings raise questions about police-reporting behavior and victim–police relationship. The exact reasons for these changes are not yet known, but several developments are worth mentioning. First, the policing landscape in the United States has evolved in recent decades, as many studies have suggested (Maguire et al., 2003; Reiss, 1992; Willis & Mastrofski, 2012). According to Mastrofski and Willis (2010), the two most consequential reform movements of the 21st century are community policing and terrorist-oriented policing. Community policing (community partnership, problem-solving, and crime prevention) challenges the traditional policing model—it has been called a paradigm shift in American policing since the 1980s (Oliver & Bartgis, 1998). Terrorist-oriented policing emerged after the terrorist attacks of September 11, 2001. Rather than advocating strengthening neighborhood bonds and community partnership to prevent crimes, terrorist-oriented policing urges state and local police to collaborate with federal agencies, using technologies, intelligence gathering, and surveillance efforts to combat terrorism and security threats (Lum et al., 2011). As more police departments adopt terrorist-oriented policing, there is a greater demand to investigate the impact of such policing strategies on community ties and crime, including the evaluation of police militarization (Mummolo, 2018) and the involvement of state and local police in immigration enforcement (Baumer & Xie, 2023). The declines in crime reporting and victims’ trust of police observed in the present study may be tied to changing policing practices in the 21st century. The specific nature of the relationship—especially how shifts in policing that distance officers from the community may lower trust and impede victims’ willingness to report to law enforcement—is an important question to be addressed.
Second, the decline in crime reporting, along with the rise in victims’ mistrust of police identified by this study, could also be part of a broader pattern of declining confidence in American governments and institutions (Brady & Kent, 2022; Webster, 2018). Brady and Kent (2022) used data from the Gallup Polls, Harris Polls, and General Social Surveys (GSS) to examine public confidence in four political institutions (the presidency, the executive branch, Congress, and the Supreme Court) and 16 nonpolitical institutions. They found that from 1972 to 2021, especially after 2002, confidence declined quite sharply in the political institutions—a finding that closely resembles what we see in victims’ changes in their perceptions of the police using the NCVS data. Brady and Kent (2022) suggest that the decline in overall confidence may be explained, in part, by political polarization linked to increasing economic inequality and segregation in America. Whether or not the economic situation of a country (e.g., the 2008 financial crisis), the local economy (e.g., economy inequality in cities), or the division between political parties along ideological lines lead to an erosion of victims’ trust in police performance is therefore a crucial question for future studies.
Third, the interesting timing of the change in victims’ perceptions of the police, which according to the NCVS data, started to worsen after around 2005 (Figure 3), raises a question on whether the rise of smartphones and social media in the mid-to-late 2000s (Aschoff, 2020) and the content of police brutality spread through these channels (Clark et al., 2017) could be instrumental for making victims less trusting of the police. In victims’ decision-making process, it would be important to know whether it is their daily interactions with the police or the content on social media platforms (Facebook, Twitter, Instagram, TikTok, etc.) that shape victims’ perceptions. A recent systematic review (Kubin & von Sikorski, 2021) found that while the literature unanimously agrees that social media is increasingly shaping our perceptions of the world, there is less agreement on the circumstances in which social media can drive, or reduce, or at the very least not increase polarization. Interestingly, the NCVS data show that victims’ views of the police started to change before the Black Lives Matter movement, which has grown stronger after an increasing number of police brutality cases have been reported in the media since 2012. This suggests that a wider societal change—a change that is influenced not only by highly controversial policing incidents in media but also by other factors; a change that may reflect a broader social discontent that appeared in the mid-2000s—may be responsible for the trends observed in this study. Whether or not communication technologies may have fueled the changes, and whether or not governments and police agencies may leverage technologies and social media as a means for community building and the enhancement of victim–police relationships are questions with important policy implications.
Conclusion
Taken together, the results of the study point to several key takeaway messages for the scientific and policy communities. To crime statisticians, a declining propensity of police notification would underscore the importance of providing continued support for victim surveys. The NCVS, for example, is currently undergoing redesign testing with funding from the BJS (Truman & Brotsos, 2022). Previous studies, such as those by Lauritsen et al. (2016) and Pina-Sánchez et al. (2022), have suggested research strategies for measurement errors in police recorded crime rates to be investigated more thoroughly before using the police data to study crime trends or the causes and consequences of crime. Victim surveys are a crucial tool for that purpose.
To theorists and practitioners who seek to develop more complete models of police–community relationships, we believe a broad approach to understanding crime reporting trends by examining the role of police-related factors (significant changes in policing practices) and nonpolice-related factors (economic, political, and technological aspects of development) can yield very meaningful information. A better understanding of victim crime-reporting trends is critical in improving trust in the criminal justice system. The NCVS database, at the national level and for subnational areas, can serve as a resource for future research in this area.
Supplemental Material
sj-docx-1-ccj-10.1177_10439862231190212 – Supplemental material for Declining Trends in Crime Reporting and Victims’ Trust of Police in the United States and Major Metropolitan Areas in the 21st Century
Supplemental material, sj-docx-1-ccj-10.1177_10439862231190212 for Declining Trends in Crime Reporting and Victims’ Trust of Police in the United States and Major Metropolitan Areas in the 21st Century by Min Xie, Veyli Ortiz Solis and Preeti Chauhan in Journal of Contemporary Criminal Justice
Footnotes
Declaration of Conflicting Interests
The author(s) declared no potential conflicts of interest with respect to the research, authorship, and/or publication of this article.
Funding
The author(s) received no financial support for the research, authorship, and/or publication of this article.
Supplemental Material
Supplemental material for this article is available online.
Notes
Author Biographies
References
Supplementary Material
Please find the following supplemental material available below.
For Open Access articles published under a Creative Commons License, all supplemental material carries the same license as the article it is associated with.
For non-Open Access articles published, all supplemental material carries a non-exclusive license, and permission requests for re-use of supplemental material or any part of supplemental material shall be sent directly to the copyright owner as specified in the copyright notice associated with the article.