
Abstract
Studies are showing evidence of the effect of changes in routine activities due to the 2020 COVID-19 pandemic on crime levels in many cities worldwide. This study evaluates the potential impact of the COVID-19 pandemic on temporal and spatial patterns of crime in three major cities under very different national contexts. Each of the three countries and cities experienced different levels of pandemic restrictions and societal closure. The cities of New York (the United States), São Paulo (Brazil), and Stockholm (Sweden) were selected as cases. Temporal quantitative methods, spatial statistics techniques, and Geographical Information System (GIS) underlie the methodology used in this study. Findings show that there is a statistically significant break in the trend in crime levels after the stay-at-home orders were implemented in New York City, São Paulo, and Stockholm in the first months of 2020; the only exception was for murder. Such an impact varies by crime type and city context, but increases again after a few months, indicating how fast crime and criminals adapt. Residential burglary decreased, whereas nonresidential burglary increased overall. Changes in the levels and geography of vehicle thefts were observed, with an overall increase of significant cold spots but, in several cases, also solidification of existing crime concentrations in known crime attractors and in some deprived areas.
Keywords
Introduction
Urban life has changed considerably since the start of the COVID-19 pandemic in early 2020. People now spend less time out of their homes and offices, many employees work from home, children are learning from home, and mask wearing and social distancing have become the new social order. By April 2020, strict lockdown orders had been implemented in numerous countries around the world, whereas a few countries, such as Sweden, became known worldwide for adopting “lighter” stay-at-home recommendations. Although recent studies of North American and European cities have shown a substantial impact on the volume and distribution of crime, in particular violence (e.g., Gerell et al., 2020; Mohler et al., 2020; Rosenfeld & Lopez, 2020), the international literature that compares different cities in different countries in terms of crime levels and geography is still lacking. Findings of comparative studies of this type can be particularly relevant for criminological research to illustrate the impact of changes on local criminogenic conditions imposed by changes in routine activity. As stated by Stickle and Felson (2020), these circumstances provide researchers with naturally occurring, quasi-randomized control experiment conditions that allow more advanced testing of criminological theories.
To contribute to this knowledge base, we report here variations between crime levels and crime geography in 2019 and compare those variations with crime reported during the 2020 stay-at-home recommendations in three major cities—New York, São Paulo, and Stockholm—in different country contexts: the United States, Brazil, and Sweden. Using multiple analytical strategies, we compare crime levels and geography before and after the stay-at-home recommendations in these three cities. Temporal quantitative methods, spatial statistics techniques, and Geographical Information Systems (GIS) underlie the exploratory methodology used in this study. Note that the research presented in this article is exploratory in nature because the analysis illustrates how differences in crime levels and geography are affected overall by the lockdown and how key concepts from environmental criminology theories can help interpret these changes. The study does not specifically test measures (for instance, of guardianship, ambient population, number of people close to their residential nodes) that would have to be tested to determine the applicability of the theories in interpreting the impact of the lockdown restrictions.
The cities constitute interesting case studies for several reasons. First, they represent different stay-at-home restriction models imposed by local governments during the pandemic. On one hand, New York City serves as an example of “strict lockdown” measures put into operation from Week 12, with basic services and schools closed until mid-June 2020. On the other hand, Stockholm represents a case of “mild lockdown” during the same time period, with businesses and primary schools open (but most secondary schools and universities closed), whereas São Paulo is the in-between model. Second, the cities represent different country contexts, on different continents—two national capitals of the Global North and São Paulo in the Global South—with major implications for the scale of criminality and policing. Understanding how crime levels and patterns are affected by stay-at-home measures in different contexts is fundamental to understanding how we can better manage such a crisis and plan for the future.
The study provides an analysis of a wide array of offenses, comparing temporal trends over eight crime types: murder, rape, assault, robbery, total theft, vehicle theft, residential burglary, and nonresidential burglary. The data series was divided into two parts, a training period (first week of 2019 to first 11 weeks of 2020) and another validation period (12th week to 22nd week of 2020). The spatial analysis was limited to vehicle thefts only due to data availability. We tested two strategies: Strategy 1 adopted a before–after analysis to identify possible changes in the crime geography using 6 months of data for 2020, namely, Weeks 1 to 12 (pre-stay-at-home-orders) and Weeks 13 to 24 (post-stay-at-home-orders). In Strategy 2, possible changes were tested in vehicle theft in Weeks 13 to 24 in years 2019 and 2020 (post-stay-at-home-orders) in each city applying differential Moran’s I, using Queen proximity matrix with first lag neighbors; as a “control,” Weeks 1 to 12 in years 2019 and 2020 were also compared.
This article is composed of five sections. First, we discuss the literature on environmental criminology and crime. Then, we frame the current study and research questions, followed by a description of data and methods in “Research Design: Data and Methods” section, followed by the results in “Results: The Effect of the Stay-at-Home Orders on Crime Levels and Geography” section and a discussion in “Discussion of Results” section. The article ends with conclusions and recommendations for research in “Conclusions and Recommendations” section.
Theoretical Overview
The COVID-19 Pandemic, Changes in Routine Activity, and Crime
At the time of publication of this article, it is unclear the degree to which different stay-at-home restrictions imposed in 2020 during the COVID-19 pandemic were adhered by the population in different countries, regardless of government orders and social guidelines. Social-distancing measures are long-established public health tools that span a wide range: that individuals maintain a distance from one another when in public, that people gather in limited numbers in social/public settings, that businesses modify their operations, and that people remain at home. Those who had a choice mostly complied with the recommendations, whereas others such as police officers and health care workers had no other choice than to continue with their daily routines (Al Maskari et al., 2021; Frenkel et al., 2021). Some took risks fearing the emotional, economic, or social effects of long-term restrictions (Reluga, 2010). There has been a general expectation that, at least in countries with stricter stay-at-home orders, the impact of these recommendations on people’s routine activity would lead to some noticeable crime reduction, at least for certain types of crime, such as property crimes (e.g., Felson et al., 2020; Gerell et al., 2020; Stickle & Felson, 2020). Many property crimes can only occur where motivated offenders encounter suitable targets in the absence of capable guardians (or proper place management) that would otherwise disrupt the crime (Cohen & Felson, 1979). Stay-at-home restrictions imposed in more than 90 countries should have driven a significant disruption of daily routines, thus radically altering and disrupting the environmental conditions under which crime may occur. Under effective and strict stay-at-home orders and social-distancing practices, it was expected that the impact on crime would be significant and that the nature of the impact would vary by the type of crime.
Evidence of the Pandemic on Crime Trends
Pietrawska et al. (2020) found a 64% increase in retail burglary, whereas residential burglary rates were down 10%. However, the overall effect in some cities was less visible than might have been expected given the scale of the disruption to social and economic life (Mohler et al., 2020). Initial evidence of the pandemic impact was reported by Ashby (2020a). Analyzing data covering a dozen North American cities for crime rates across six serious crimes (serious assaults in public, serious assaults, theft from cars), the author found no consistent pattern; in fact, his most common finding was no change in crime rates from pre-COVID-19 to post-COVID-19. In addition, in Australia Payne and Morgan (2020) found that reported violent offenses were not significantly different from what was expected given the history of each offense series in the first 6 months. Also in Australia, Andresen and Hodgkinson (2020) assessed the impact of the COVID-19 pandemic on property, mischief, violent, and miscellaneous crime. Authors found that criminal offenses significantly decreased during the initial lockdown but increased once social restrictions were relaxed (see also Hodgkinson & Andresen, 2020). Similar patterns were found for a city in China by Borrion et al. (2020), in a police force in the United Kingdom by Halford et al. (2020), and in the United Kingdom and Wales by Langton et al. (2021), although for Los Angeles Campedelli et al. (2020) found mixed results.
When there were changes in crime patterns, these changes were random and seemed highly dependent on which city or county was being analyzed. In some cities, violence increased (Rosenfeld & Lopez, 2020), which might have been because protests of different types, vandalism, and acts of social disorder that took place during the long period of lockdown in some large cities (e.g., Zhang et al., 2020), which might also have contributed to an increase in crime. In Sweden, for instance, even under less strict pandemic restrictions, the number of reported crimes decreased or showed signs of stability compared with previous years, especially for property crimes (see Gerell et al., 2020). Gerell et al. (2020) found that residential burglary fell by 23%, commercial burglary declined 13%, and instances of pickpocketing were reduced by 61%, but there was little change in robberies or narcotics crime. In addition, it is expected that, during the COVID-19 pandemic, crime may not have been reported normally, at least for some types of crime, which may unavoidably affect any assessment of the impact of the COVID-19 pandemic on crime. For instance, there is growing evidence that shows cybercrime and internet fraud (Kemp et al., 2021) as well as domestic violence may have worsened as a result of the lockdowns and stay-at-home orders (Boman & Gallupe, 2020; Marques et al., 2020). In Mexico City, Balmori de la Miyar et al. (2021) found a sharp decrease in crimes related to domestic violence, burglary, and vehicle theft; a reduction during some weeks in crimes related to assault-battery and extortion; and no effects on crimes related to robbery, kidnapping, and homicide.
Distributional Impact on Crime Levels and Geography
Crime opportunities are never static but depend on our mobility patterns. Brantingham and Brantingham (1993) described crime as occurring when the activity spaces of offenders, which concentrate around the places they visit frequently (e.g., home, school, work), intersect with the activity spaces of a target. Brantingham and Brantingham (1995) suggested that land uses that pull a large number of people toward them are “crime generators” because they generate opportunities for crime. Other places may attract individuals who would consider crime an alternative at that particular place and a particular time. There, individuals with high levels of motivation and previous criminal records converge, and such places become “crime attractors.” Transit stations are normally considered crime generators, but with the pandemic restrictions, they might no longer be a crime hotspot. In contrast, car-related thefts might increase along residential streets and in parking lots because of the increase in crime targets during the stay-at-home measures.
In addition, with the stay-at-home orders, changes in routine activities may have had a significant impact on when and where we might expect crime to occur. With pandemic restrictions, fewer “eyes on the streets” (Jacobs, 1961) and less formal and informal social control (Sampson, 1986) affect crimes that demand anonymity, such as personal robbery, grand larceny, and sexual assault. Property crime, in particular residential burglary, for instance, depends on homes being empty during the day while individuals are at work or school (Pietrawska et al., 2020). Although a reduction in residential burglaries may free up time for the police, an increase in other crimes may rapidly occur (Mohler et al., 2020).
The first hypothesis (Hypothesis 1 [H1]) is that stricter stay-at-home orders, including more social-distancing practices, would lead to an overall decrease of crime given the fact that the majority of registered crimes are composed of property crimes that depend highly on people’s movement patterns (Figure 1). New York City serves as an example where strict stay-at-home orders were put into operation from Week 12, with basic services and schools closed until mid-June 2020, so the city would have experienced the highest crime drops, whereas Stockholm would have noticed a mild crime drop compared with New York City and São Paulo.
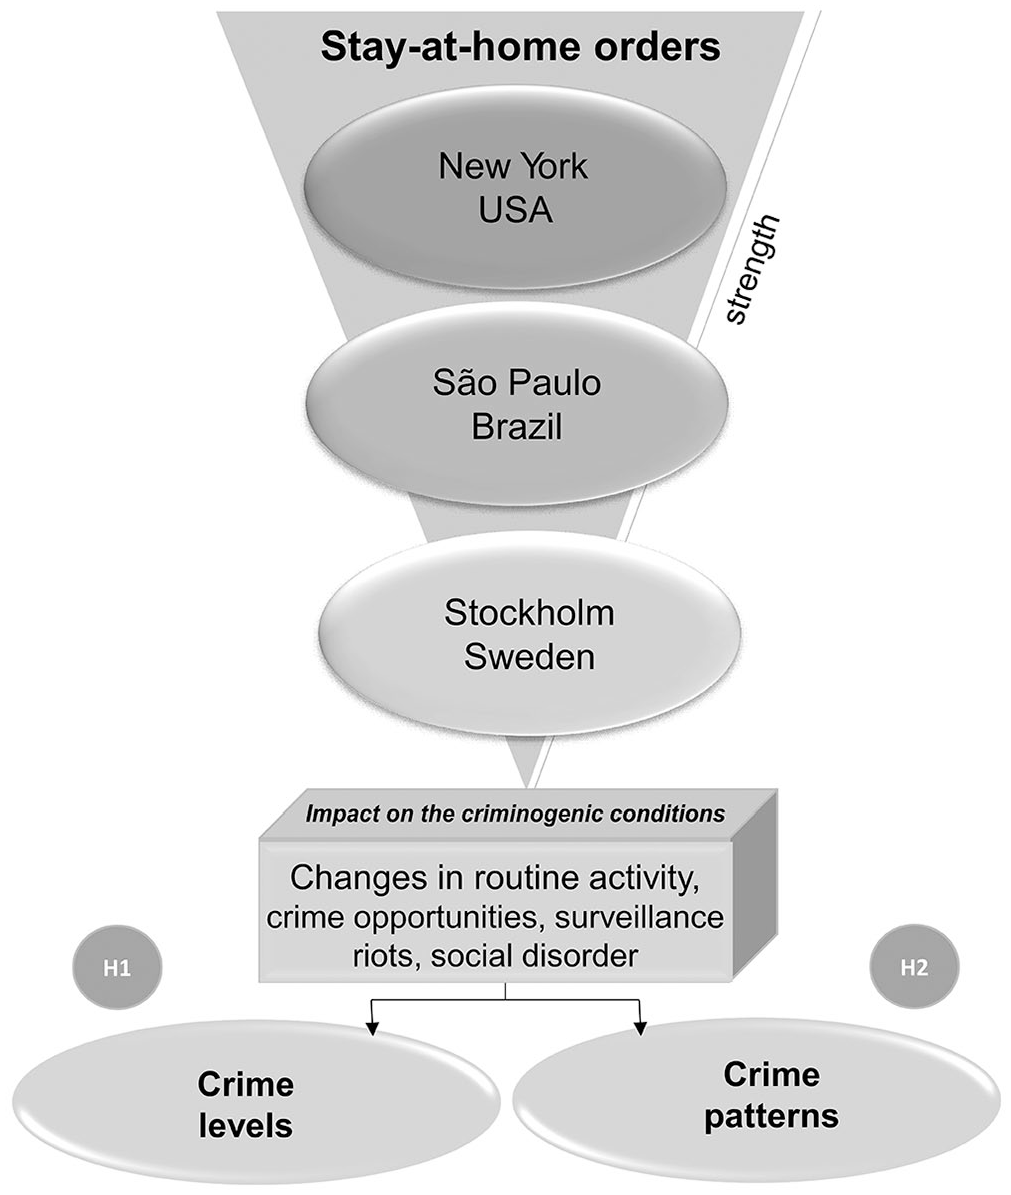
Crime levels and geography after the pandemic restrictions: A conceptual model.
The second hypothesis (Hypothesis 2 [H2]) is that a drop in crime levels is expected to happen in a heterogeneous way across the urban area (Figure 1). For example, vehicle thefts would decrease in central areas of the cities because of changes in routine activity (where office buildings are located), whereas vehicle thefts would increase in some residential areas. In deprived, socially disorganized neighborhoods with poor collective efficacy (Sampson et al., 1999; Shaw & McKay, 1942), restrictions would be less effective, as offenders may be resistant to stay-at-home orders and are often risk-takers. Property crimes such as robbery but also rape, vandalism, and social disorder could have an upsurge as some streets become less guarded (Qin & Liu, 2016). City-center and inner-city dynamics with restricted nightlife might witness a reduction of overall crime, especially violence (Rosenfeld & Lopez, 2020).
In summary, the literature appearing toward the end of the stay-at-home restrictions has started documenting changes in crime levels and geography during the COVID-19 pandemic. Empirical studies typically focus on one city or one country and are not comparative. Only a handful of studies examine the changes in geography of crime, from prepandemic to postpandemic. Very few studies compare how individual characteristics of neighborhoods may influence crime geography. To address some of these gaps, we turn to our empirical study and report on the changes in crime and geography in the three cities.
Research Questions
Here, we examine patterns in police recorded crime from New York, São Paulo, and Stockholm to shed some light on the following research questions:
The Study Areas
Three cities were selected as study areas: New York City (the United States, North America), Stockholm (Sweden, Europe) and São Paulo (Brazil, South America). The reasons they were chosen are as follows:
The cities represent different restriction models of the stay-at-home orders implemented during the pandemic. On one hand, New York City serves as an example where strict stay-at-home orders were put into operation from Week 12, with basic services and schools closed until mid-June 2020. On the other hand, Stockholm represents a case of mild stay-at-home orders during the same period, with businesses and primary schools open but most secondary schools and universities closed. São Paulo serves as a benchmark for the two other cities because, as it is argued, the city constitutes an appropriate example of a “mid-range stay-at-home orders”: not all measures affected all segments of society homogeneously and not at once.
Although social, economic, and ethnic segregation are inherent characteristics of these three cities, in New York these differences took a more violent expression during the pandemic (Watkins, 2020). While São Paulo is a typical metropolis of the Global South, with a large share of the population experiencing poor living conditions (McFarlane, 2018), one of the highest homicide rates in the world (Cerqueira et al., 2020) and high rates of police brutality (HRW - Human Rights Watch (2009); Caldeira, 2013), New York and Stockholm constitute modern and prosperous hubs of technology and innovation in postindustrial advanced economies (Evertzen et al., 2019). Yet, in Stockholm, on average 31% of residents are non-Swedish nationals (Stockholms Stad, 2018), and in its peripheral suburbs, this figure is 86% to 90%. In these suburbs, general unemployment rates are 3 times higher and the average income is lower than in the rest of the city (Stockholms Stad, 2018).
These cities belong to three distinct country contexts (socioeconomic, institutional, and political) that are criminologically relevant. Stockholm is the capital of Sweden and the most populous city in Scandinavia. The city reflects the output of a newly liberalized welfare system after decades of achievements in housing and transportation policies, yet with increasing problems of segregation and crime. New York City is perhaps the best expression of a city embedded in a market-oriented economy in the Global North, whereas its equivalent in Brazil is São Paulo.
These cities are composed of complex urban fabric interlinked by major public transportation systems of metros, buses, and commuter trains. Stockholm differs in that it is part of an archipelago, so water occupies a large part of the urban landscape, the city being spread over islands on the eastern coast of Sweden.
Traffic flows should show the effects of restrictions on movement in people’s routine activities in the three cities (Figure 2).
New York and São Paulo show similar effects on vehicle traffic flow after stay-at-home orders. São Paulo shows a slightly stronger effect from the restrictions than New York does. The impact of the restrictions on Stockholm was less noticeable, except for the end of the year. One reason for an increase in traffic flow in Stockholm is that the population decreased the use of public transport and shifted toward private means of transportation at the beginning of the pandemic.
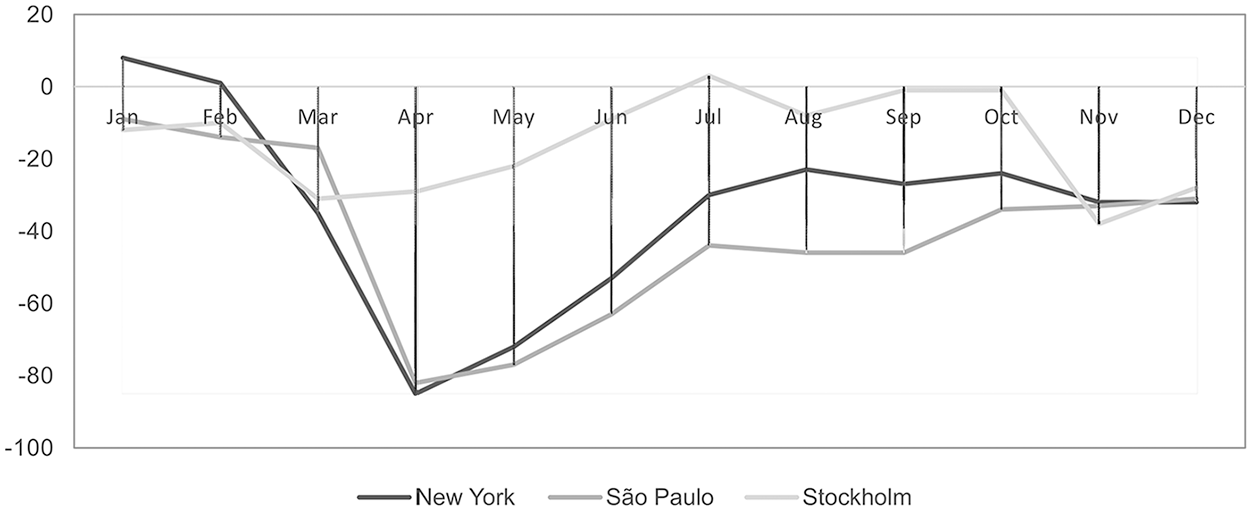
Vehicle traffic flow in late afternoon in New York, Sao Paulo, and Stockholm: Comparison 2020 and 2019.
São Paulo is the largest study area—one of the largest municipalities in Brazil—with 12.33 million inhabitants. It is the eighth most populous city on the planet, and its metropolitan region, with around 21 million inhabitants, is the 10th largest urban agglomeration in the world. São Paulo is the main financial, corporate, and commercial center of South America (Pasquali, 2021). The municipality has the 10th largest gross domestic product (GDP) in the world but also exhibits major socioeconomic inequalities. The most central districts generally have a higher Human Development Index (IDH), at 0.9, gradually decreasing when moving away from the center, reaching values of about 0.7 at the municipality’s limits (United Nations Development Programme, 2019).
The second most populous study area is New York, which is also the most populous city in the United States. With an estimated 2019 population of 8,336,817, distributed over about 302.6 square miles (784 km2), New York City is also the most densely populated major city in the United States (U.S. Census Bureau, 2020). Finally, the smallest study area is the municipality of Stockholm, which covers an area of 216 km2, with a population of 975,904 inhabitants in 2019. The islands are well connected by roads and an efficient public transportation system, comprising buses, metro, rail, and commuter trains (Statistics Sweden, 2021).
Comparing statistics between countries and cities is a difficult task, and comparing crime rates is no exception. Different countries use different definitions, and reporting rates may be higher in one than in another. Thus, it is necessary to compare patterns and temporal trends within each city instead of absolute numbers. The highest murder rates, for example, are found in New York, with 5.5 per 100,000 inhabitants, followed by São Paulo at 5.2 per 100,000 in 2020 and Stockholm at 1.2 per 100,000 in 2020. Below we discuss the data collection and methods.
Research Design: Data and Methods
Data Acquisition and Preanalysis
A set of crime types were selected to show potential variations between crime levels before and after lockdown measures due to the pandemic. The offenses were selected based on the following criteria:
Crimes should be good examples of changes in routine activity. If fewer people are on the street, at home, and in offices, total thefts may change (e.g., decrease in residences and increase in commercial; less violence in inner city areas).
Law enforcement is dispatched based on how crime patterns are affected by the pandemic restrictions, which in turn affect levels and geography of crime reporting.
Crime types should be directly comparable between cities as much as possible. Thus, there were several crime types initially selected that were discarded because they were either not comparable or data were not available for all cities, such as domestic violence and violence in public places. Residential burglary and nonresidential burglary include crimes against people’s homes, and the latter category includes a mixture of facilities, from commercial establishments to various venues, such as sporting and religious, depending on the penal code definition. A comparison of the definitions of the crimes was performed using the penal code of each country. These definitions are available on request.
Following these criteria, the crimes selected were rape, murder, assault, robbery, total theft, vehicle theft, residential burglary, and nonresidential burglary. For the spatial analysis, we selected vehicle theft because this crime type was comparable for all three cities and the coordinates were also available. In New York, for instance, Grand Larceny Auto (Auto Theft) has been high since the beginning of 2020, increasing 65% since COVID-19, and the figures continued to increase 40% to 60% each week (NYPD Compstat, 2020). Vehicle theft was stable in Stockholm and São Paulo, which facilitates the comparative analysis.
Table 1 shows in detail the periods of time for the data utilized in the study. Police statistics from 2019 and June 2020 for Stockholm come from the Police case handling routine for crime reporting - RAR (RAR, 2020), of the Police region Stockholm, Swedish Police Authority, for São Paulo from São Paulo’s Secretariat of Public Security (INFOCRIM, 2020) and for New York from the New York City Police Department (NYPD Compstat., 2020).
Description of the Data Set.
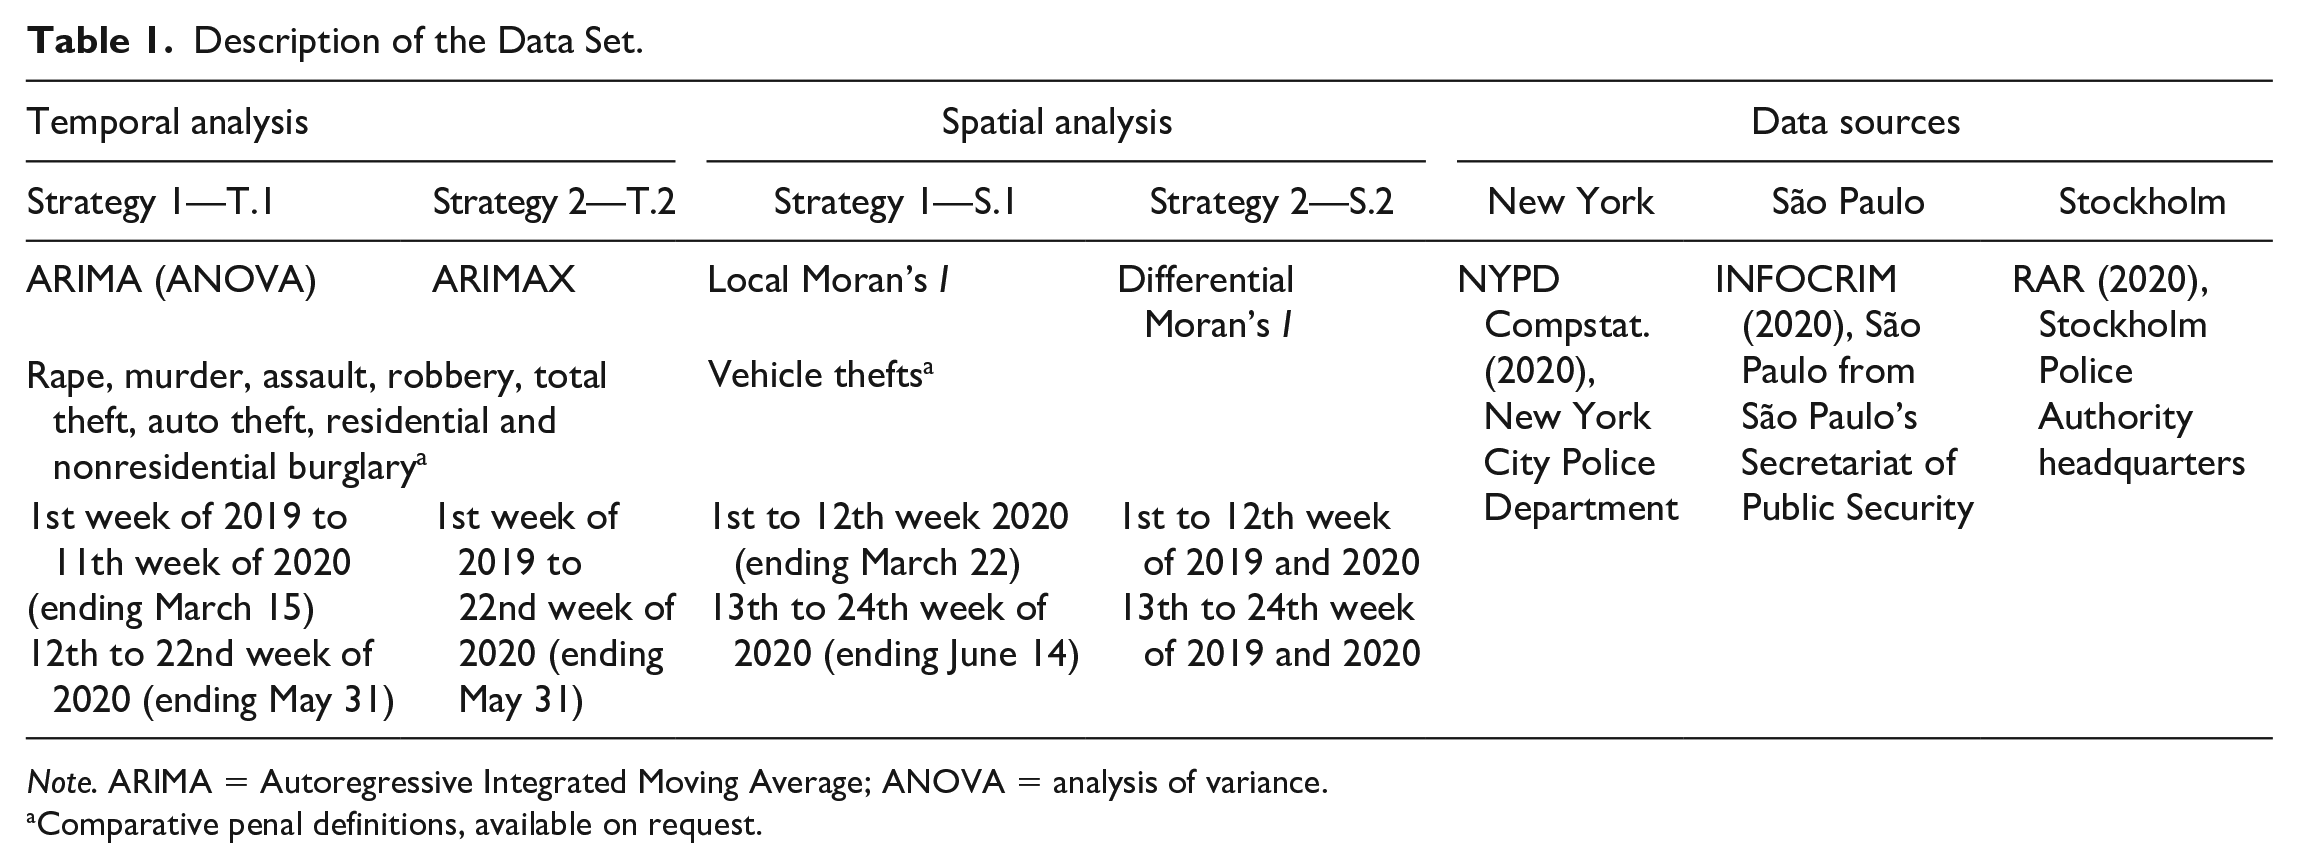
Note. ARIMA = Autoregressive Integrated Moving Average; ANOVA = analysis of variance.
Comparative penal definitions, available on request.
A number of software tools were used to analyze the data: statistical software such as SPSS, Tableau, and GeoDA, and for mapping and visualization MapInfo, GeoDa, and Infinity designer. In SPSS, we use the Expert Modeler procedure to identify and estimate the best-fitting ARIMA for one or more dependent variable series, eliminating the need to identify an appropriate model through trial and error. Independent variables are treated like predictor variables in regression. When the independent variables for COVID, recoded as 0 (before) and 1 (after), are specified, the Expert Modeler tests whether there is a statistically significant relationship with the dependent series. Where appropriate, dependent and independent variables are transformed using differencing or a square root or natural log transformation. Expert Modeler checks the order of the models, tests for the presence of autoregressive (AR) or moving average (MA) parameters and presence of outliers, and provides forecasts based on the best model.
Temporal Analysis
Given the data availability and comparative frame of the analysis, we selected the following offense types: murder, rape, assault, robbery, total thefts, vehicle theft, and burglary (residential and nonresidential). To assess potential variations in crime levels before and after the imposition of the stay-at-home orders, we first tested the variations of crime by time with no control of potential seasonal effects or other potential trends.
Strictly speaking, two autoregressive integrated moving average (ARIMA) strategies were employed in the study. An ARIMA model predicts a value in a response time series as a linear combination of its own past values, past errors (also called shocks or innovations), and current and past values of other time series (SAS, 2018). An ARIMA model is a time-series model suitable for use with integrated processes. In an ARIMA (p; d; q) model, the data are differenced d times to obtain a stationary series, and then an ARMA 1 (p; q) model is fit to this differenced data. ARIMA models that include exogenous explanatory variables are known as ARMAX or ARIMAX models (Dugan, 2010). An ARIMAX model extends the ARIMA function so that it can handle intervention analysis and outliers in time series (Cryer & Kung-Sik, 2008). Event variables are special independent variables that are used to model effects of occurrences, such as the COVID measures. Any large shift in the level of the dependent series can be modeled using event variables that enter the model with linear terms. The presence of an effect is indicated by cases with a value of 1, and cases with values other than 1 are treated as indicating no effect (George & Mallery, 2019).
Strategy 1—T.1 was based on the partition of the series into two periods, whereas Strategy 2 used the entire data series and includes an independent (or exogenous) variable to test variation before and after the stay-at-home orders. We discuss these strategies in more detail below:
In Strategy T.1, we divided the data series into two parts, a training period (first week of 2019 to first 11 weeks of 2020) and another validation period (12th week to 22nd week of 2020). The date of the series partition were chosen taking into account the beginning of stay-at-home orders in the three cities. Then, we estimated the values for the second period, namely, the validation period using ARIMA and compared the predicted values with the known values. The F test was used to verify whether the means of the predicted values and known values were significantly different. Descriptive statistics, including a series of mean tests (M estimates), were produced, such as Tukey for each crime type and city. To check whether these changes were significant, we ran an analysis of variance (ANOVA). Note that because our unit of analysis was weeks, the ARIMA model did not consider seasonal variations.
Strategy 2—T.2 included an exogenous variable (also known as ARIMAX, see SAS, 2018). A proxy variable was used as an independent variable in the regression model (0 = before the stay-at-home orders, 1 = after the stay-at-home orders). In this case, the stay-at-home orders due to the pandemic become an event. Any abrupt shift in the level of the dependent series can be modeled by using event variables, which means that event variables are special independent variables used to model the effects of occurrences, such as a natural disaster. This strategy has the advantage of saving processing time and guarding against overfitting. For event variables, the presence of an effect is indicated by cases with a value of 1. Cases with values other than 1 are treated as indicating no effect. The user defines when the cutoff values take place, and the variable (start of the stay-at-home orders) is tested for significance (for more information about these models, see George & Mallery (2018), and SAS, 2018). Regardless of whether the stay-at-home orders had an impact on crime levels, we were able to assess whether noticeable shifts in the distribution of a crime for the three cities had taken place and where, as discussed in section “Spatial Analysis”.
Spatial Analysis
To identify significant hotspots of crime before and after the stay-at-home orders, we first mapped police crime records by zones using GIS using districts that were standard for each city and would compose the “best” basis for comparison between study areas. Unfortunately, these units vary greatly in size and total population, so any comparison between study areas on the basis of population or area of these districts should be considered with care (see MAUP, Fotheringham & Wong, 1991). For instance, although São Paulo is the largest city in terms of population, the number of districts is the smallest, 96 units. Stockholm has the greatest number of units (408), whereas New York is composed of 195 neighborhood units. The comparison should be over time, city by city, and should focus on changes in the geographic units.
To investigate whether crime hotspots changed their geography after stay-at-home orders and to get insights on how, we used two strategies:
Strategy 1—S.1 adopted a before–after analysis using Local Moran’s I analysis to identify possible changes in the crime geography using 6 months of data for 2020, namely, Weeks 1 to 12 (pre-stay-at-home-orders) and 13 to 24 weeks (post-stay-at-home-orders). The Local Moran’s I statistic suggested in Anselin (1995) is a local spatial autocorrelation statistic that gives us an indication of the extent of significant spatial clustering of similar values around an observation; it is a way to identify local clusters (a positive value for Moran’s I shows that a polygon has neighboring polygons with similarly high or low attribute values) and local spatial outliers (a negative value for Moran’s I designates that a polygon has neighboring polygons with dissimilar values). We used Queen weight matrix with first lag neighbors and selected crimes. Given the length of this article and data limitations, we will discuss the case of vehicle thefts only.
In Strategy 2—S.2, we used differential Moran’s I in GeoDa 1.8 to compare possible changes in vehicle theft in Weeks 13 to 24 in years 2019 and 2020 (post-stay-at-home-orders) in each city; using Queen proximity matrix with first lag neighbors and as a “control,” we also compare Weeks 1 to 12 in years 2019 and 2020. The Differential Local Moran statistic is based on the change over time, that is, the difference between values in an area paired with similar changes in the surrounding areas in the time of pre-stay-at-home-orders and post-stay-at-home-orders, in New York, São Paulo, and Stockholm. Therefore, when changes have the same sign (e.g., when the areas show a drop in cases), positive values (labeled as high-high) should appear and be interpreted as above average values, whereas negative values (labeled as low-low) should be interpreted as below average values. In this analysis, we compare Weeks 13 to 24 in years 2019 and 2020 in each city using the Queen proximity matrix with one neighbor. As a “control,” we also compare Weeks 1 to 12 in years 2019 and 2020.
Results: The Effect of the Stay-at-Home Orders on Crime Levels and Geography
In this section, we assess whether there is any significant change in crime levels following the establishment of stay-at-home orders. In addition, we also evaluate whether the change in crime has to do with the stay-at-home orders implemented in New York, São Paulo, and Stockholm. Finally, we assess whether these changes in crime differ by crime type.
Temporal Crime Trends: Which Crime Types Are Most Affected by Stay-at-Home Orders?
All three cities experienced some crime reduction already in March 2020 (note in Figure 3 the “V” shape starting in March). Stay-at-home (nonvoluntary) recommendations were implemented in Sweden in mid-March when the first death was reported. The country has not imposed a stay-at-home orders because the Swedish Constitution legally protects freedom of movement for the people. In São Paulo, Brazil, the disease had spread to every state by March 21, 2020. In São Paulo municipality, stay-at-home orders imposed some restrictions on movement, also affecting levels of crime.
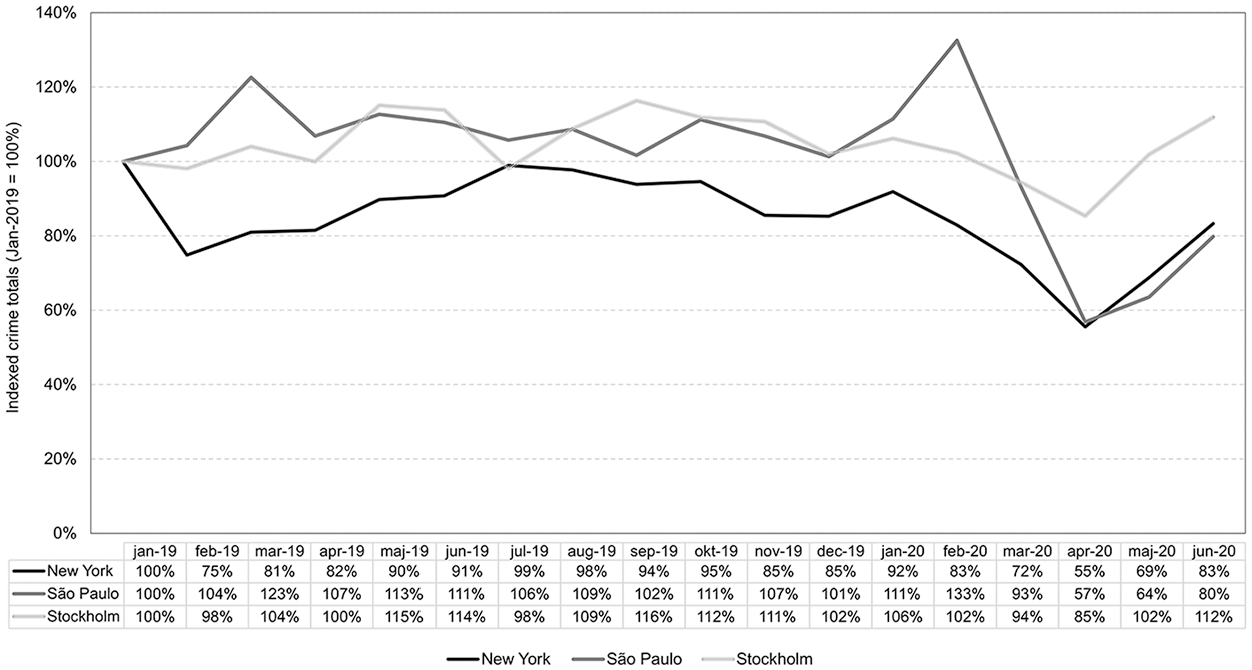
Indexed crime totals, January 2019 to June 2020, property and violent crimes, including minor crimes but excluding traffic violations and some public disorder incidents.
In New York City, the drop in crime was sharp and consistent for most crimes throughout March and all of April and May 2020. New York City experienced the first noticeable surge of COVID-19 cases in the United States in March 2020. As a result of the COVID-19 pandemic, much of New York City was closed March to May 2020—businesses, schools, transportation, recreation, entertainment, and tourism/travel all had significant and/or full closures during the first 3 months. This type of societal withdrawal was unseen since the terrorist attacks on the World Trade Center in September 2001. Unlike the closures following the 9/11 attacks, which lasted days and hours, the citywide COVID-19 pandemic shutdown lasted months. The immediate impact of the COVID-19 pandemic on crime was apparent in New York City. Comparing the first eight weeks of major crime in New York City with the previous eight weeks of “pre-COVID-19 crime” shows decreases in all major crime categories (Figure 3).
Temporal Crime Trends: Which Crime Types Are Most Affected by Stay-at-Home Orders?
There is a statistically significant break in the trend in crime levels for all selected crimes just after the stay-at-home orders were implemented in New York City, São Paulo, and Stockholm—the only exception being murder (New York p = .60; São Paulo p = .72; Stockholm p = .39), according to analysis Strategy 1—T.1 (Table 2).
Results of Strategy 1 (ANOVA F Test) and Strategy 2 (ARIMA t Test).
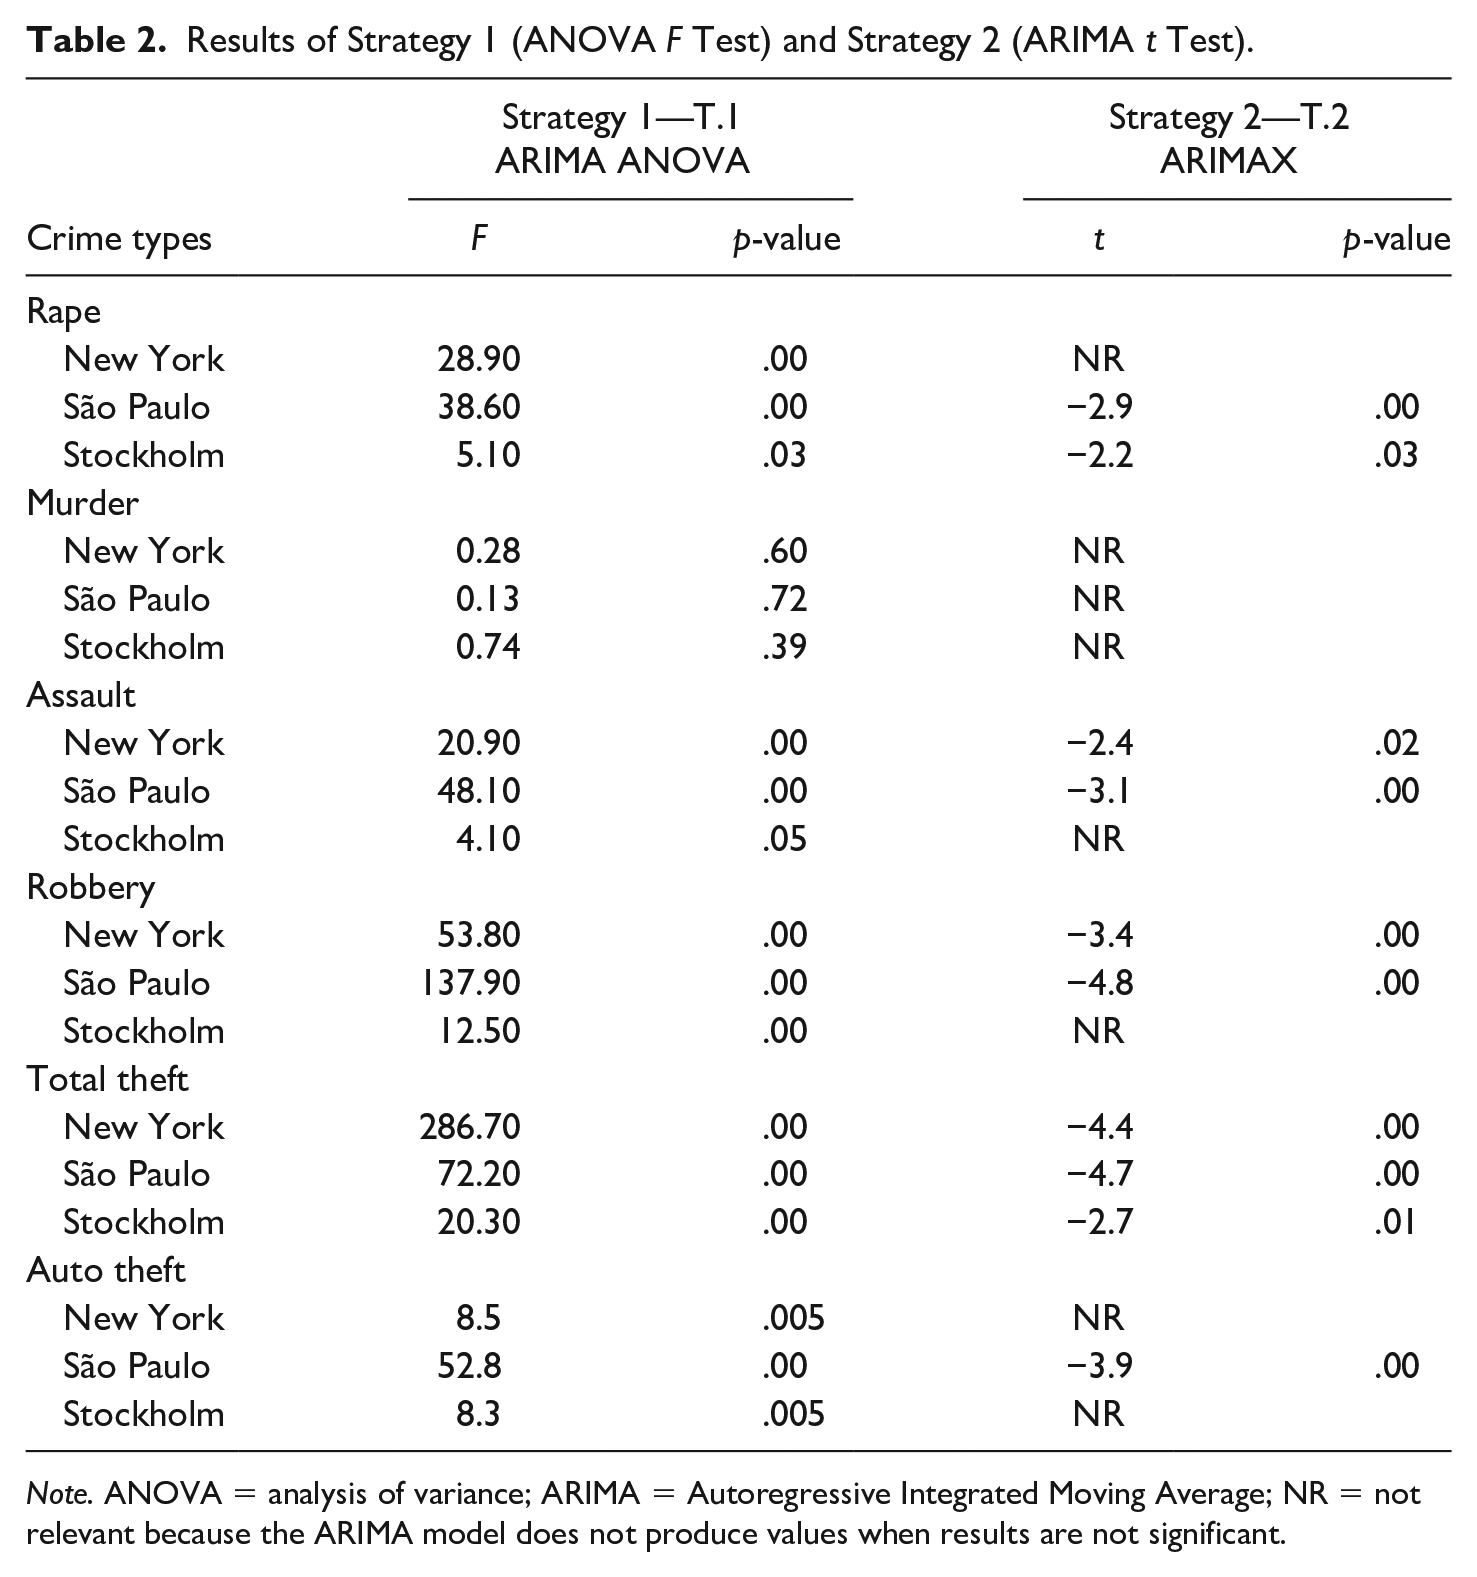
Note. ANOVA = analysis of variance; ARIMA = Autoregressive Integrated Moving Average; NR = not relevant because the ARIMA model does not produce values when results are not significant.
Table 2 also shows the results of analysis Strategy 2—T.2, which uses an ARIMAX model with a dichotomous explanatory variable, with all available data (Weeks 1–74). In this strategy, the stay-at-home variable was codified as 0 for Periods 1 to 62 (before the stay-at-home orders were implemented) and 1 for Periods 63 to 74 (after the stay-at-home orders). Different from Strategy T.1, the interest here was not to predict unknown future crime values but to verify whether an external event is significant and can help explain the behavior of the crime series. Like any other regression model, in this Strategy T.2, we can observe the signal of impact of the coefficients and their magnitude. Instead of generating a counterfactual value to compare with what was observed, Strategy T.2 sought to identify significant changes between the two periods. While Strategy T.2 tends to generate results that are more conservative, the two strategies are often considered complementary.
Findings from Strategy T.2 for New York, São Paulo, and Stockholm confirmed that the results were more conservative than those found in Strategy T.1. Again, for murder the difference in lethal violence before and after the stay-at-home orders was not statistically significant, whereas for other crime types, results were mixed. For rape, for example, changes were found for Stockholm and for São Paulo but not for New York, whereas for assault, the difference for New York and São Paulo was significant but not for Stockholm. A similar pattern was found for robberies. For total theft, the change in crime levels is statistically significant for all cities, whereas for vehicle theft, a break in the trend was found for São Paulo only. As expected, the negative sign means that there has been a decrease in crime after the stay-at-home-orders were implemented. As mentioned above, to test whether the stay-at-home orders variable was significant in the model, we used the interval period (1–74), and models before = 0 and after = 1.
Table 2 shows the results of Strategy T.1 using weekly data from the first week of 2019 up to 12 weeks from 2020 to predict future values in the crime series. In this strategy of analysis, the model “pretends” these values were unknown for all crimes and cities. We have therefore used ARIMA models to estimate crime levels for Weeks 13 to 22 of year 2020, the period of post-stay-at-home orders. Next, we compared these estimates with the observed data. The F test compared the average predicted value of crime for the post-stay-at-home-orders period with the average predicted value of crime for the pre-stay-at-home-orders period. If we assume that the predictions of the ARIMA model are accurate, the differences between observed and expected values are large (F is large and significant), so we have enough evidence to suggest that stay-at-home orders had a significant impact on some of these crime levels. The Tukey test values are also reported.
Figure 4 illustrates the results for the three cities for a set of comparable types of crime. Results compare the estimated values (in blue) with the observed values (in red). The shapes of these curves reflect, presumably, the force of adaptation to social isolation policies in each city. As this illustration indicates, to visually identify the impact of the stay-at-home orders is difficult—if not impossible—given that the time series can take different shapes. For example, they can manifest in the form of a “pulse” (an isolated event in which a period occurs), a “break in the trend” (which shows a permanent reduction between two large periods), “transitional traffic” (when there is an initial shock, which then gradually disappears), and other forms. Figure 3 shows several situations: no sign of impact, L-shaped impact, and V-shaped impact. The figures showing rape illustrate the three types of situation. In New York, the impact has the form of a V, with the abrupt reduction indicating the onset of the epidemic and a resumption in the following weeks, when isolation measures were relaxed. In Stockholm, no sign of impact is observed for rape, whereas in São Paulo, the impact took the form of an L, that is, initially very low values in comparison with the previous average values when analyzing the entire period of analysis. In general, the impacts in New York and Stockholm illustrate a state of “transition,” followed by the V shape, whereas in São Paulo, they tend to show a stronger effect of the stay-at-home orders and are referred to as “level break” because they tend to follow an abrupt break in an L shape. Given that the postpandemic period data that we analyzed are based on too short of a period to show how long the effects last, it is difficult to foresee whether these impacts will remain.
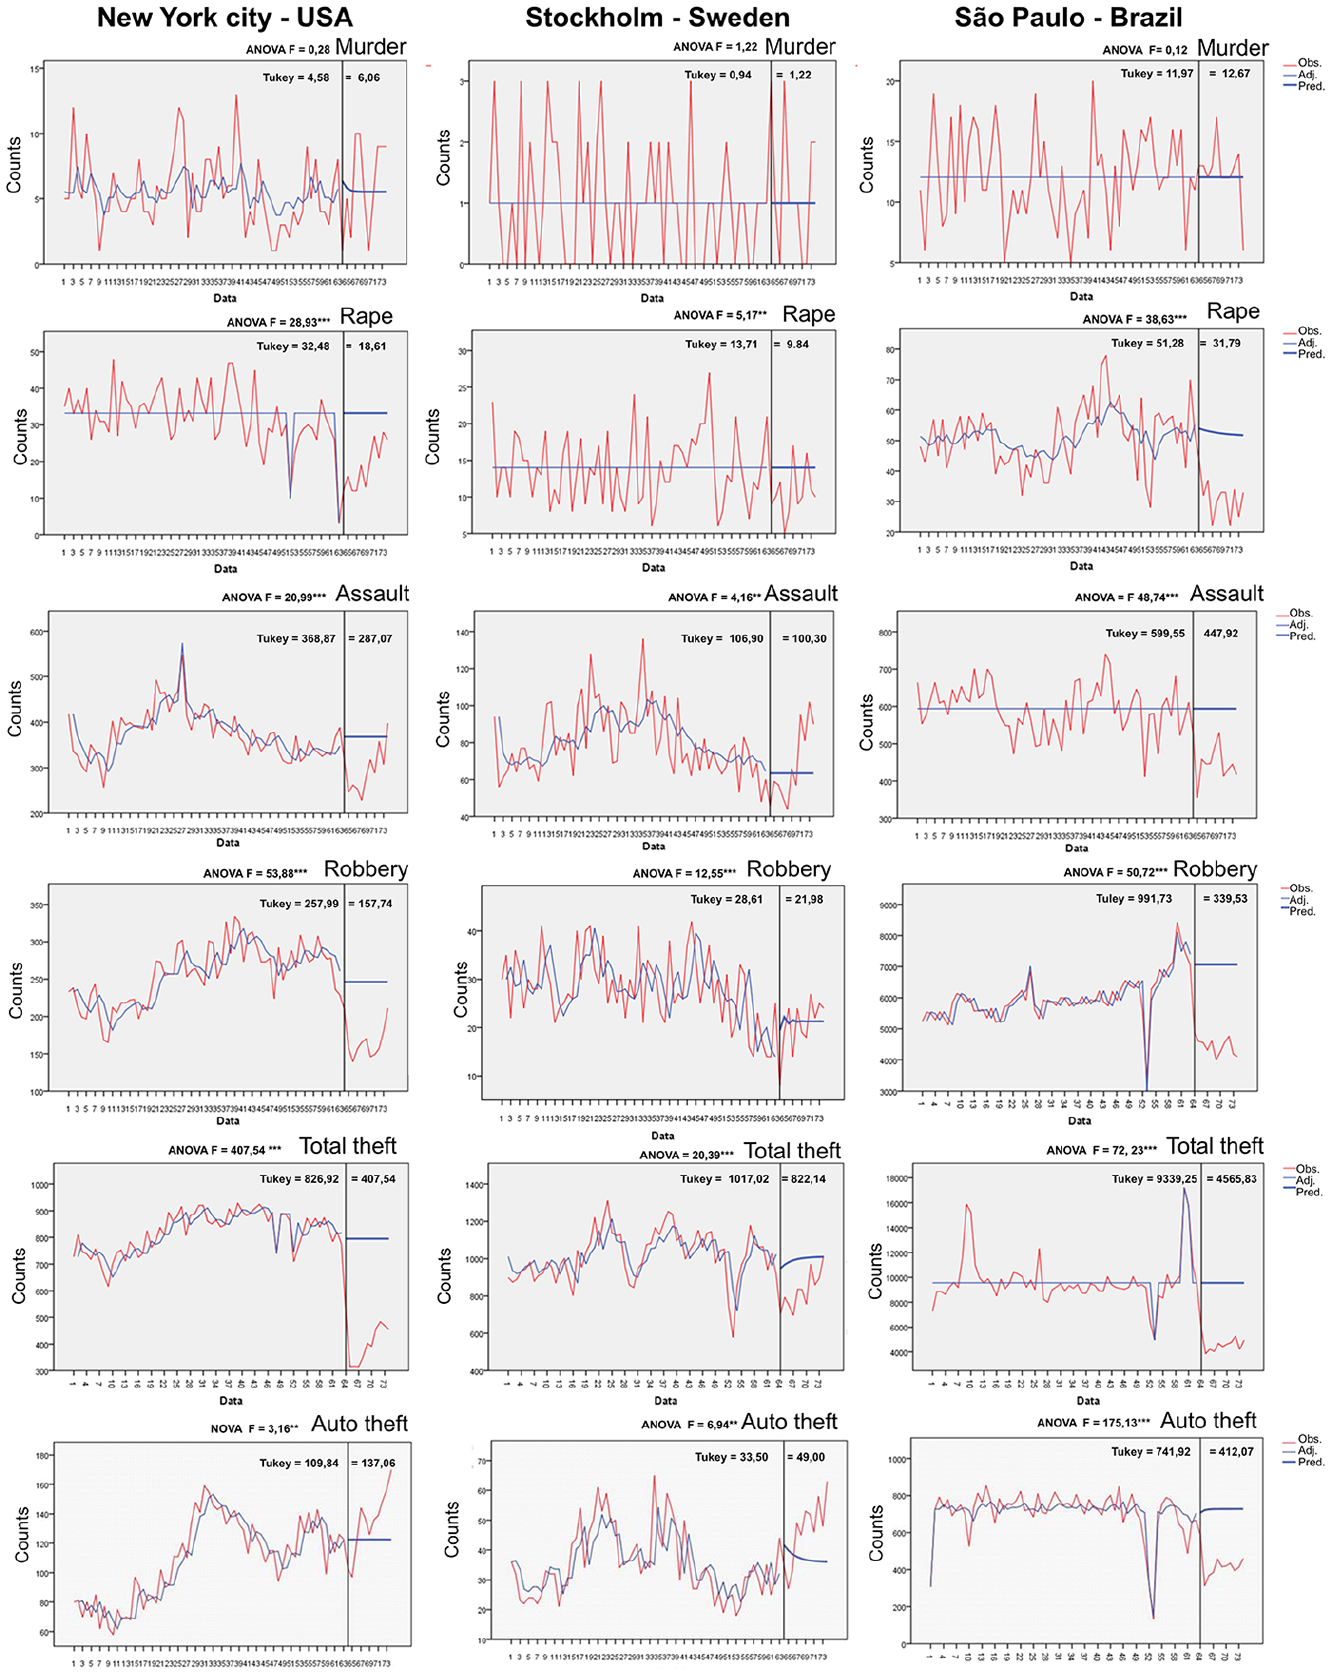
Crime levels (selected) before and after stay-at-home orders for New York City, Stockholm, and São Paulo.
Figure 5 shows the difference in crime trends between residential and commercial/nonresidential burglaries in the three cities. The case of residential burglary is particularly interesting because it could be expected that more people are at home, guarding their premises, so less residential burglary would occur, whereas a contrary trend could be expected for burglary in commercial establishments. Figure 5 shows results from the strategies, comparing the estimated values (in blue) with the observed values (in red). A quick visual inspection confirms that, as suggested by the theory of routine activity, residential burglary decreased while nonresidential burglary showed relative stability (in São Paulo) or increased (in New York and Stockholm). Note that when we looked at the results from the ARIMAX model of Strategy 2, using stay-at-home orders as the explanatory variable, we found statistically significant impacts on residential burglary in Stockholm (t = −2.5; sig. = .014) and in New York (t = −2.6; sig. = .009) but not in São Paulo.
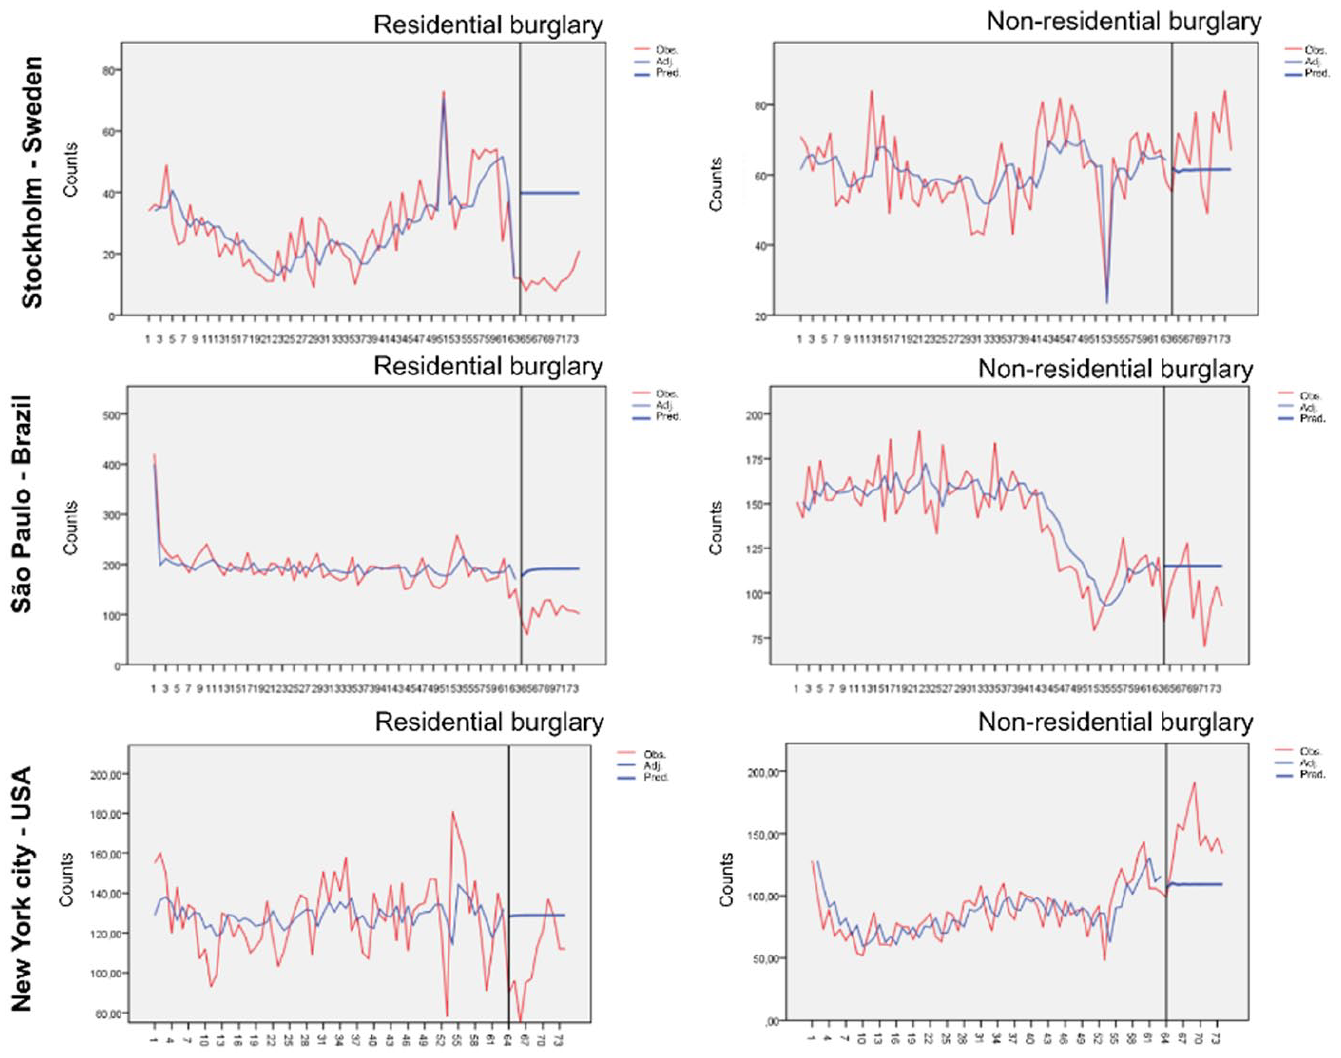
Residential and nonresidential burglary before and after stay-at-home orders for the three cities.
Changes in Crime Patterns Postpandemic: Vehicle Thefts
In this section, we answer the following questions: Do crime clusters (vehicle thefts) change geography after stay-at-home orders? If so, how? Does change in crime geography differ by types of area in New York, São Paulo, and Stockholm?
First, using Strategy S.1, we investigated potential changes in the geography of vehicle thefts in 2020. Figure 6 shows indications of some minor but significant changes when clusters before stay-at-home orders (Weeks 1–12 in 2020) are compared with those after stay-at-home orders (Weeks 13–24 in 2020) in New York, São Paulo, and Stockholm.
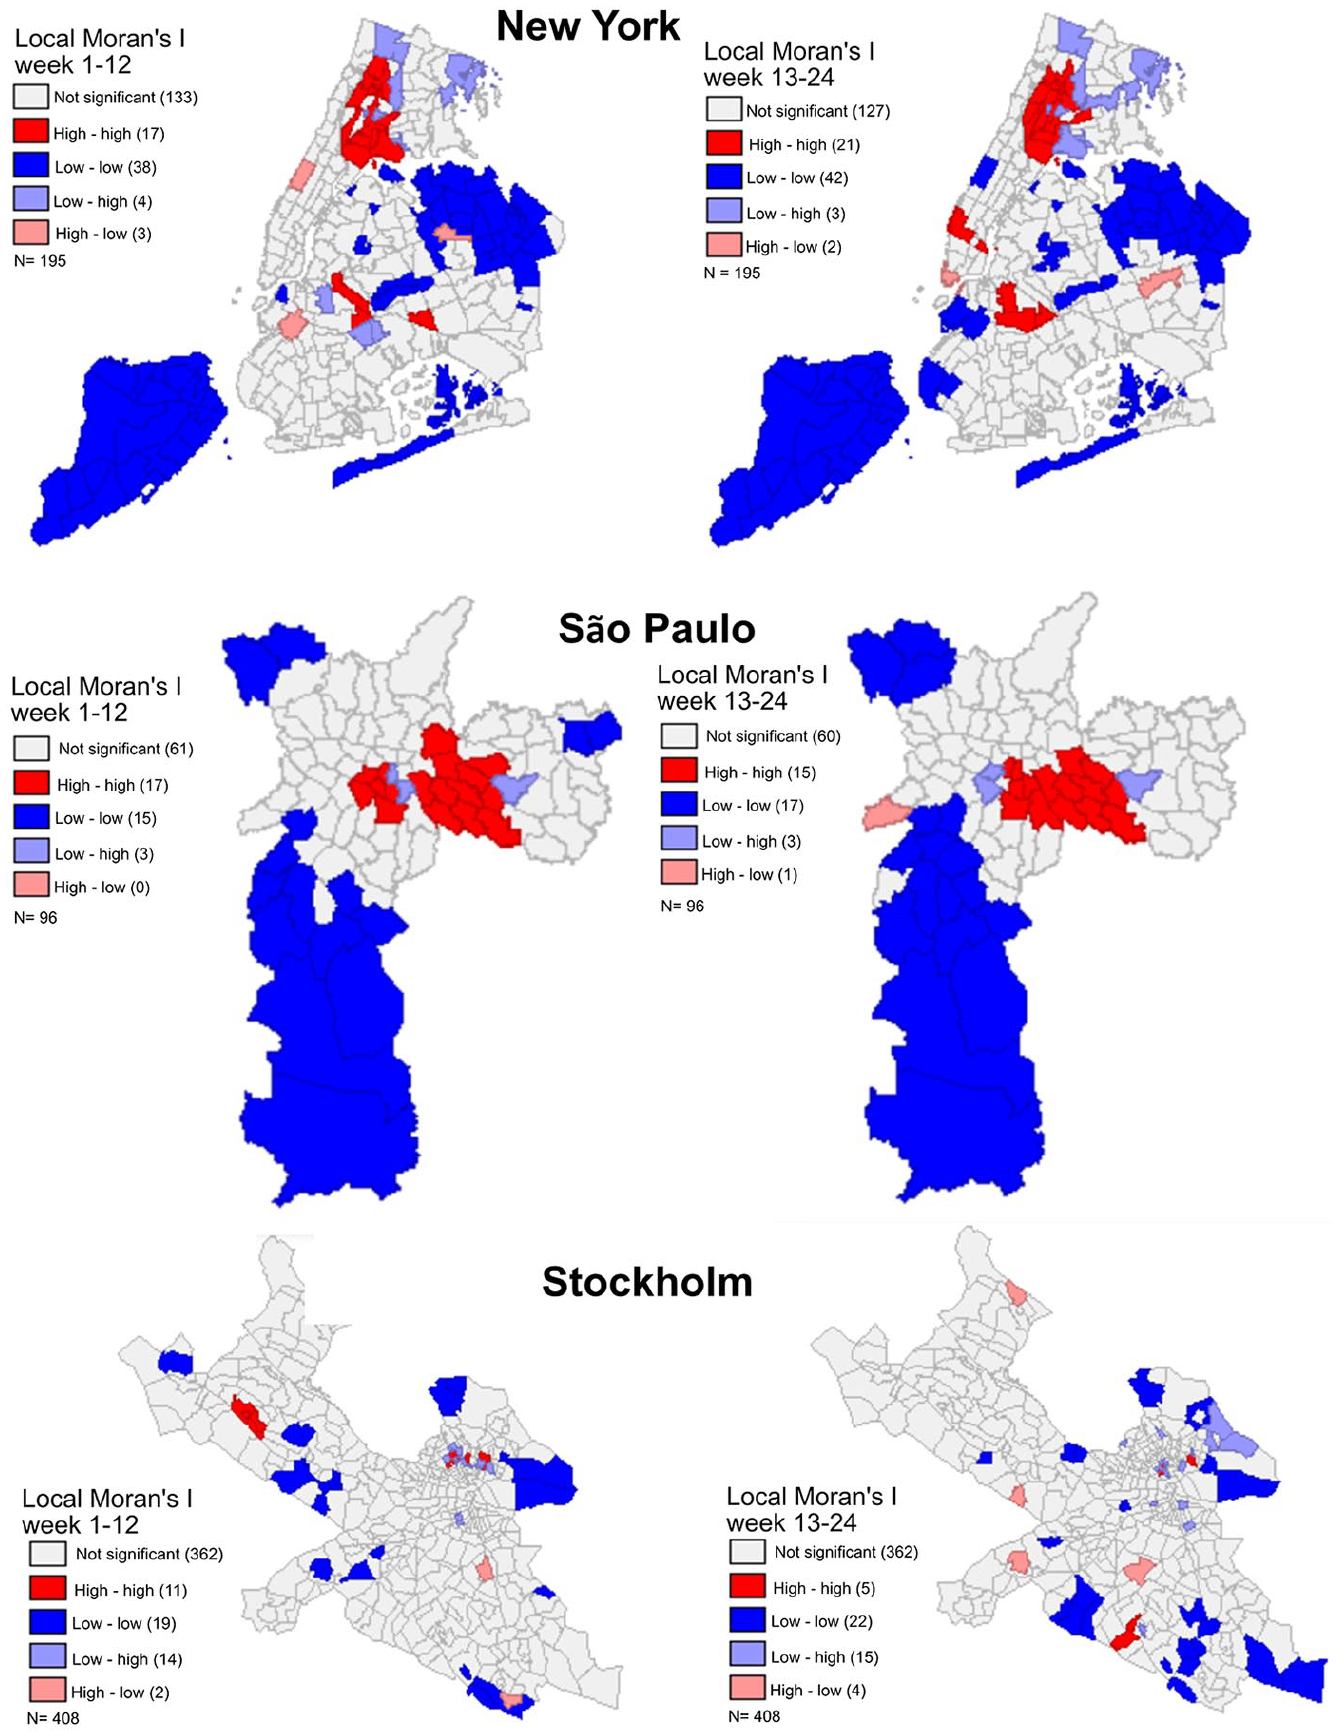
Vehicle thefts 2020.
For New York only, there was an increase in both high-high and low-low areas, but not major changes. The high-high areas are those with high levels of vehicle thefts surrounded by areas with high levels of vehicle thefts before and after the stay-at-home orders in 2020; these increase from 17 to 21 clusters, especially in the Manhattan/Bronx area. The cold spots (low-low) also increased, from 38 to 42. One of the more noticeable changes was the Upper West Side of Manhattan, which was labeled high-low in Weeks 1 to 12 and low-low in Weeks 13 to 24. Other areas that were not significant in Weeks 1 to 12 and then became high-high in Weeks 13 to 24 were midtown Manhattan and downtown Manhattan. These high-high areas include the neighborhoods that contain the major transportation hubs (Penn Station, Grand Central Station, Port Authority Bus Terminal, and World Trade Center Path Station), where many people park their cars in long-term parking lots and take trains/subways to and from their travel destinations. These long-term parking sites have always been consistent hotspots for auto theft.
In São Paulo and Stockholm, the trend was similar for vehicle theft. Both cities observed an increase in cold spots for vehicle thefts and a reduction of hotspots, whereas high-low and low-high remained fairly stable. The greatest changes were found in Stockholm, where there was a decrease of 50% in hotspots (high levels of vehicle thefts surrounded by areas with high levels), from 11 to five clusters post-stay-at-home-orders, especially in the inner-city areas where many parking lots are located but also in the outskirts, alongside underground stations, in the western parts of the city, in Vällingby centrum and Hässelby, for example.
In São Paulo, although a trend similar to Stockholm was observed, the geography seemed to be fairly stable (the core is composed of, for example, Aricanduva, Mooca, and Sapopemba), with a slight increase in cold spots (from 15 to 17 areas) and a reduction of hotspots (from 17 to 15 areas), from before and after the stay-at-home orders. These regions contain a major football stadium, several shopping centers, major highways, and many parking lots, which experienced a decrease in visitors during the pandemic. Note that only in São Paulo have total vehicle thefts declined in this period of time (Figure 4), whereas New York and Stockholm experienced a significant increase. Table 3 summarizes the results.
Summary of Clusters of Vehicle Theft.
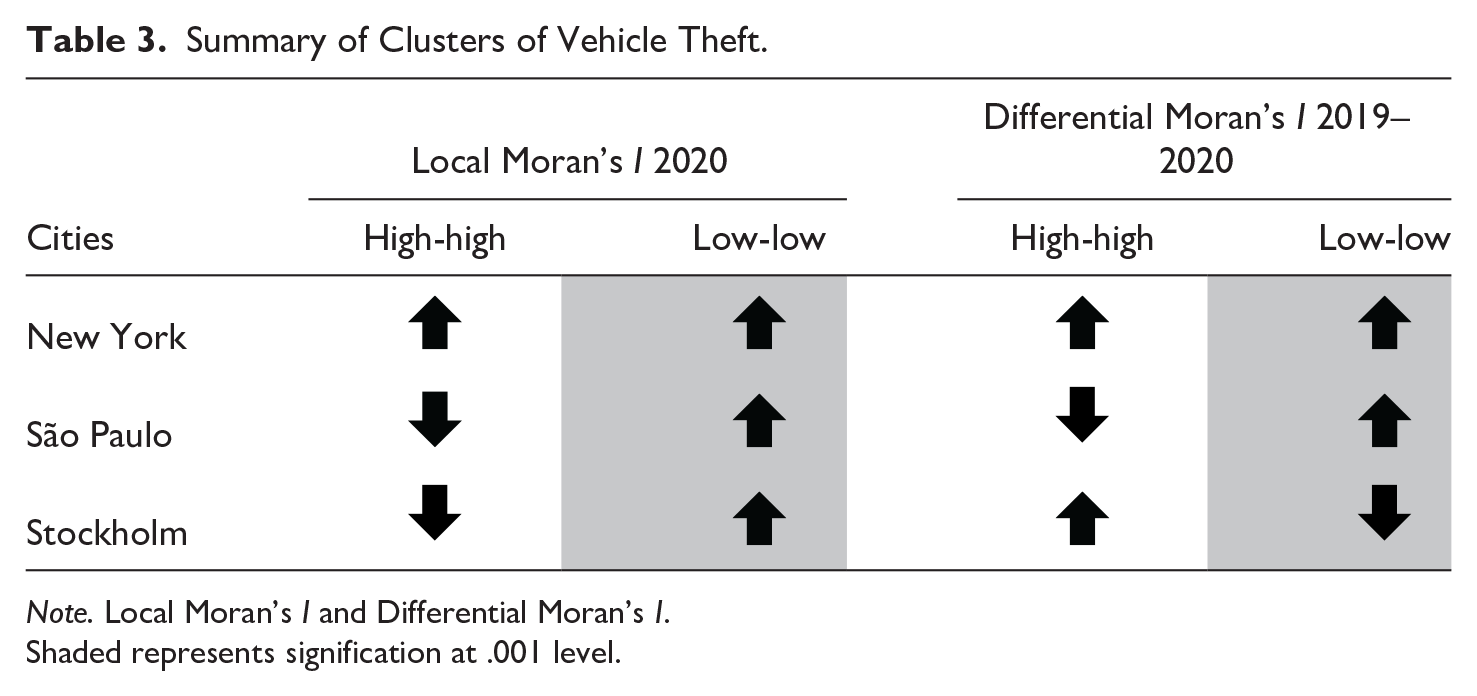
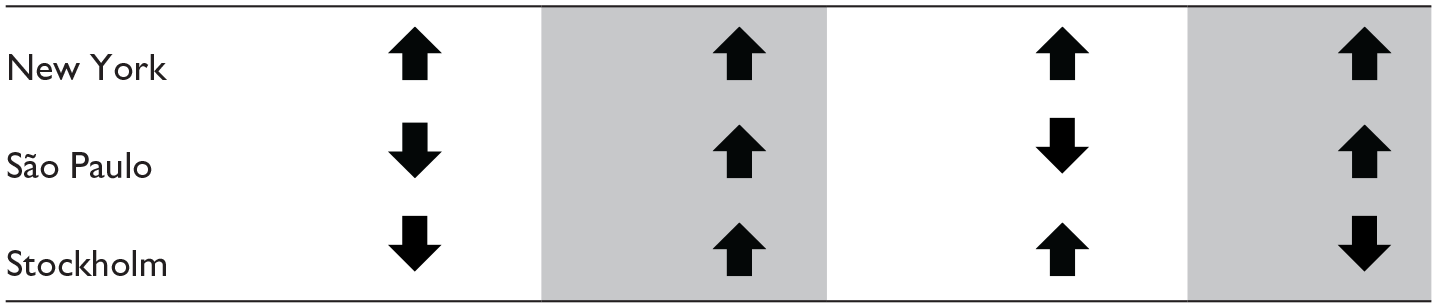
Note. Local Moran’s I and Differential Moran’s I.
Shaded represents signification at .001 level.
In Strategy S.2, we have explored a longer period of time, from 2019 to 2020, using differential Moran’s I to compare possible changes in vehicle theft in Weeks 13 to 24 in 2019 and 2020 and to detect clusters of change. A positive change should be interpreted as “high,” and a negative change as “low,” because the differential Local Moran is equivalent to first computing the difference and then applying the Local Moran.
Figure 7 shows that the number of low-low areas increased dramatically after the stay-at-home orders in 2020 in New York City (from five to 14) and in São Paulo (from six to nine), but not in Stockholm, where there was a reduction of low-low areas and an increase in high-high areas (from eight to 12, especially in a few central-southern areas, such as Hägersten, Väntor, and Bromma). In New York, many of the low-low hotspots in the pandemic Weeks 13 to 24 are residential areas of high population density, neighborhoods where many residents would be working remotely during the pandemic.
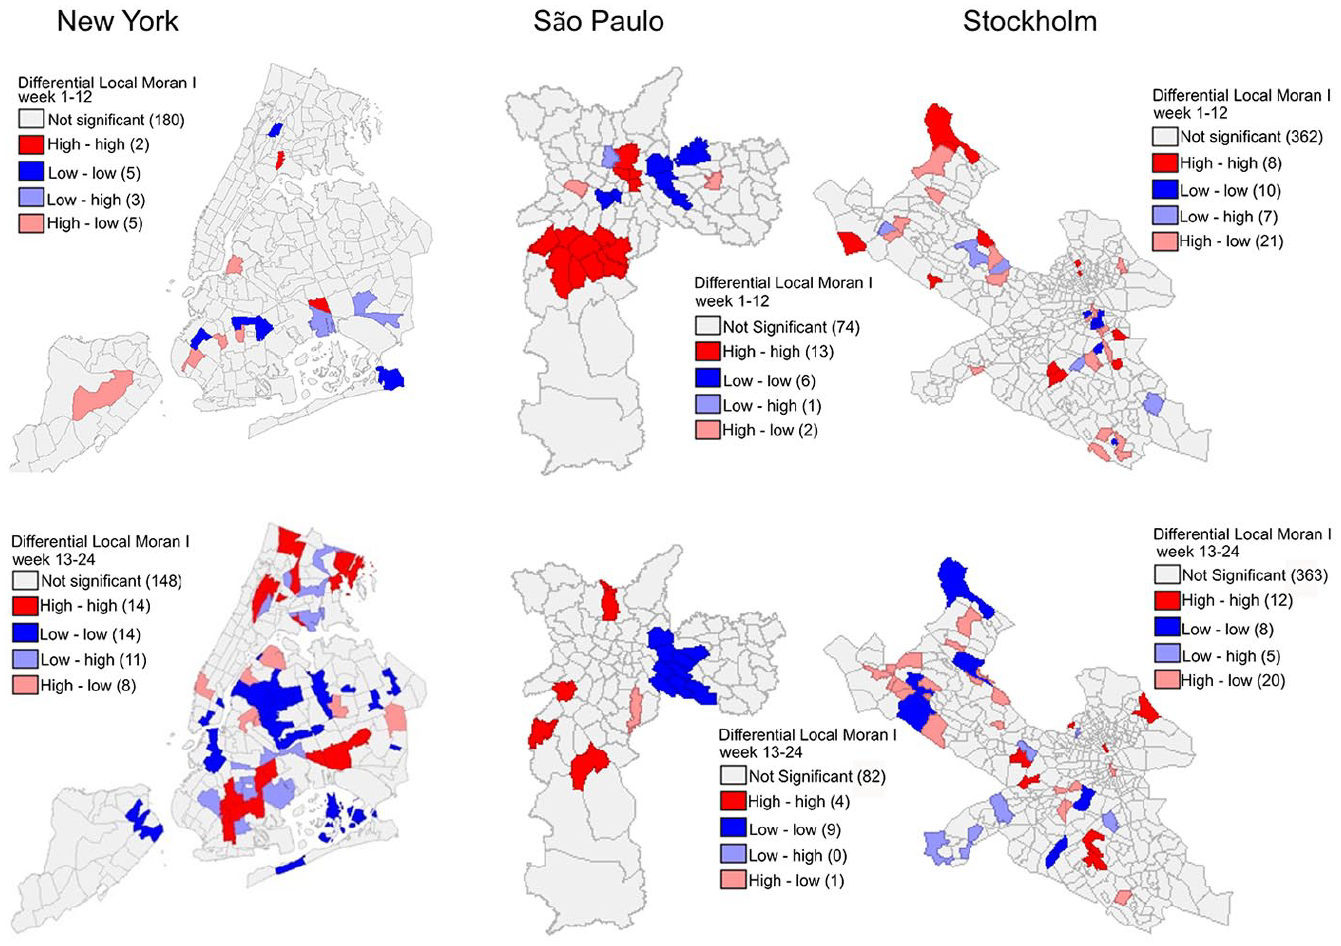
Vehicle theft 2019 & 2020.
In São Paulo, areas that experienced the greatest negative change and had become low-low were Sapopemba and Vila Prudente (previously a hotspot, with several shopping centers and major transit stations and parking lots), whereas in New York, parts of Queens had, also including some crime concentrations, pre-stay-at-home orders. The new high-high areas in New York during the pandemic weeks of 13 to 24 are all located in traditional high-crime neighborhoods, which typically contain higher numbers of essential workers who utilize public transportation. Areas that had a positive change were in the Bronx and Brooklyn, whereas in São Paulo, such areas were Santana-Tucuruvi (a major transportation hub) and Cidade Ademar. Table 2 summarizes these trends. Note that trends of change are similar regardless of the strategy of analysis or the time frame used to test the effects before and after the stay-at-home orders for New York and São Paulo were implemented (increase of low-low areas). The exception was Stockholm, which showed an increase in high-high areas for vehicle thefts.
Discussion of Results
We report variations in crime levels and crime geography in 2019 and those found during the 2020 stay-at-home orders in three major cities—New York, São Paulo, and Stockholm—in different country contexts: the United States, Brazil, and Sweden. Findings presented here provide some evidence that reflects the strength of adherence to social-isolation and stay-at-home policies in three cities in different country contexts, particularly for property crimes, confirming some of the initial postpandemic evidence (e.g., Ashby, 2020b; Boman & Gallupe, 2020; Felson et al., 2020; Gerell et al., 2020; Mohler et al., 2020; Pietrawska et al., 2020; Rosenfeld & Lopez, 2020; Stickle & Felson, 2020; Yang et al., 2021). However, the evidence does not provide enough basis to confirm the initial hypothesis that stricter stay-at-home recommendations alone led to less crime. Our findings do not show major differences in levels or geography between New York City and Stockholm, for instance.
Although New York City, São Paulo, and Stockholm show indications of crime reduction after the pandemic restrictions (Figure 3), these decreases depend on crime type and city context—except for murder (Figure 4). With fewer people out of the streets and more people working from home, a reduction of residential burglary was found significant in all three cities, regardless of the strength of adherence to stay-at-home orders.
For commercial or nonresidential burglaries, an increase was confirmed at least for Stockholm and New York City, regardless of pandemic restrictions, because many businesses became unattended. One possible explanation for this difference between the cities is that online shopping increased dramatically in Sweden and the United States, but not to the same extent in Brazil. Overall, these findings confirm the established links between people’s routine activity and levels of crime, in this case, property crime (see also Pietrawska et al., 2020), but the findings diverge from others (see Ashby, 2020b; Mohler et al., 2020). For instance, Ashby (2020b) found that in some North American cities, there were reductions in residential burglary but little change in nonresidential burglary. Thefts of motor vehicles decreased in some cities, whereas there were divergent patterns of theft from motor vehicles.
It is unclear why vehicle theft falls in São Paulo while it rises in Stockholm and New York. A key issue is the potential use of these vehicles after they are stolen. In São Paulo, for instance, vehicles are disassembled and sold in pieces. With the pandemic, the market fell, so vehicle thefts decreased. In Stockholm and New York, though, the goals of vehicle theft may be different, perhaps taking without own consent (TWOC), use in other crimes or insurance fraud, which continue to occur even after the restrictions. In addition, the importance of crime attractors and generators—parking lots close to sport arenas, transportation nodes, and shopping malls (Brantingham & Brantingham, 1993)—can explain levels and in particular the crime geography of vehicle thefts. We discuss this trend in more detail by looking at the geography of vehicle thefts in these three cities.
Using the example of vehicle theft in the three cities, we searched for evidence of whether the strength of the restrictions would lead to changes in crime patterns. Results for New York show that, with stricter stay-at-home orders, an increase of both hotspots and cold spots for vehicle theft was observed. These increases (either high or low) tended to be clustered in space, in several cases solidifying existing crime concentrations in more deprived areas, such as in the Bronx and to some extent in Queens. In addition, riots, violence in public places, and demonstrations that took place in New York may also have affected levels of crime, in particular damage of public property, vandalism, and violence.
In São Paulo and Stockholm, where the stay-at-home orders were somewhat less strict, significant increases of cold spots for vehicle thefts and a reduction of hotspots were detected. Despite the fact that there has been a reshuffle of a few crime concentrations and a few hotspots shrunk in some of the most deprived areas (in São Paulo) and inner-city districts (in Stockholm) (Figures 5 and 6), findings confirm the initial hypothesis that some areas that suffer from chronic crime problems remain strong crime generators even after the pandemic restrictions, given the social disorganization conditions in some neighborhoods.
Despite this evidence, any causal mechanisms linking pandemic restrictions with changes in crime geography are still exploratory. Note that in this study we have not controlled for differences of land use in these cities, which certainly affect not only crime opportunities but also levels of formal and informal social control in these areas and consequently crime. Police statistics, the basis for this study, are highly dependent on reporting practices, which we think have also been affected during the pandemic. Recent evidence on calls-for-service data from 10 large cities in the United States (Ashby, 2020a) shows that overall the number of calls decreased during the early weeks of the pandemic, in particular for traffic collisions. However, calls for crime and order maintenance continued largely as before. The author also suggests that changes in the levels of different call types present challenges to law enforcement agencies, particularly since many agencies were suffering from reduced staffing due to the pandemic.
Conclusions and Recommendations
In this study, we compared crime levels and geography before and after the imposition of pandemic restrictions in the first 6 months of 2020 in New York City, São Paulo, and Stockholm. We hypothesized that changes in people’s routine activity would affect crime opportunities, guardianship, and, consequently, levels of police recorded crime and its geography.
Findings show that there was a significant change in crime levels (except for murder) after the establishment of stay-at-home orders in all cities in this study, but after a few months, crime started to increase again. There is also some evidence that stricter stay-at-home orders, compared with milder recommendations, have led to an increase in both hotspots and cold spots after the pandemic restrictions. However, if the United States and Sweden were extremes in stay-at-home policy, the biggest differences in crime reduction should have been noticed between the two cities, which the temporal analysis of crime does not confirm (Figure 3, Table 2). Our conclusion is that stay-at-home policy alone has had limited impact; instead, it is the actual variation of people’s mobility patterns that may have affected crime opportunities and potential offenders. In particular, changes from public transportation to private cars, an increase of more local movement patterns to complete stay-at-home orders, should have affected crime levels and geography. These findings indicate that overall the pandemic failed to fully keep a reduction of crime at an aggregate level for more than a couple of months. This can be indicative of the limited capacity of law enforcement to keep crime levels down because criminals and crime adapt quickly to the prevailing situation.
Confirming principles of routine activity, residential burglary levels showed a reduction, whereas nonresidential burglary saw an overall increase. Changes in the levels and geography of vehicle thefts were observed, with an overall increase in significant cold spots, except for Stockholm, which had laxer stay-at-home recommendations. For other crimes, the evidence is mixed. For rape, significant changes were found for Stockholm and for São Paulo but not for New York. Despite some reshuffle in geography, findings show that increases in crime continue to be geographically concentrated, in particular in inner-city areas as well as in known chronically criminogenic areas. Whether these changes are entirely related to the pandemic restrictions is still unclear. Regardless, the evidence put forward in this study reflects the importance of people’s routine activity for crime commission, in particular for property crimes.
Limitations
Given data limitations, we analyzed a postpandemic period that is short and perhaps insufficient to indicate how long these effects last or even determine the underlying mechanisms of these changes. Moreover, it would have been desirable to use a 3-year average of the pre-COVID timeframe to provide a more stable estimate of the crime at that time of year. It is also unclear how strongly the adoption of social isolation policies in each city after the implementation of stay-at-home orders affected reported crime levels and geography in the first 6 months of 2020. Moreover, it is possible that the increase after the decrease in crime could have resulted from the lifting of some restrictions on travel, business openings, or social gatherings, rather than evidence that “criminals and crime adapt quickly.” Future research focused on the comparison of official police statistics may consider including data on relevant indicators that might have affected the supply and dispatch of police forces in the streets during the pandemic. More crimes may have been recorded in some of the deprived areas exactly because police forces are normally more present in these areas than elsewhere. In addition, it is also in these areas that fewer individuals are able to work remotely, leaving them no other choice than being on the street and perhaps exposed not only to the risk of victimization but also of contamination. Moreover, there can still be seasonal effects when weekly observations are used as the basis for the analysis. If data permit, future research should consider seasonal effects, especially at the time of year. All the same, the stay-at-home orders should increase social control, with more “eyes on the streets,” and therefore prevent some types of crime. If data permit, future research should focus on particular types of crime that might also be affected by the pandemic but that were not analyzed in this study, such as violence in domestic environments, cybercrime, and internet fraud.
Policy Implications
The findings of this study have five important policy implications. First, although pandemic restrictions have shown some initial impact on crime, rates began increasing again after a few months, which indicates how quickly criminals and crime adapt to prevailing conditions. If criminals and crime adapt quickly, law enforcement also needs to respond rapidly and reframe prevention practices to be able to keep crime down. Second, it is vital to consider the specificities of country, city, and neighborhood contexts. The pandemic has helped solidify crime in existing crime concentrations, in some deprived areas or crime attractors, for instance. Therefore, thorough knowledge of what the local problems are is crucial. The police should focus efforts on their local community’s immediate needs, addressing them with problem-solving approaches. Finally, it is difficult to predict the future but the economic crisis (unemployment, school evasion, homelessness) caused by the pandemic may have an impact on crime that may last years after the pandemic is “over.” This demands long-term policies and investments to create a safety net for all, but particularly for those who run a higher risk of considering crime as an alternative.
Despite the limitations of the study, we believe that it contributes to the international comparative body of knowledge on the effects of the COVID-19 pandemic on crime levels and crime geography. This is a unique study because it evaluates the potential impact of the different degrees of the pandemic restrictions in three different country contexts with examples of cities in the Global South and Global North, so far lacking in the international literature.
Footnotes
Declaration of Conflicting Interests
The author(s) declared no potential conflicts of interest with respect to the research, authorship, and/or publication of this article.
Funding
The author(s) received no financial support for the research, authorship, and/or publication of this article.