
Abstract
Introduction:
The development of cultural sensitivity is essential for health care professionals but there are few tools to measure this quality in Japan. The purpose of this study was to develop a scale of cultural sensitivity for Japanese health care professionals and examine its reliability and validity.
Method:
A draft scale was created through conceptual analysis and a questionnaire was completed by 515 health care professionals and 1,322 college students. Exploratory and confirmatory factor analyses were used to determine suitable scale items and examine model fitness.
Results:
The four-factor 18-item scale showed acceptable model fitness. Cronbach’s α coefficient exceeded .90 and correlation coefficients for criterion-related validity were over .29. Construct validity was confirmed by the significantly higher score of the cross-culturally experienced groups. The intraclass correlation coefficient was .642 (professionals) and .722 (students).
Discussion:
This reliable and valid scale for Japanese health professionals and college students may be used to evaluate training programs to increase their cultural sensitivity.
Introduction
Globalization has led to rapid growth in the transnational movement of people and has ushered in an era in which we live with people of diverse ethnic, religious, and cultural backgrounds. Under such circumstances, cultural and linguistic differences between patients and health care professionals (HPs) are expected to increase. Indeed, the cultural and linguistic barriers between patients and HPs are known to affect the quality of health care delivery. In previous studies, the populations studied that were susceptible to these barriers were predominantly immigrant populations from non-English-speaking countries living in English-speaking countries (Al-Jumaili et al., 2020).
In Japan, immigrant women are at higher risk for mental health problems (Luo & Sato, 2021a, 2021b). Unsatisfactory health care, language barriers and poor access to health care services are also factors in health disparities (Nagamine et al., 2022; Okamoto et al., 2022; Yasukawa et al., 2019). The American Association of Colleges of Nursing (2021) states that as health care providers, nurses can contribute to reducing health disparities by providing equal and equitable health care services to people of diverse backgrounds. The association further advocates for 21st-century nursing education based on the foundational values of diversity, equity, and inclusion.
In Japan, we are gradually moving toward a society that accepts people of diverse cultural backgrounds. To cope with labor shortages caused by a declining birthrate and an aging population, the Japanese government has implemented policies to promote the acceptance of foreign workers (Immigration Service Agency, 2018). Japan further implemented the 300,000 Foreign Student Plan to secure human resources for the future (Ministry of Education, Culture, Sports, Science and Technology, 2021). These policies have been effective; the number of foreign residents has increased continuously since 2012, reaching a record high of approximately 2.83 million in 2019, before the coronavirus disease 2019 (COVID-19) pandemic (Statistics Bureau of Japan, 2021). As increasing numbers of foreigners visit Japanese medical facilities, Japanese HPs face challenges including differences in language, culture, and lifestyle; misunderstandings caused by divergent views about illness; and the control of negative emotions (Saigusa & Igawa, 2022; Saito et al., 2018). In particular, foreign workers from developing countries are more prone to health issues because they often refrain from accessing health care facilities because of financial problems, language barriers, differences in cultural customs, and the impact of illness on work (Morita et al., 2021; Sawada, 2019). To ensure that foreign patients receive satisfactory treatment, health care providers must consider the life background and social characteristics of these patients and provide culturally sensitive care.
Since the 1990s, the importance of intervention by health care provider with high Cultural Sensitivity (CS) has been continuously emphasized (Leung & Ku, 2023). Several studies have revealed that interventions by culturally sensitive health care providers have been shown to have an impact on patient outcomes (Kuhlmann & Tallman, 2022; Wadi et al., 2021). The development of CS is an important component of nursing education, and all nurses are expected to provide culturally sensitive care (Blankinship, 2018). Furthermore in previous studies, CS has been recognized as a component and foundation of CC (Henderson et al., 2018; Sharifi et al., 2019). This indicates that CS is an important concept in health care provision and health professional education. The CS scale is necessary for developing CS training program and its evaluation.
Background
Among the international tools for CS measurement in health care professionals and college students, the Intercultural Sensitivity Scale (ISS) by Chen and Starosta (2000) is one of the most prominent; the ISS has been translated into several languages and has been used in many studies (Aktaş et al., 2021; Dur et al., 2022; Toda & Maru, 2018). Chen (1997) concluded that intercultural communicative competence consists of three aspects: (a) an affective aspect of facing cultural differences with positive feelings without rejection or negativity, (b) a cognitive aspect of cultural awareness, and (c) a behavioral aspect of conversation and attitude. Chen referred to the affective aspect as “intercultural sensitivity.” Therefore, the ISS measures the emotional aspect of intercultural communication in daily life but does not measure CS as it applies to HPs’ roles and characteristics.
Reviewing the CS scale for health care field, only the Tucker-Culturally Sensitive Health Care Provider Inventory (T-CSHCPI) developed in the United States was found (Tucker et al., 2017). Based on results from focus group in which low-income African, Hispanic, Latino, and non-Hispanic whites American, it is difficult to use this measure in Japan because the racial and ethnic diversity in the United States is very different from those in Japan.
Compared with people in countries such as the United States and some European countries that have multi-ethnic and culturally diverse populations, Japanese people have less experience interacting at school, work, or in other facets of daily life with people from other cultures. Therefore, Japanese people have less direct experience of respecting cultural differences and less opportunity to consciously attempt to understand people from other cultures. Japan is considered a mono-ethnic and monolingual country; its foreign population was as low as 2.2% in 2021 (Nishikawa et al., 2022). Correspondingly, Japanese nurses have limited experience caring for foreign patients (Asakawa et al., 2023; Kondo et al., 2021). Few Japanese nurses have received lecture-style or simulation exercise training in caring for patients with diverse cultural backgrounds (Kambayashi et al., 2020). In previous studies, Japanese nurses were found to have lower CC scores than Thai nurses (Kawabata et al., 2020). It is suggested that this less frequent exposure to other cultures and fewer opportunities to participate in CS training may have affected the CC of Japanese nurses. To transition to a culturally diverse future society, Japanese HPs and STs must improve their CS, the foundational element of CC for a HP.
A considerable need exists for a “CS of HPs” measurement scale to guide the development and evaluation of educational and training programs in CS. After an extensive literature review, no instrument was found that measured the concept of CS of Japanese HPs and STs. To ensure the readiness of Japanese HPs and STs in providing CS care to patients, a measurement tool that measures CS is needed. The purpose of this study was to develop a “CS of HPs” scale that can be used by both HPs and STs who are training as HPs. If translated and used in countries with cultural immersion stages similar to those in Japan, this scale could contribute to improving CS among HPs in these countries.
Method
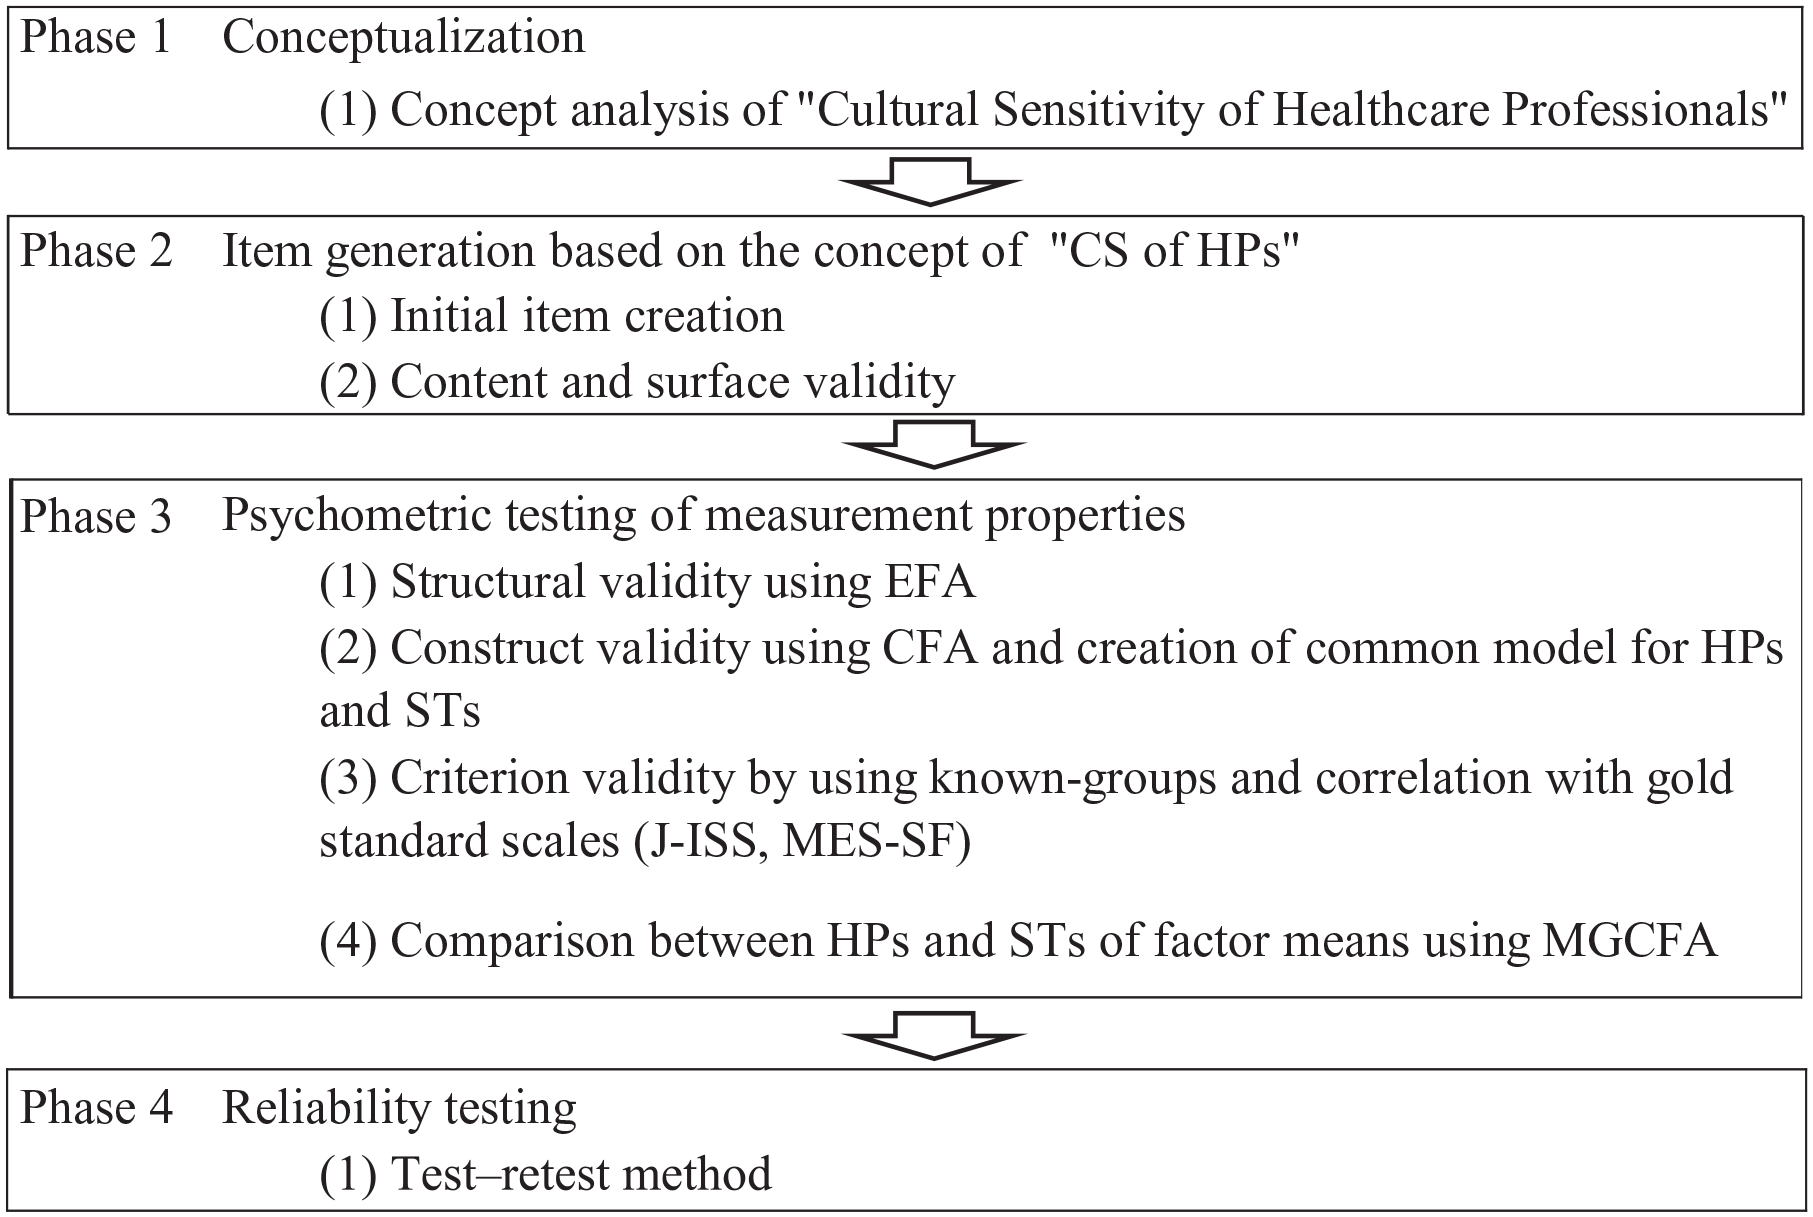
Development and testing of the CS of health care professionals proceeded through a four-phase process is shown in Figure 1. A quantitative cross-sectional study was conducted following a conceptual analysis of CS of health care professionals.
Overview of Study Procedure
Phase 1: Conceptualization
In previous conceptual analyses of CC, CS has been identified as a sub-concept or antecedent of CC (Garrido et al., 2019; Henderson et al., 2018; Sharifi et al., 2019; Yang, 2021). This scale is based on the conceptual analysis of CS to differentiate it from CC to which it is a subconcept. The creation of the content and domains areas for the construct of measurement must be clear. We used the attributes of CS derived from our conceptual analysis for the study (Tanaka & Arakida, 2019).
Phase 2: Item Generation
Generation of Initial Item
Scale items were generated based on the concept of “CS of HPs” by referring to the literature on cross-cultural nursing competence, cultural sensitivity, and related measurement scales. A pool of 58 items in Japanese was created.
Content and Face Validity of Initial Item
Japanese experts with extensive knowledge of and experience in cross-cultural care were individually interviewed to collect expert opinions on whether the initial item appropriately queried the “attributes of CS among HPs” and whether any expressions were difficult to understand. The experts were four researchers with research interests similar to ours teaching at universities and three experienced members of the Japan Overseas Cooperation Volunteers with more than 2 years of experience providing care to patients with different cultural backgrounds in foreign countries. All experts were selected for convenience sampling.
The duration of the interview ranged from 90 to 120 min and interviews were recorded. Items were modified and integrated into the wording as a result of expert opinion. Finally, 50 initial items were generated in Japanese.
Pre-Test
A pre-test was conducted to examine the face validity of the initial items. The participants were 30 doctoral students in nursing and included many nursing faculty. They were all Japanese. They were asked to participate in the pre-test after class. After filling out the questionnaire, participants developed and integrated comments on the modification of the initial items in the five-person group discussion. Finally, a draft 7-point CS scale (1 = not at all applicable to 7 = very applicable) with five subscales and 37 items was developed. Five subscales are (a) a positive desire to understand people with diverse cultures (10 items), (b) respect for culture (6 items), (c) an understanding of culture (6 items), (d) knowledge of culture (8 items), and (e) an awareness of differences with own culture (7 items).
Phase 3: Psychometric Testing of Measurement Properties
A cross-sectional quantitative survey was conducted to evaluate the internal consistency and the construct and criterion validity of the CS scale for HPs and STs.
Sample and Data Collection
The study samples consisted of Japanese HPs and STs. The HP target samples consisted of physicians, nurses, pharmacists, physical therapists, or occupational therapists. Requests for participation in the research were sent to 315 hospitals with at least 50 beds (excluding psychiatric and long-term care beds for older adults) located in Japanese cities that had a foreign population ratio of over 3.0%. After obtaining research approval from 11 hospitals, 853 questionnaires were distributed to HPs by the chiefs of participants’ departments. The data collection period was from November 2019 to November 2020 and included an intermission period to account for the COVID-19 pandemic.
The ST target samples consisted of sophomores and juniors enrolled in a college of medicine, nursing, pharmacy, physical therapy, or occupational therapy. Sophomores and juniors were selected to examine whether differences in the stage of study affected CS scores. Forty schools were randomly selected from a list of medical, nursing, pharmacy, physical therapy and occupational therapy schools nationwide, and requests for participation in the research were sent by mail to college deans. A description of the research and a complete set of questionnaires were distributed to a total of 3,712 students from 27 schools (nine nursing, five pharmacy, seven physical therapy, and six occupational therapy) that were approved to conduct the study. Approval was not granted by the College of Medicine. The data collection period was from November 2019 to March 2020.
Instruments
The questionnaire in Japanese consisted of the elements listed below. A series of survey forms were self-administered, anonymous, and paper-and-pencil-based.
Demographic Profile
HPs were asked about their gender, age, profession, education, years of experience in the current profession, and total years of experience as an HP. STs were asked about their gender, age, and the school and year in which they were enrolled.
Draft CS Scale (37 Items)
The following instructions were included at the beginning of the form that included the scale: “Please select one of the following seven that best describes your approach and attitude as a health care professional when providing care to culturally diverse patients.”
Scales for Criterion Validity
Permission for the use of scales was obtained from developers.
The Japanese Version of the Intercultural Sensitivity Scale (J-ISS)
The ISS (a 24-item 5-point scale) developed by Chen and Starosta (2000) is the original version of the scale. As mentioned, the scale has been used in a relatively large number of studies in the health care field and is recognized as a gold standard. Suzuki (2017) confirmed the validity and reliability of the J-ISS (a 16-item 5-point scale) based on a Cronbach’s α of .61 to .77 and test–retest correlation coefficients of .67 to .80.
Multidimensional Empathy Scale-Short Form
Empathy is an important factor that deepens the understanding of others and motivates helping and other prosocial behaviors (Suzuki & Kino, 2008). The Multidimensional Empathy Scale (MES) measures individual characteristics related to the emotional aspects of empathy and the generation of cognitive processes (Suzuki & Kino, 2008). They developed the original 24-item (5-point scale) version in Japanese, and then 10-item short versions were created (Kino & Suzuki, 2016). The scale consists of five subscales: “other-oriented reactions,” “self-oriented reactions,” “affectedness,” “perspective-taking,” and “imagination.” Of these subscales, “other-oriented reactions (empathic concern)”—which entails putting oneself in the position of others—and “perspective-taking” as its cognitive tendency are related to our “CS of HPs” attributes “positive desire to understand people with diverse cultures,” “awareness of differences with own culture,” and “respect for culture,” all of which include supportive and empathic attitudes toward people. For these reasons, we adopted the MES-Short Form (MES-SF) for examination of criterion validity.
Questions for Known Groups and Convergent Validity
Three questions were prepared to examine known-groups validity using the t-test: (a) “experience living abroad more than one year,” (b) “proficiency in a foreign language at the level of daily life,” and (c) “experience of attending in-country training in cultural diversity.” Another four questions regarding the perception of health disparities among minority groups with different cultures and willingness to work in a foreign country were created to test convergent validity by Pearson’s correlation. A 7-point scale (1 = not at all applicable to 7 = very applicable) was used to answer these questions.
Statistical Analysis
The collected data were analyzed using SPSS for Windows Ver. 26 (IBM Japan, Ltd., Tokyo, Japan) and AMOS for Windows Ver. 26 (IBM Japan, Ltd., Tokyo, Japan). Missing data were removed from the analysis. Descriptive statistics for all variables were performed and confirmed to have the normality of scale items using QQ plots and histograms. The level for statistical significance was set at 5%.
For construct validation, the total returned samples for HPs and STs were divided into two subsamples using a random number generated by Microsoft Excel. For HPs, Subsample 1 (n= 256) was used for exploratory factor analysis (EFA) and Subsample 2 (n=259) was used for confirmatory factor analysis (CFA). Similarly, ST Subsample 1 (n=700) was used for EFA and ST Subsample 2 (n =622) for CFA. The size of subsamples satisfied the criteria of seven times the number of items and more than 100 for EFA and at least 200 for CFA (Mokkink et al., 2018).
Item Analysis
To determine whether EFA could be used for the draft scale, ceiling and floor effects, item-total correlations (≥.30), item-to-item correlations (≤80), a Kaiser–Mayer–Olkin measure of sampling adequacy (≥.90, and the Bartlett’s test of sphericity (≥.90) of Subsample 1 for HPs and STs were conducted. Statistical criteria were set as above (Stainer et al., 2016).
Exploratory Factor Analysis
EFA was performed with Promax rotation and the generalized least-squares method to determine their underlying factor structures for HPs and STs. Items with factor loadings of .40 or more but not more than .40 across multiple factors were adapted repeatedly until convergence was achieved. The criterion for determining the number of factors was an eigenvalue of 1.0 or more, which was used in combination with the decreasing trend of eigenvalues in the scree plot (De Vet et al., 2011).
Confirmatory Factor Analysis
To confirm the factor structure and create a higher goodness-of-fit model after EFA, CFA was performed on Subsample 2 for HPs and STs using maximum-likelihood estimation. The CFA model fit criteria were set using multiple indices: a comparative fit index (CFI) > .95, a root mean square error of approximation (RMSEA) ≤ .06, or a standardized root mean square residual (SRMR) < .08 (Mokkink et al., 2018).
Identification of a Common Model for HPs and STs
The factor structures of the respective models for HPs and STs were very similar; therefore, a common model creation was attempted by analyzing the samples that were fed into each model. The criterion of RMSEA value was set at ≤.05 (Toyoda, 2007).
Internal Consistency
Cronbach’s α values between .70 and .95 are considered acceptable to confirm the internal consistency of the CS scale. We deemed a value of .80 or higher sufficient.
Convergent Validity
Known-groups validity was assessed using a t test. The magnitude of the known-groups validity was decided using Cohen’s effect sizes d for yes/no groups. Pearson’s correlation between the score of the “CS of HPs” and the perception of health disparities in minority populations in Japan was calculated. The criterion correlation coefficient value for the item-total correlation in this study was set at ≥.30 (Stainer et al., 2016).
Criterion-Related Validity
Pearson’s correlation coefficients were calculated for the final CS scale and the J-ISS, the criterion value of r was set at .40 to .80 (Stainer et al., 2016).
Multi-Group Confirmatory Analysis
After identifying a common model, a multi-group confirmatory analysis (MGCFA) was performed to investigate whether HPs had higher CS scores than STs. Because we hypothesized that HPs might have more experience than STs in providing care to foreign patients in clinical sites, it was predicted that HPs would have higher scores compared with STs.
The goodness-of-fit index, the CFI, the RMSEA, and Akaike’s information criterion were used to examine measurement invariance (Toyoda, 2007). Then, the effect size Cohen’s d was calculated to examine the degree of difference in the mean score. Small, moderate, and large effect sizes were defined as those having d values of 0.20, 0.50, and 0.80, respectively (Kim & Mallory, 2016).
Phase 4: Reliability Using the Test–Retest Method
A cross-sectional web-based survey was conducted to evaluate the reproducibility of the final CS scale.
Sample and Data Collection
Inclusion criteria for HPs were physicians, nurses, pharmacists, physical therapists, or occupational therapists who worked in Japanese general hospitals with 50 or more beds. Inclusion criteria for STs were students enrolled in the courses of medicine, nursing, pharmacy, physical therapy, or occupational therapy and in the second year or above. Sample size was calculated using the following formula; n = 2 + k/2(k − 1)(zr − zr-)2 (confidence coefficient: r=.85, standard error [SE]=.05, k [number of observations] = 2) (Stainer et al., 2016). Then, we determined sample sizes of 50 HPs and 50 STs.
Participant recruitment and data collection were outsourced to an internet research firm (NTT Com Online Marketing Solutions Corporation: NTT Com, Tokyo, Japan), which has a large number of monitors and covers a wide range of demographics in Japan. The COVID-19 pandemic was the primary reason for using an internet survey method. At the time, it was impossible to conduct the survey using conventional face-to-face and paper-and-pencil methods.
To test the reproducibility of the final CS scale, participants were asked to respond twice, with 10 to 14 days elapsing between the first and second responses.
HPs were asked to provide information on gender, age, and job title, whereas STs were asked about gender, age, area of study, and grade.
Statistical Analysis
The intraclass correlation coefficient (ICC 2.1) for reproducibility was analyzed. ICC ≥ .70 was considered the criterion for reliability (Mokkink et al., 2018).
Ethical Considerations
All study procedures were approved by the Soka University Institutional Review Board for Human Research (approval numbers: 2019040, 2020061).
Results
Demographic Characteristics
Health Care Professionals
Among the total 853 HPs, 541 (63.4%) responded, and 515 completed items were included in the analysis. The demographic characteristics of Subsample 1 (n=259 for EFA) and Subsample 2 (n=256 for CFA) are shown in Table 1. Nurses were the largest group of HPs. No significant differences were observed between the occupational ratios of the two subsamples (χ2 = 5.097, df = 4, p= .206).
Demographic Characteristics of Participants.
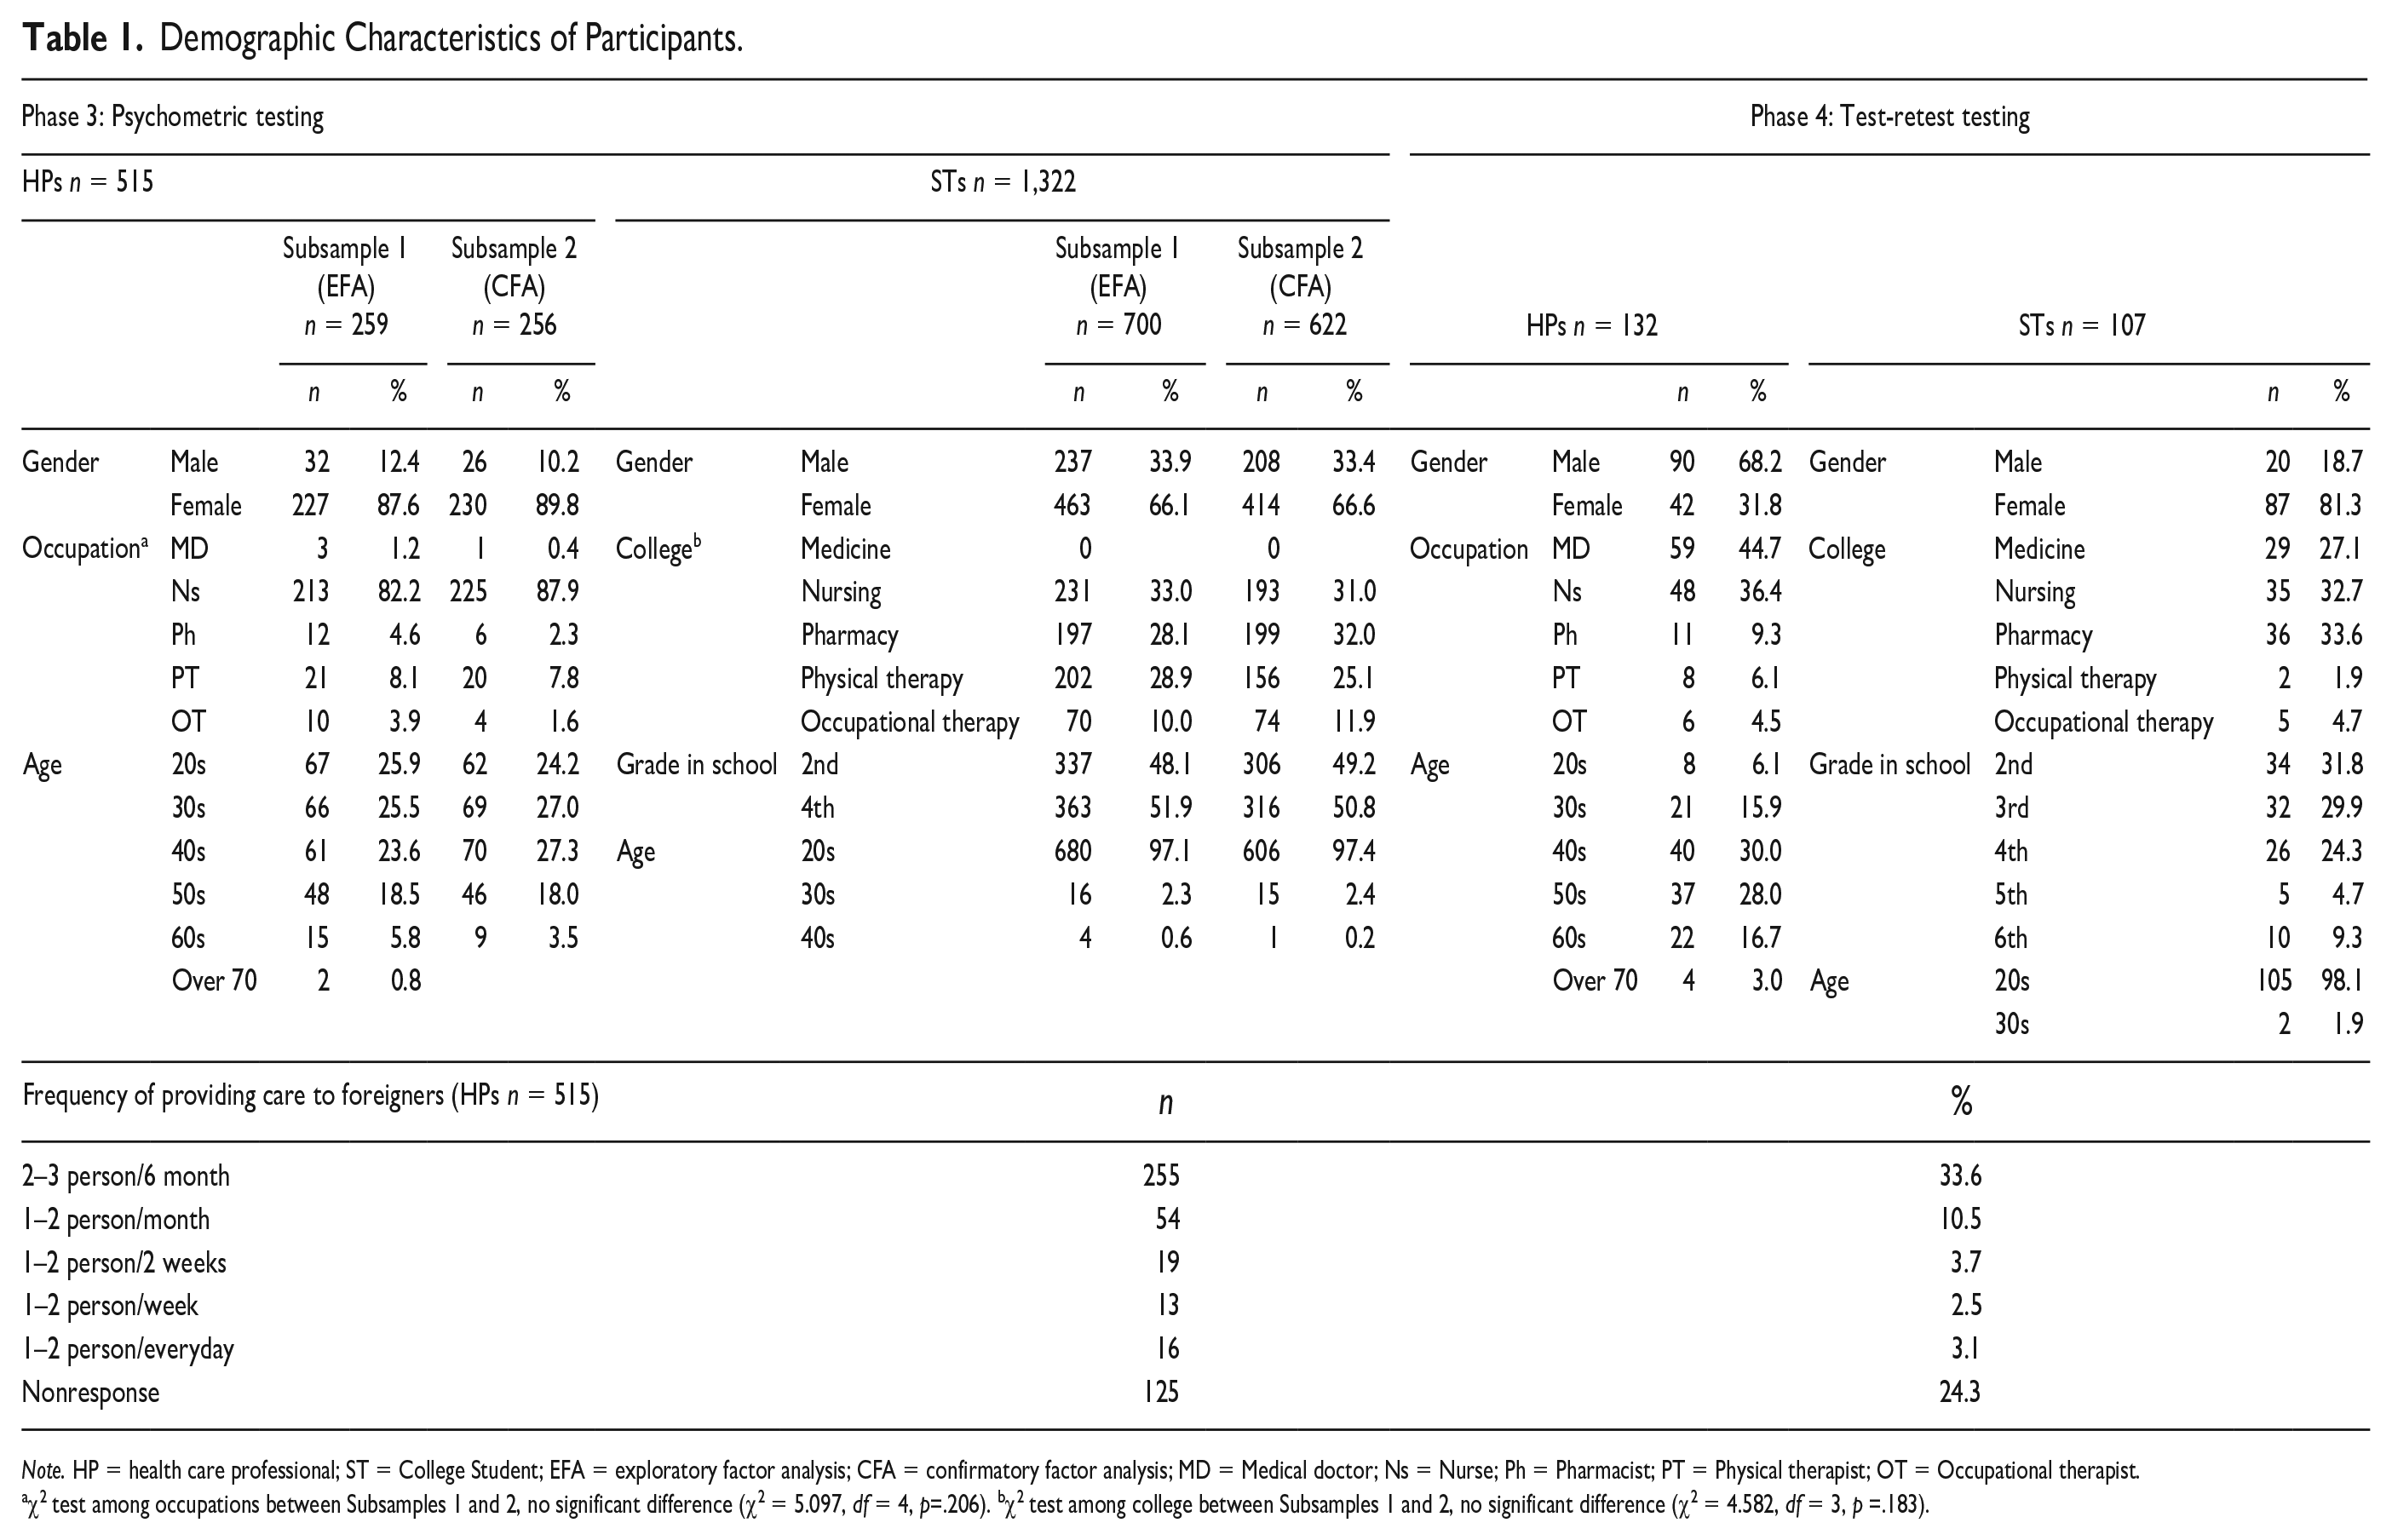
Note. HP = health care professional; ST = College Student; EFA = exploratory factor analysis; CFA = confirmatory factor analysis; MD = Medical doctor; Ns = Nurse; Ph = Pharmacist; PT = Physical therapist; OT = Occupational therapist.
χ2 test among occupations between Subsamples 1 and 2, no significant difference (χ2 = 5.097, df = 4, p=.206). bχ2 test among college between Subsamples 1 and 2, no significant difference (χ2 = 4.582, df = 3, p =.183).
College Students
In total, 1,355 of 3,712 (36.5%) STs responded, and the 1,322 respondents who completed items were examined in the analysis. The demographic characteristics of Subsample 1 (n = 700 for EFA) and Subsample 2 (n = 622 for CFA) are shown in Table 1. Medical students were not included because the faculty of medicine did not provide consent for participation. No significant differences were observed in the college ratio between the two subsamples (χ2 = 4.852, df = 3, p = .183).
Item Analysis
No items showed a ceiling or floor effect in either group. Both subsamples satisfied item-total and item-to-item correlation criteria. The Kaiser–Mayer–Olkin measure (HP Subsample 1 = .949; ST Subsample 1 =.972) and Bartlett’s test of sphericity (HP Subsample 1: χ2 = 8,380.308, p<.001; ST Subsample 1: χ2 = 19,578.510, p <.001) were also acceptable. Results indicated that EFA could be performed on both samples.
Exploratory Factor Analysis
Health Care Professionals
After conducting an EFA on 37 items, 26 items with four factors were finally extracted. Eleven items that did not meet factor loading criteria were examined separately for possible deletion; it was confirmed that these items were appropriate for deletion following a discussion of the similarity and importance of the items. Cronbach’s α coefficients were .928, .921, .920, and .884 for factors 1, 2, 3, and 4, respectively, and .961 for the total of 26 items. Given that all coefficients were above .80, we confirmed internal consistency reliability (Table 2).
Exploratory Factor Analysis of Health Care Professionals.
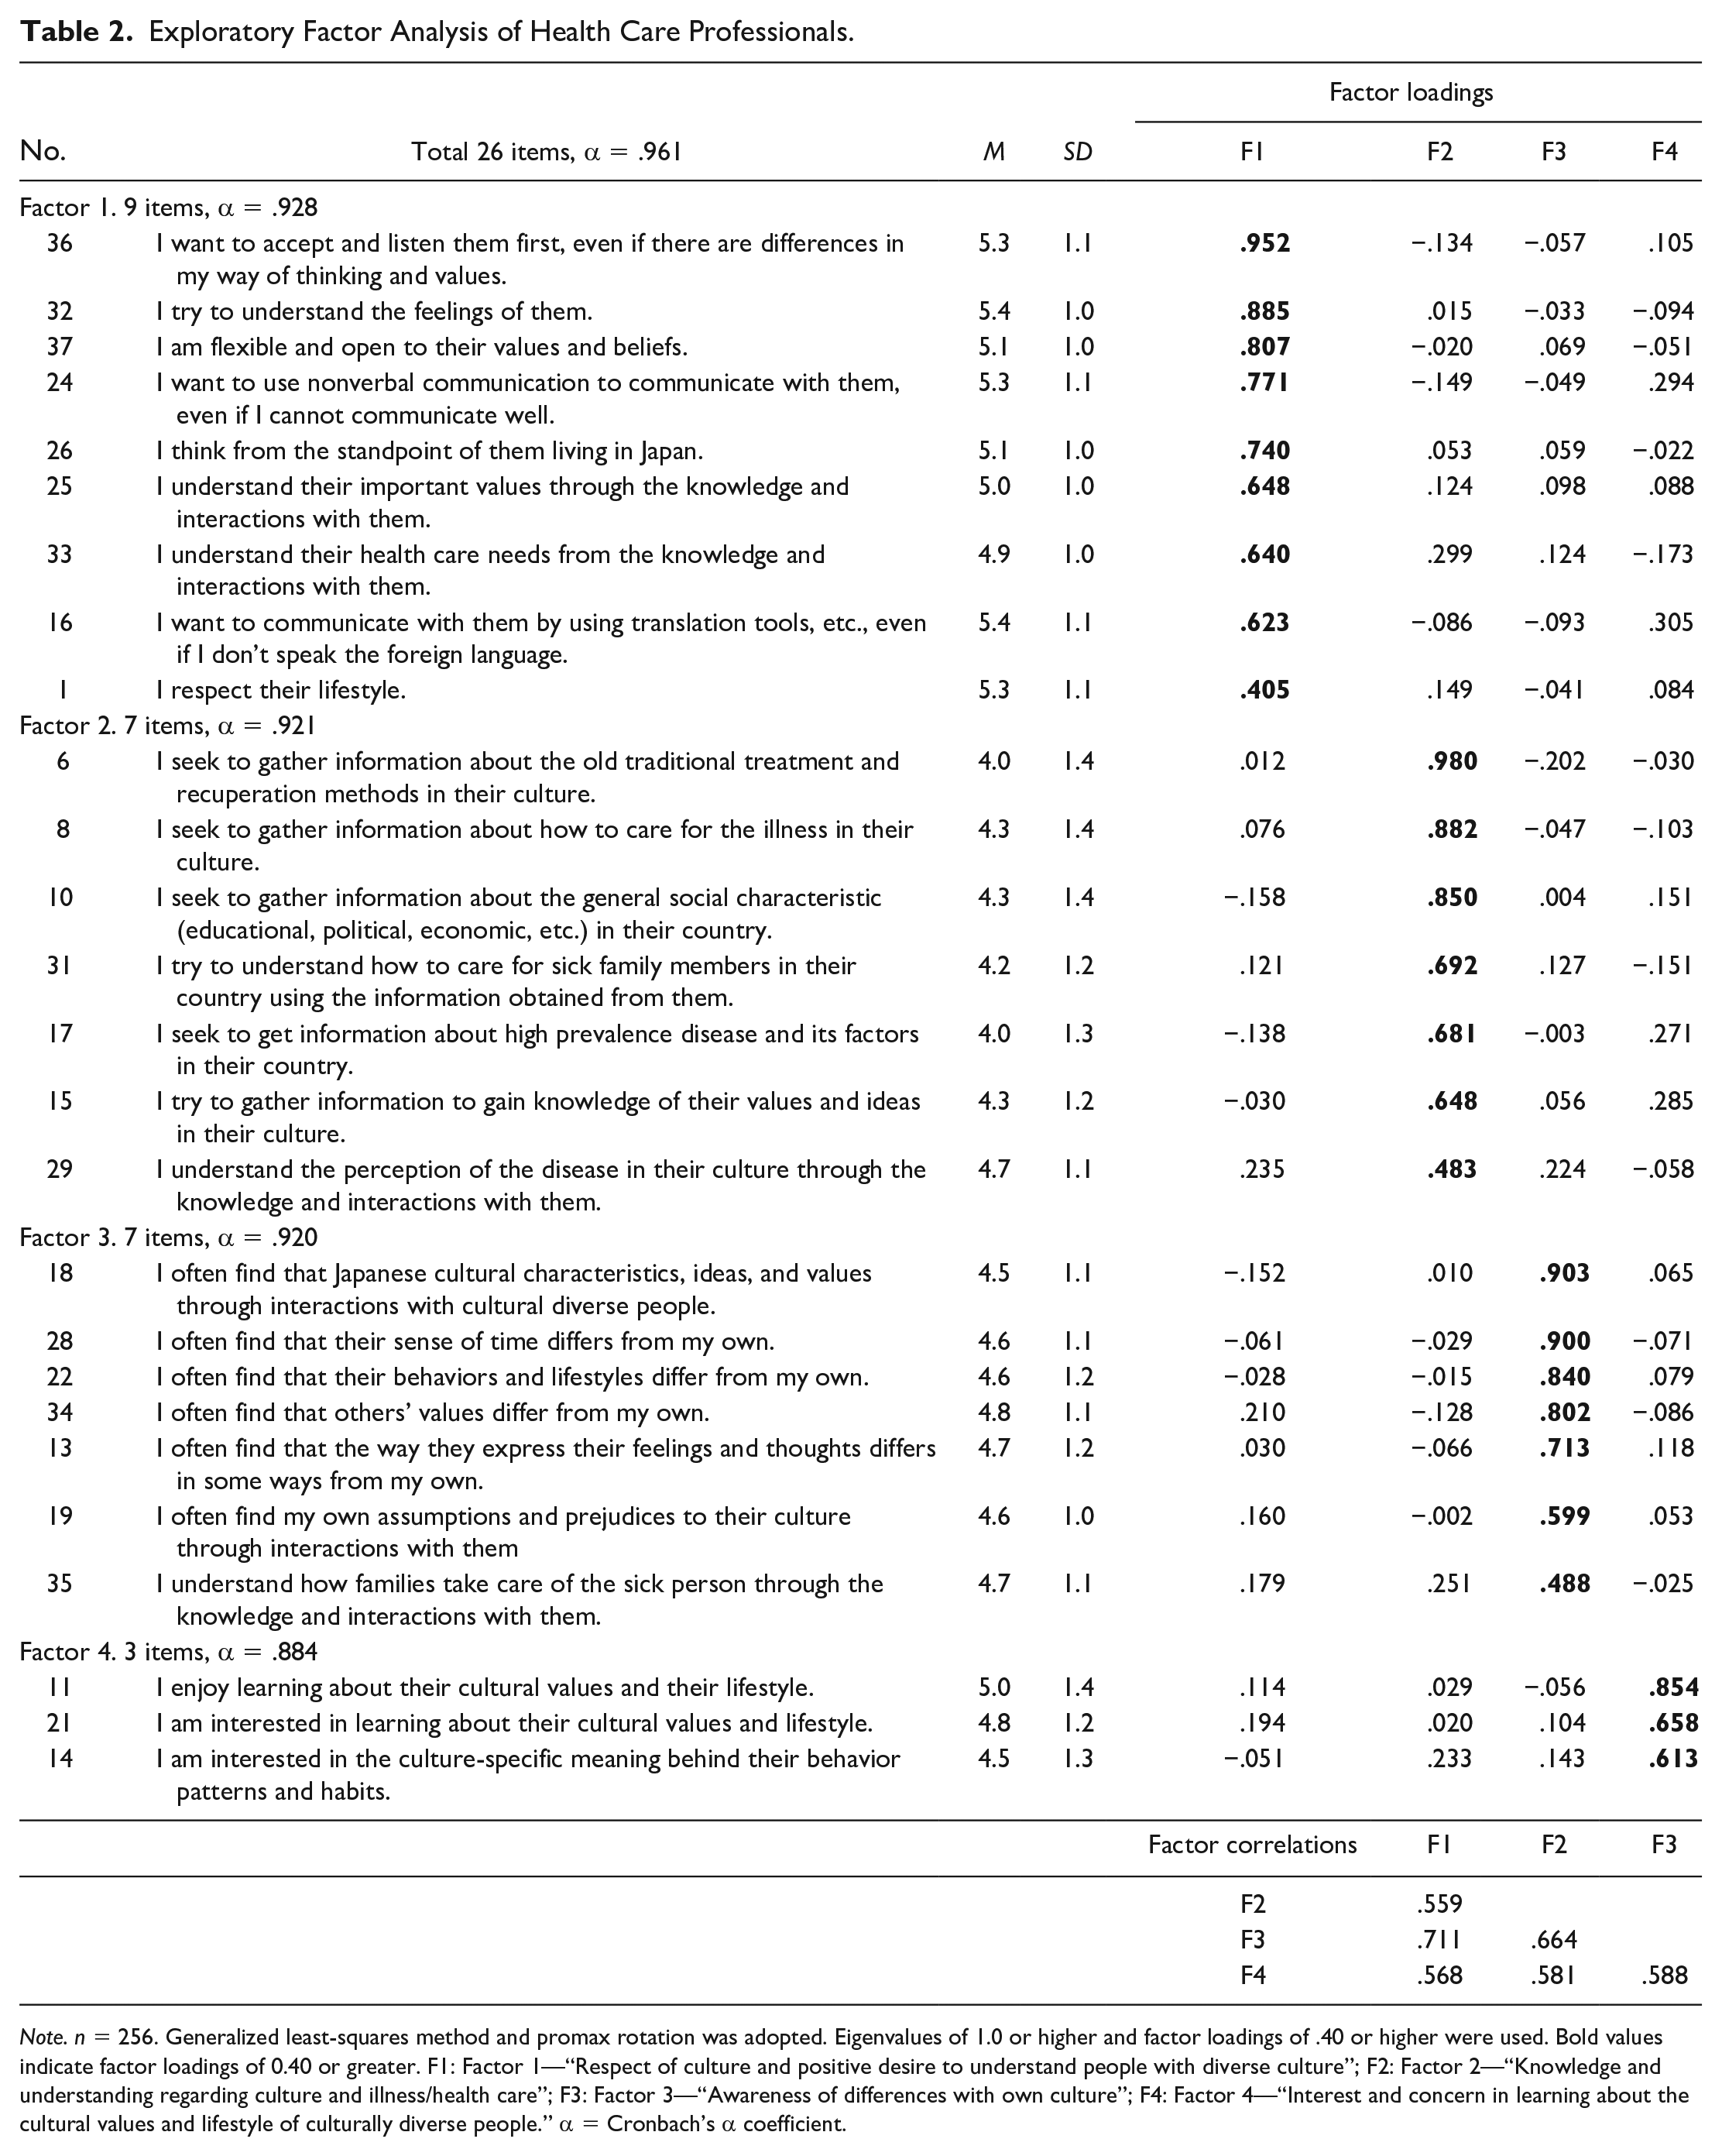
Note. n = 256. Generalized least-squares method and promax rotation was adopted. Eigenvalues of 1.0 or higher and factor loadings of .40 or higher were used. Bold values indicate factor loadings of 0.40 or greater. F1: Factor 1—“Respect of culture and positive desire to understand people with diverse culture”; F2: Factor 2—“Knowledge and understanding regarding culture and illness/health care”; F3: Factor 3—“Awareness of differences with own culture”; F4: Factor 4—“Interest and concern in learning about the cultural values and lifestyle of culturally diverse people.” α = Cronbach’s α coefficient.
Next, four factors were named as follows: (a) “respect of culture and positive desire to understand people with diverse culture,” (b) “knowledge and understanding regarding culture and illness/health care,” (c) “awareness of differences with own culture,” and (d) “interest and concern in learning about the cultural values and lifestyle of culturally diverse people.”
College Students
As with the HPs, an EFA for Subsample 1 of STs was conducted starting with the 37-item draft scale. 31 items with four factors were finally extracted. Because six items did not meet factor loading criteria, it was confirmed through discussion that the items were appropriate for deletion. Cronbach’s α coefficients were .938, .914, .886, and .866 for Factors 1, 2, 3, and 4, respectively, and .966 for the total of 31 items. Given that all coefficients were above .80, internal consistency reliability was confirmed (Table 3).
Exploratory Factor Analysis of College Students.
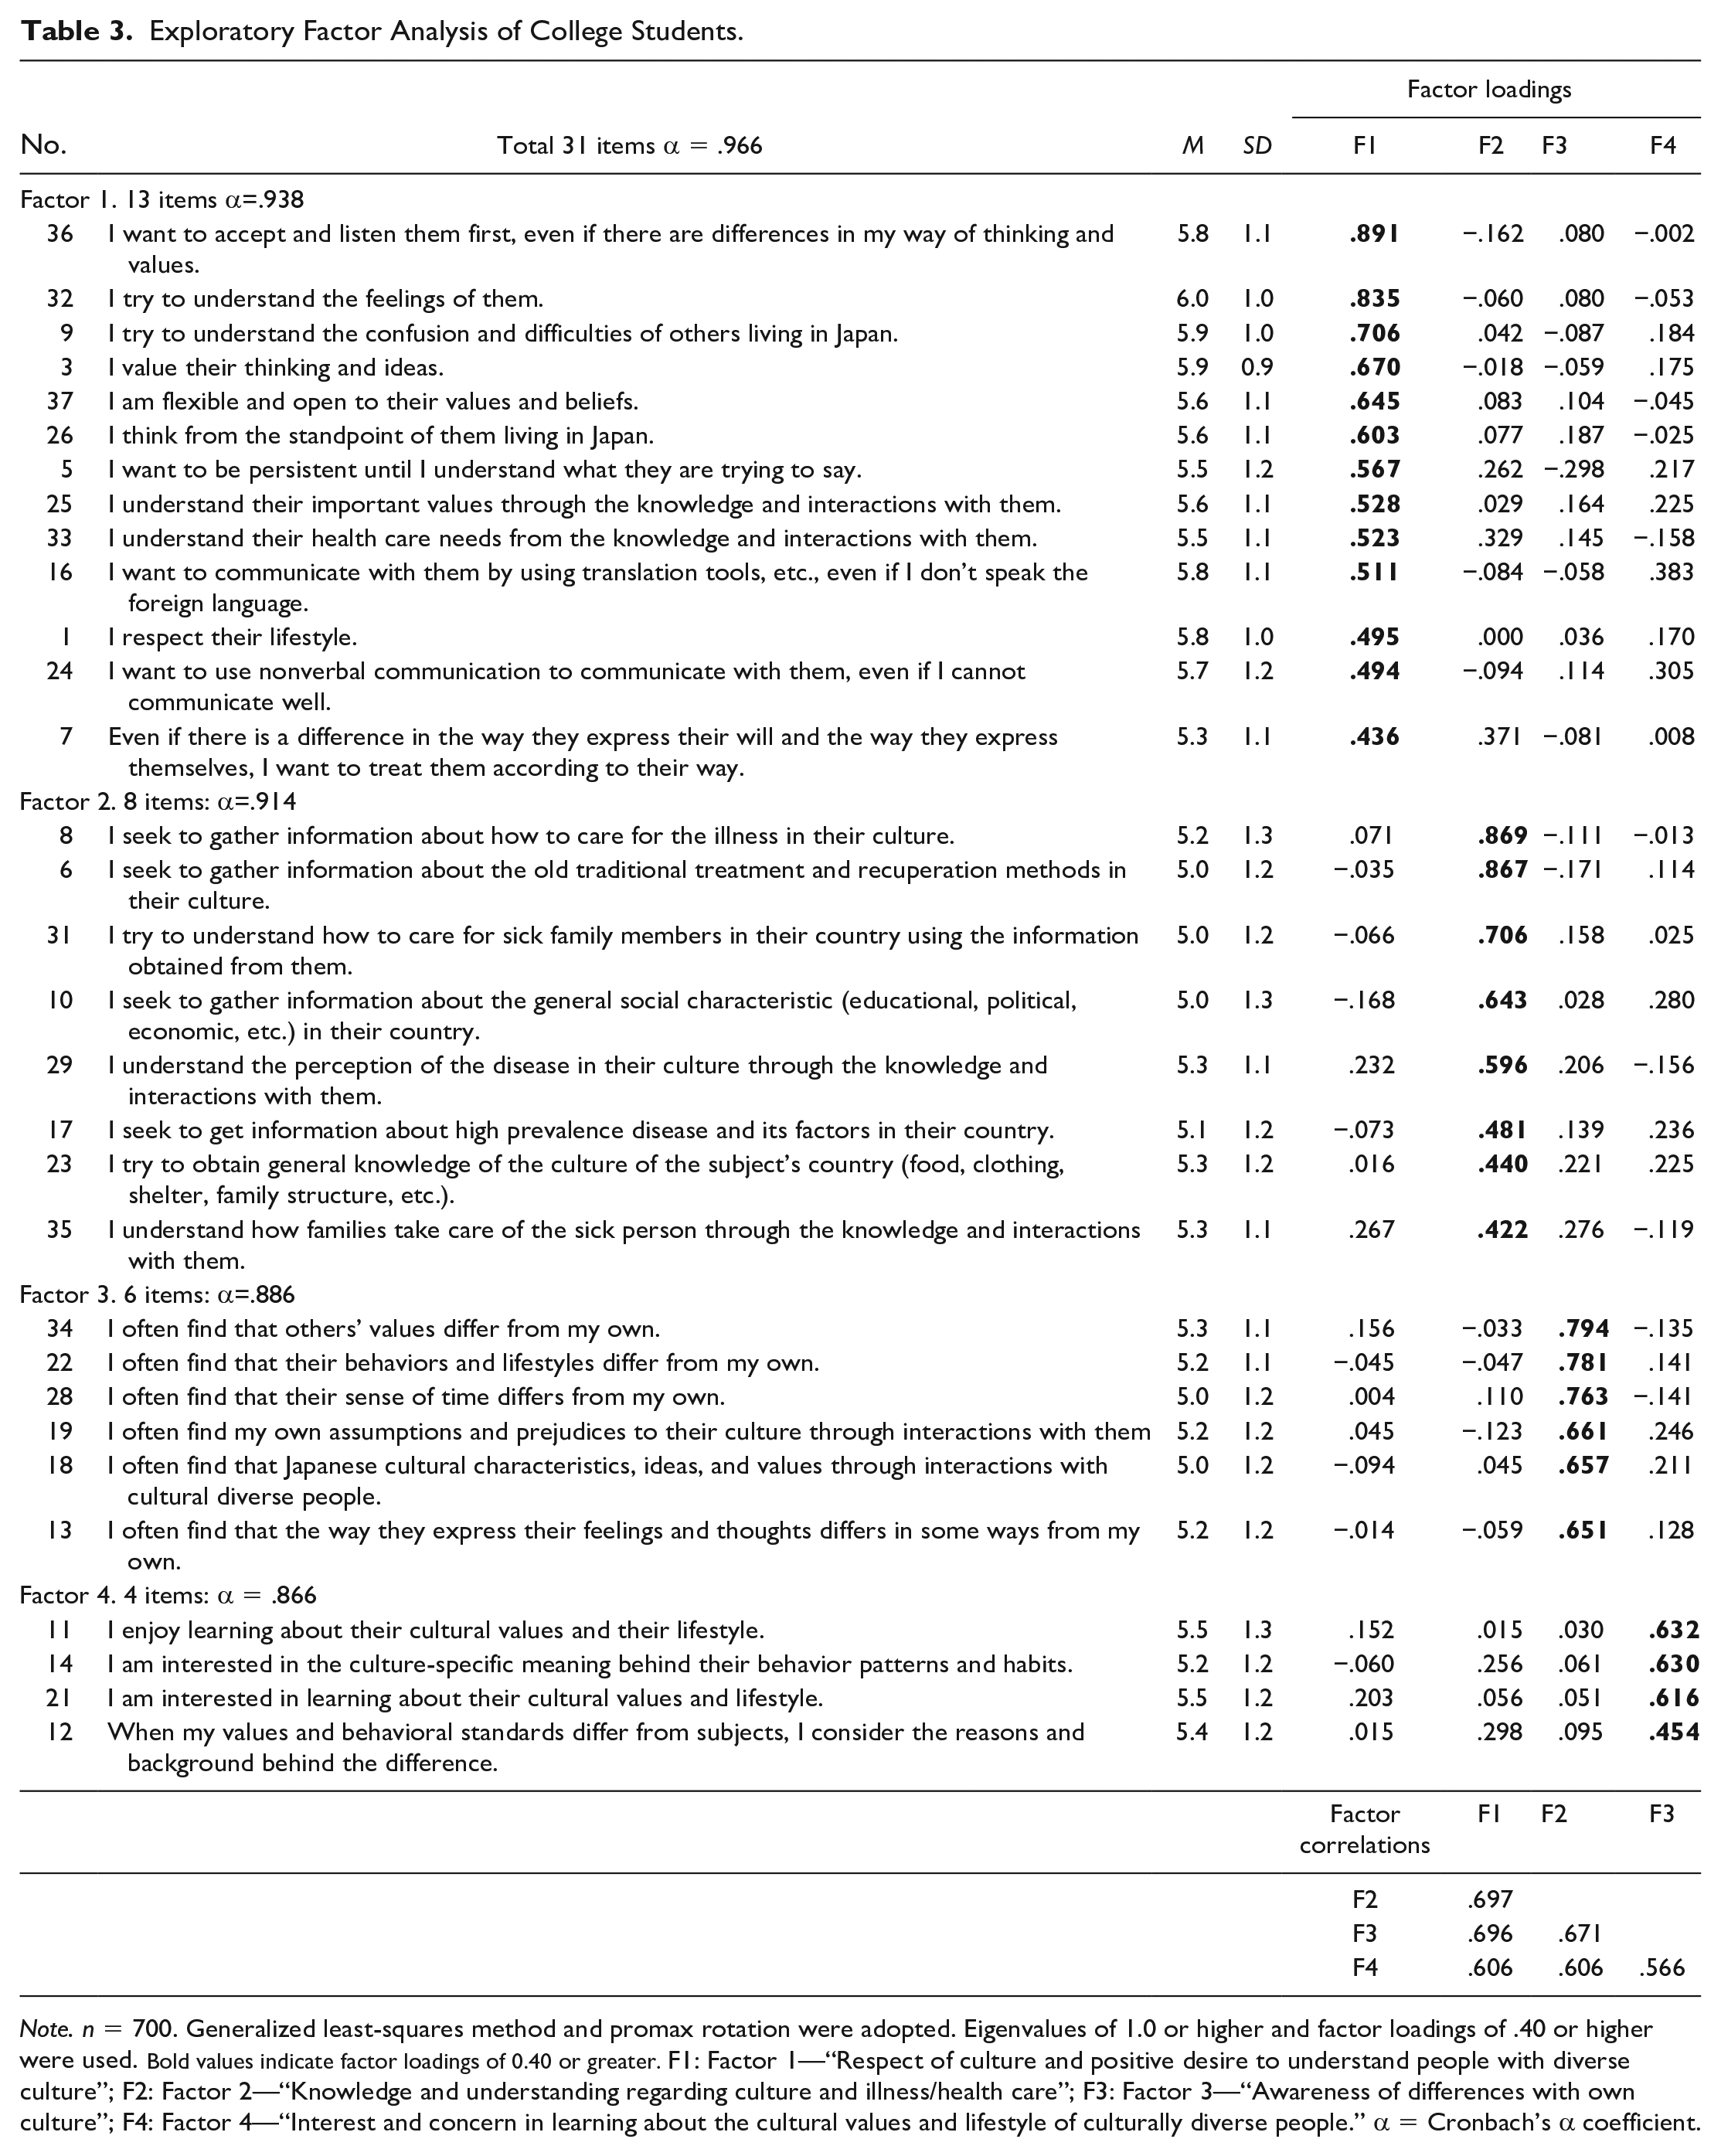
Note. n = 700. Generalized least-squares method and promax rotation were adopted. Eigenvalues of 1.0 or higher and factor loadings of .40 or higher were used. Bold values indicate factor loadings of 0.40 or greater. F1: Factor 1—“Respect of culture and positive desire to understand people with diverse culture”; F2: Factor 2—“Knowledge and understanding regarding culture and illness/health care”; F3: Factor 3—“Awareness of differences with own culture”; F4: Factor 4—“Interest and concern in learning about the cultural values and lifestyle of culturally diverse people.” α = Cronbach’s α coefficient.
Confirmatory Factor Analysis
CFA was conducted to validate the hypothesized model of latent factors and items determined by EFA and improve the model’s goodness of fit. We set up correlations of error and deleted some items based on correction and goodness-of-fit indices.
Confirmatory Factor Analysis for Health Care Professionals
Examining HP Subsample 2 (n=256), 18 items with four-factor model were ultimately confirmed. Fit indices were χ2/df = 2.067, CFI = .954 > .95, RMSEA =.065, and SRMR = .049 < .08, satisfying the criteria (Figure 2).
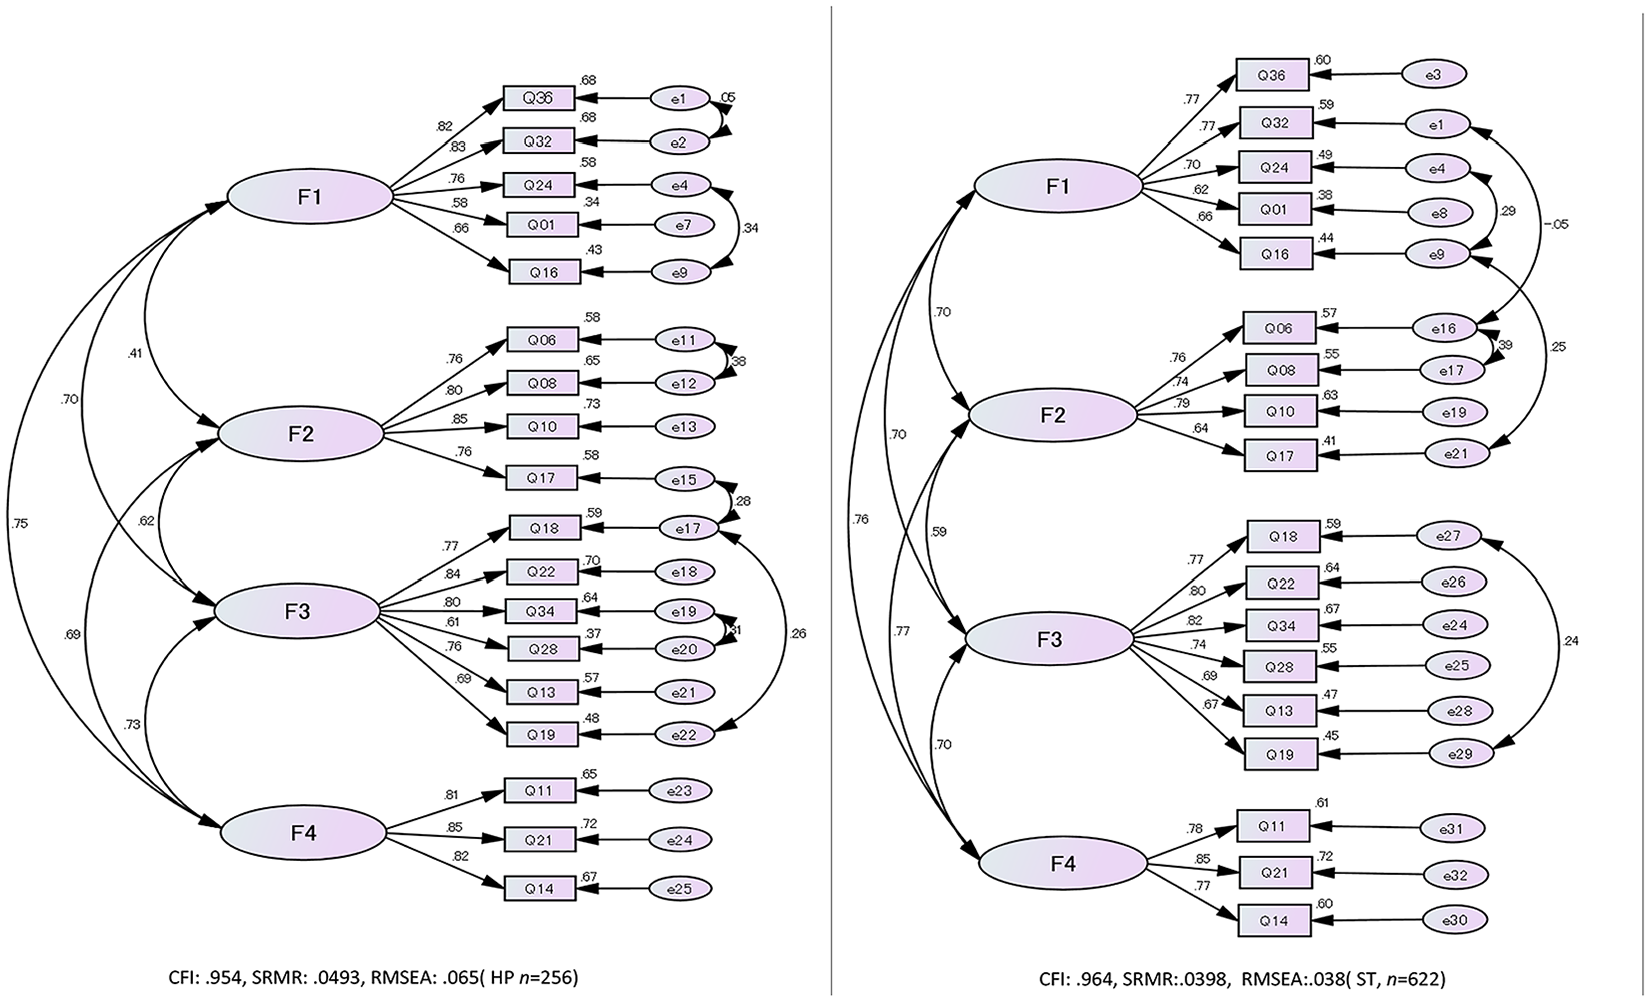
Path Diagrams for Confirmatory Factor Analyses
Confirmatory Factor Analysis for College Students
The results for ST Subsample 2 (n = 622) showed the same factor structure and items as for HPs and differed only in the location of the error correlations. Fit indices were χ2/df = 3.822, CFI =.964 > .95, RMSEA = .038 ≤ .06, and SRMR = .0398 < .08, satisfying the criteria (Figure 2).
Multi-Group Confirmatory Analysis
As the model structures for HPs and STs were the same except for the location of error correlations, we sought to determine which model could be adopted as a common model. When ST data (n= 622) were fed into the HP model, the goodness-of-fit indices declined slightly (χ2/df = 3.328, CFI = .953, RMSEA = .061, and SRMR = .0397). In contrast, when HP data (n = 256) were fed into the ST model, the goodness-of-fit index improved further (χ2/df = 3.453, CFI = .963, RMSEA = .039, and SRMR = .0467), signifying that the ST model could be designated as a common model for HPs and STs. Next, the MGCFA was performed to examine the difference in factor means between HPs and STs. The prerequisite for factor means analysis is that the common model has placement and measurement invariance. Measurement invariance assumes that factor patterns are equal across populations (Brown, 2015). The goodness-of-fit of placement invariance was RMSEA = .040 and measurement invariance was RMSEA = .038. Therefore, the applicability of the measurement invariance model was confirmed. In addition, it was confirmed that the ST model could be used as the common model. Factor mean estimates for STs were calculated by fixing the factor mean and the factor variance for HPs to 0 and 1, respectively. Results indicated that STs had higher factor means than HPs; the degree of difference using Cohen’s d effect size was moderate (Table 4).
Multi-Group Confirmatory Factor Analysis and Effect Sizes.
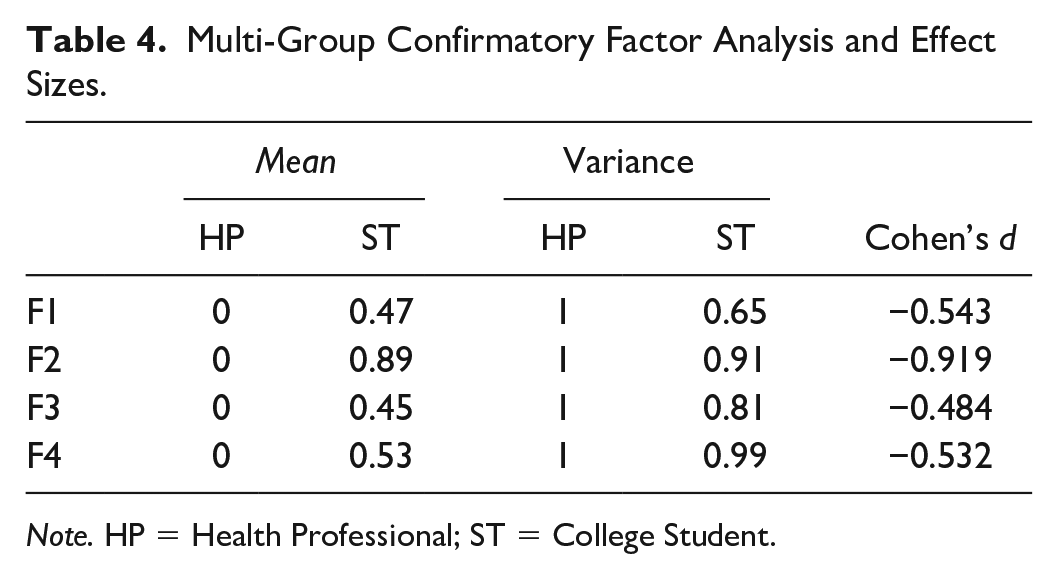
Note. HP = Health Professional; ST = College Student.
Reliability and Validity of the Final Cultural Sensitivity Scale
Internal Consistency
Cronbach’s α coefficient for the final CS scale was .937 for HPs (n = 515) and .934 for STs (n = 1,322). All factors for both HPs and STs were above .80, indicating sufficient internal consistency.
Convergent Validity
Contact With People From Diverse Cultures
HPs (n = 515): No significant difference was observed between the “yes” and “no” groups in the total score of the final CS scale for “experience living abroad for more than one year,” t(513) = 1.933, p= .054, d = 0.59. However, the “yes” group scored significantly higher than the “no” group in “proficiency in a foreign language at the level of daily life,” t(513) = 4.824, p < .001, d = 0.69.
STs (n = 1,322): The “yes” group scored significantly higher than the “no” group in “experience living abroad for more than one year,” t(1,320) = 2.186, p = .029, d = 0.20 and “proficiency in a foreign language at the level of daily life,” t(1,320) = 4.822, p < .001, d = 0.35 (Table 5).
Known-Group Analysis of the Total Score of the Final Cultural Sensitivity Scale.
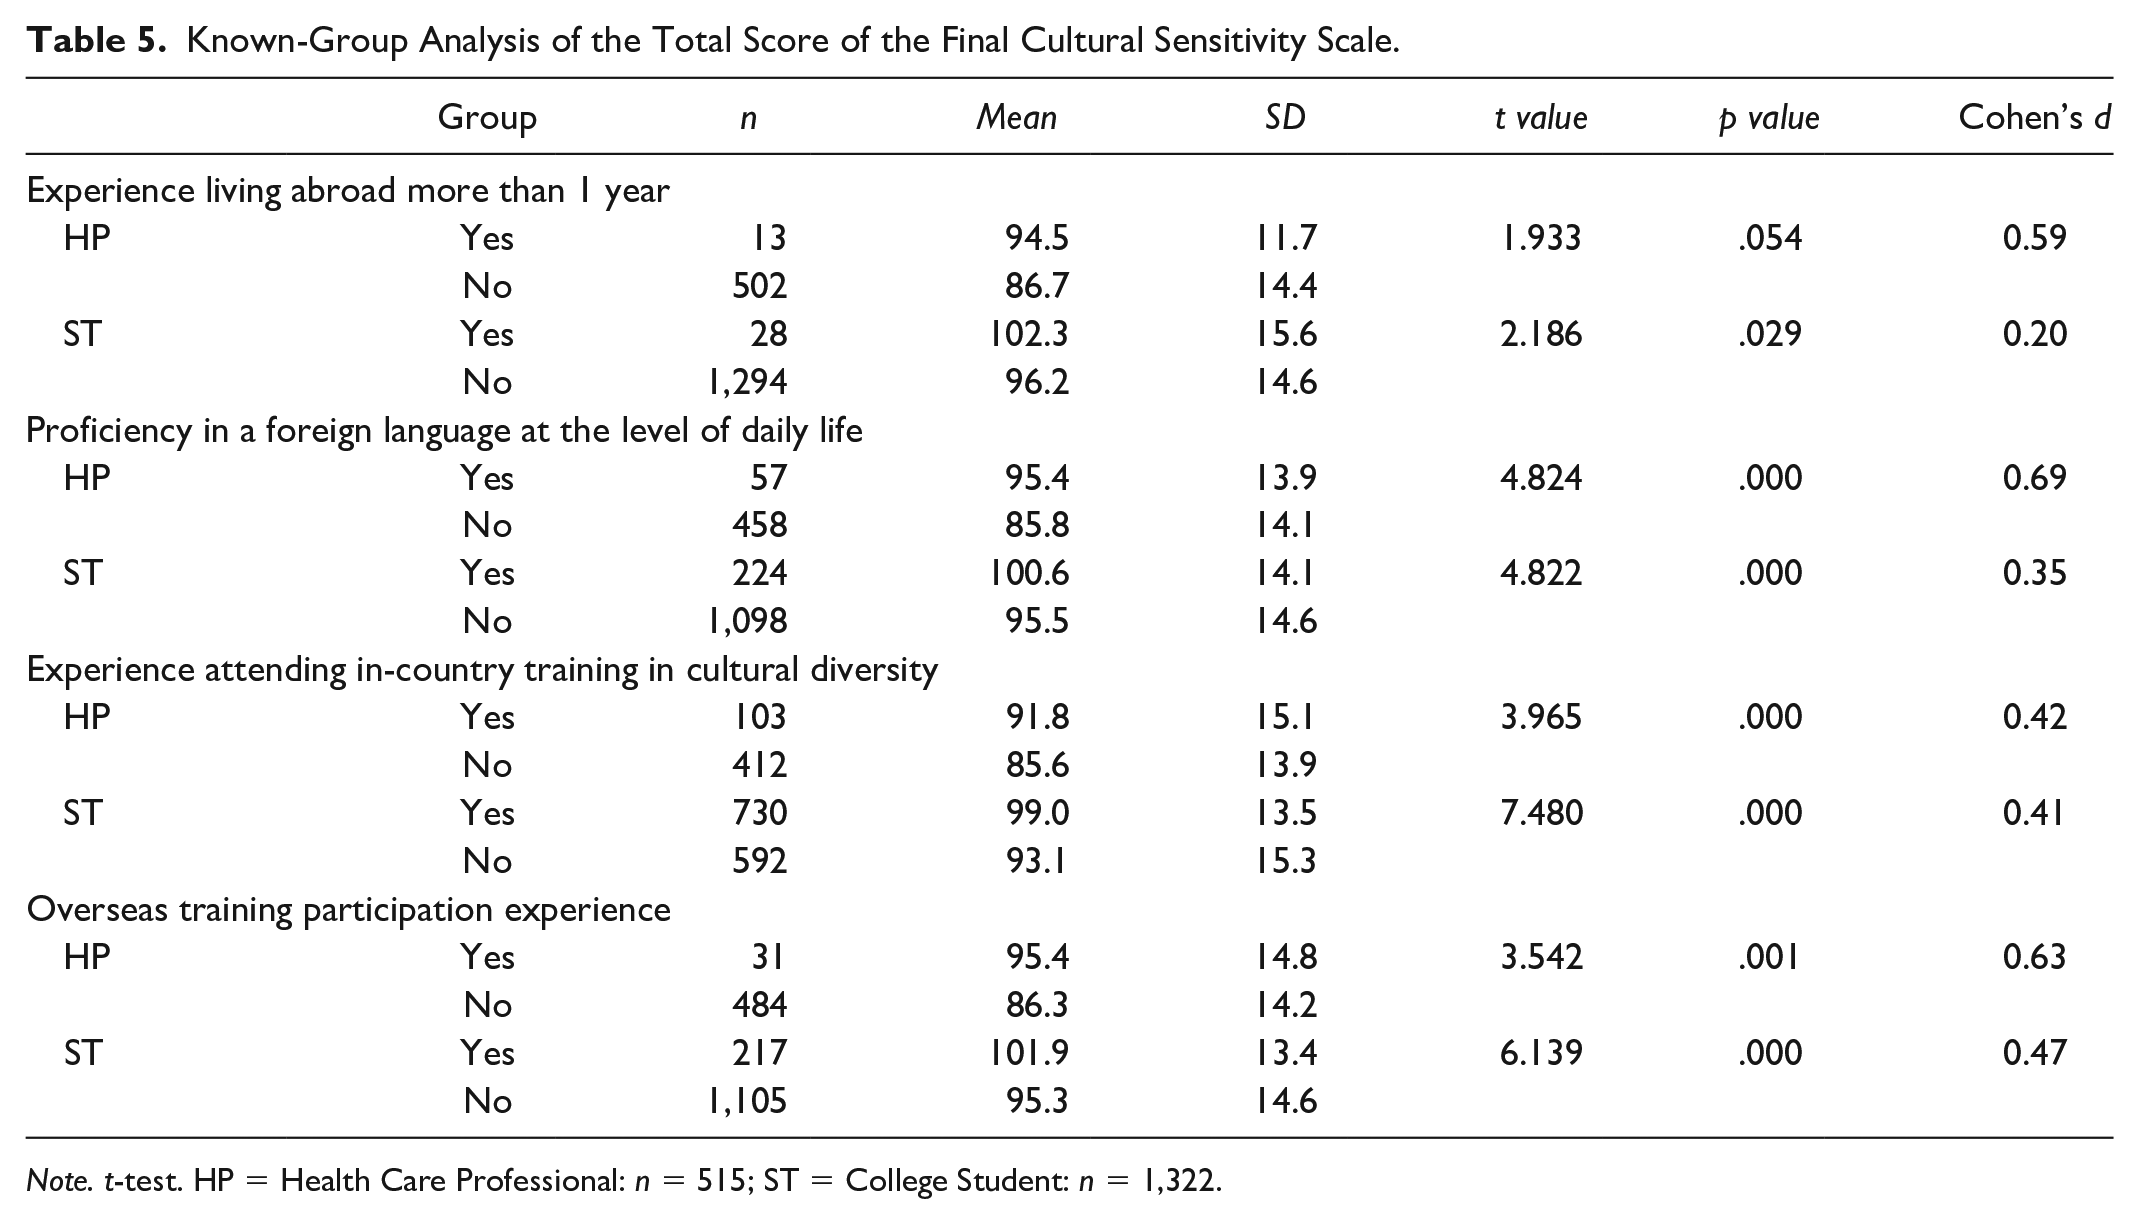
Note. t-test. HP = Health Care Professional: n = 515; ST = College Student: n = 1,322.
Experience in Education/Training on Cultural Diversity
HPs (n = 515): The “yes” group scored significantly higher than the “no” group in “experience attending in-country training in cultural diversity,” t(513) = 3.965, p < .001, d = 0.42, and “overseas training participation experience,” t(513) = 3.542, p < .001, d = 0.63.
STs (n = 1,322): The “yes” group scored significantly higher than the “no” group in “experience attending in-country training in cultural diversity,” t(1,320) = 7.480, p < .001, d = 0.41, and “overseas training participation experience,” t(1,320) = 6.139, p < .001, d = 0.47.
Therefore, groups with higher language ability, experience of living abroad, and experience of CS training scored moderately higher than groups with less language ability, no experience of living abroad, and no CS training (Table 5).
Awareness of Health Disparities Among Minorities With Diverse Cultures
A weak positive correlation was observed between both HPs and STs in “I am concerned for health issues of people from developing countries living in Japan” in the total score of the final scale (HPs: r = .303, n = 515, p < .01; STs: r = .294, n = 1,322, p < .01). The correlation was close to the criterion of .30 or higher (Table 6).
Correlation of Scores With the Perception of Health Disparities Among Minorities With Diverse Cultures.
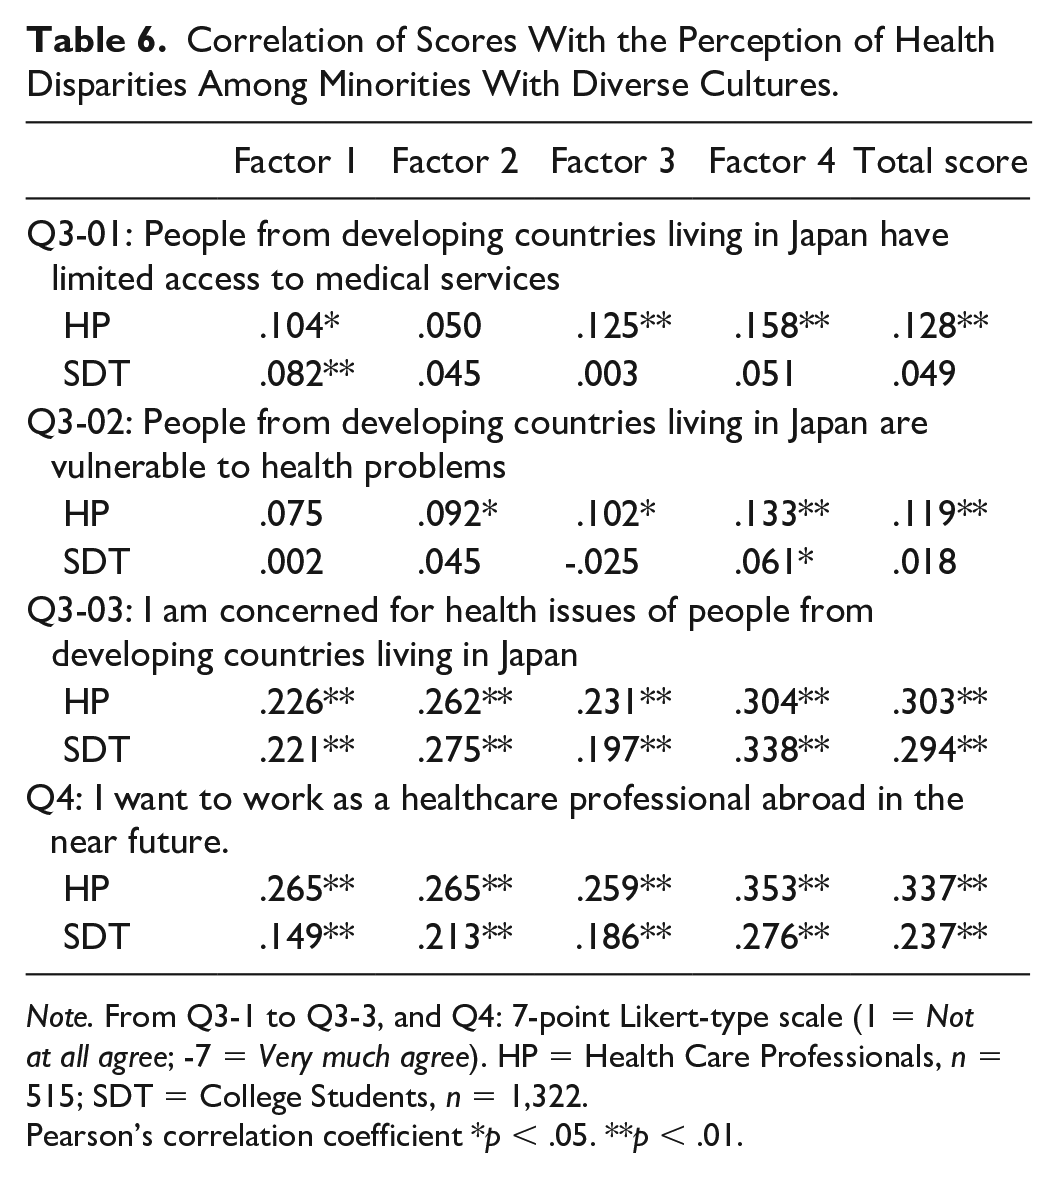
Note. From Q3-1 to Q3-3, and Q4: 7-point Likert-type scale (1 = Not at all agree; -7 = Very much agree). HP = Health Care Professionals, n = 515; SDT = College Students, n = 1,322.
Pearson’s correlation coefficient *p < .05. **p < .01.
Willingness to Work in a Foreign Country
Weak positive correlations were observed between HPs and STs in “Willingness to work in a foreign country” and the total score of the final scale (HPs: r = .337, n = 515, p < .01; STs: r = .237, n = 1,322, p < .01). The correlation among HPs met the criteria of .30 or higher (Table 6).
Criterion Validity
Japanese Version of the Intercultural Sensitivity Scale
HPs: The correlation coefficient between the subscale of the J-ISS and the final CS scale was .291 ≤ r ≤ .607 (p < .01), showing a weak-to-moderate positive correlation. However, F2 “Knowledge and understanding of culture and illness/health care” had a lower correlation coefficient than F1, F3, and F4.
STs: The correlation coefficient between the subscale of J-ISS and the final CS scale was .117 ≤ r ≤ .606 (p < .01), showing a weak-to-moderate positive correlation. As with HPs, F2 had lower correlation coefficients than the other three factors (Table 7).
Examination of Criterion-Related Validity.
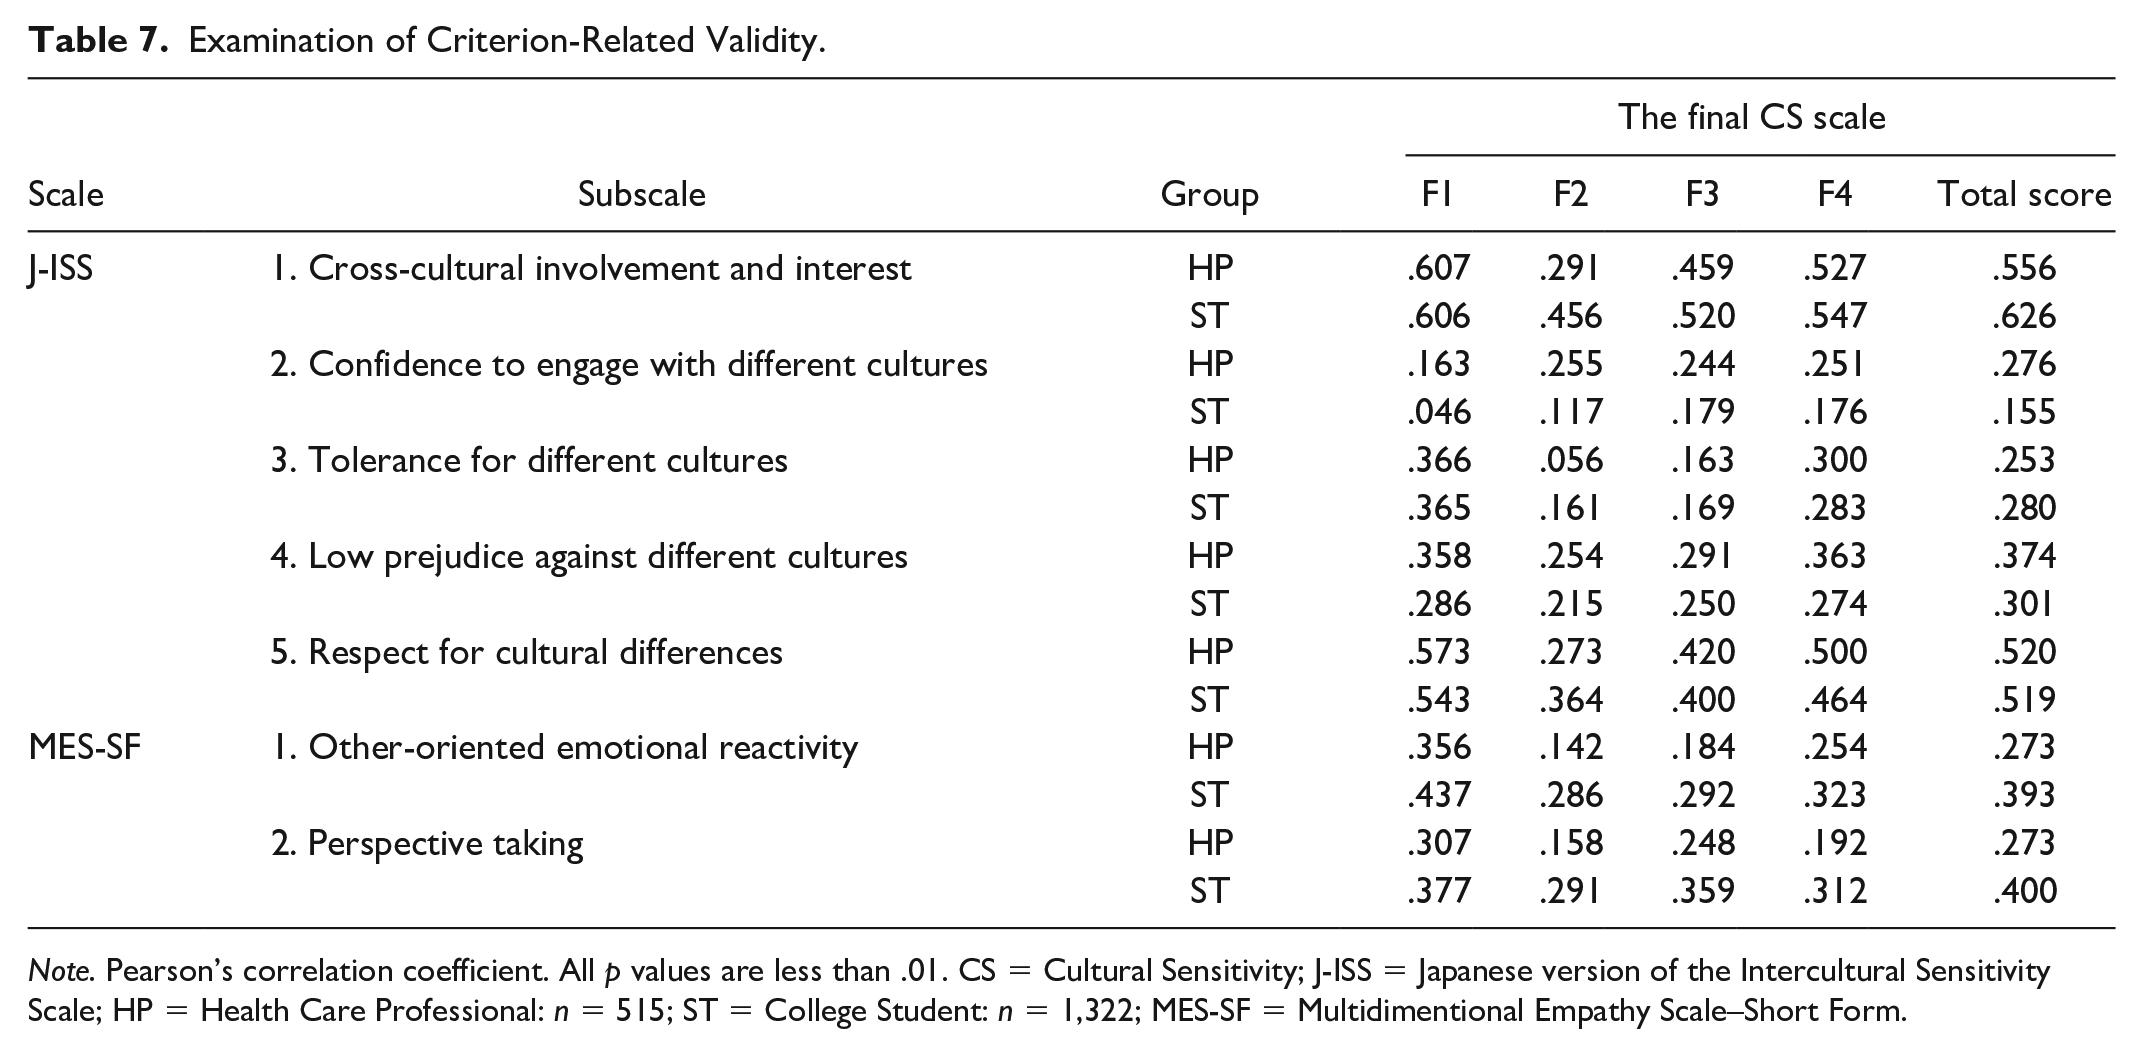
Note. Pearson’s correlation coefficient. All p values are less than .01. CS = Cultural Sensitivity; J-ISS = Japanese version of the Intercultural Sensitivity Scale; HP = Health Care Professional: n = 515; ST = College Student: n = 1,322; MES-SF = Multidimentional Empathy Scale–Short Form.
Multidimensional Empathy Scale–Short Form
The relationship between “perspective-taking”—which refers to the “other-oriented cognitive tendency to put oneself in the position of others”—and “other-oriented reactions (empathic concern)”—which refers to “other-oriented feelings such as sympathy and concern for others”—in the MES-SH and the subscale of the final CS scale was examined. Weak positive correlations were observed between F1 “respect of culture and positive desire to understand people with diverse culture” and “other-oriented emotional reactivity” of the MES-SH (r = .356, p < .01) and “perspective taking” of the MES-SH (r = .307, p < .01). F2 had a lower correlation with “other-oriented emotional reactivity” and “perspective-taking” than F1, F3, and F4.
STs: STs exhibited results similar to those of HPs (Table 7).
Test–Retest Reliability
Sample Characteristics
The HP group had 132 participants; physicians were the largest group with 59 (44.7%) participants. The ST group had 107 participants; pharmacy students were the predominant group with 36 (33.6%) participants (Table 1).
Intraclass Correlation Coefficient
The ICC (2.1) was r = .642, 95% confidence interval [CI]: [.530, .732] for HPs and r = .722, 95% CI [.618, .802] for STs.
Discussion
Sample
According to the COSMIN Risk of Bias checklist, the sample size required for factor analysis is seven times the number of items and at least 100 items (Mokkink, 2018). In our study, a sufficient number of participants was obtained and these criteria were met. In addition, the sample size required for ICC (2.1) was sufficient to verify the reproducibility of the common CS scale.
Construct Validity
Two scales—the J-ISS and the MES-SH—were used to examine criterion-related validity: a weak-to-moderate positive correlation was observed between the J-ISS and the final CS subscales among HPs (.163 ≤ r ≤ .607) and STs (.117 ≤ r ≤ .606). Although these values were below our criterion value of .70, we were able to demonstrate some positive association with the criterion scale.
It should be noted that F2 (“knowledge and understanding regarding culture and illness/health care”) of this scale had a lower correlation coefficient with the J-ISS subscale than F1, F3, and F4. F2 consists of elements that are needed by HPs to help patients recover from their illnesses and improve their level of health. While F2 is a unique factor characteristic of HPs, the J-ISS subscale does not include a health-related component. Therefore, the lower correlation coefficient between the F2 and J-ISS subscales is a reasonable result that indicates discriminant validity.
In the comparison between the MES-SF and this scale, two of the five subscales of the MES-SF—the “other-oriented response (empathic concern),” which means putting oneself in the position of others and “perspective taking” as its cognitive tendency—were used to examine the construct validity of the final CS scale. The correlations between the two subscales of the ME-SF and the subscale of the final CS scale were weak (HPs: .142≤ r ≤ −.356; STs: .291 ≤ r ≤ −.437) for both HPs and STs. Correlations did not meet our criterion of r = .70; however, as with the J-ISS, a certain level of relevance was identified. Focusing on F2, an HP-specific subscale of the final CS scale, the correlation coefficient was lower than that of the other factors. This result further implies that the final CS scale adequately reflected the characteristics of HPs. Based on the examination of these two scales, the final CS scale was confirmed to have criterion-relevant and discriminant validity.
In the known-groups analysis, the mean scores were significantly higher for the groups that had contact with people from different cultures and had received education/training on cultural diversity than for the group that had not received such education/training. This result confirms our hypothesis that the final CS score is higher for individuals with experience in cross-cultural contact and cultural diversity education/training. In addition, positive correlations were observed between the level of interest in the health issues of foreigners from developing countries in Japan and a willingness to work abroad and the total score of the final CS scale. This further confirms our hypothesis that experience regarding CS antecedent increases CS scores. Based on the above, we concluded that the final CS scale has construct validity.
Common Model and Factor Mean Scores
First, latent factors in an exploratory factor analysis of the HP and ST populations were extracted and then a CFA was performed to test a hypothetical model of the CS scale’s factor structure. In this study, we performed EFA and CFA on different samples by creating two subsamples, referring to a previous study (Lee et al., 2022; Şimşek et al., 2023). Although previous studies performed EFA and CFA on the same sample for scale development, we believe that the use of two samples in this study was an appropriate way to increase the accuracy in confirming the hypothesized model with CFA (Mokkink et al., 2018). The results of the CFA showed that the HP and ST models had the same four factors and 18 items as latent factors and items, with the only difference being the site of error correlation.
In the MGCFA, the ST model was confirmed to have placement invariance (RMSEA = .040) and measurement invariance (RMSEA = .039) for the two populations (HPs and STs), signifying that statistically, the ST model could be considered a common model for HPs and STs.
The MGCFA indicated higher scores for each factor among STs than among HPs. At the time the study was initiated, it had been predicted that HPs’ clinical experience would result in higher mean scores for HPs than for STs on the “CS of HPs” factor. However, that hypothesis was not confirmed. Two possible reasons for this result are the influence of clinical experience on self-evaluation and the self-evaluation nature of the scale. Previous studies have reported that although HPs wished to provide culturally sensitive care to foreigners, they were confused and were often unable to provide care as they wished (Nishikawa et al., 2021). Therefore, it can be inferred that some HPs in the study were unable to provide the care that they would have liked to patients with different cultural and linguistic backgrounds and that their experiences may have influenced their answers to study questions. Among all HPs in this study, approximately 44% provided care to one to two foreign patients monthly; therefore, these HPs had only occasional contact with foreign patients.
In contrast, STs have less experience in clinical practice; therefore, STs are unable to estimate their skills in caring for foreign patients. ST scores may have been higher because of the social desirability bias of “wanting to do it this way.” Furthermore, the high self-assessment of skills by those with immature skills is called the Dunning–Kruger effect, which refers to having insufficient metacognitive skills to accurately assess one’s own abilities (Bradley et al., 2022).
Although this study provides a final CS scale for HPs and STs, based on the above discussion, it is believed that the comparison of CS scores between HPs and STs using the scale is inappropriate given their different experiences in clinical practice. When the CS level is evaluated on an individual basis, percentile reference values must be used to determine where individual CS scores stand within each group. For each group in this study, a separate table (available separately) of percentile reference values was created. Such a table is expected to be useful in understanding the position of the individual in the overall population. It is believed that percentile reference values must be adjusted periodically based on the society’s degree of diversity and the target population for which the scale is used.
Reliability
Test–retest reliability provided an ICC (2.1) of HPs and STs. A meta-analysis of retest reliability coefficients in psychological scales by Oshio (2016) showed that the 95% CI for ICC was .69 ≤ r ≤ .86 for test–retest periods of up to 4 weeks, .59 ≤ r ≤ .81 for 10 or more items, and .64 ≤ r ≤ .89 for 100 to 199 items surveyed. The ICC for HPs in this study was slightly lower than that in the meta-analysis but was within Oshio’s ICC range. Therefore, we believe that the scale has a certain degree of reliability.
The possible reasons why the ICC for health care professionals was lower than .70 which set as a criterion for reliability in this study are discussed here. In addition to memory issues, it cannot be ruled out the possibility that additional CS-related experiences occurred between the first and second tests, such as the opportunity to interact with people from diverse cultures or to gain cross-cultural knowledge. We believe that this is partly due to the fact that we did not ask participants about their CS-related experiences in the second test; thus, we were not able to eliminate factors that might have influenced answers. There is a need for additional methods to reduce these biases and for further confirmation of test–retest reliability.
In-service training programs are known to be effective in increasing CS among HPs. To develop a training program, assessing the readiness of the target population is important. This scale could contribute to determining trainee readiness, guide training program design, and help measure the effectiveness of training programs in Japan. Many Japanese universities offer short-term overseas training programs for students to allow students to expand their horizons and learn about diverse cultures. Using our scale to evaluate these programs could provide objective information from the viewpoint of “CS to ensure preparedness as a health professional.”
Limitations
Study limitations were the subject bias and a test–retest reliability that was lower than the criterion correlation coefficient value in this study.
In this study, nurses accounted for more than 80% of HPs by job category in Phase 2. In general, nurses represent by far the largest proportion of health care personnel in hospitals; this composition of the hospital’s HP workforce affected study results. In the ST sample, medical students could not be included in Phase 2. Continued use of the survey across representative ST populations is required to reduce sample bias in further studies.
As the purpose of the study was to develop a scale, we did not examine issues in the practical use of the CS scale. Therefore, analyzing and improving the scale through repeated use is needed to increase its practicality. Despite these limitations, we believe that this study is original and novel because it is the first to develop a scale that measures “the CS of HPs” and that can be used by both HPs and STs in Japan.
Conclusion
The “Cultural Sensitivity of Health Care Providers” scale is a four-factor, 18-item structural model that was validated with an MGCFA for use with HPs and STs.
The final CS scale has a certain degree of reliability and construct validity.
Supplemental Material
sj-xlsx-3-tcn-10.1177_10436596231217688 – Supplemental material for The Development and Psychometric Testing of the Scale of Cultural Sensitivity of Health Care Professionals in Japan
Supplemental material, sj-xlsx-3-tcn-10.1177_10436596231217688 for The Development and Psychometric Testing of the Scale of Cultural Sensitivity of Health Care Professionals in Japan by Hiroko Tanaka and Mikako Arakida in Journal of Transcultural Nursing
Footnotes
Acknowledgements
We would like to express our sincere gratitude to all those who contributed to this study.
Declaration of Conflicting Interests
The author(s) declared no potential conflicts of interest with respect to the research, authorship, and/or publication of this article.
Funding
The author(s) disclosed receipt of the following financial support for the research, authorship, and/or publication of this article: This study was supported by Grant-in-Aid for Scientific Research, JSPS KAKENHI, Grant Number JP17K12140.
Supplemental Material
Supplemental material for this article is available online.
References
Supplementary Material
Please find the following supplemental material available below.
For Open Access articles published under a Creative Commons License, all supplemental material carries the same license as the article it is associated with.
For non-Open Access articles published, all supplemental material carries a non-exclusive license, and permission requests for re-use of supplemental material or any part of supplemental material shall be sent directly to the copyright owner as specified in the copyright notice associated with the article.