
Abstract
Whilst the properties of decision regret have been widely explored in experimental and game theoretic studies, the empirical features of regret from large-scale ‘binary decision’ national events in practice have garnered less scrutiny. This study is an empirical investigation of novel survey data reporting ‘Brexit’ voting choices and expressions of a desire to change voting choices post-referendum. We investigate if Leave voters are more or less likely to express a change to their binary referendum vote choice than those who voted Remain or abstained and then identify the particular characteristics of those who regret their vote choice. A large-scale pan-European survey is used to capture citizens’ perceptions of the European Union containing 17,147 interviews of adults from 15 EU member states. Using responses from UK citizens (n = 1500), focus is directed to the vote choice for the ‘Brexit’ referendum and the corresponding choice if the referendum were held ‘today’. Probit regression estimation identifies the key differences in the characteristics of those who expressed regret by indicating a desire to change voting choices. Results show that knowledge of EU funding policies, permanence of residential location, population size of the local area, educational attainment, employment status and income are key drivers for regretting the referendum voting decision.
Introduction and context
The properties of decision regret have been widely explored in experimental and game theoretic work (see, e.g. Schlag and Zapechelnyuk, 2012; Sautua, 2017). The empirical features and properties of regret from large-scale ‘binary decision’ national events in practice have garnered less scrutiny. In the United Kingdom on 23rd June 2016, an advisory binary referendum took place on the question of whether the country should remain or leave the European Union (EU). The results were very close and comprised 51.89% voting to leave the EU and 48.11% to remain in the EU. The turnout was 72.21% of the electorate. Much popular media narrative and follow up polls indicated that the vote outcome would likely have been reversed just a few weeks later (Bol et al., 2018).
That a large number of people regretted their initial decision is potentially significant in terms of garnering public support in the Brexit negotiation process and for various deal outcomes. This study does not dwell on the multitude of reasons considered to have led to so many to vote leave (see, e.g. Abrams and Travaglino, 2018; Curtice, 2016, 2017; Goodwin and Heath, 2016; Meleady et al., 2017). Nor does it focus on the systemic political and institutional repercussions arising from Brexit (see, e.g. Caporaso, 2018; Moravcsik, 2018). Instead, it focusses on empirical findings from an analysis of UK citizens questioned within a large Pan-European survey about attitudes to various EU policies (Bauhr and Charron, 2020).
That UK sub-sample were additionally asked about their vote in the 2016 referendum and what would they vote if the referendum were held ‘today’. In this way, those who changed their mind and regretted their decision could be identified and their general characteristics discerned. This novel data allows us to investigate if Leave voters are more or less likely to express a change to their binary referendum vote choice than those who voted Remain or abstained from voting. We are then able to identify the particular characteristics of those who regret their vote choice.
These characteristics are explored by regression analysis and by means of statistical disaggregation displayed visually in a series of charts. Results show that the characteristics of those more likely to regret their voting decision are those who have less knowledge of the major EU policy funding streams, have lived in the same area for a shorter period of time, live in a less populated area, have lower educational attainment, are unemployed and earn a low income.
The next section briefly sets in context the analysis of vote choice regret to help guide the commentary on the statistical analysis of regret that is later unfolded. Section 3 sets out the data and methodology underpinning the study. The following section then presents and discusses the results emerging from the statistical analysis. A summary and concluding remarks are offered in the final section.
Vote regret in retrospect
The literature providing analyses of voting is vast, both in theoretical and empirical terms (see, for examples of some surveys, Giordani et al., 2010; Lewis-Beck and Stegmaier, 2007, 2013; Nannestad and Paldam, 1994; Paldam, 1981). More recently, attention has been drawn to the role of both instrumental and expressive voting in elections or combinations of both motivations. Bol et al. (2018) develop a ‘mixed utility’ theory of vote choice regret to apply in the context of multiple party elections. For them, voter utilities stem from a mix of ‘expressive’ voting (how much the voter likes the party they voted for) and ‘instrumental’ voting (how much the vote makes a difference to the party that is elected). In ‘pure’ expressive voting, less account might be taken of the probability of winning (Drinkwater and Jennings, 2007). In ‘pure’ instrumental voting there is some mental calculation of the probability of a given party winning the election, such that they can attempt to influence which party wins. It is also argued that expressive voters may take the probability of winning into account if the individual voters are pivotal to the outcome (Brennan and Hamlin, 1998).
For instrumental and mixed utility voters, who are partly expressive and partly instrumental, regret can emerge from poorly calculating the probability of electoral success. Clearly, in the context of a binary referendum with few precedents and on issues that cut across political party lines, the likelihood of not accurately calculating the probability of a particular given referendum outcome is arguably even greater than for multi-party political elections. In these circumstances, centring on an ostensibly binary decision matter, more expressive voting could be posited as more likely to feature in an individual voter’s decision process.
As formal theories of regret, Savage (1951) and Loomes and Sugden (1982) may well offer lenses to examine Brexit vote regret. However, this paper is an empirical investigation about regret at an intuitive level, which is captured by the voting decision changes when new information is received. As such, there is no fundamental requirement for a theoretical underpinning of regret beyond the calculation of the loss from not choosing the best response. In a nutshell, did binary referendum voters anticipate regret and accordingly take account of it in their referendum choice in their desire to eliminate or minimise the possibility? Specifically, are Leave voters less likely to express a change to their binary referendum vote choice than those who voted Remain or those who abstained from voting? If so, what are the particular income and demographic characteristics of those who regret their vote choice?
Data
Use is made of a dataset built from a large-scale pan European survey conducted by Bauhr and Charron (2020) to capture citizens’ perceptions of the European Union. 1 The sample includes 17,147 interviews of adults from 15 EU member states, who were contacted randomly via telephone in the local language. The dataset includes demographic information on gender, age, education, time lived in residence, population, income and employment. The two questions that are of interest to us were collected from UK citizens only, receiving 1500 responses:
Q1. What did you vote in the BREXIT referendum?
Q2. If the referendum were held today, how would you vote?
In the following analysis, a change of voting decision between Q1 and Q2 is intuitively used to measure regret. In this sense, regret is the amount that someone wishes to change their voting decision when receiving more information. A full description of the survey sample and the weights used are detailed in Bauhr and Charron (2020). In summary, interviews were conducted by telephone calls to households during the summer of 2017, approximately 1 year on from the referendum. Respondents were randomly drawn and are selected by the ‘next birthday’ method within the household. To compensate for demographic over/under-representation, weights based on age and gender were constructed by comparing the sample to statistics from Eurostat. Table 1 shows the sample distribution:
Sample responses to ‘What did you vote in the BREXIT referendum?’.
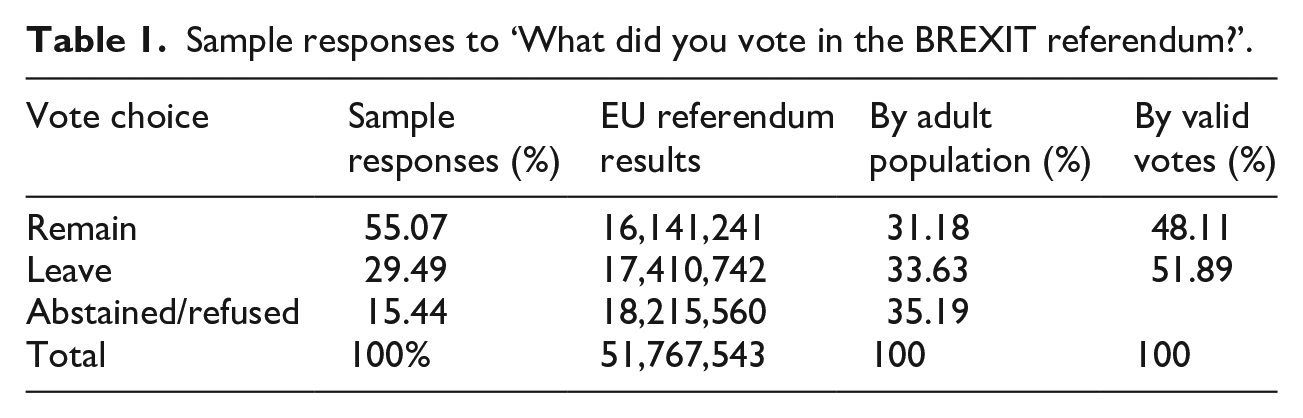
Notably, the UK survey more heavily samples citizens voting to Remain. As such, we use the results from the EU referendum 2016 to add to the existing demographic and regional weights in the following manner. The EU referendum turnout (of valid votes) was 33,551,983 (16,141,241 remain and 17,410,742 leave), which is 64.8% of the UK voting age population (51,767,543 from the Office for National Statistics 2016 mid-year population estimates). Weighting the remain and leave sample by the EU voter turnout (64.81%) and accounting for the under-sampled non-voters (35.19%) weights are calculated as follows:
Remain weights = (0.4811 × 0.6481)/0.5507 = 0.5662
Leave weights = (0.5189 × 0.6481)/0.2949 = 1.1404
Abstain weights = 0.3519/0.1544 = 2.2791
These weights are incorporated within the existing demographic and regional weights detailed in Bauhr and Charron (2020).
To explore voter characteristics, we make use of responses to questions about gender; education; age; income; working status; size of the place of living (population); permanence (number of years spent in the same place), perception of economic trends in the previous 5 years; and knowledge of EU policies (Cohesion Policy (CP), Regional Policy (RP) and Structural Funds (SF)). Responses to the knowledge of EU policies should be taken with the caveat that the survey does not require a base line knowledge test to check people’s actual knowledge, instead we rely on self-reported educational attainment as a control.
Responses to these questions allow for analysis of the effects of economic variables related to the knowledge of EU main policies and the overall expectation about the economic cycle, whilst controlling for socio-economic characteristics of respondents. A full list of the variables used from this survey is presented in Table 2.
Survey questions.
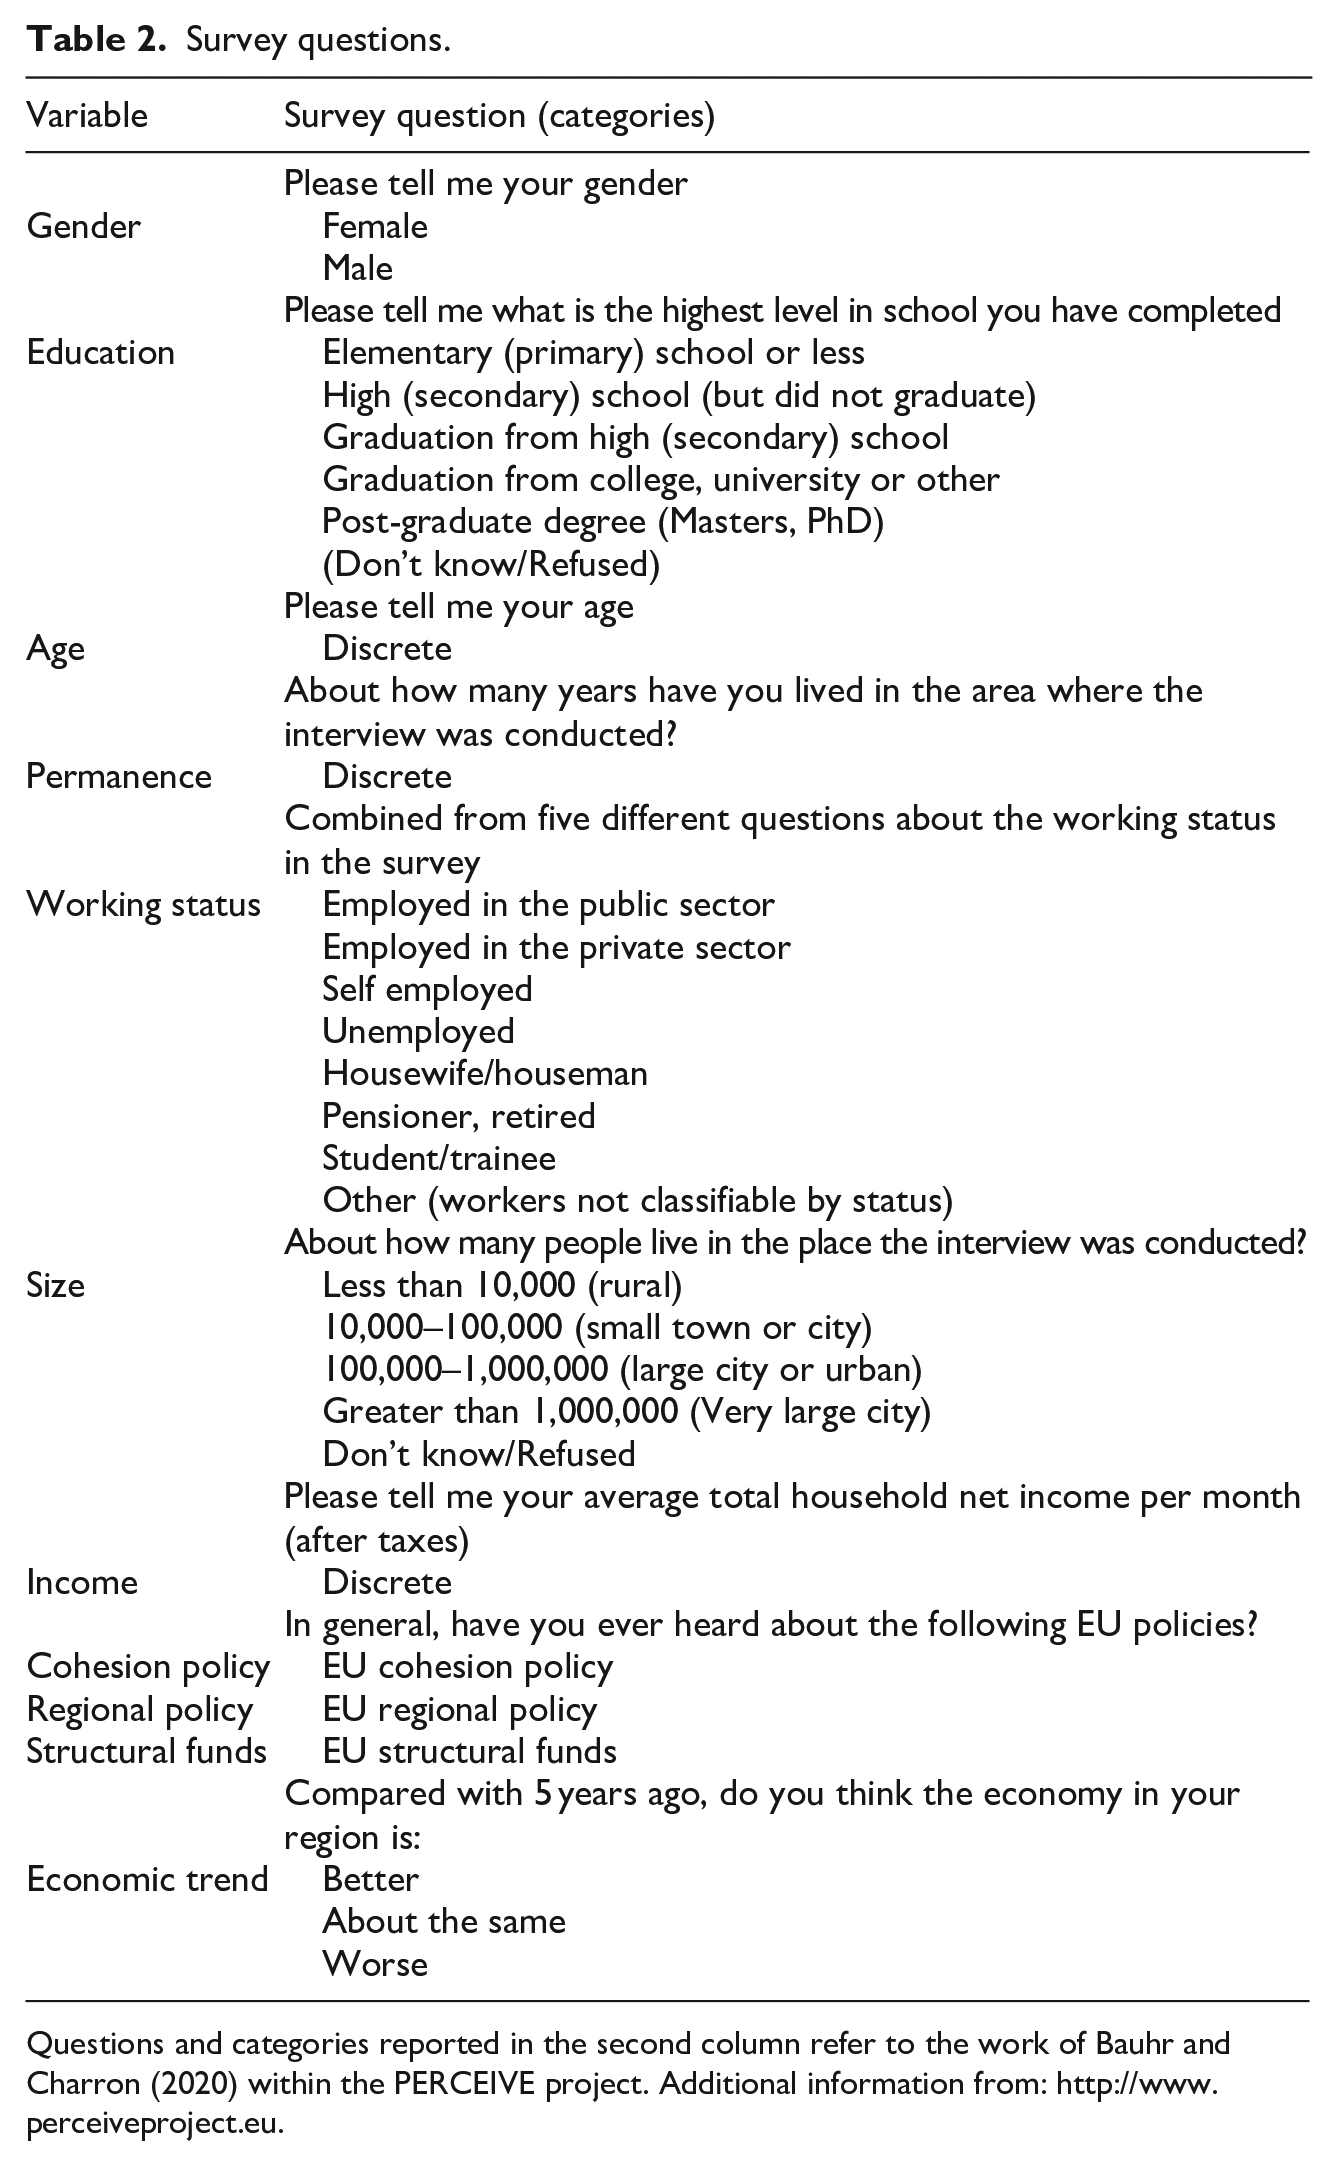
Questions and categories reported in the second column refer to the work of Bauhr and Charron (2020) within the PERCEIVE project. Additional information from: http://www.perceiveproject.eu.
To answer the question are Leave voters less likely to express a change to their binary referendum vote choice than those who voted Remain or those who abstained from voting?, we scrutinise the survey responses and present a visual analysis of characteristics behind voting decisions and their change. This is followed by formal statistical modelling of the referendum vote and voting regret using Seeming Unrelated Probit regression. This method allows for identification of the statistically significant factors, from variables in Table 2, which contribute towards the likelihood of a person regretting their vote choice. Since the main objective of the proposed model does not lie in the prediction of the referendum outcome per se, but, rather, in detecting the effect of selected variables based on theoretical arguments, the regression exercise does not apply methods for model selection such as lasso (Berk et al., 2013; Lee et al., 2016).
Findings
This section sets out the findings regarding the extent of expressed changes of voting choice then explores the characteristics of those expressing vote choice regret. As outlined, change is discerned via responses to these two questions: Q1 What did you vote in the Brexit referendum? Q2 If the referendum were held today, how would you vote? The breakdown of responses to these two questions as a proportion of the weighted sample (1500) is set out in Table 3.
Distribution of referendum voting choices and decision ‘today’ – shown as % of total sample (1500 people).
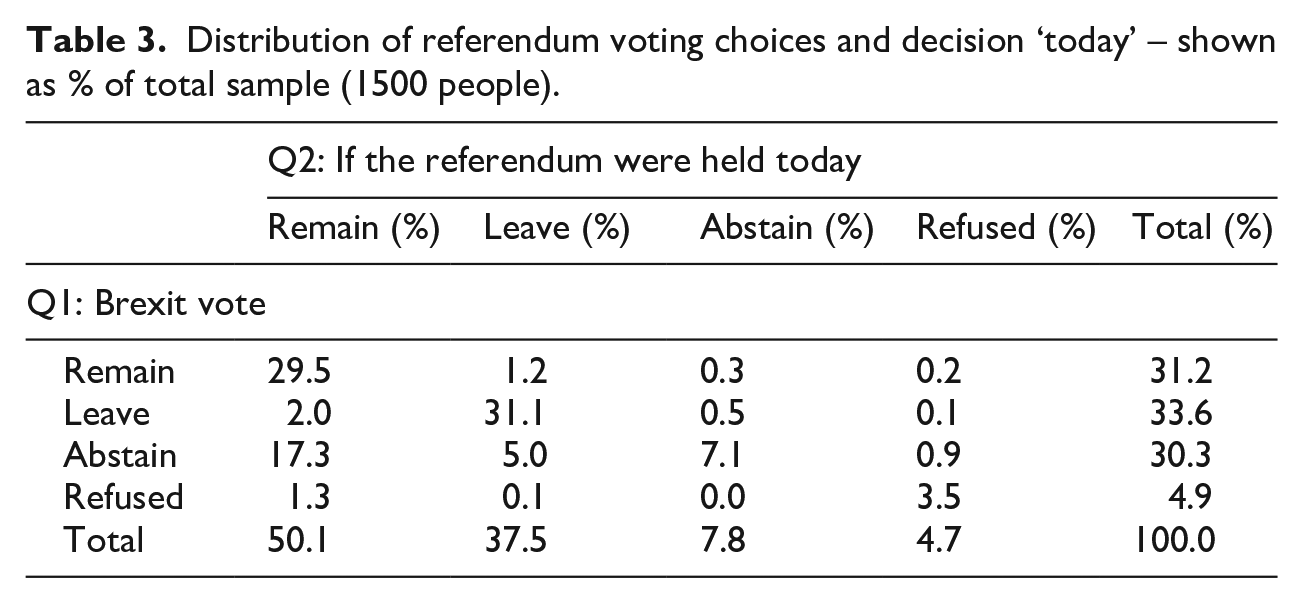
Those who did not change their decision between Q1 and Q2 account for 71.3% of the sample population. Accordingly, 28.7% did change their decision and for the following analysis we define this change as voting regret.
If the Q2 decision was in fact a true referendum vote then the result would be Remain 57.2% and Leave 42.8% (of valid votes), showing a key swing towards Remain from the referendum of June 2016. Only a small proportion of the sample changed from leave to remain (2% of sample), indeed, the largest change is seen in those who abstained in Q1, wishing to become electorally active in Q2. About 30.3% of the sample in Q1 declared that they abstained from voting, this falls to 7.8% in Q2. Some of those who abstained in Q1 chose Leave (5%) in Q2, however, far more chose Remain (17.3%) in Q2. Whilst it could be argued that Leave voters should have greater regret (measured by the numbers of people changing decision), as those who abstained perhaps had no interest in the original referendum outcome, this result shows that it is not Leave voters who have greater regret, instead it is those who abstained. This indicates that it is the lack of participation in the vote that is being regretted, based on the events following the referendum outcome.
A picture of voting decisions
The corresponding proportions of these categories (no change, abstain > remain, etc.) are shown within each NUTS 1 geographical region of the UK in Figure 1. Compared to other regions, the North West has the highest proportion of people regretting their original decision. Here, 40.3% regretted their choice, the majority of whom changed from Abstain to Remain, whereas only 12.6% of people residing in Northern Ireland regretted their choice. The highest proportions of Abstain to Remain voters are seen in Yorkshire and the Humber, London and the North West regions (27%, 24.7%, 24.2% of region population, respectively). The highest proportion of those who changed from Abstain to Leave reside in Wales (13.8%). Using Q2, all regions except Essex, North East, Northern Ireland and West Midlands would see a swing towards Remain significant enough to overturn the referendum vote.
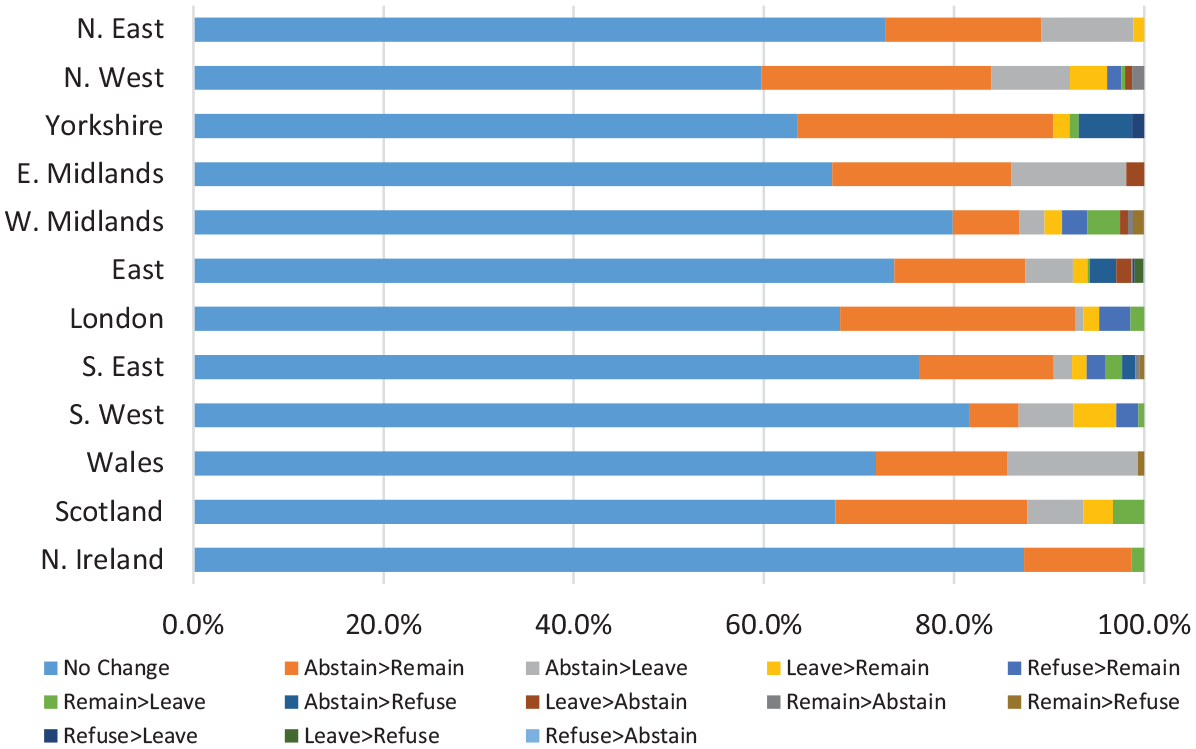
Voting choice behaviour between (Q1) and (Q2) by geographical location.
Figure 2a to h present respondent characteristics (gender, education, age, occupation, local population size, income and economic outlook) by categories of their change in voting choices from Q1 to Q2 (no change, regret, abstain > remain etc.). Of those who changed their choice (28.7% of population sample) 52.6% are male. More males than females chose to change from Refuse to Remain (79.8%) and Abstain to Remain (56.8%), whilst females are the majority of those who changed between Leave to Remain (69.8%).
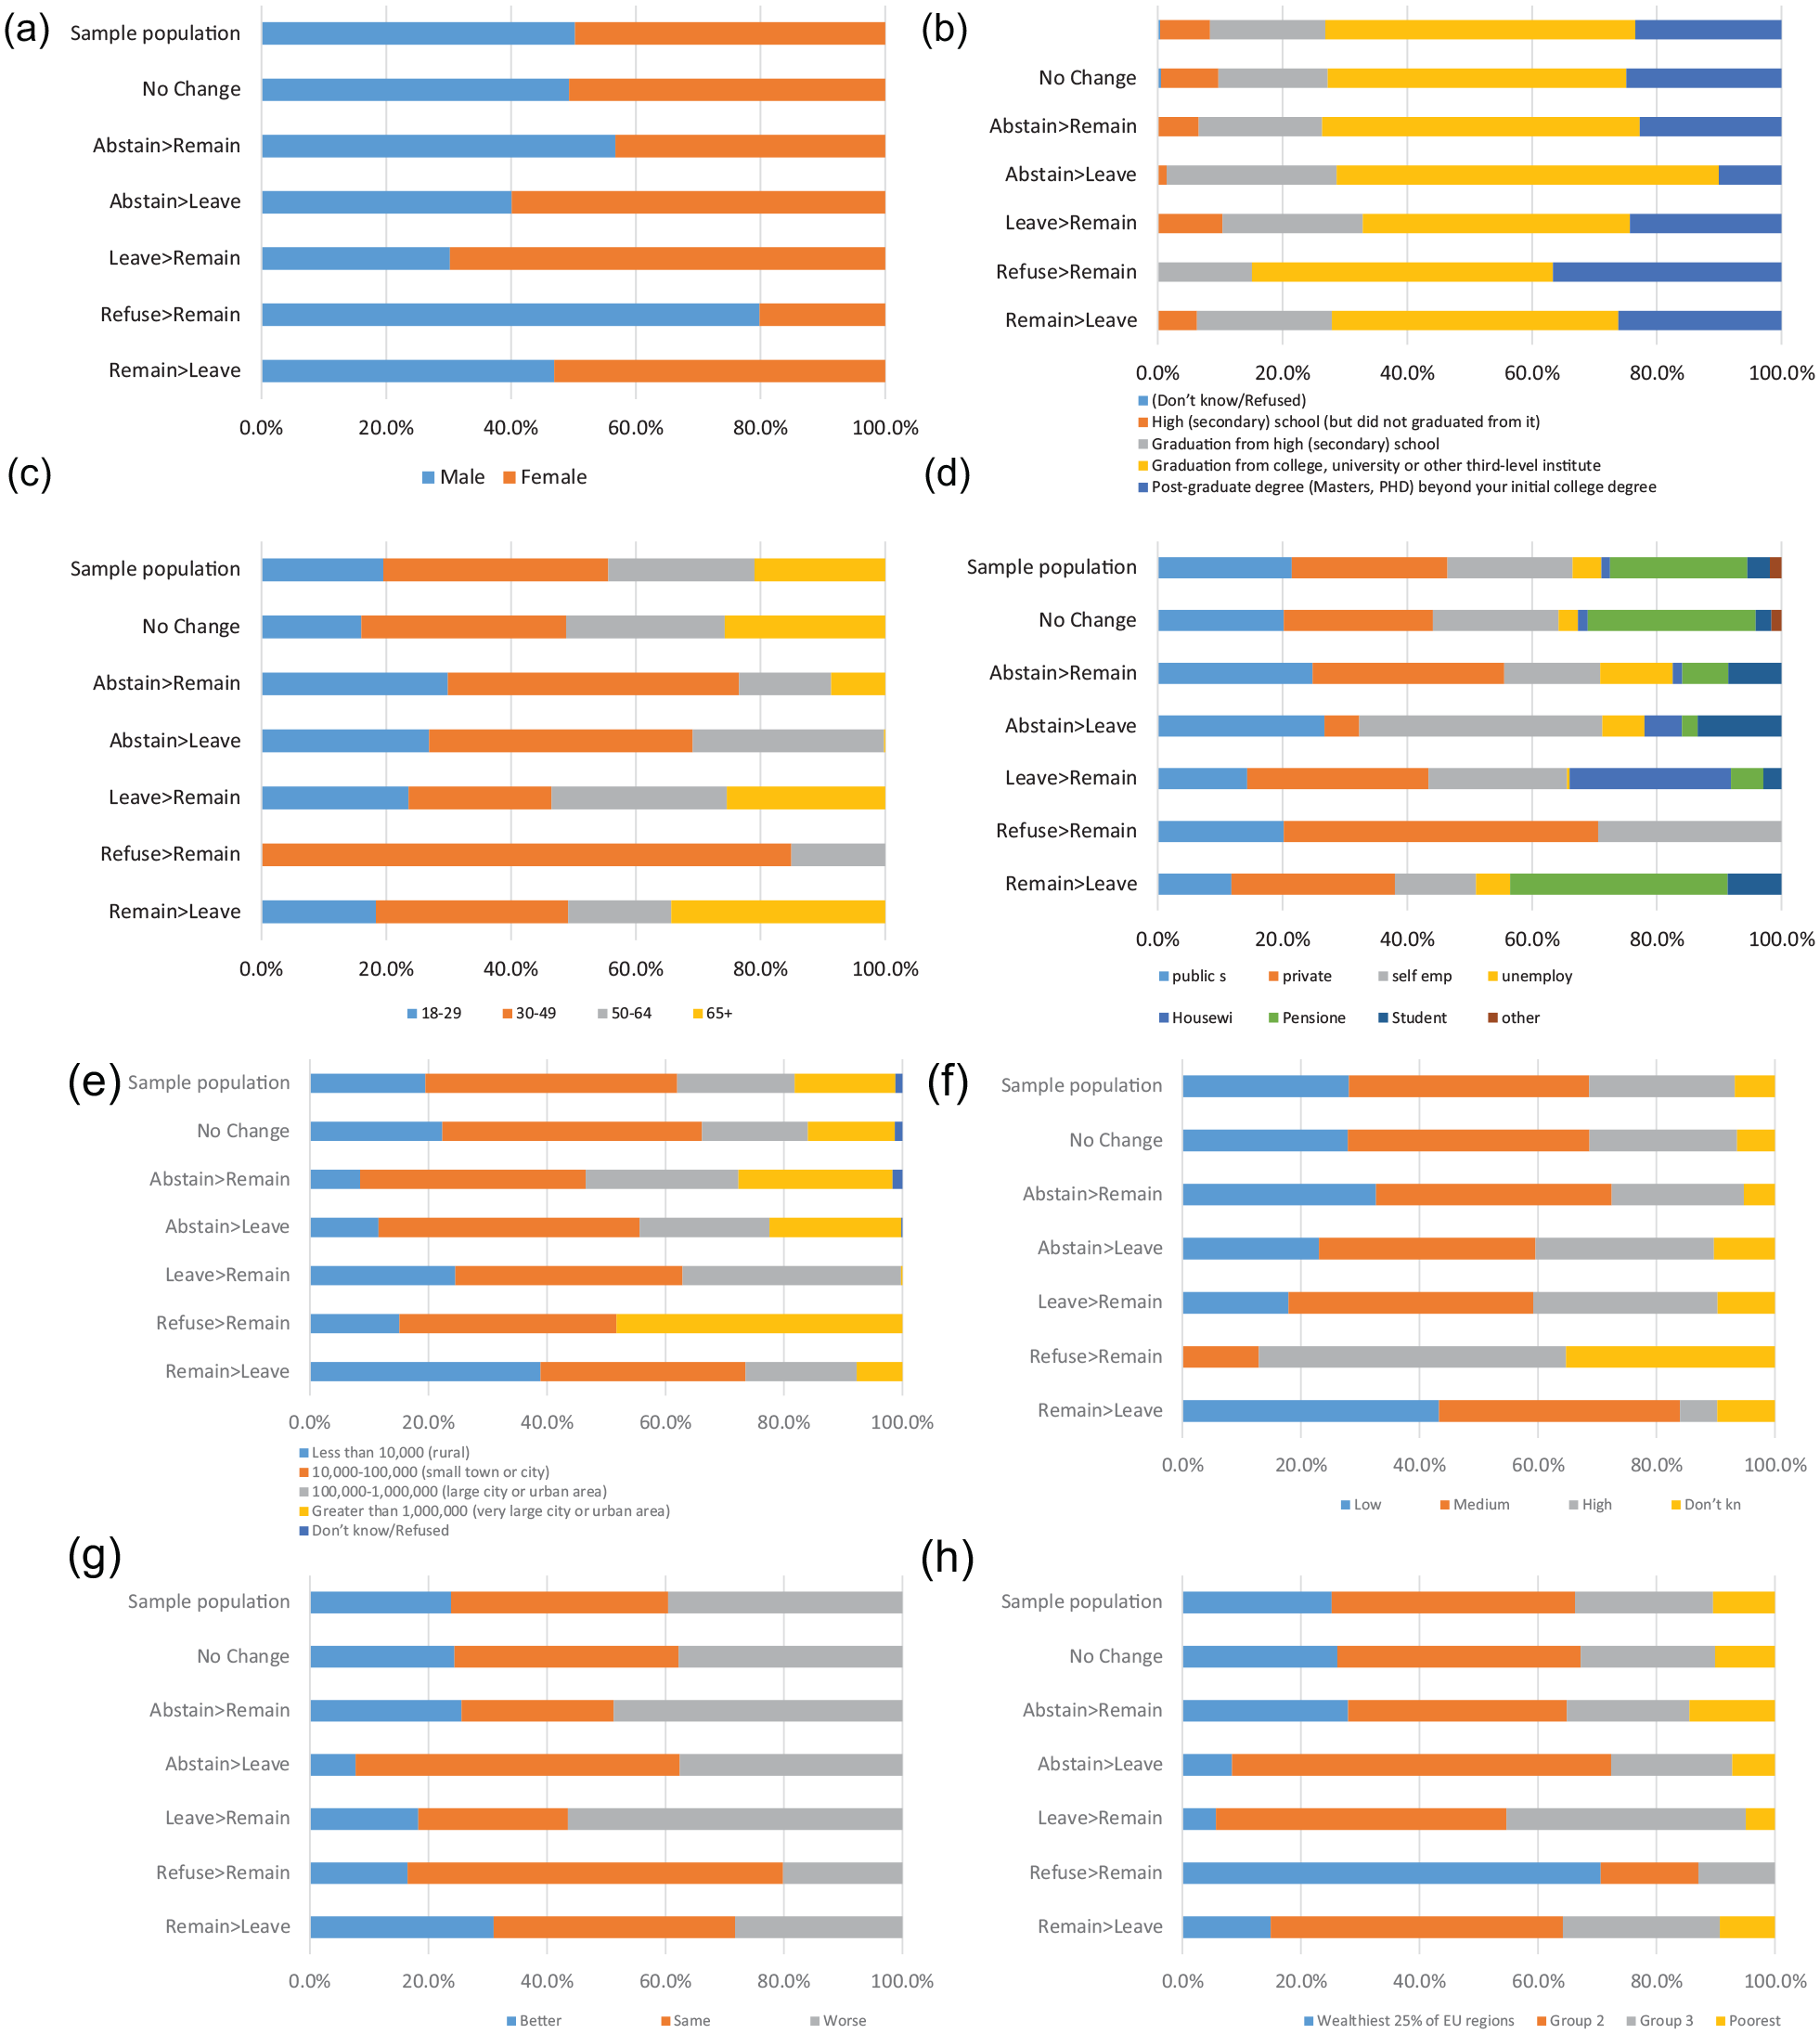
(a) Gender split of those changing voting choices from (Q1) to (Q2). (b) Education levels. (c) Age categories. (d) Occupation categories. (e) Local population size of home area. (f) Income level. (g) Perceptions of the economy (compared to 5 years ago). (h) Perception of UK GDP per capita compared to EU.
Of those regretting, 54.3% have a college or University education. A far smaller proportion of those changing from Abstain to Leave have a Postgraduate qualification (10.1%) whereas a high proportion of Refuse to Remain indeed have such qualifications. Over 44% of those changing decision are 30–49 years of age and those changing from Remain to Leave tended to be older, approximately half (50.9%) of this group are 50 years or older. Of the Refuse to Remain group, most (84.9%) are younger. Of the Leave to Remain group, the proportions are roughly equal across age categories.
About 27.6% of those who regretted are working in the private sector and the highest proportion of private sector workers feature in the Refuse to Remain group. The self-employed form the majority of the Abstain to Leave group. The highest proportion of ‘housewives’ is seen in the Leave to Remain category (25.9%). Whereas, 34.9% of the Remain to Leave group are pensioners.
Of those regretting, 39.2% live in a small town or city. Almost half (48.3%) of the Refuse to Remain category are living in a very large city with a local population greater than 1,000,000. In contrast, 38.9% of the Remain to Leave category are living in rural areas (less than 10,000 people) and 43.3% of the group are low
About 44% of those regretting perceive a worsening economic situation compared to 5 years ago. Indeed, 56.5% of the Leave to Remain and 48.8% of the Abstain to Remain categories perceived the economy to be worse off. The highest proportion of those perceiving an improving (better) economic situation compared to 5 years ago are in the Remain to Leave group. Furthermore, a high proportion of those who associated with Leave (Abstain > Leave, Remain > Leave) incorrectly believe the UK to be outside of the wealthiest 25% of EU regions.
Probit analysis
To explore the main drivers of both voting leave in the referendum and voting regret, Leave and Regret are used as dependent variables in separate seemingly unrelated bivariate Probit models and regressed against the set of explanatory variables presented in Table 2. Models 1 and 2 use the dependent variable Leave, a binary term equal to 1 if the respondent voted ‘Leave’ in the referendum and equal to 0 otherwise. Models 3–5 use the dependent variable Regret, which indicates the decision to abstain from the referendum (Q1) and change to vote remain (Q2). In principle, the case of voting regret stemming from voting to leave in the referendum should be treated separately from those choosing to abstain. Therefore, the model conceptually separates between those who voted leave but would now vote remain, and those who abstained but would now vote remain. Since the majority (80%) of vote regret are from those who abstained in the Brexit referendum, only these are used in regression analysis.
Since 4.7% and 4.9% refused to answer the questions 1 and 2 respectively, Models 1 and 3 use a Stochastic imputation method (von Hippel and Lynch, 2013) based on the variables Education, Income, Knowledge of Regional Policy and Economic trend to impute the missing responses for the exercise of running the Seemingly Unrelated Regression. Models 2, 4 and 5 provide robustness checks as the same estimation for Leave and Regret without the imputed values.
The categorical variables used in the regression analysis (Age, Education, Working Status, Size and Income) have been entered with reference to a particular default group as follows: those aged 65+; lowest level of education in the sample (Elementary (primary) school or less (no diploma) or High (secondary) school (but did not graduate from it); pensioners; smallest (rural) area; and the higher income group), respectively. Therefore, for each variable the estimated coefficient shows the eventual change due to an individual departing from the reference categories for each group.
Probit regression estimation results are shown in Table 4 and corresponding average marginal effects in Table 5. 2
Determinants of referendum choice and voting regret.
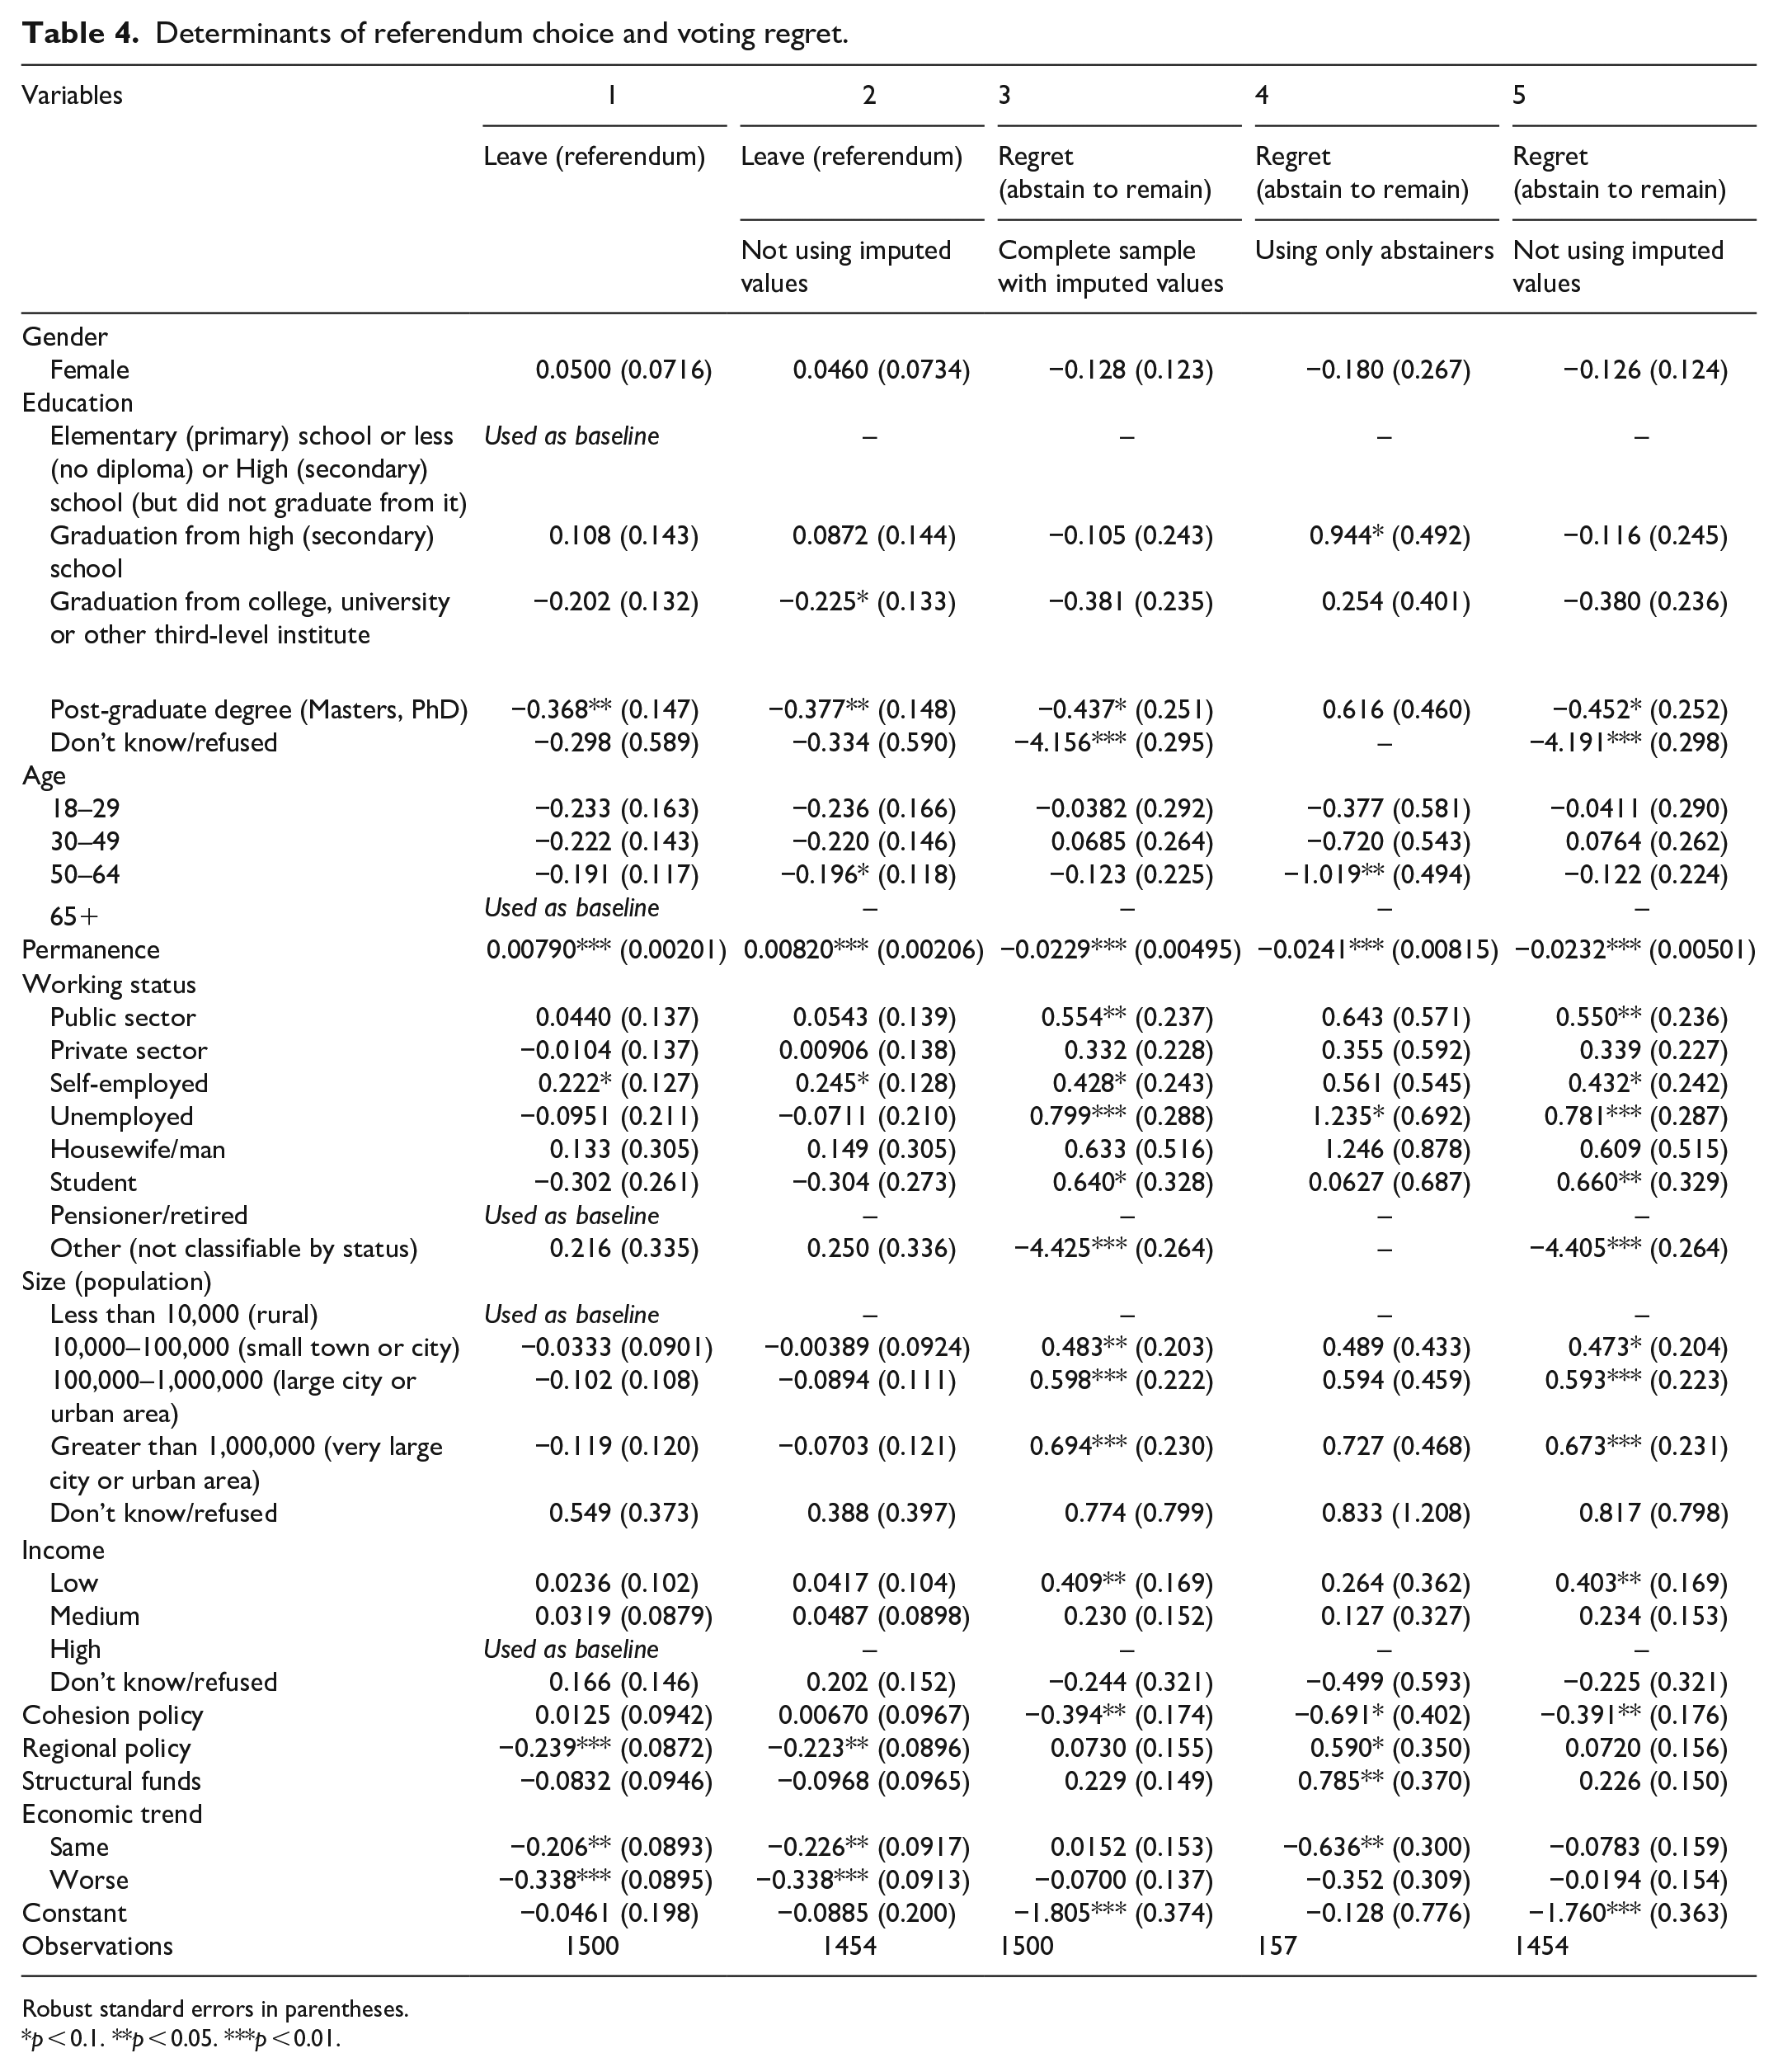
Robust standard errors in parentheses.
p < 0.1. **p < 0.05. ***p < 0.01.
Determinants of voting regret – average marginal effects.
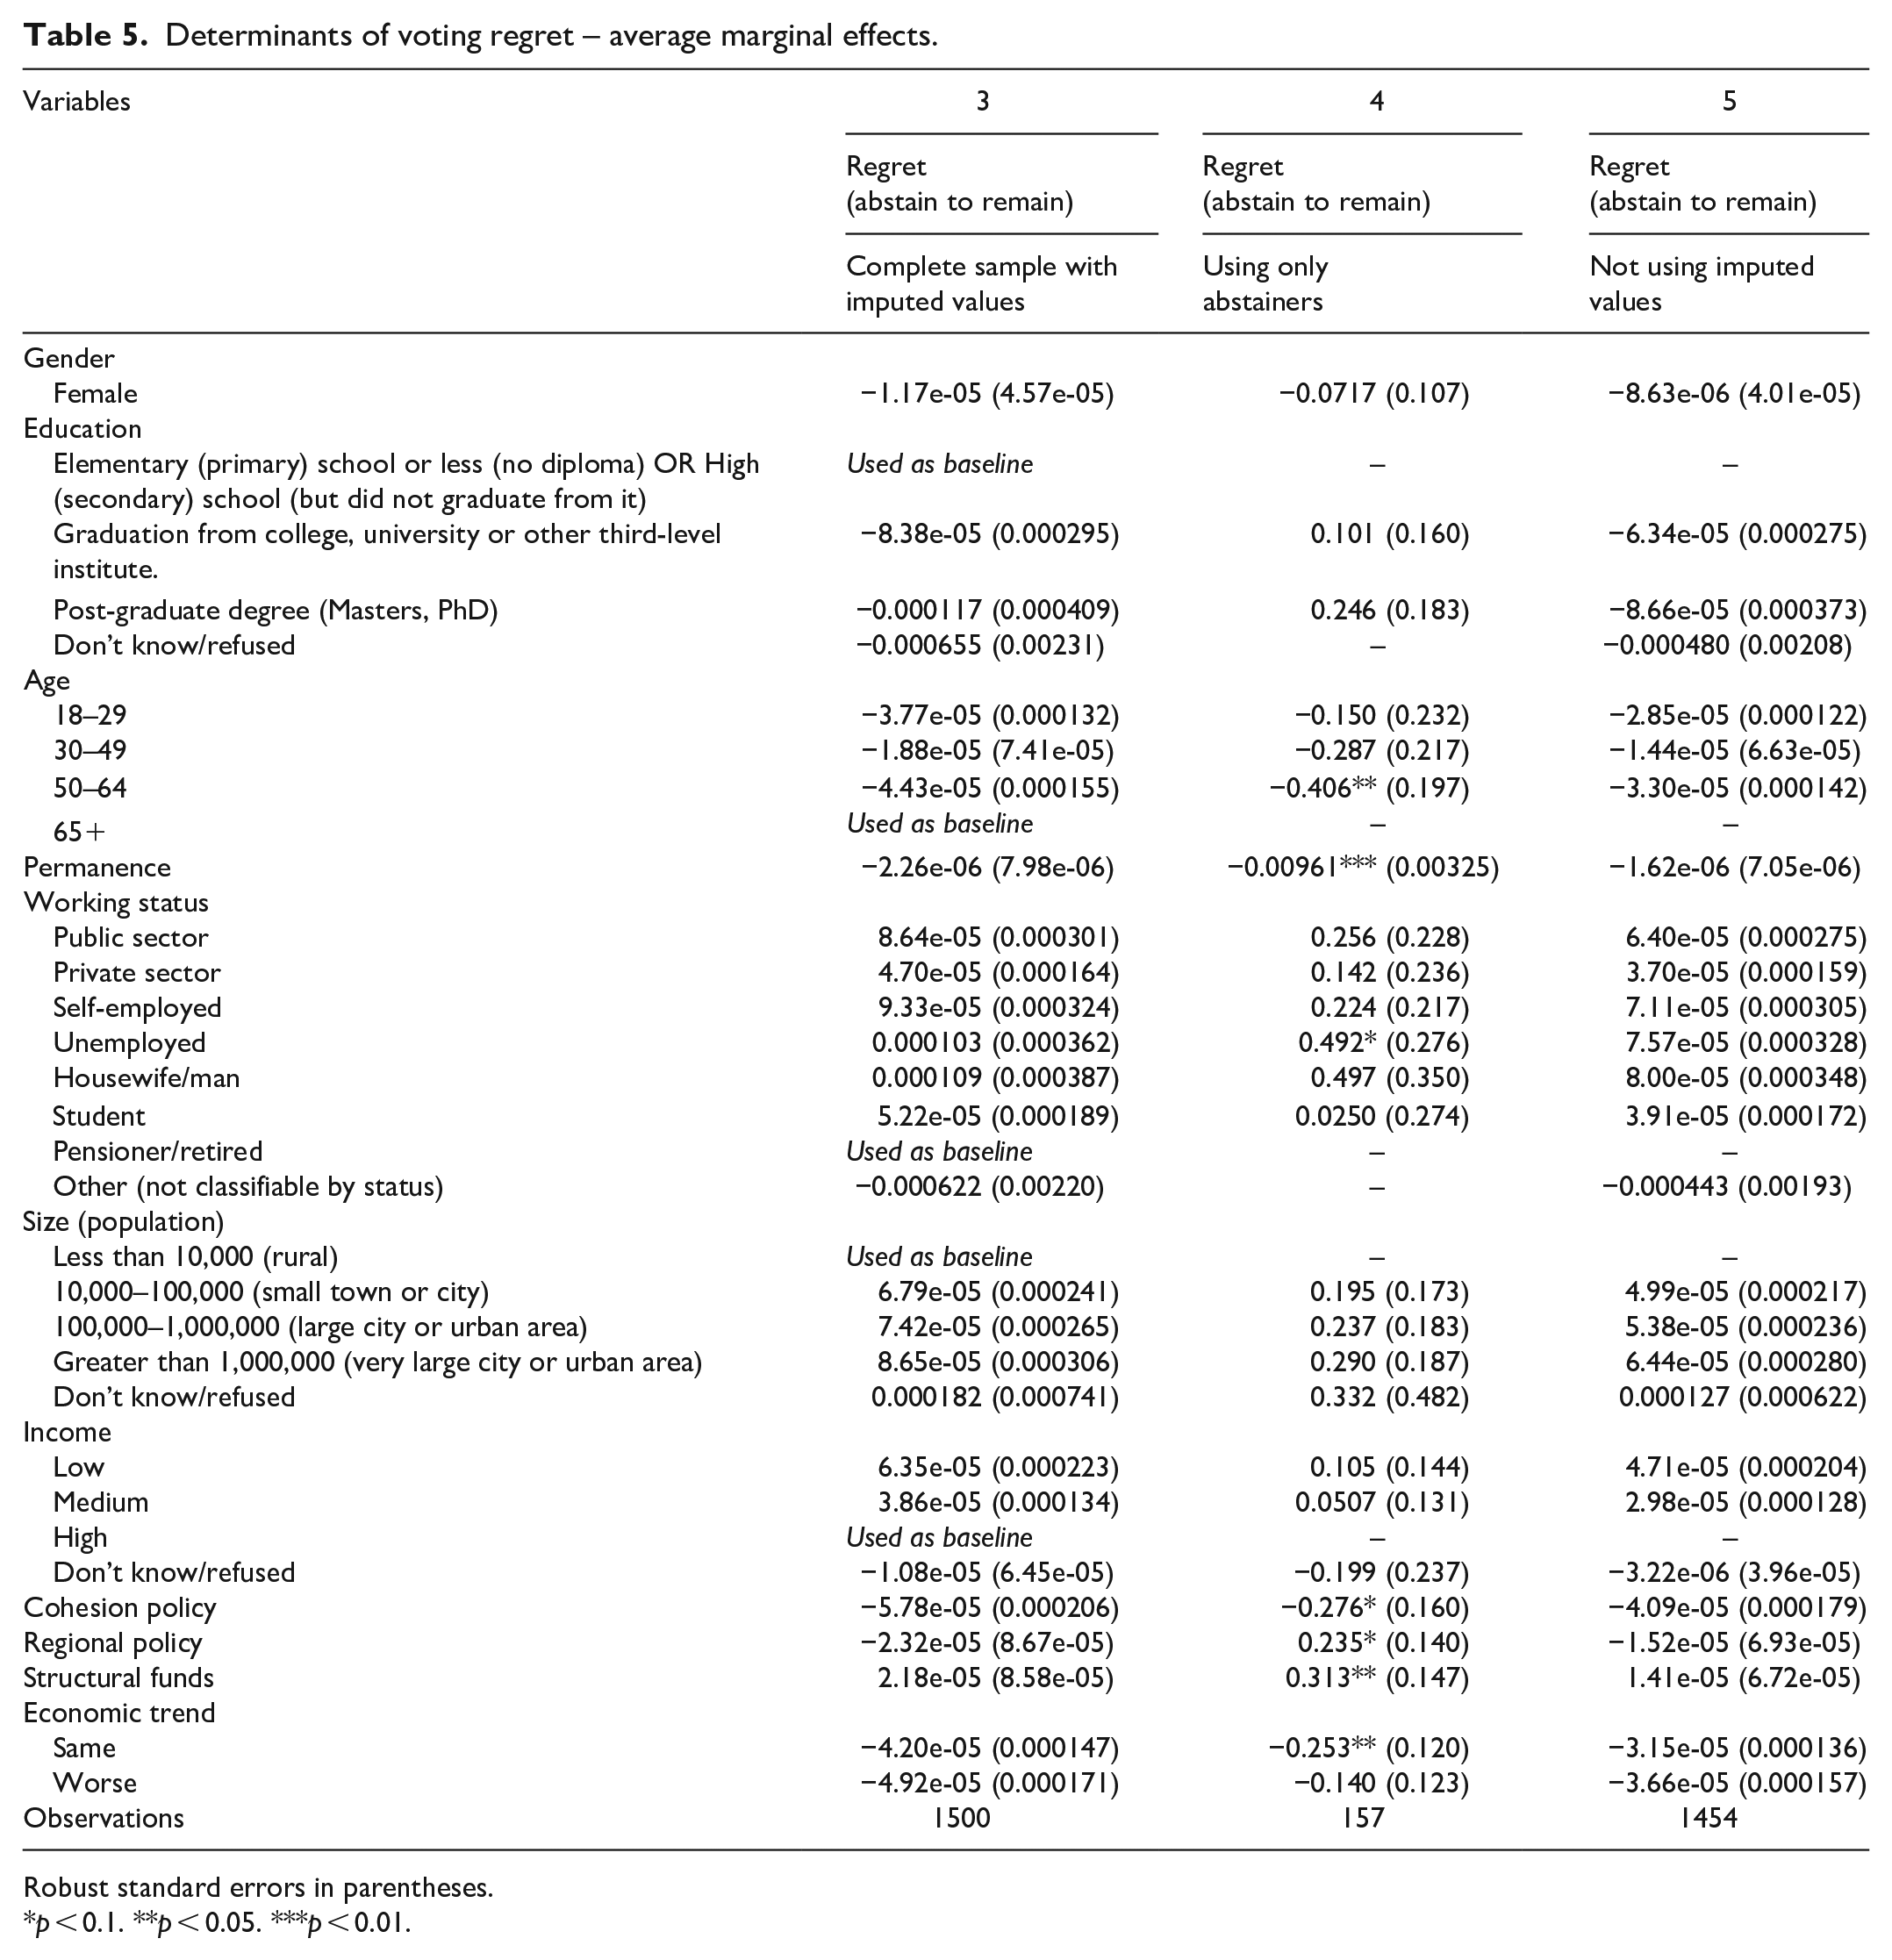
Robust standard errors in parentheses.
p < 0.1. **p < 0.05. ***p < 0.01.
It could be argued that greater knowledge of EU policies increases the identification and the support to the EU discourse, therefore decreasing the probability of voting Leave and also decreasing voting regret. Indeed, a greater knowledge of Regional Policy reduces the probability of voting Leave in the referendum. Similarly, a greater knowledge of Cohesion Policy reduces the likelihood voting regret. Knowledge of Regional Policy and Structural Funds shows as having a positive and statistically significant impact on regret in Model 4, however, this is not reflected in either of the other two specifications.
The number of years spent living in the same area has a highly statistically significant impact (at more than 1%) in each model, increasing the probability of voting Leave and decreasing the likelihood of regret. As each model controls for the age of respondent, permanence is capturing a lack of mobility and a sense of local community. Suggesting that not being exposed to new social environments makes it less likely that an individual will regret their decision once new information is made available.
The probability of voting Leave could decrease as predictions about the economic outlook worsen and expectations about a better scenario might increase the probability of voting leave. It can be argued that some people would consider taking potential advantage of the positive trend to a greater extent when outside of the EU. For example, if they consider they might benefit from lower levels of external regulation and by avoiding contributions to the EU budget (e.g. the ‘let’s give our NHS the £350 million the EU takes every week’ argument). Indeed, being part of the EU allows benefiting from an insurance effect (i.e. spreading the risk) arising from partnership in a wider organisation. Perception of the economic trend is found to be highly significant in the referendum equation. Indeed, expressing the feeling that the economic situation would be the same or worse decreases the probability of voting Leave. This evidence suggests that the economy played some role in the choice about remaining or not in the EU by partially incorporating the potential negative consequences of the course of Brexit. However, a relationship with perceptions about economic outlook does not robustly appear to influence voting regret. Meaning that perceiving the local economy to be worse now than 5 years ago does not change the likelihood of regretting the voting decision.
Compared to those with only a primary education, holding a post-graduate degree (e.g. a Master or a PhD) decreases the likelihood of regret and also probability of voting Leave. Building on Hobolt (2016), this result is excepted as typically higher education signifies the ability to assimilate information and the integrity of sources of information. Similarly, unemployment appears statistically significant in each Model (3–5) showing that unemployed people are more likely to regret their voting decision compared to those retired from work. Furthermore, belonging to the low-income-group has a positive statistical impact on the probability of vote regret. Combined, these results indicate the significant influence of education and income driving the likelihood to regret the voting decision.
Compared to small rural areas, living in more urban areas such as towns and cities increases the probability of vote regret, with coefficient increasing with the population size. However, this appears not to be significant when considering the average margin effect. Moreover, a similar general insignificance of the categories controlling for the population size is registered for the referendum. Finally, whilst it could be expected that younger people maybe less prone to vote Leave, neither age or gender appear to offer any statistically significant impact on the referendum choice nor on the successive expression of regret.
Based on these results and the representative sample of 1500 individuals considered here, the characteristics of those more likely to regret their voting decision are those who:
have less knowledge of the major EU policy funding streams;
have lived in the same area for a shorter period of time;
live in a less populated area;
have lower educational attainment;
are unemployed;
earn a low income.
Summary and concluding remarks
This study uses responses from a novel household survey conducted 1 year on from the UK referendum to leave or remain in the EU. Questions in this survey ask responds to report their referendum vote and what their vote would be at the time of survey (summer 2017). Through these responses, this study is able to identify those who change their decision and analyse the characteristics of those most likely to regret their original vote decision. Results show that, knowledge of EU funding policies, permanence of residential location, population size of the local areas, educational attainment, employment status and income are key drivers for regretting the referendum voting decision.
This study finds that a year on from the ‘Brexit’ referendum there is evidence that the overall result would be overturned should a second vote be held. Relatively few Leave voters would change their original vote choice. The main source of change in voter behaviour emerges from abstainers becoming electorally active. Arguably, the voting behaviour of these individuals is likely harder to predict such that the actual extent of any changed voting outcome might well be slimmer than the results in this study would indicate. However, the march of time and the typically older demographic profile of Leave voters would mean that there would be less of the original Leave voters alive such that just some more electorally active previous abstainers could well be significant.
Footnotes
Funding
The author(s) disclosed receipt of the following financial support for the research, authorship, and/or publication of this article: Dataset and analysis funded as part of a Horizon 2020 project, PERCEIVE: Perception and Evaluation of Regional and Cohesion Policies by Europeans and Identification with the Values of Europe. GA No. 693529.