
Abstract
This article examines the operating and financial performance of venture firms conducting initial coin offerings (ICOs) with different types of investors and at different points along a venture’s life-cycle. Relative to purely crowdfunded ICO ventures, institutional investor-backed ICO ventures exhibit weaker operating performance and fail earlier. However, conditional on survival, these ventures financially outperform their peers that do not receive institutional investor support. The diverging effects of investor backing on financial and operating performance are consistent with our theory of “certification exploitation” through a new form of a pump-and-dump scheme. Institutional investors exploit their reputation to drive up ICO valuations and quickly exit the venture post-ICO, with the difference in pre- versus post-certification token prices being their exploitation profit in liquid markets for startups. Our findings further indicate that there is an inverted U-shaped relationship between the financial success of an ICO and the timing along a venture’s life-cycle, with the product piloting phase representing the pivotal point.
Keywords
Introduction
In an initial coin offering (ICO), or token offering, startups raise capital by selling cryptographically protected digital units of assets, known as tokens, to investors (Fisch, 2019; Momtaz, 2020). ICOs represent an innovative entrepreneurial finance mechanism, which has evolved out of crowdfunding by way of blockchain technology, to issue stakes in startup firms (Belitski & Boreiko, 2021; Fisch, 2019; Howell et al., 2020; Huang et al., 2020; Li & Mann, 2021; Momtaz, 2020). While there is growing empirical evidence for the financial performance of ICOs in the spirit of initial public offerings (IPOs), 1 the literature on operating performance is scant (Davydiuk et al., 2023; Howell et al., 2020; Lyandres et al., 2022). Given widespread concerns about fraud in ICO markets (Hornuf et al., 2022), whether they are valid or not, it is imperative to infer the performance of ICOs beyond the fundraising stage. To fill this research gap, in this article, we construct a new database that tracks the operating performance of tokenized startups in terms of their achieved and missed milestones.
Our classification of milestones considers seven phases spanning idea, proof of concept, prototype, pilot, minimum viable product, full product, and operating success or profitability. In total, we track 20,431 milestones in 3,864 startup firms over the period 2015 to 2021 and document several stylized facts about the operating performance of ICOs over their life-cycle. First, only about half of all ventures ultimately develop a full product, and only 19% reach the stage of operating success. Second, conditional on achieving operating success, startups that develop a full product take about 19 months to do so. Startups that achieve operating success need about 24 months from ideation to reach this final milestone. Third, the most common reason why startups fail is that they are not able to develop their pilot into a minimum viable product or their minimum viable product into a full product. More than 60% of all startups fail during the stages from pilot to full product development, which occur over a relatively short time span of 3 months for the average startup.
While these stylized facts are interesting in themselves, our novel dataset allows us to examine important and previously unaddressed research questions related to early-stage entrepreneurial finance by exploiting the institutional setting of the ICO market. The starting point of our analysis is that entrepreneurial financial markets are highly competitive, especially on the demand side for capital. In many startups, entrepreneurs are almost desperate for funding “just to keep going” and fail to focus their fundraising efforts on getting the best partners on board and setting the course for long-term success. Accordingly, there is a highly strategic aspect to early-stage entrepreneurial finance (Amornsiripanitch et al., 2019; Blaseg & Hornuf, 2023; Mansouri & Momtaz, 2022). Nevertheless, strategic entrepreneurial finance of pre-seed and seed ventures is an underexplored research field with many challenges in establishing empirical facts to inform theory, including the segmentation of early-stage financing markets, which precludes an analysis of financing choices and strategies (Cumming & Johan, 2017; Cumming & Vismara, 2017). We exploit token markets, which are relatively integrated with regard to different investor types, as a near-ideal laboratory to examine two overarching strategic aspects of early-stage entrepreneurial finance. First, we analyze differences between purely crowdfunded and institutional investor-backed ventures in terms of their post-funding operating and financial performance. Second, linking the information on operating and financial performance, we assess whether there is an optimal point in time along a startup’s life-cycle to raise capital through token offerings.
Our first research objective is to explore whether there are differences between purely crowdfunded and institutional investor-backed venture firms by comparing their post-funding operating and financial performance. Given a high level of opacity and information asymmetry between ventures seeking funding and investors providing the necessary capital, entrepreneurial finance is inherently risky (Block et al., 2021; Cumming, 2008; Cumming & Johan, 2017; Drover et al., 2017; Dushnitsky & Shapira, 2010). Theory suggests that ventures are able to reduce information asymmetry by sending signals of their quality (Ahlers et al., 2015; Colombo, 2021; Vismara, 2018). However, in the new era of tokenization of future assets, traditional signals have become largely ineffective (Bourveau et al., 2022; Fisch, 2019), primarily due to the lack of an institutional framework that verifies signals ex ante or at the very least punishes false signals ex post (Momtaz, 2021c). Therefore, many tokenized startups rely on outside certification to signal their quality to investors. One certification mechanism is to enlist the support of institutional investors (Colombo et al., 2021; Cumming et al., 2024), particularly crypto funds (Dombrowski et al., 2023; Fisch & Momtaz, 2020). 2
We depart from the prevalent view that certification through institutional investors is uniformly beneficial (Fisch & Momtaz, 2020; Hsu, 2004) and argue that institutional investor backing can have different consequences for the performance of tokenized startups. In particular, we are concerned with what we call “certification exploitation,” which occurs when institutional investors, who attest to the quality of the venture with their financial backing, have an incentive to quickly exit from the target venture as long as token valuations are favorably impacted by their own certification. Put differently, certifying investors buy tokens at the pre-certification price and, thanks to liquid secondary markets, sell their tokens only after a short time at the post-certification price, with the difference being their exploitation profit.
Certification exploitation potentially leads to individually rational market myopia (Stein, 1989). If entrepreneurs know about the incentives for certifying investors to exit, they may focus on activities that boost short-term financial performance and increase the token price in the secondary market to keep investors in the market, but forego activities that benefit long-term operating performance. Therefore, certification exploitation can lead to diverging effects on a startup’s operating versus financial performance. Our Operating Underperformance Hypothesis and the Financial Outperformance Hypothesis suggest that, ceteris paribus, institutional investor-backed ICO ventures exhibit weaker operating performance and stronger financial performance, respectively, than solely crowdfunded ICO ventures.
Our empirical analysis confirms both hypotheses. Compared to crowdfunded startup ventures, institutional investor-backed startups have a lower likelihood of survival. In particular, the results of frailty models indicate that institutional investor-backed startups are more likely to be liquidated before they become profitable or have developed a full product, with increased hazards of 24% and 42% relative to their non-backed peers, respectively. 3 These estimates confirm our Operating Underperformance Hypothesis. The effect is driven by crypto hedge funds, who behave opportunistically and seem to be mainly interested in the financial performance of the target firm. The same effect is not observable for crypto venture funds, who are more geared toward the operating performance of their target firms and resemble traditional venture capitalists. We further document that a higher funding through a token issuance significantly prolongs a startup’s efforts to develop a full product and increases the likelihood of operating success.
Second, relative to fully crowdfunded startups, we document that institutional investor-backed startups raise a higher amount of funding, and that their financial performance in terms of buy-and-hold abnormal token returns is higher in the short-run (up to holding periods of 6 months). However, the financial outperformance of these crypto fund-backed ventures vanishes in the long-run; buy-and-hold abnormal token returns are no longer statistically significant for holding periods up to 24 months. The observed return patterns at least partially support the Financial Outperformance Hypothesis. Our results hold conditional on startups’ operating performance, that is, we control for the milestones already reached at the time of the ICO and the venture’s post-ICO operating development. Again, the negative impact on ventures’ financial performance in the long-run is most pronounced in the presence of funds with hedge fund-style strategies.
Our second research objective relates to the association between the performance of ICOs and the timing of token issuances. Having information on both financial and operating performance, we are able to connect these two pieces of information and develop theoretical arguments pertaining to the optimal timing to implement a token offering. At least three arguments suggest that conducting ICOs both very early and very late along a startup’s life-cycle diminishes the offering’s success and subsequent financial performance. First, token offerings involve a trade-off between entrepreneurs giving up private benefits of control and benefiting from a higher venture value due to secondary market trading (Benninga et al., 2005). Second, learning from market feedback in token offerings, although requiring costly initial investments, may be beneficial for pre-seed ventures. In contrast, it is only of little marginal value for mature ventures (Yan & Williams, 2021). Third, the potential benefits of certification in early-stage and mature ventures are small because certification may not be credible early on and become unprofitable in later stages. Overall, these arguments lead to our Optimal Timing Hypothesis, which suggests that there is an inverted U-shaped relationship between the financial success of ICO ventures and their life-cycle stage.
Our empirical strategy to examine the inverted U-shaped relationship between the success of a token offering and its timing along the startup’s life-cycle follows the methodology in Haans et al. (2016). The results are consistent irrespective of whether startups attempt to optimize the timing of their ICO with an eye toward maximizing the funding amount or short-term financial returns to investors. For entrepreneurs wishing to maximize the funding amount, the optimal timing for a token offering is right upon completion of the piloting milestone, when startups begin to develop their minimum viable product. Similarly, for entrepreneurs wishing to maximize short-term investor returns, the optimal timing of an ICO is during the piloting stage. However, entrepreneurs cannot influence the long-run financial performance of tokenized startups through skillful timing of the offering. In sample-split analyses, we further analyze whether the optimal timing of a token offering depends on whether it is a purely crowdfunded or institutional investor-backed project. The effect of timing seems to be particularly important for short-run token returns in ventures with crypto fund backing.
Our article makes several contributions to the entrepreneurial finance literature. First, by constructing a unique dataset with granular milestones for ICO ventures, we fill a research gap related to the post-funding financial and operating performance of crowdfunded firms (Böckel et al., 2021; Vanacker et al., 2019). Detailed information on the achievement of 7 milestones allows us to shift the focus in the existing literature away from the token issuance stage and document several stylized facts about the operating performance of ICOs over their life-cycle. Second, while most of the finance literature assumes that institutional investors, with their independence, expertise, and ability to monitor managers effectively, have a positive effects on firm outcomes that are attributable to better monitoring and changes in governance structures (Aggarwal et al., 2011; Shleifer & Vishny, 1986), we document that institutional investors can also have adverse consequences for the operating performance of ICO ventures. Given the diverging financial and operating post-funding ICO performance, we interpret the apparently opportunistic behavior of crypto hedge funds as being consistent with our theory of certification exploitation. This finding contributes to the recent literature on “pump-and-dump” schemes in cryptocurrency markets (Dhawan & Putnins, 2022; Hamrick et al., 2021; Li et al., 2023). It also confirms theoretical work showing that token prices are determined by aggregating user transaction demand (Cong et al., 2021), but highlights that investor heterogeneity is important and may lead to convoluted post-funding performance effects. Third, linking the information about financial and operating post-funding performance, we assess whether there is an optimal point in time along a startup’s life-cycle to raise capital through token offerings, and when a crypto fund should enter the target venture. Our results therefore contribute to the literature evaluating the costs and benefits of being publicly traded (Benninga et al., 2005; Yan & Williams, 2021). Finally, our findings have rich implications for entrepreneurs, policy makers, and regulators (see section “Theoretical Contributions and Practical Implications” for further details).
The remainder is organized as follows: Section “Background and Hypotheses” provides details about the institutional background and develops our empirical predictions. Section “Data and Stylized Facts” describes our data and empirical methodology. Section “Empirical Results” presents the results, and the final section concludes.
Background and Hypotheses
Institutional Background
ICOs and Secondary Markets for Tokenized Startups
In an ICO, or token offering, startups raise capital by selling tokens to investors (Fisch, 2019; Momtaz, 2020). 4 They represent an innovative entrepreneurial finance mechanism that has evolved out of crowdfunding by way of blockchain technology to issue stakes in startups (Belitski & Boreiko, 2021; Fisch, 2019; Howell et al., 2020; Huang et al., 2020; Li & Mann, 2021; Momtaz, 2020). 5 Tokens are cryptographically protected digital units of assets that provide value to investors through a utility, currency, or security function (Howell et al., 2020; Ofir & Sadeh, 2021). Our empirical analysis is limited to utility tokens, which are voucher-like assets that give access to a future service or product promised by the issuing venture. Unlike security tokens, utility tokens do not grant ownership rights in the venture. 6 Technically speaking, they constitute decentralized startup financing transactions that rely on smart contracts to automate trustless transactions between entrepreneurs and investors (Amsden & Schweizer, 2018; Fisch et al., 2022; Momtaz, 2024).
From an investor’s perspective, tokenized startups have distinct benefits, mostly related to the tradability of tokens (Lukkarinen & Schwienbacher, 2023). Digital tokens are fungible and fractionalizable, that is, investors can trade tokens on liquid secondary markets at arbitrarily low prices per fractionalized unit. Tokens can be exchanged among investors or converted into other cryptocurrencies or fiat currencies on crypto asset exchanges. The ease of trading makes investing in ICOs easier and less costly compared to public equity because there is no need for brokerage services. Tokens attract individual investors to early-stage startup financing markets, who would otherwise stay away if they had to commit to the investment for several years before realizing any return, potentially democratizing access to finance (Chen & Bellavitis, 2020; Fisch et al., 2022). 7
Utility token offerings have several additional benefits for issuing firms (Benedetti & Nikbakht, 2021; Cong et al., 2021; Howell et al., 2020; Ofir & Sadeh, 2021; Schwienbacher, 2018). First, they can raise capital from investors without diluting their equity holdings. Second, the ICO allocation mechanism facilitates access to a global investor base at very low transaction costs. Third, issuers are able to cultivate new users for their products or services, who will be particularly likely to engage with the project. This helps them receive valuable signals and learn information about the potential demand for new products and services. Fourth, investors join the platform not only to enjoy its utility, but also to benefit from rising token prices as the size of the network grows.
Crypto Funds
Token offerings can be either fully crowdfunded by individual investors or obtain additional backing from crypto funds (Fisch & Momtaz, 2020). Most crypto funds follow one of two common investment strategies (Cumming et al., 2024). 8 On the one hand, similar to traditional venture capital funds (Colombo & Grilli, 2010), crypto venture funds are business model-oriented investors that support a venture, for example, by setting up the blockchain and helping scale the technology. They often perform other functions as well, such as providing guidance and coaching (e.g., through control or voting rights) in the startup’s management and/or technology team.
On the other hand, other crypto funds are mainly financially oriented and employ a hedge fund-style investment strategy (Cumming et al., 2024; Dombrowski et al., 2023; Momtaz, 2024). Hedge fund-style trading of startup ventures is a new phenomenon that has only become possible through the tokenization of ventures and the creation of public markets for tokens (Cumming et al., 2024). Tokens are an attractive asset class for hedge funds because they have no exposure to stock market returns, macroeconomic factors, or returns on fiat currencies and commodities (Hu et al., 2019; Liu & Tsyvinski, 2021; Liu et al., 2022). The trading of tokens in liquid secondary markets allows crypto hedge funds to employ sophisticated trading strategies, such as short selling of tokens, and to leverage their investments. 9
Recent studies illustrate how investors in cryptocurrency markets are able to take advantage of mispricing and arbitrage opportunities (Griffin & Shams, 2020; Liu & Tsyvinski, 2021; Makarov & Schoar, 2020). For example, Liu and Tsyvinski (2021) document a strong time-series momentum effect in coin returns, and how investor attention is predictive of future coin returns. Makarov and Schoar (2020) conclude that cryptocurrency markets exhibit periods of arbitrage opportunities across exchanges. Griffin and Shams (2020) document that prices can be gamed and manipulated in cryptocurrency markets. On the downside, however, purely financially motivated crypto hedge funds do not necessarily consider what is best for their portfolio firms in the long run. Their behavior can even lead to detrimental firm outcomes, which we examine further in the next section.
Theoretical Background and Hypotheses
Signaling and Certification
Asymmetric information is a pervasive problem in entrepreneurial finance because entrepreneurs usually have neither valuable assets as collateral nor track records that could serve as indicators of potential success trajectories (Colombo, 2021; Colombo & Grilli, 2010; Jensen et al., 1976). The asymmetric information problem is strongly pronounced in the context of ICOs for two reasons. First, entrepreneurs tokenize future assets often long before they are produced. Second, there is high uncertainty about the prospects of the blockchain industry overall. If left unaddressed, asymmetric information may cause market failure (Akerlof, 1978). In a market where investors cannot discern the quality of a token, equilibrium pricing of the token will settle on the population average, which crowds out high-quality tokens and crowds in low-quality tokens, resulting in an erosion of venture quality. Therefore, to prevent market failure, entrepreneurs and investors have incentives to create mechanisms that reduce information asymmetry.
Standard theory suggests that entrepreneurs can reduce information asymmetry by sending signals of venture quality (Colombo, 2021; Leland & Pyle, 1977). In their seminal analysis, Leland and Pyle (1977) predict that high-quality ventures will retain an equity share, while low-quality ventures will sell equity whenever possible. The result is a separating equilibrium, which resolves the asymmetric information problem in startup financing. This concept of signalling through equity retention has been applied to venture capital (Busenitz et al., 2005), equity crowdfunding (Ahlers et al., 2015; Vismara, 2016), and token offerings (Davydiuk et al., 2023; Fisch, 2019).
Asymmetric information problems can also be mitigated if trustworthy and informed third parties provide an effective signal by certifying a venture’s quality to the market through their investment (Hsu, 2004). For example, ventures have started to use audits of their technology (so-called smart contract audits) by third-party assurance providers as a signal (Bourveau et al., 2023; Knechel et al., 2023). Similarly, we argue that the backing from institutional investors is associated with certification because institutional investors are sophisticated investors that have the resources and skills to determine a venture’s quality. Crypto funds, a new institutional player in blockchain-based crowdfunding markets, re-centralize decentralized finance to some degree by pooling funds of individual investors (Cumming et al., 2024; Zetzsche et al., 2020). They benefit from scale economies in information production and have the ability to produce information more efficiently and in a more credible way than individual crowd investors (Fisch & Momtaz, 2020).
For the certification of crypto funds to constitute an effective signal, a signal must be observable by the receiver. This requirement is fulfilled in the case of crypto fund investments because they become publicly known through online platforms such as Crunchbase or information providers such as Crypto Fund Research. To create a separating equilibrium, the signal must also come at a cost that is higher for low-performing crypto funds than for their high-performing peers. If crypto funds have built up a track record and reputation in the market, their investment provides a credible signal because it is associated with costs. Finally, expectations prompted by the certification signal must align with investor experience. Since crypto funds do not yet have a sufficiently long history, it remains an empirical question whether they are able to send a credible signal through their certification.
Crypto Funds and Tokenized Startups’ Operating Versus Financial Performance
Trade-based manipulation refers to a trader’s “attempt to manipulate a stock simply by buying and then selling, without taking any publicly observable actions to influence the value of the firm or releasing false information to change the price” (Allen & Gale, 1992, p. 505). In efficient markets, and under certain conditions, profitable manipulation is impossible (Jarrow, 1992). When a trader tries to buy, the price is driven up, and when he tries to sell, the price is driven down. Therefore, the trader “buys high” and “sells low,” and it is impossible to make a profit. On the face of the argument, any attempt by institutional investors to engage in profitable price manipulation, that is, deliberately exploiting superior information and market power as certifying authorities only to impact prices in their favor, should be self-defeating. At some point, the certification signal will no longer align with investors’ experience and lose credibility.
In traditional entrepreneurial finance markets, where institutions are locked into their investments for several years due to the illiquidity of the market for startups, this positive view of certification seems justified. However, the conclusion may be quite different in the context of tokenized startups that can be traded in liquid secondary markets. Liquid markets allow institutional investors to quickly dump their investments after their certification has paid off. Given the high level of information asymmetry in ICO markets, crypto funds may be well aware of their impact on the prospective portfolio venture’s value and of their power to impact token prices through certification, which they exploit to extract private benefits. They start with a zero holding of a token, build up their position, and other investors follow, which may lead to a “price momentum,” that is, the token price increase caused by the fund’s trade at one date tends to increase the token price at future dates (Allen & Gale, 1992; Jarrow, 1992). This momentum allows funds to unwind their position at a profit. To further aggravate the problem, while a crypto fund’s engagement is observable to other investors from online platforms or information providers, information about its exit is not available, making it difficult for investors to gauge fund success. These conditions create a profit opportunity in entrepreneurial finance markets, which we refer to as certification exploitation.
Cryptocurrency market manipulation activities known as “pump-and-dump” schemes have received some scholarly attention recently (Dhawan & Putnins, 2022; Gandal et al., 2018; Hamrick et al., 2021; Li et al., 2023). Under such schemes, pump group administrators publicly declare that they are pumping a coin (i.e., they release a pump signal) and invite others to join. Other investors rush to buy the coin, hoping to sell before the collapse of the pumped coin’s price. The pump-and-dump mechanism we describe here is different in that crypto funds do not actively call on others to pump a token. It is rather more similar to Allen and Gale’s (1992) concept of trade-based manipulation. They document that this strategy can become profitable when investors are unable to distinguish between informed trading and manipulation but suspect that the manipulator is informed. It is this pooling equilibrium in a market with incomplete information, in which investors with different characteristics choose the same trade, that allows manipulation to be profitable.
Certification exploitation may exacerbate managerial myopia, which is the phenomenon where “managers tend to make decisions that yield short-term gains at the expense of the long-term interests of the shareholders” (Narayanan, 1985, p. 1469). The theory of myopia suggests that long-term, uncertain projects are difficult to communicate. Information asymmetry prevents managers from accurately communicating the true value of assets to the market. Investors misunderstand any temporary change in earnings associated with long-term investments as bad news and depress the share price. As a result of market pressure, with impatient investors, myopic managers forego these projects, that is, they avoid investments that enhance operating efficiency in the long term and focus instead on projects that are only good for financial performance in the short term (Stein, 1989).
The presence of institutional investors, while generally regarded as beneficial (Dasgupta et al., 2021; Döring et al., 2021), can intensify pernicious short-termism. For example, survey evidence from McCahery et al. (2016) indicates that short-term institutional investors are less likely to invest in extensive monitoring and information collection. Bushee (1998) and Aghion et al. (2013) document that short-term institutional ownership promotes myopic investment behavior such as reducing R&D expenditures to counteract a decline in earnings. Hedge funds rarely think beyond a 2-year investment horizon (Brav et al., 2008). To generate a quick return, activist hedge funds often require that target companies cut their costs (Gillan & Starks, 2007; Westphal & Bednar, 2008), reduce investments (Bebchuk et al., 2015), and reallocate assets to free up funds to pay dividends (Brav et al., 2015; Chen & Feldman, 2018). 10
Taken together, we argue that the role of institutional investors in firms is not uniformly beneficial for tokenized startups. If crypto funds engage in what we call certification exploitation and only pursue a quick exit, which is an obvious strategy in liquid secondary markets for tokens, they will neglect to improve a startup’s operating performance for short-term financial returns. Formally, our main hypotheses, the Operating Underperformance Hypothesis and the Financial Outperformance Hypothesis, are:
As with many predictions in entrepreneurial finance research, the predicted effects may be heterogeneous (Newbert et al., 2022). In particular, the first two hypotheses are likely to be contingent on different types of crypto funds. Crypto funds are usually either business model-oriented (crypto venture funds) or more quantitative (crypto hedge funds) investors. Based on the activist hedge fund literature (see Brav et al. [2022] for a review), one would predict that the effects are more pronounced for crypto hedge funds. While there exits empirical evidence that interventions by activist hedge funds lead to improvements in target firms (Bebchuk et al., 2015; Brav et al., 2008), opponents of hedge fund activism are more pessimistic. In particular, although both financial and operating performance in the year following intervention are positive, these initial improvements may be unstable, for example, because they have been achieved purely through financial engineering such as shareholder distributions or increased leverage. For example, as described in Brav et al. (2022), activists may benefit at the expense of long-term shareholders through pump-and-dump schemes. The activist may sell the target’s shares after earning a short-term profit, while leaving the firm in a worse operating situation than before. In contrast, venture capital funds often have longer-term investment horizons and additionally provide non-financial services, such as board advice or access to their network (Cumming, 2008; Cumming et al., 2005; Cumming & Johan, 2013; Kaplan & Stromberg, 2001; Metrick & Yasuda, 2021). Empirical support for venture capital certification is evidenced by superior operating performance of venture-backed IPOs compared to non-venture-backed IPOs (Coakley et al., 2007; Jain & Kini, 1995). Based on these arguments, we hypothesize that the negative effect on operating performance and the positive effect on financial performance are more pronounced for crypto hedge funds when compared with their venture-style peers:
Optimal Timing for Token Offerings Along Startups’ Life-Cycle
Entrepreneurs can time the issuance of their tokens. Benninga et al. (2005) discuss that the timing of raising venture finance on public markets involves a trade-off between the benefits of being publicly traded and the associated costs. As a result, timing is likely to have an impact on the success of a fundraising campaign. Opp (2019) and Bellavitis et al. (2022) show that macroeconomic conditions affect the timing and success of ventures’ financing decisions. In addition to market timing, the timing of an investment during the life-cycle of a startup plays a critical role as well. Gompers (1995) document that venture capitalists typically concentrate their investments in the early stages of ventures as well as high-technology projects, where information asymmetry is most pronounced. This is because early-stage venture capitalists usually specialize in seed financing and are more efficient in assisting a venture during early-stage financing rounds than other professional investors (Schwienbacher, 2013). However, little is known about the optimal timing of an ICO with regard to the startup’s development stage along its life-cycle, ranging from idea to operating success. We argue that the optimal timing to raise external venture financing on public markets along a startup’s life-cycle involves two trade-offs. In particular, it is a function of, first, the advantages and disadvantages of pivoting from being a private firm to going public (Benninga et al., 2005) and, second, the costs and benefits of conducting the token offering per se.
According to the theoretical analysis of Benninga et al. (2005), pivoting from private to public company status involves a trade-off between giving up private benefits of control on the one hand and cashing out and benefiting from a higher firm value as a public company on the other hand. An entrepreneur’s private benefits of control include, among others, the status and prestige of being an entrepreneur, the lower regulatory burden of a private entity, and utility-maximizing behavior and decisions that generate agency costs for the firm (Hart & Moore, 1995). However, pivoting to the status of a public company also brings value-increasing benefits, including external scrutiny in the form of management monitoring (Holmström & Tirole, 1993), marketability and liquidity of shares (Amihud & Mendelson, 1988), and information in the form of market prices that guide management (Dow & Gorton, 1997). Outside investors, because they are more diversified, should also be willing to pay a higher price for shares than underdiversified entrepreneurs (Leland & Pyle, 1977). Furthermore, there are costs associated with being a public company, including transaction costs such as advisory fees, maintenance costs such as resources for investor relations, and strategic costs in the form of information disclosure to competitors.
From a capabilities perspective, there is a trade-off between the learning advantages of newness and the liability of newness when startup firms enter new markets such as the market for tokens. For example, building on work by Autio et al. (2000) and Sapienza et al. (2006), Yan and Williams (2021) document an inverted U-shaped relationship between a venture’s growth trajectory and its age at the time of international market entry. The learning advantages of newness stem from the fact that far-reaching decisions, such as conducting a token offering, expose the venture team to high uncertainty (Colombo et al., 2021; Fisch, 2019; Momtaz, 2021a, 2022a), which requires them to develop new routines, rules, and skills to adjust to the new environment. Therefore, when token offerings lead to improved capabilities in the venture’s team, venture value will eventually increase. In contrast, the liability of newness comes about exactly because of the lack of existing roles, rules, and capabilities, as well as the lack of legitimacy with external stakeholders. In particular, firms could fail to develop such capabilities or may institute suboptimal routines or rules that limit the benefits of developing this capability (Bingham et al., 2019), for example, because they are confronted with “overload” that makes learning difficult (Frank & Magnone, 2011). Furthermore, for a venture to conduct a token offering represents a “big step” that requires significant financial, attentional, and cognitive resources (Momtaz, 2020). It also leads to a limbo period between a successful offering and the establishment of a liquid market for the exchange of tokens, a period during which 70% to 80% of all ICO ventures fail (Cumming et al., 2024; Momtaz, 2021c).
To reduce the liability of newness, the startup may opt for a waiting period before conducting a token offering. However, when waiting too long, inertia and rigidity set in, and the learning advantages of newness eventually vanish. We conclude that token offerings require prohibitively costly investments for startups during the pre-seed and seed phases, whereas there are hardly any remaining benefits from conducting a token offering at later stages in the life-cycle.
Overall, given that we have information on both financial and operating performance, we are able to relate these two metrics to each other. Specifically, we analyze when is the best time along a venture’s life-cycle to conduct an ICO in terms of financial success, measured as the funding amount and token return performance in the secondary market. Our final hypothesis, the Optimal Timing Hypothesis, is:
Data and Stylized Facts
Data Sources and Sample Construction
To assess the operating and financial performance of tokenized startups, we build on the Token Offerings Research Database (TORD), which was established in connection with the research project of Cumming et al. (2024). 11 It represents one of the largest and also most comprehensive databases on token-based crowdfunding (Momtaz, 2022b), aggregating data from various sources, including ICObench, ICOmarks, GitHub, and LinkedIn, for more than 6,000 startups.
We adopt the manual mapping of the TORD to token performance and crypto fund data from Cumming et al. (2024). Performance data are taken from the CoinMarketCap database and include secondary market prices, market capitalization, and trading volume of utility tokens until October 2020. We measure the financial performance of startups using buy-and-hold abnormal token returns compared to the value-weighted market index. Crypto fund data is from Crypto Fund Research and provides information about a fund’s investment strategy (crypto venture fund or crypto hedge fund) and which startups received crypto fund backing. To measure a startup’s operating performance, we expand the TORD using a set of operating indicator variables. We draw on self-reported milestone data from ICObench and manually cluster them into milestone steps along a typical startup life-cycle for developing a new product or service. Our milestone categories are based on widely discussed steps in the literature related to new product development. For example, Cooper (1990, 1999) introduces the “stage-gate process” for new product development with six steps: idea generation, scoping, business case building, development, testing and validation, and launch. Blank (2020) describes a similar development path.
Starting from this general concept, we extensively review the data to understand what are the commonly reported milestone themes and how best to adapt this concept to the development of blockchain-based software products. Based on this review, we determine multiple search phrases for each milestone step and manually verify whether the milestone description of each search hit in ICObench actually matches the respective step. This process results in our set of 7 milestone steps: idea, proof of concept (PoC), prototype, pilot, minimum viable product (MVP), full product, and operating success. 12 Our first 6 milestones match the steps from Cooper (1990, 1999), but are specified to the nuances of software development and the terminology encountered in our dataset. Our last milestone, operating success, is an extension of Cooper’s (1990, 1999) original concept.
The milestone Idea represents the first step at the start of the venture. It is often characterized by the announcement of the startup’s founding or the initial communication regarding its idea, concept, or road map it pursues. The milestone PoC indicates that the startup has successfully validated its concept. The subsequent development of a prototype or demo version of the product or service is captured by the milestone Prototype. During the ensuing Pilot phase, this prototype is experimented with, for example, in a simulated software environment or via a trial version for a selected number of test users. After the successful piloting, a minimum viable product is developed and initially launched with limited functionality and/or for a limited audience (e.g., a specific geographical region or operating system). Based on experiences at this milestone, MVP, the next milestone, Full product, is defined as the release of the first full version of the product or service to a broader market. Usually, this launch takes place across various operating systems and is referred to as the official release. The final milestone, Operating success, identifies two directions of further development: the expansion in the number of users and the realization of first profits.
To mitigate a potential survivorship bias, our final sample is a truncated subset of the clustered milestones. The truncated sample contains startups that either reached the last milestone (Operating success) or stopped reporting milestones. For each milestone, we measure the third quartile amount of time that is necessary to achieve the next milestone. Milestone data were collected until March 31, 2021. If at this date more than the third quartile amount of time has passed since the last milestone, it is assumed that the startup has stopped reporting and failed at the last milestone step. Our final sample consists of 3,864 startups reporting at least 1 milestone.
Table 1 illustrates how many startup companies reached each milestone. Only 725 or 18.8% of all startups reach operating success. Conceptually, these ventures must have successfully run through all preceding milestones. However, we are not always able to identify all preceding milestones. For example, for a startup we may be able to capture all milestones except PoC. This can result from a missing update by the venture or because our clustering approach did not recognize this milestone. In those cases, we consider missing preceding milestones to be implicitly achieved and add milestone dates based on the sample mean duration between two steps. The resulting final sample contains 20,431 milestones across all startups.
Sample Distribution.
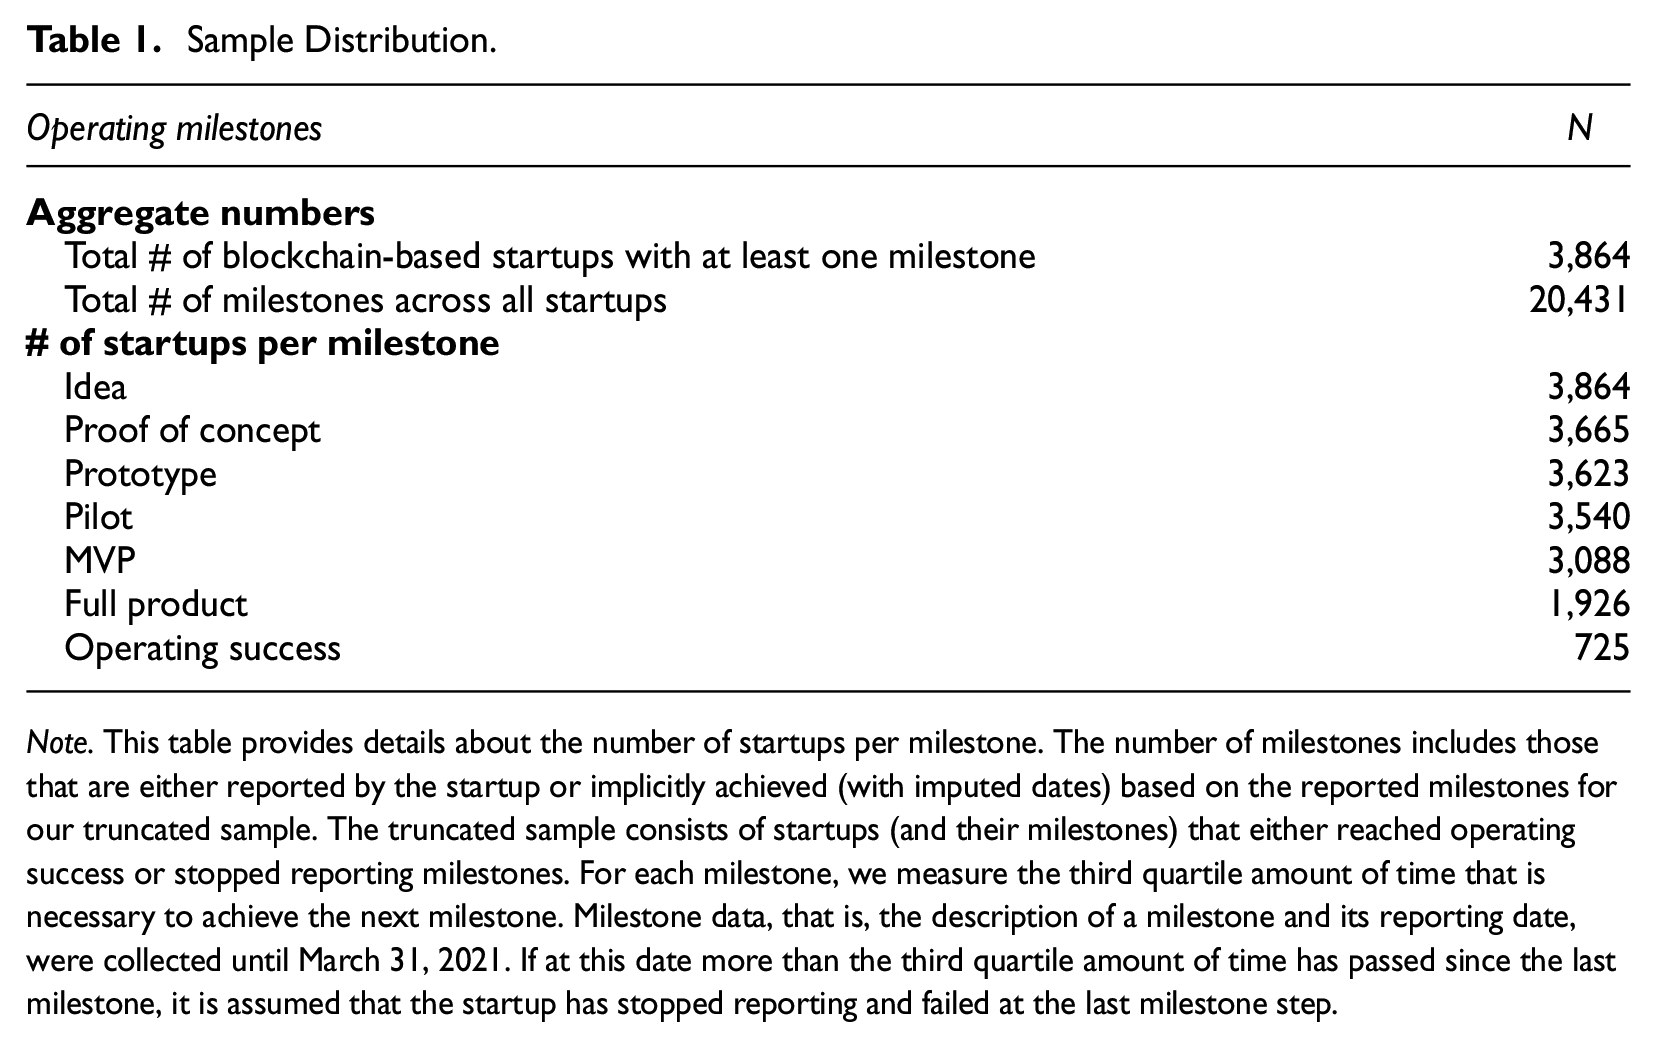
Note. This table provides details about the number of startups per milestone. The number of milestones includes those that are either reported by the startup or implicitly achieved (with imputed dates) based on the reported milestones for our truncated sample. The truncated sample consists of startups (and their milestones) that either reached operating success or stopped reporting milestones. For each milestone, we measure the third quartile amount of time that is necessary to achieve the next milestone. Milestone data, that is, the description of a milestone and its reporting date, were collected until March 31, 2021. If at this date more than the third quartile amount of time has passed since the last milestone, it is assumed that the startup has stopped reporting and failed at the last milestone step.
Figure 1 shows how the number of reported and imputed milestones is distributed along the startups’ life-cycle. By design, reaching operating success is based entirely on reported data. Two milestones are predominantly self-reported by startups: (i) the initiation of the venture (Idea), and (ii) the time at which a startup has reached or is close to reaching a final product that it can launch to the general audience (milestones MVP or Full product). In contrast, the milestones PoC and Prototype are often not explicitly reported by startups.
Startups and operating milestones: Sample distribution.
Due to limitations on data availability, we group the 7 milestones into a higher-level clustering for some of our analyses. In particular, we cluster the first 2 milestones, Idea and PoC, into an Ideation phase and the last 2 milestones, Full product and Operating success, into a joint cluster also called Operating success, for a total of 5 milestone clusters. We explicitly state in which analyses we apply the five clusters instead of the 7 milestones. 13
Variable Definitions
Operating Performance
The extracted milestones are the basis for our measures of startups’ operating performance. We use them to define two dummy variables. First, we encode Operating success as one if a startup has reached the last milestone, and zero otherwise. Second, we encode Full product as one if a startup has reached at least this penultimate milestone, and zero otherwise.
Financial Performance
Financial performance of startups is measured along two dimensions. First, consistent with prior research on blockchain-based ventures (Fisch, 2019), we measure firm valuation at the time of the ICO as the natural logarithm of the total funding amount (in $). Second, we compute buy-and-hold abnormal returns (BHARs) subsequent to the initial token listing, that is, the token return in excess of the buy-and-hold return of the aggregate token market index over 6, 12, 18, and 24 months (Fisch & Momtaz, 2020; Lyandres et al., 2022).
Independent Variables
Our main independent variable is Crypto fund, which is a dummy variable that is equal to one if a tokenized startup has received crypto fund backing, and zero otherwise. Based on the classification by Crypto Fund Research, we define two indicator variables for crypto funds’ investment strategies: Crypto venture fund and Crypto hedge fund. A company is considered to be venture (hedge) fund-style backed if it has secured funding from at least one crypto venture (hedge) fund. Therefore, when analyzing the impact of crypto fund investment strategies, a startup can either be non-backed, venture-style backed, or hedge fund-style backed.
For the assessment of a venture’s operating performance, Funding amount is our second main explanatory variable. It is measured as the natural logarithm of the total amount raised during the ICO (in $). Funding amount serves two purposes in our analysis. First, it is an important independent variable when assessing the drivers of operating success in the post-ICO period. Second, it is an outcome variable when determining the influence of crypto fund backing (together with other explanatory variables) on firm valuation at the time of the ICO.
When assessing financial performance, we focus on two additional groups of explanatory variables. First, we include the highest milestone reached before measuring a venture’s financial performance. This is either the milestone that has been accomplished at the time of the ICO (Milestone reached at time of ICO), or the milestone that has been achieved by the end of the 6- or 24-month token-holding period in the secondary market (Milestone reached after 6/24 months). Second, for the models with token returns in the secondary market, we include the speed of operating development since the ICO took place. We calculate the number of milestones a startup has completed since the issuance of tokens (and before the end of the holding period) and define the dummy variable Strong operating development since ICO as one for top-quartile performers, and zero otherwise.
Control Variables
In all models, we use a comprehensive list of control variables encompassing firm, offering, market, and human capital characteristics. All variables are detailed in Table A1 in the Appendix.
Summary Statistics
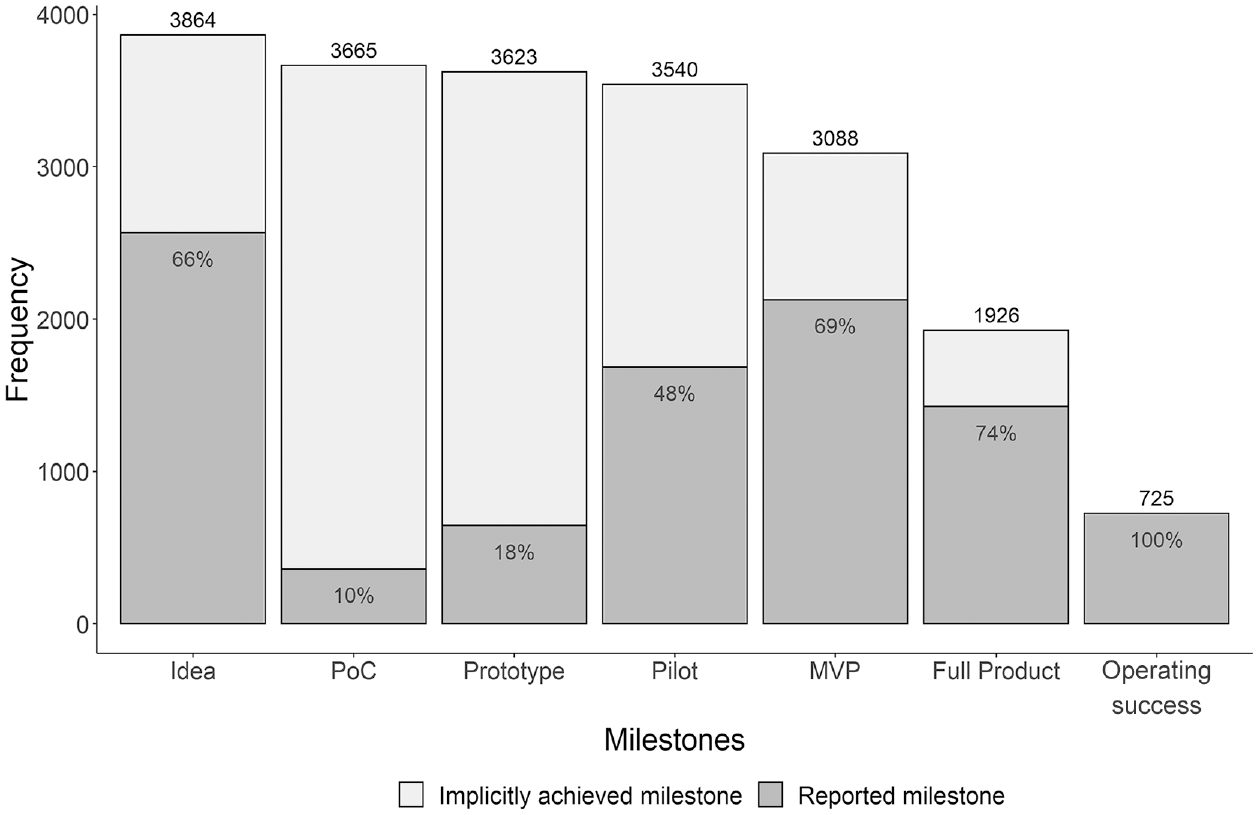
Summary statistics for operating and financial outcome variables as well as comparisons across crypto fund-backed and non-backed startups are presented in Table 2. Panel A indicates that 18.76% of all startups reach the final milestone Operating success, and 49.85% reach the penultimate milestone Full product. On average, a startup secures $2.96 million during the ICO (log = 14.902, log SD = 2.047). In the secondary market, on average, tokens generate buy-and-hold abnormal returns of −7.81% (SD = 224.30%), −43.55% (SD = 145.47%), −53.88% (SD = 118.25%), and −54.76% (SD = 79.01%) over the course of 6, 12, 18, and 24 months, respectively.
Operating and Financial Performance: Summary Statistics.
Note. This table reports summary statistics for operating and financial outcome variables. Panel A presents the performance across all startups. Panel B compares the measures between crypto fund-backed and non-backed startups. Buy-and-hold-abnormal returns (BHARs) are calculated using a value-weighted token market benchmark. All variables are defined in Table A1.
*p < .10; **p < .05; ***p < .01.
The comparison of operating and financial performance between crypto fund-backed and non-backed startups in Panel B shows that startups with crypto fund backing achieve greater financial success, while their operating performance is inferior relative to their peers without crypto fund backing. Fewer crypto fund-backed startups reach the milestones of full product or operating success (with differences of −12.89 and −6.57 percentage points, respectively). Both differences are statistically significant at the 1% level. In contrast, crypto fund-backed ventures raise more capital during the ICO (Δ in log means = 1.567) and achieve higher performance in the secondary market. The differences in average BHARs are 96.68%, 42.09%, 31.56%, and 6.72% over investment periods of 6, 12, 18, and 24 months, respectively. The statistical significance of these performance differences decreases over time. While the differences in funding amounts as well as BHARs over 6 and 12 months are statistically significant, with p-values below 1%, the significance of 18-month BHARs decreases to the 5% level. Over time, outperformance vanishes completely, and the difference is no longer statistically significant after 24 months. Overall, these patterns already provide preliminary evidence for crypto funds engaging in the behavior we call certification exploitation.
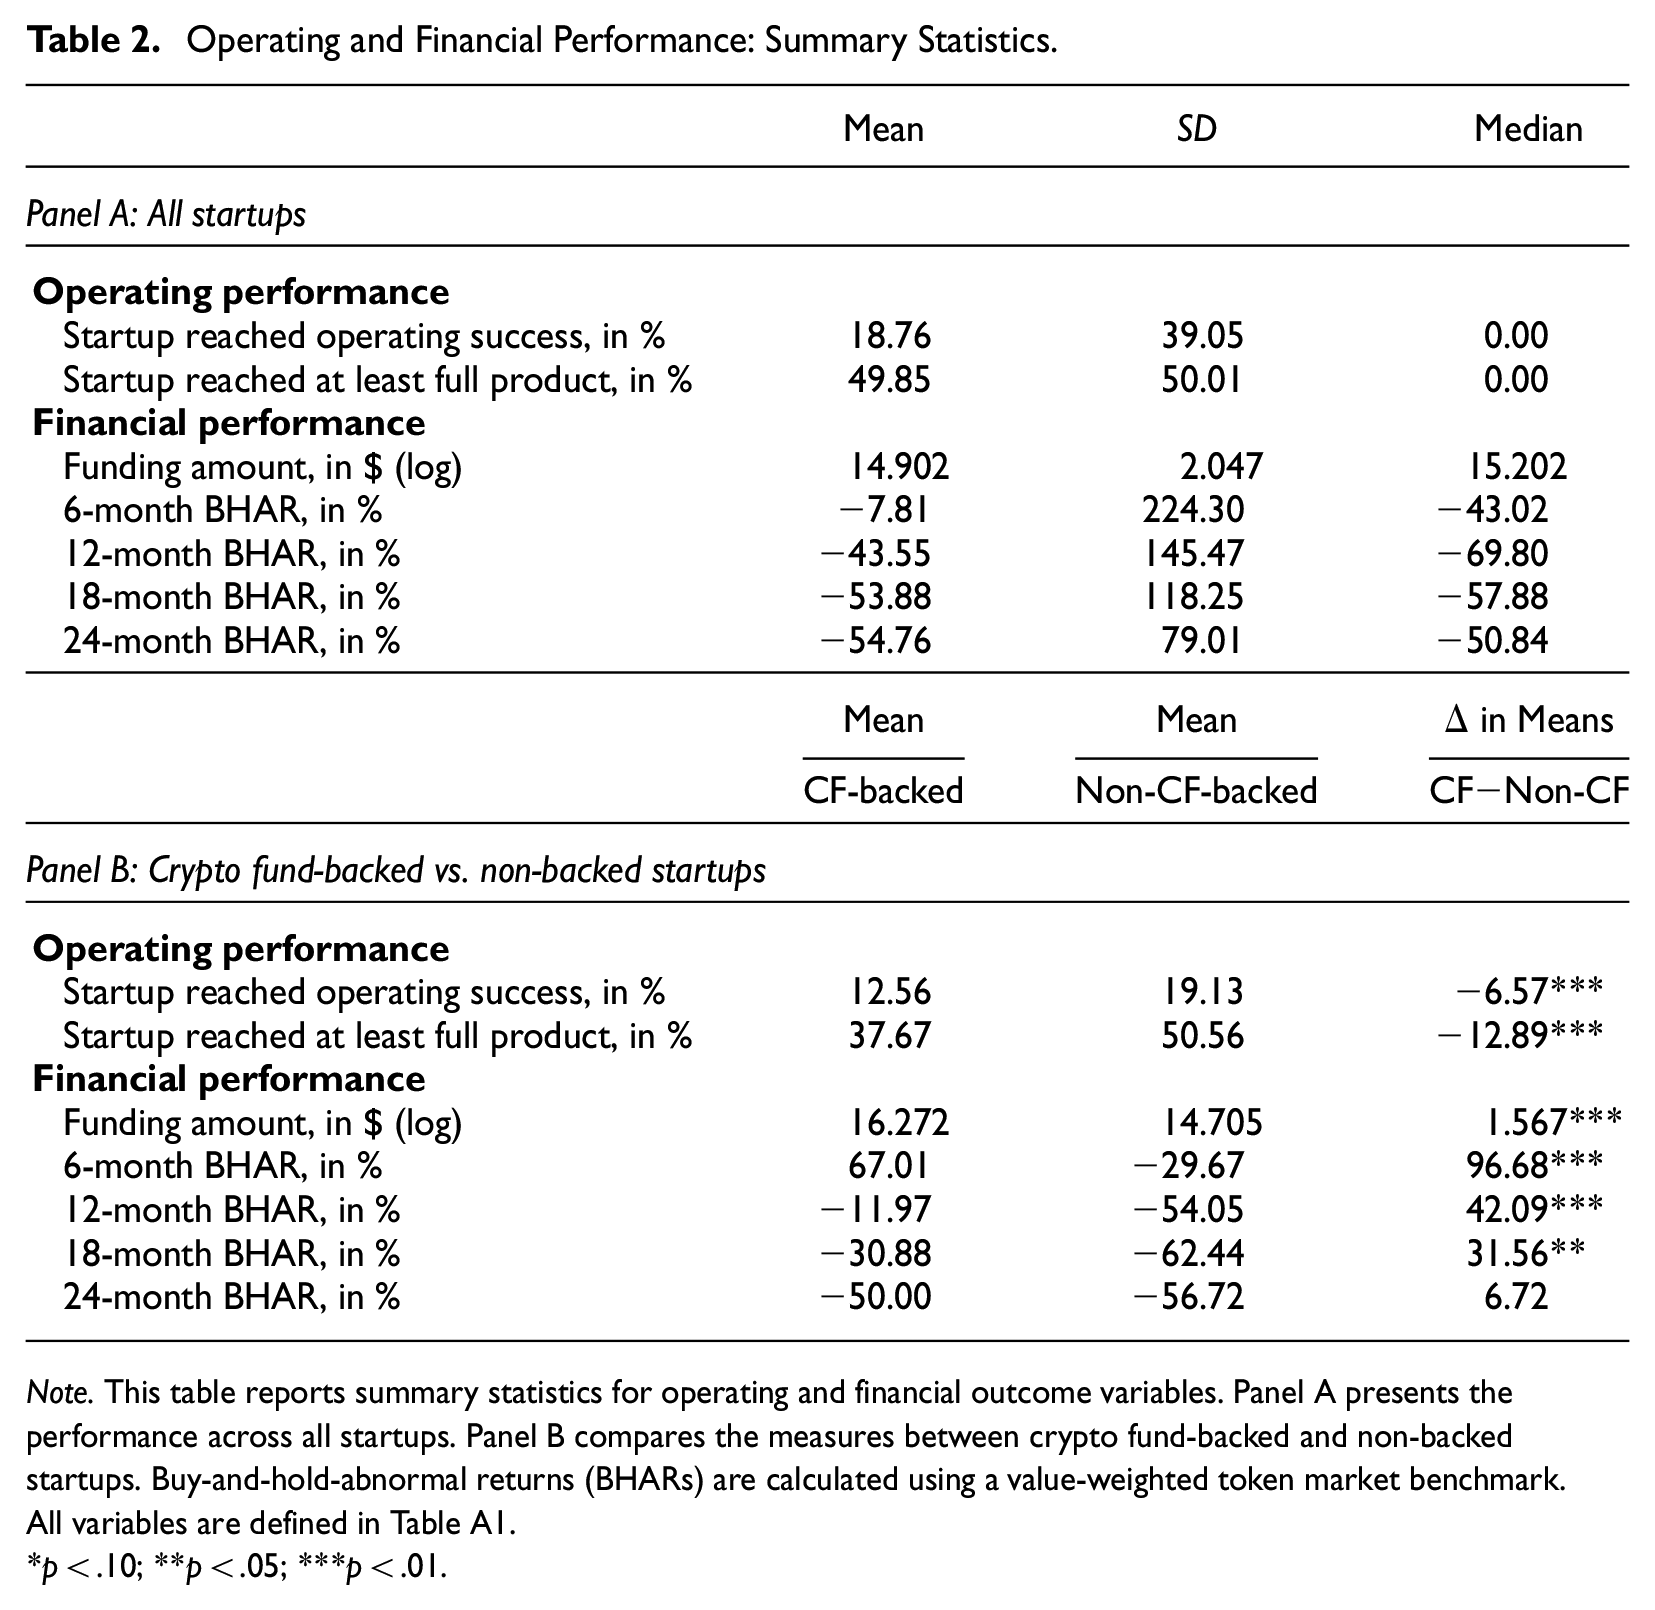
Summary statistics for operating characteristics, crypto fund backing, and control variables are shown in Table 3. The average startup conducts its token-based crowdfunding after 2.9 (SD = 1.6) milestones, indicating that the ICO takes place right before the prototyping phase is completed. On average, startups reach 4.1 (SD = 1.6) milestones after 6 months and 5.3 (SD = 1.4) milestones after 24 months. This corresponds to having achieved the milestones Piloting and MVP after 6 and 24 months of secondary market trading, respectively. It implies that the average firm accomplishes 1.3 (SD = 1.2) milestones during the 6 months and 2.7 (SD = 1.8) milestones during the 24 months following the token issuance. In addition, of all startups, only 5.6% secure crypto fund backing. Broken down by investment strategy, 3.1% of startups receive capital from crypto venture funds, and 1.7% are backed by crypto hedge funds.
Operating Characteristics, Crypto Fund Backing, and Control Variables: Summary Statistics.
Note. This table reports summary statistics for operating characteristics, crypto fund backing, and all control variables in the startup data set. For the statistics on operating variables, the 7 milestone steps are numerically encoded from 1 to 7. All variables are defined in Table A1.
On average, startups achieve an expert rating on ICObench of 3.0 (SD = 0.7), GitHub open-source code is published in 54% of all cases, a platform business model strategy is pursued by 57% of all ventures, the average startup targets 3.0 (SD = 2.4) different industries, and 87.6% of the startups’ underlying blockchain technology is built upon the Ethereum standard.
With regard to token offering characteristics, 53.5% of all startups hosted a pre-sale prior to the ICO, for which 45.7% established a know-your-customer (KYC) process. Of all ICOs in the sample, 8.2% and 31.0% are promoted with bonus and reward schemes, respectively. The average ICO faces 842 competing offerings (SD = 490). Concerning market characteristics, 18.8%, 61.2%, and 20.0% of ICOs occur during the bull, bear, and sideways market cycle, respectively. The average market volatility during an ICO is 11.9% (SD = 5.1%), measured as the standard deviation of daily returns of the value-weighted token market index during the issuance period.
Finally, we collect data on human capital characteristics. The team of the average startup in our sample consists of 11.3 members (SD = 7.2). Among the teams, 83.8%, 35.8%, and 84.6% include members with a technical degree, a PhD, and prior crypto experience, respectively. 14
Stylized Facts
This section examines (i) the duration to reach each milestone, (ii) startup survival rates, and (iii) the impact of an ICO’s timing on its financial success. Figure 2 illustrates the cumulative duration to reach each milestone after the initiation of a venture (Idea). The boxes correspond to the range of duration between the lower and upper quartiles, while the dot and the mid-hinge indicate the mean and median durations, respectively. Starting from the idea, the average startup takes about 10 months to develop the proof-of-concept, soon followed by the development of a prototype. The next milestone Pilot is achieved, on average, after 16 months, and the milestones MVP and Full product are subsequently reached in short time intervals of 2 and 3 months, respectively. The final milestone, Operating success, is achieved after 25 months, on average.
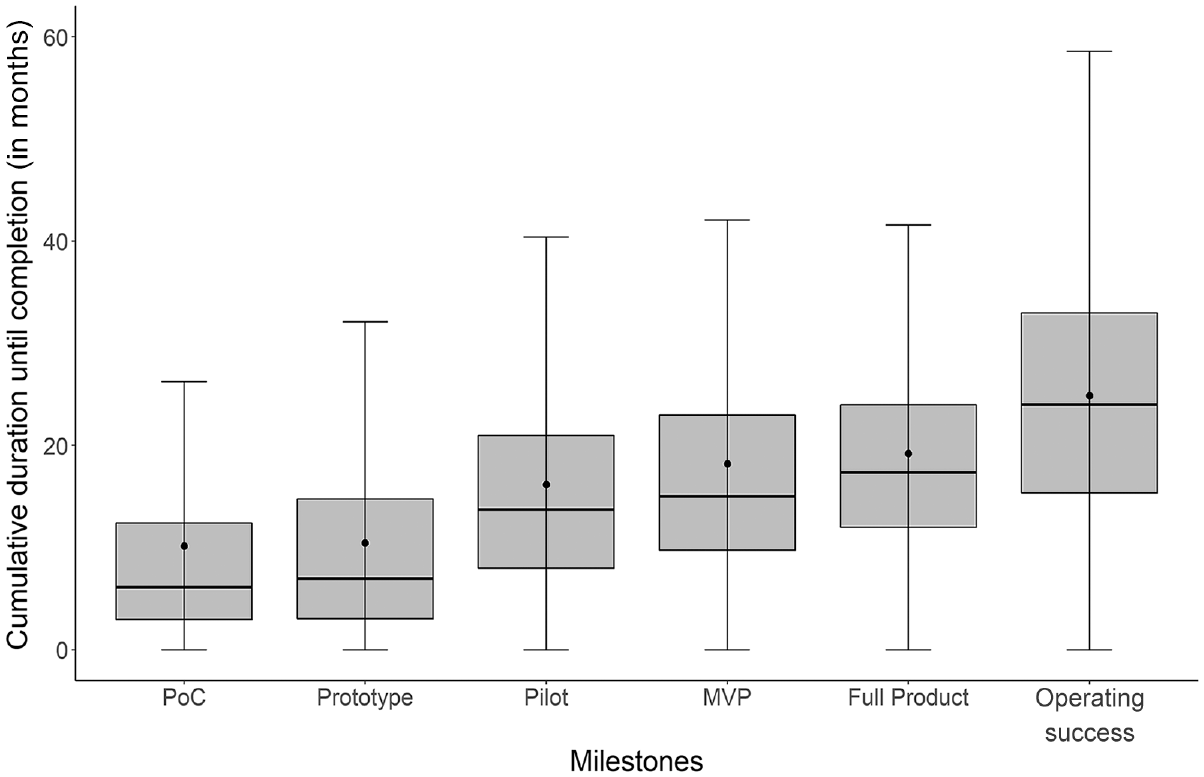
Duration to reach milestones after the idea.
Two features are noteworthy. First, the inter-quartile range indicates that operating development does not follow a narrow timeframe, but rather a broad range of paths and timelines. For example, for the operating success milestone, the inter-quartile range spans from 15 to 33 months. Second, the observed life-cycle suggests that three major development steps exist: (i) from idea to proof-of-concept, (ii) between prototype and pilot, and (iii) from full product to the last milestone, operating success.
Figure 3 shows survival probabilities along a startup’s life-cycle. Panel A displays the Kaplan-Meier curve for startup survival over time, and Panel B illustrates the same curve along the milestones (Kaplan & Meier, 1958). Regarding survival over time, Panel A indicates that the largest drop in survival rates occurs around 1.5 years following the initial idea. For example, while survival probabilities are relatively high at 81% after 12 months, the rate drops to 34% after 24 months. Once this apparently difficult period is weathered, the risk of business failure continues to increase, but at a substantially slower pace. While survival rates drop to 17% after 3 years, the chance of survival is 10%, 7%, and 3% after 4, 5, and 6 years, respectively.
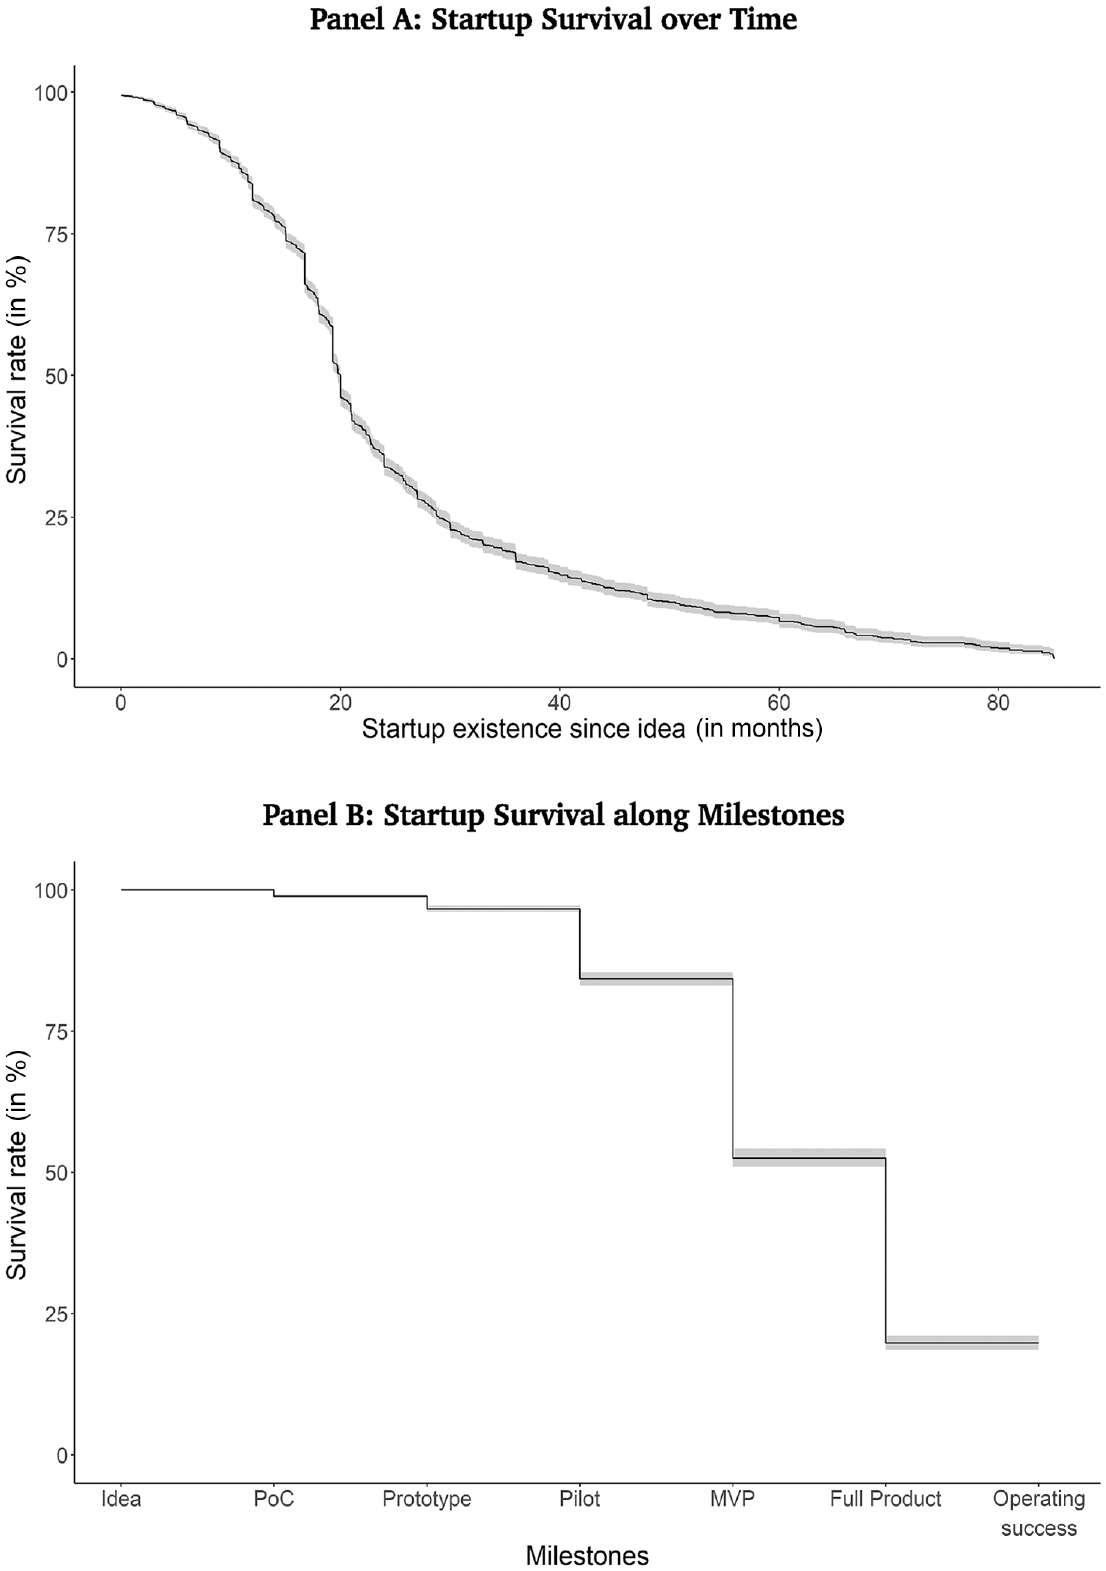
Startup milestones: Survival rates along startups’ life-cycle.
Considering survival rates along the 7 milestones, Panel B shows that the biggest declines materialize between the milestones Pilot, MVP, and Full product. The probability of surviving the pilot phase is 84%, but drops to around 20% at the full product stage, suggesting that the largest challenges must be overcome in the second half of the startup life-cycle. In our empirical analysis, we examine the underlying drivers of survival rates.
Table 4 provides a preliminary view of the interaction between financial success and the timing of a token offering over the life-cycle of the venture. Panel A shows how financial indicators differ depending on the ICO’s timing along our five milestone clusters. Panel B reports the differences in selected means. For example, while the average funding amount is $3.02 million (log = 14.92) for ICOs that take place after the milestone Ideation, firm valuation increases to $3.69 million (log = 15.12) after the milestone Pilot, and drops again to $3.11 million (log = 14.95) when the milestone Operating success has been achieved. A similar pattern can be observed for all BHARs in the secondary market. These patterns provide a first indication of an inverted U-shaped relationship between the financial performance of a token offering and its timing over the life-cycle. In other words, these preliminary results suggest that there is an optimal timing of ICOs in terms of valuation and secondary market returns.
Timing of ICOs and Financial Performance.
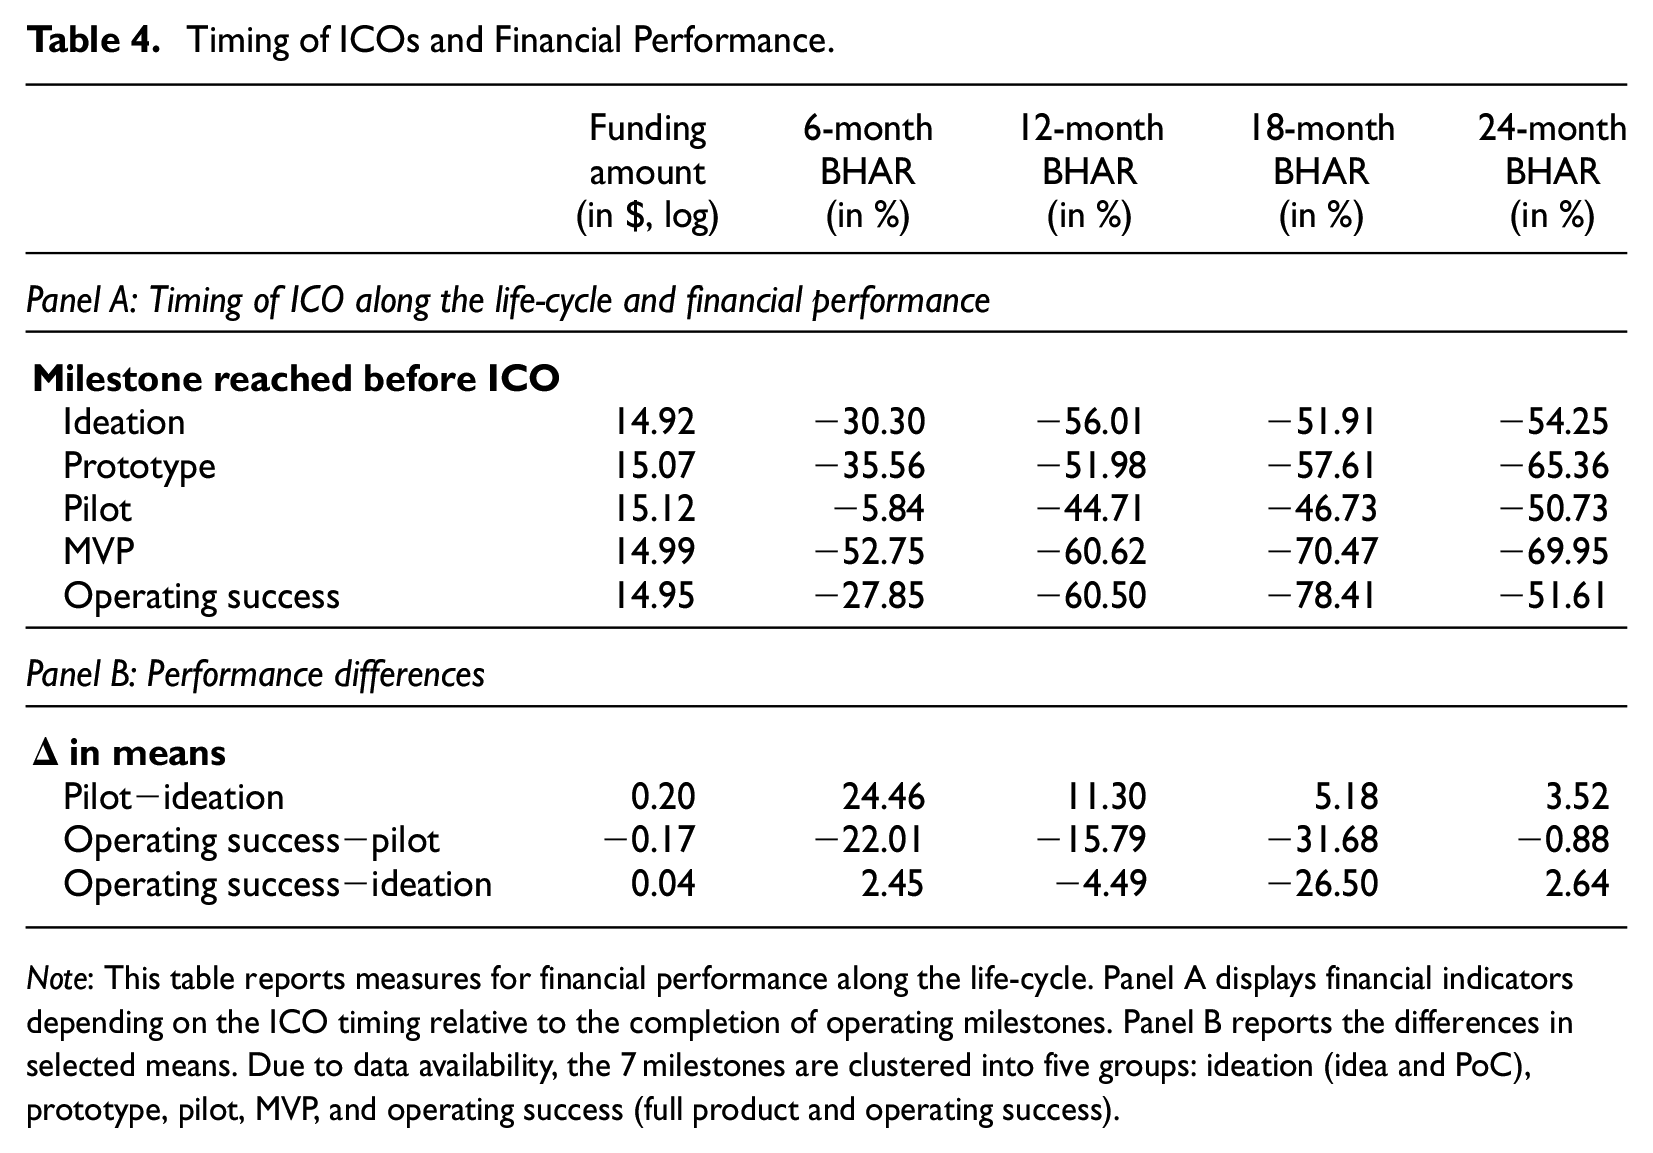
Note: This table reports measures for financial performance along the life-cycle. Panel A displays financial indicators depending on the ICO timing relative to the completion of operating milestones. Panel B reports the differences in selected means. Due to data availability, the 7 milestones are clustered into five groups: ideation (idea and PoC), prototype, pilot, MVP, and operating success (full product and operating success).
Empirical Design
In our empirical analysis, we assess the drivers behind tokenized startups’ operating performance, especially the role of crypto fund backing and the amount of capital raised during the ICO. We leverage the 2 milestones Operating success and Full product to derive two time-to-event variables. The dummy variable Operating success, combined with the time (measured in days) since the idea to either reach this milestone or terminate the business beforehand, is used to compute our first time-to-liquidation variable. Our second time-to-liquidation variable is analogously measured based on the dummy variable Full product.
Following Momtaz (2021b), frailty models, or so-called Cox proportional hazards models with random effects, best fit this kind of time-to-event analysis. Frailty models are very similar to a Cox proportional hazards model, with the main difference being that, while the Cox model requires fixed effects (e.g., country or quarter-year fixed effects), frailty models use random effects. A frailty model is generally more robust than the Cox model because the fixed effects Cox model estimates coefficients with a bias when there is heterogeneity among groups (such as countries or quarter-years; Momtaz, 2021b). In our context of ICOs, heterogeneity among groups is evident. For example, Chinese ICOs underperformed significantly due to the crypto ban in China, and ICOs during the early bull market years outperformed those during the later bear market years. The main problem with heterogeneity in groups is that the coefficients will be biased in unpredictable ways. A significantly positive coefficient estimated using the Cox model could actually be significantly or non-significantly negative. In mathematical statistics, this problem is also known as the “duration dependence problem” (Vaupel et al., 1979). Therefore, our empirical analyses of operating performance rely on frailty models to estimate the impact of crypto fund backing and the funding amount on the two time-to-liquidation variables. 15
Empirical Results
Operating Performance
Time-to-Liquidation: Main Results
Table 5 presents the empirical results for the effect of both crypto fund backing and the amount of capital raised on startups’ operating performance. The dependent variables measure failure as time-to-liquidation events. A frailty model’s data structure requires censoring information and failure time. For example, in models 1 and 4, startup liquidation is defined as the failure to achieve the milestone Operating success, coded as one if this milestone is not reached, and zero otherwise. Time is measured in days starting from the milestone Idea until the startup is terminated or operating success is achieved. Similarly, in models 2 and 5, the liquidation event is based on the achievement of the milestone Full product.
Drivers of Startups’ Operating Performance: Baseline Model.
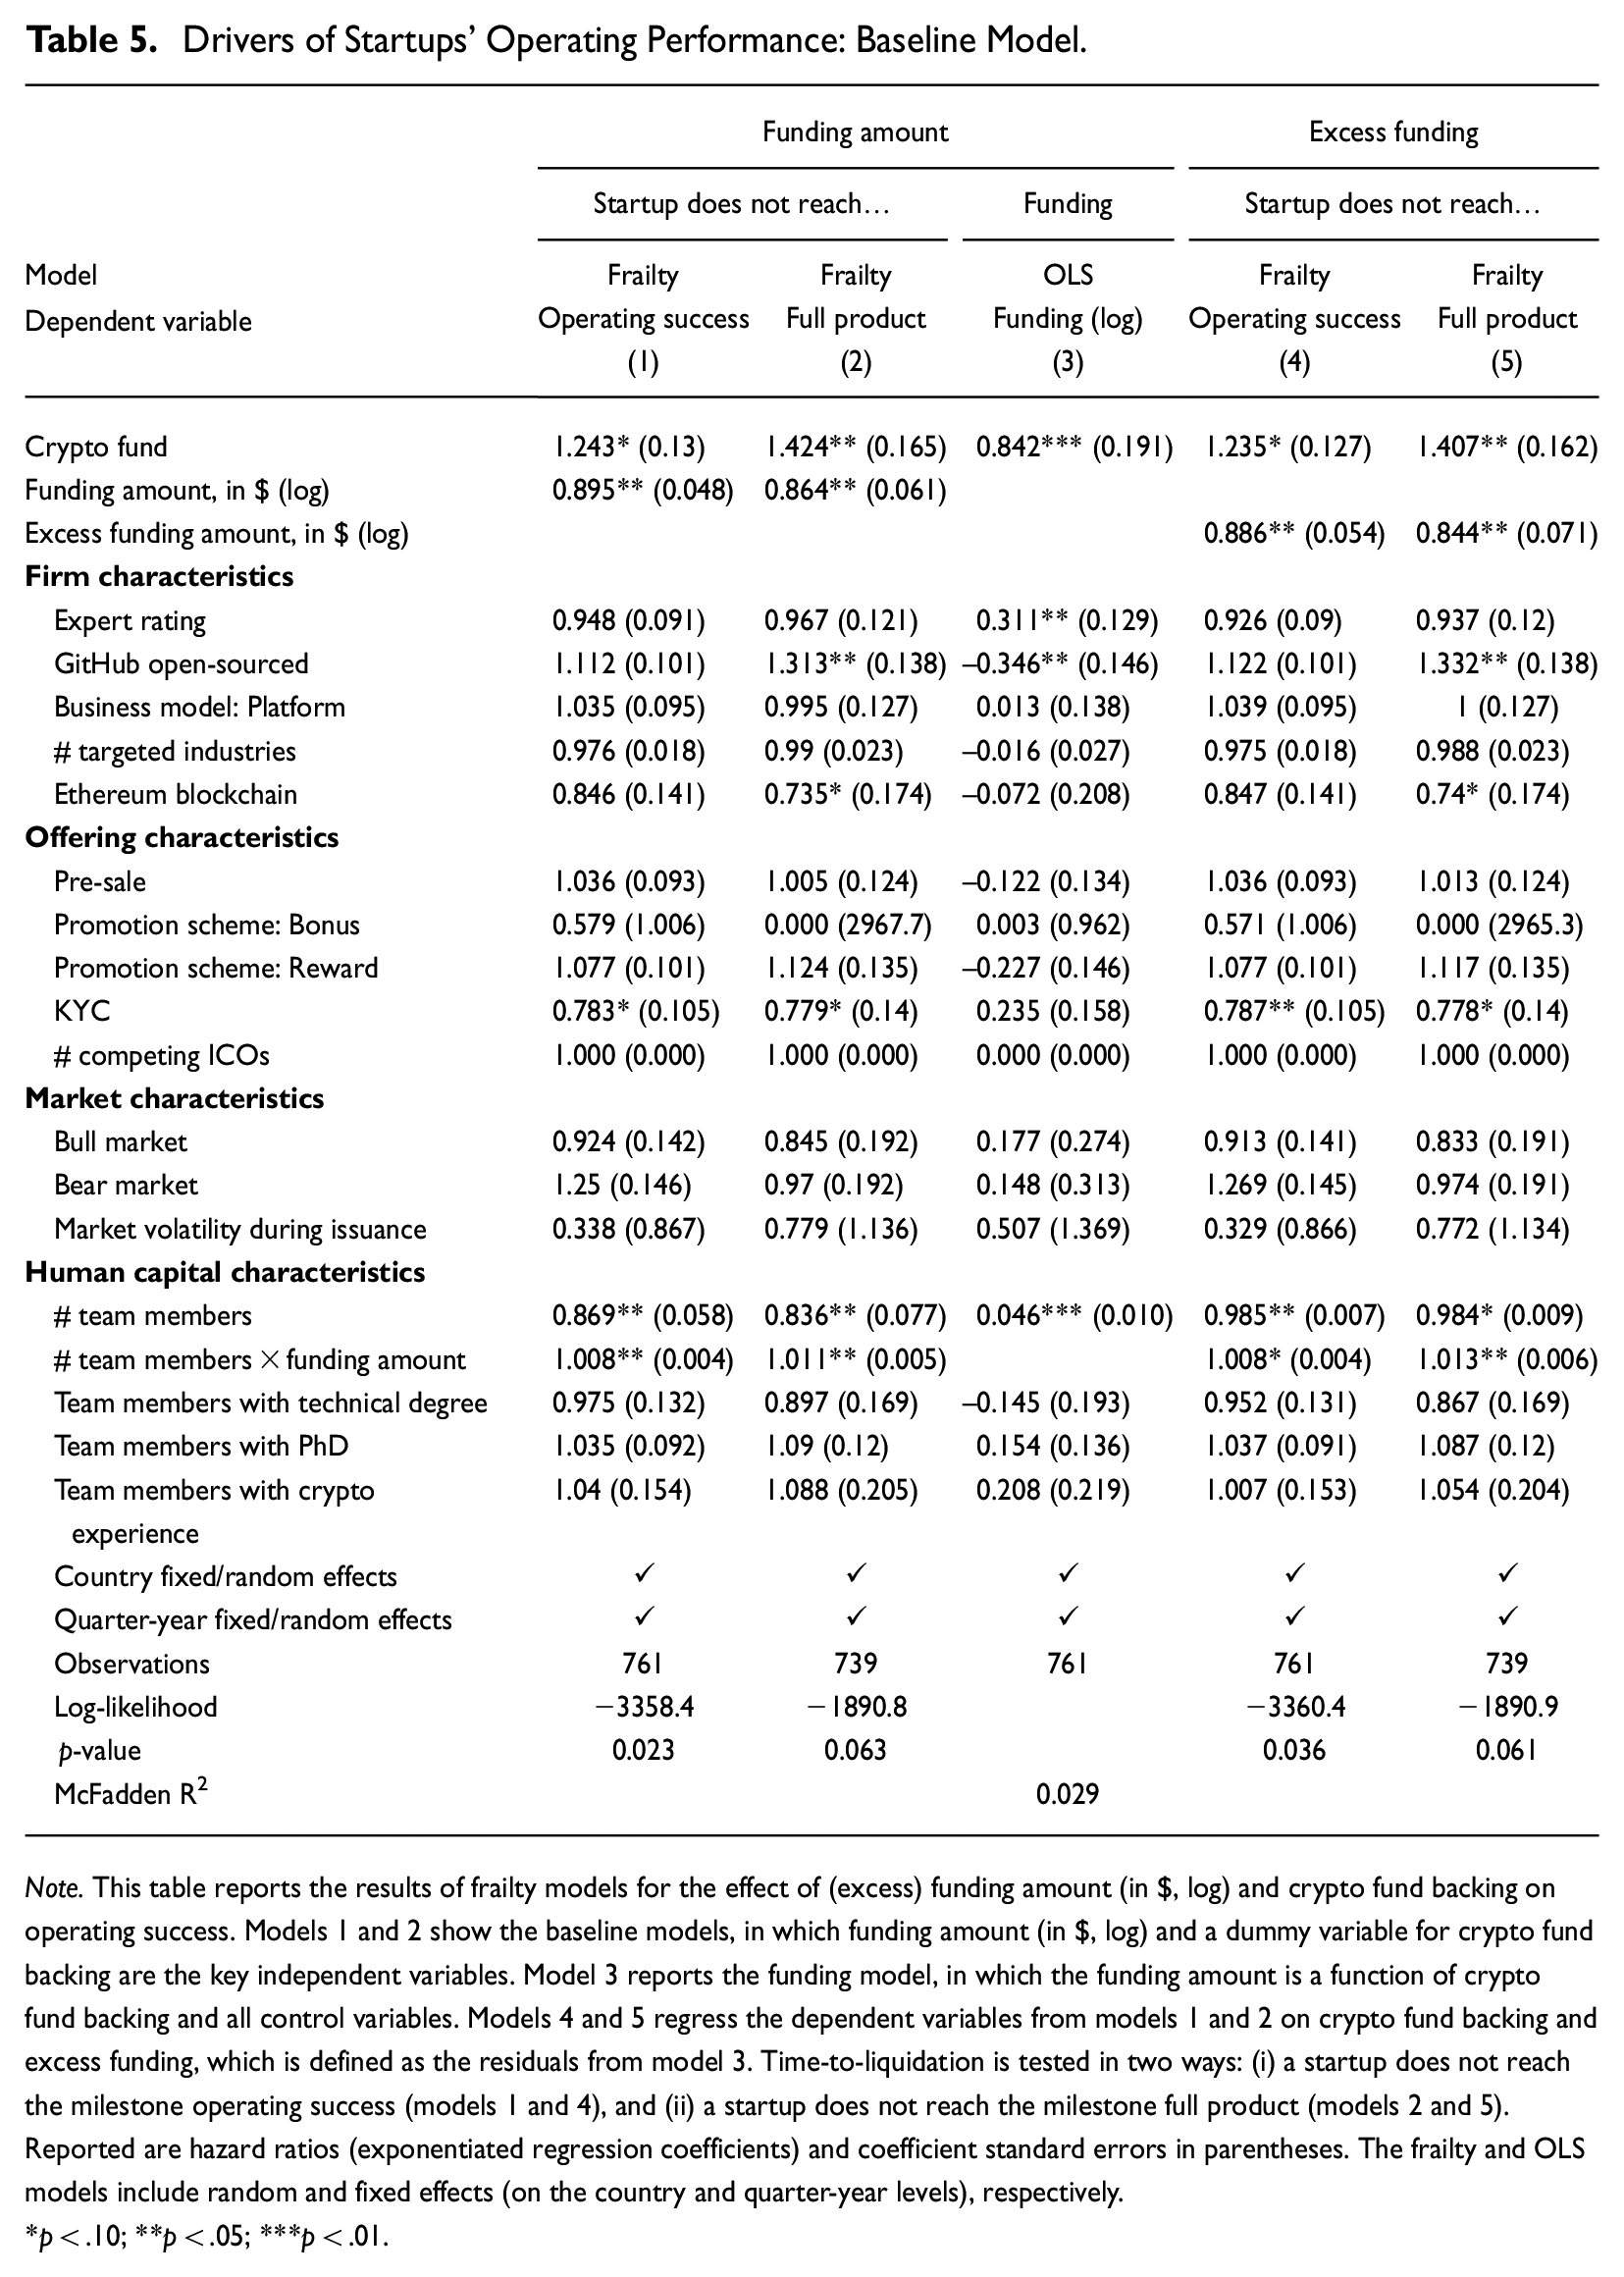
Note. This table reports the results of frailty models for the effect of (excess) funding amount (in $, log) and crypto fund backing on operating success. Models 1 and 2 show the baseline models, in which funding amount (in $, log) and a dummy variable for crypto fund backing are the key independent variables. Model 3 reports the funding model, in which the funding amount is a function of crypto fund backing and all control variables. Models 4 and 5 regress the dependent variables from models 1 and 2 on crypto fund backing and excess funding, which is defined as the residuals from model 3. Time-to-liquidation is tested in two ways: (i) a startup does not reach the milestone operating success (models 1 and 4), and (ii) a startup does not reach the milestone full product (models 2 and 5). Reported are hazard ratios (exponentiated regression coefficients) and coefficient standard errors in parentheses. The frailty and OLS models include random and fixed effects (on the country and quarter-year levels), respectively.
*p < .10; **p < .05; ***p < .01.
Our baseline models 1 and 2 estimate the impact of crypto fund backing as well as the funding amount on time-to-liquidation. Model 3 shows the funding model, in which the funding amount, defined as the natural logarithm of the capital raised during the ICO (in $), is a function of crypto fund backing. In this case, a simple OLS regression is estimated, and the residuals of this model are considered as excess funding (which can be either positive or negative). Models 4 and 5 replicate the baseline models, but test for the impact of excess funding. In all models, we control for our comprehensive set of firm, offering, market, and human capital characteristics. The frailty and OLS models include random and fixed effects (on the country and quarter-year level), respectively.
Before discussing the results in more detail, three features are worth noting. First, the number of observations differs between the frailty models based on the milestones Full product and Operating success, which is a result of the timing of token issuances. To assess the impact of the total funding amount on operating performance, at least 1 milestone needs to be achieved after the ICO has been conducted. Therefore, when considering the milestone Full product as the liquidation event, the token-based crowdfunding must have been completed before, leading to a somewhat smaller sample. Second, the coefficients in all frailty models are reported as hazard ratios (exponentiated regression coefficients) for easier interpretation. For example, with regard to crypto fund backing, the hazard ratio defines the probability of liquidation of a crypto fund-backed startup relative to a non-crypto fund-backed startup over a given time interval. An estimated coefficient greater than one indicates a higher risk of failure, whereas a coefficient less than one indicates lower risk. Third, the log-likelihood ratio tests indicate that all frailty models are significant with p-values below the 10% level.
The first result in Table 5 is that crypto fund backing shortens a startup’s time-to-liquidation, thus confirming Hypothesis 1. The estimated hazard ratios for the fund dummy variables range from 1.235 to 1.424, with statistical significance at the 5% and 10% level, depending on the model. For example, the hazard ratio of 1.243 for crypto fund backing in model 1 indicates that the presence of a fund decreases the average time-to-liquidation by 24.3%, all else equal. Or put differently, for a given time interval, the backing of a crypto fund increases the risk inherent in successfully building an operationally sound business.
A second finding relates to the amount of capital raised. Models 1 and 2 suggest that the funding amount increases the time-to-liquidation; the estimated coefficients are statistically significant, with p-values below 5%. The hazard ratios below one at 0.895 and 0.864 indicate that 10% additional funding is associated with at least a 1.1% increase in the average time-to-liquidation, holding all other parameters constant. 16 Therefore, the amount of funds secured through an ICO increases the likelihood of operating success.
Total funding may be endogenously determined by the unobserved propensity for venture success. Therefore, models 4 and 5 test whether the positive impact of the funding amount holds when using the excess amount of capital raised. In a first step, column (3) models the expected amount of capital raised as a function of all control variables used in the baseline model. In a second step, we compute excess funding as the difference between total funding and the expected amount of capital raised. Models 4 and 5 confirm that excess funding has a positive and statistically significant impact on operating performance. The hazard ratios of 0.886 and 0.844 (with p-values below 5%) are similar to those in the baseline models.
Most of our control variables have no explanatory power. Only a know-your-customer (KYC) process and team size significantly increase the average time-to-liquidation. The interaction term between team size and funding amount indicates a negative influence. We incorporate this interaction term because the impact of the total amount of funding (and thus the opportunity to acquire more external capital) on operating success may be less relevant if a larger team (with a broad and deep range of internal expertise) supports the venture. Moreover, as shown in models 2 and 5, the publication of source code on GitHub is negatively associated with the time-to-liquidation, whereas the use of the Ethereum standard shows a positive effect.
Overall, corroborating Hypothesis 1, the results in Table 5 indicate that crypto fund backing has a negative and statistically significant impact on the post-ICO operating performance of startups. The results from this baseline model further indicate that the amount of capital raised is another driver of operating performance that has a positive and statistically significant effect on the time-to-liquidation.
Time-to-Liquidation: The Role of Investment Strategies
Table 6 shows how different fund investment strategies, that is, crypto venture-versus hedge fund-style, influence the operating performance of startups. All models are specified in the same way as those in Table 5, with the difference being that the dummy variable for crypto fund backing is replaced by the two dummy variables for investment strategies. Because the estimated coefficients of the control variables are consistent with those in the baseline model, they are suppressed for the sake of brevity.
Drivers of Startups’ Operating Performance: The Impact of Crypto Funds’ Investment Strategies.
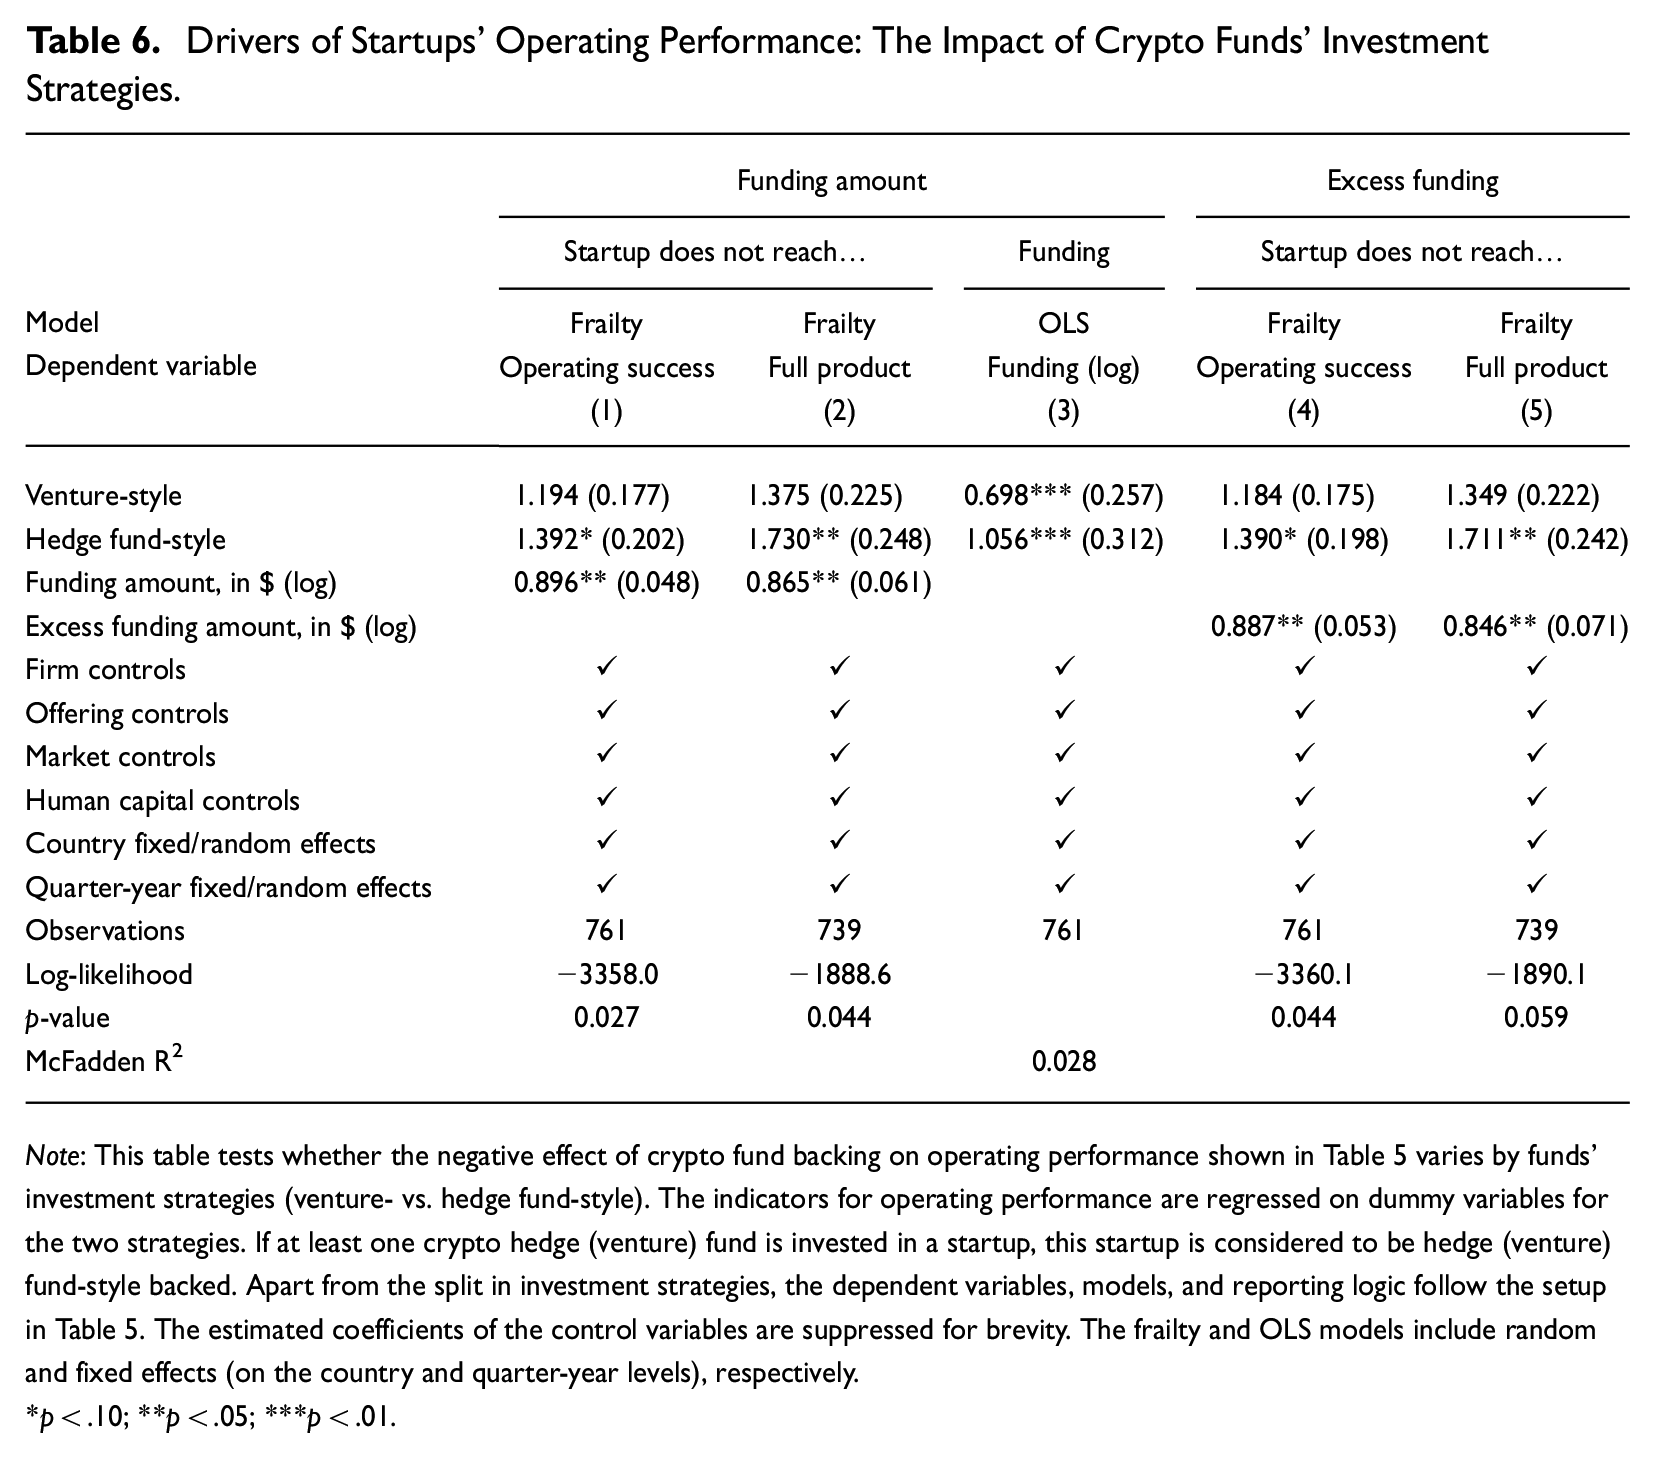
Note: This table tests whether the negative effect of crypto fund backing on operating performance shown in Table 5 varies by funds’ investment strategies (venture- vs. hedge fund-style). The indicators for operating performance are regressed on dummy variables for the two strategies. If at least one crypto hedge (venture) fund is invested in a startup, this startup is considered to be hedge (venture) fund-style backed. Apart from the split in investment strategies, the dependent variables, models, and reporting logic follow the setup in Table 5. The estimated coefficients of the control variables are suppressed for brevity. The frailty and OLS models include random and fixed effects (on the country and quarter-year levels), respectively.
*p < .10; **p < .05; ***p < .01.
All frailty models suggest that the adverse effect on operating performance is driven by hedge fund-style crypto funds. Although both venture- and hedge fund-style strategies show hazard ratios above one, only those for crypto hedge funds are statistically significant at the 5% and 10% level, depending on the model. The hazard ratios for the hedge fund-style dummy are larger than one and range from 1.390 to 1.730, indicating that backing by a crypto hedge fund decreases the average time-to-liquidation by as much as 73.0%, all else equal. For the total amount of funding as well as excess funding, the hazard ratios are similar to those in Table 5.
These findings confirm Hypothesis 3. The negative effect of crypto funds on the average time-to-liquidation is driven by crypto hedge funds. These opportunistic funds do not provide any non-financial services and usually pursue a short-term investment horizon, which can exacerbate managerial myopia. While crypto funds seem to have an adverse effect on the operating performance of tokenized startups, on average, their influence on financial success may be reversed. This possibility is explored in depth in the next section.
Financial Success
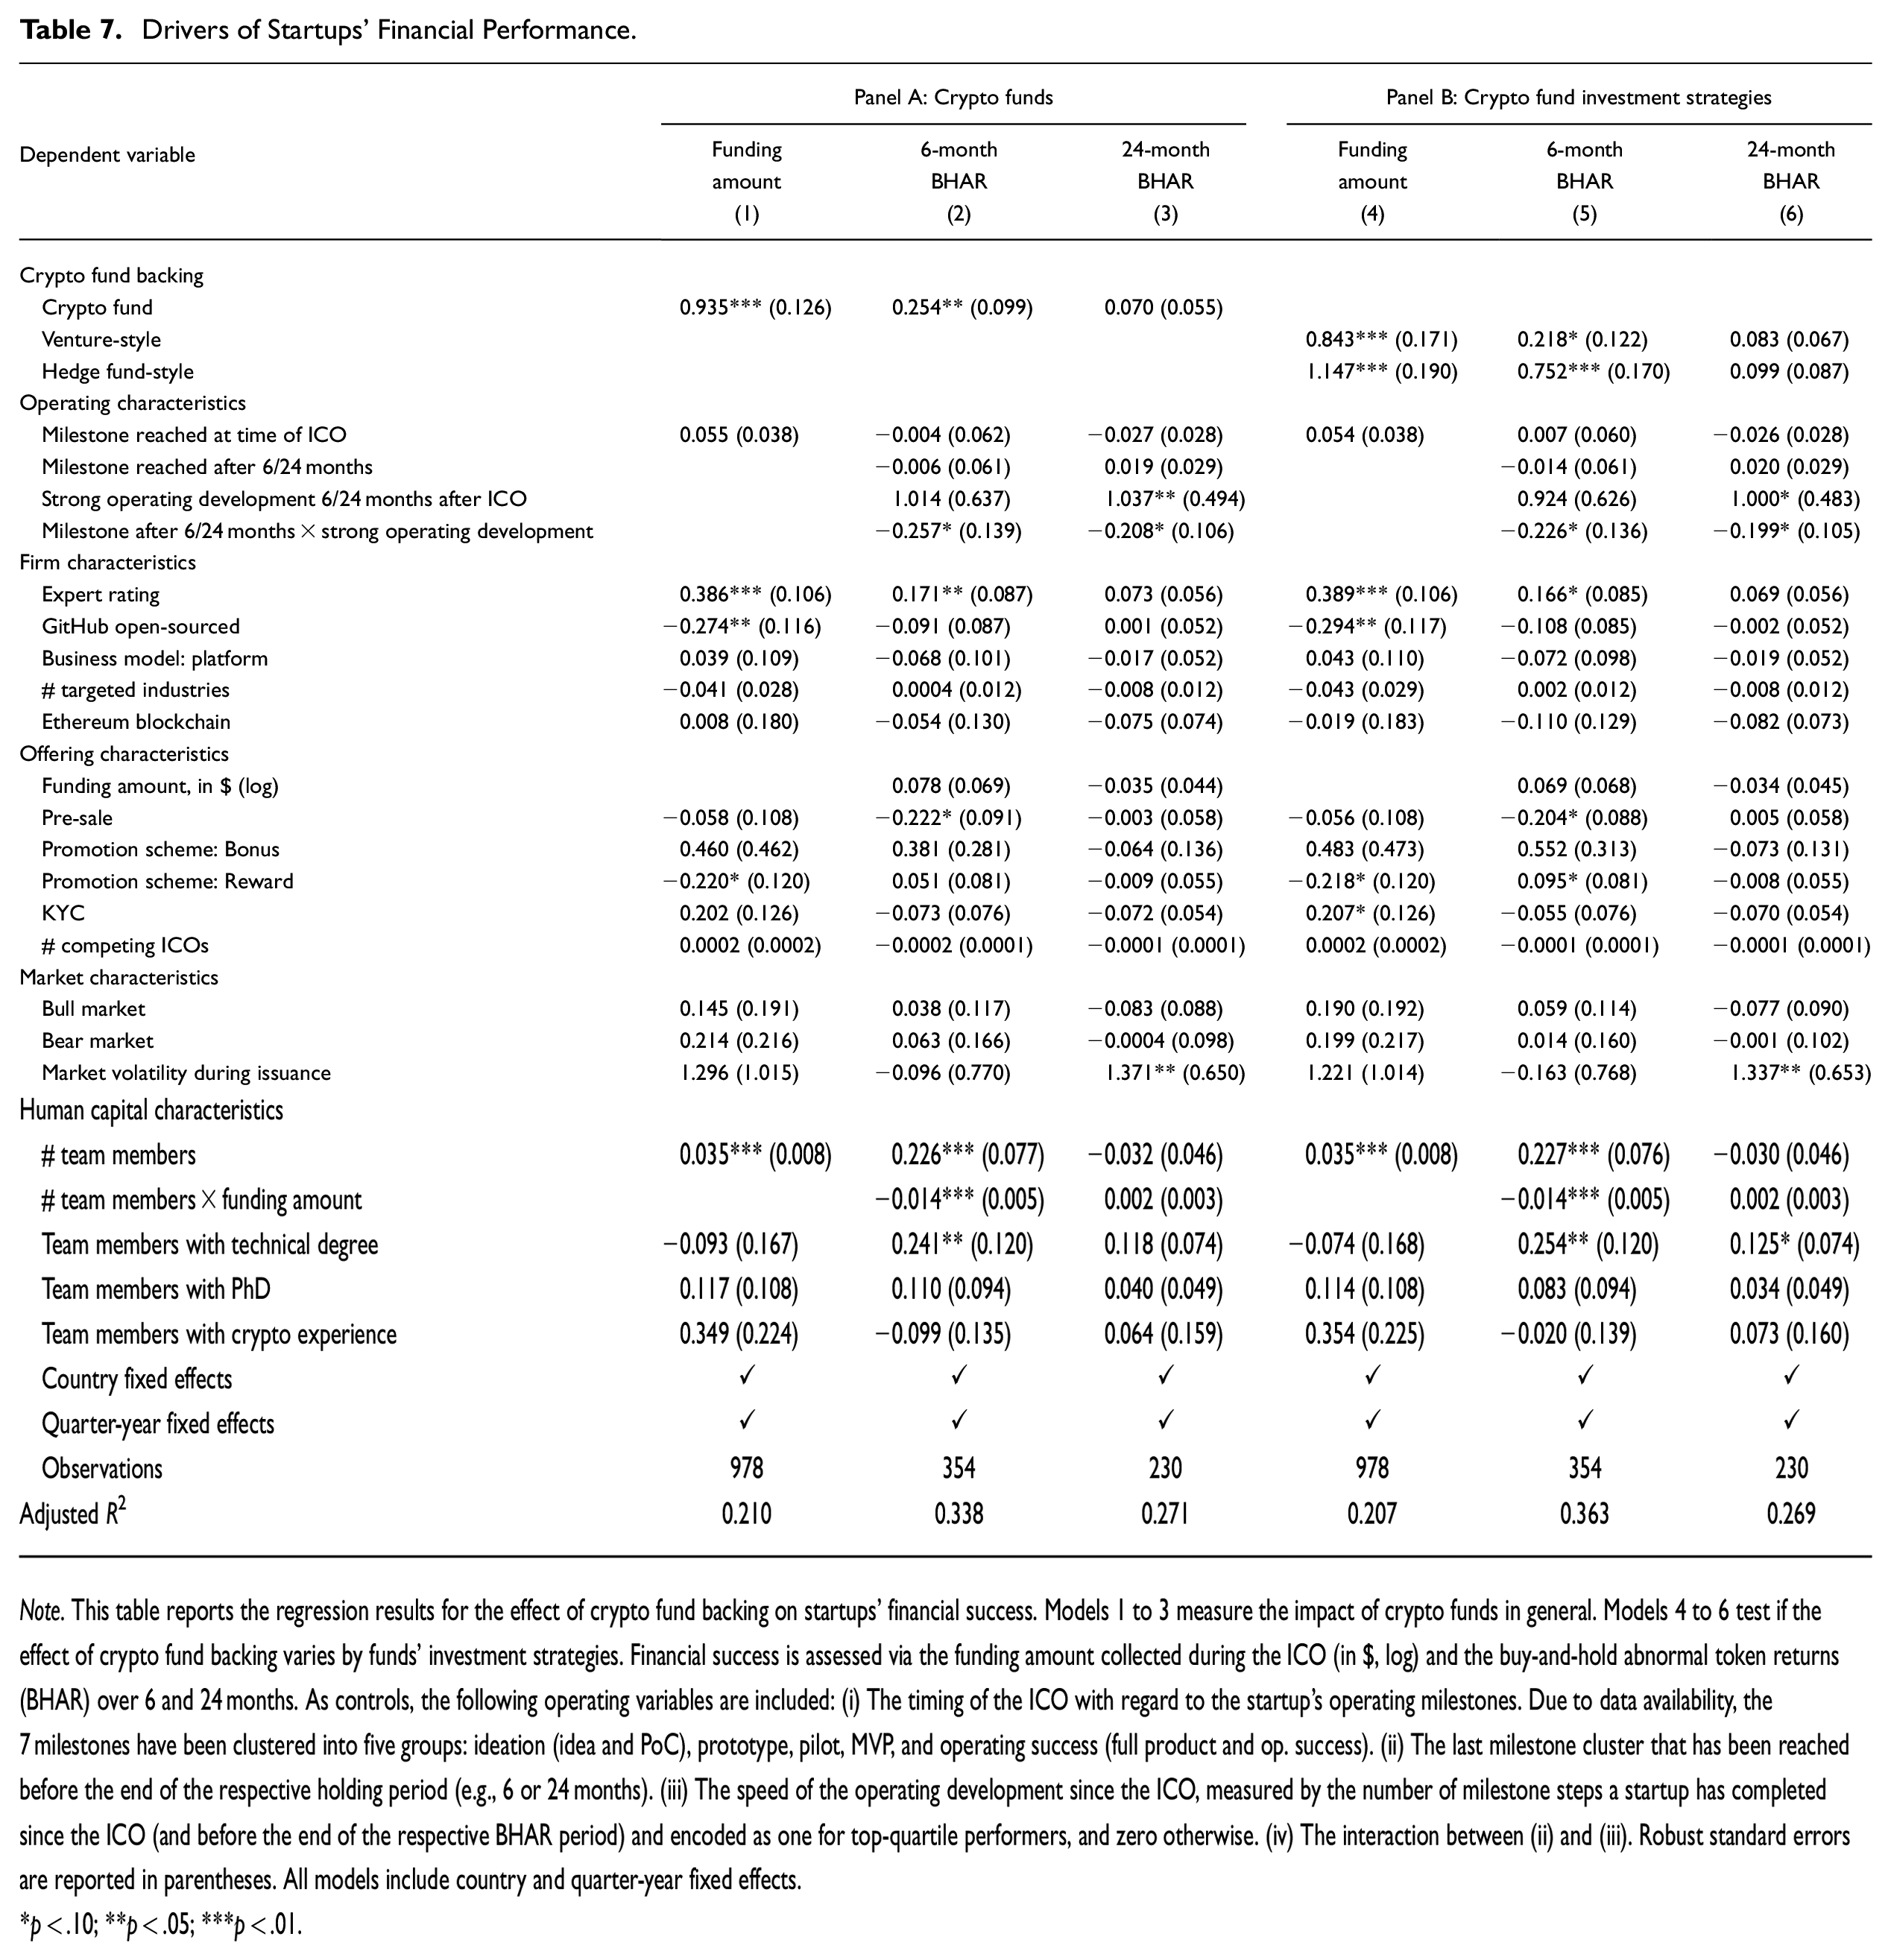
Funding Amount and Secondary Market Performance: The Role of Crypto Funds
Table 7 presents results for the effect of crypto fund backing on startups’ financial success. To assess the short-term and long-term financial impact of crypto funds, we use three dependent variables: (1) the venture valuation at the time of the ICO, measured as the natural logarithm of the total funding amount (in $); (2) the BHAR over 6 months; and (3) the BHAR over a longer period of 2 years. The models in Panel A test the influence of crypto fund backing on the financial success of ICOs, whereas the models in Panel B disentangle the effects of different crypto fund strategies. All regression models control for an extensive list of variables. We include a set of variables related to the operating development and the timing of the token issuance. 17 Moreover, as in the models in Table 6, we incorporate all firm, offering, market, and human capital characteristics. All models include country and quarter-year fixed effects. The explanatory power of our regression models, with adjusted R2 values ranging from 20.7% to 36.3%, corresponds to prior research in the field of blockchain-based startups (Fisch & Momtaz, 2020; Lyandres et al., 2022).
Drivers of Startups’ Financial Performance.
Note. This table reports the regression results for the effect of crypto fund backing on startups’ financial success. Models 1 to 3 measure the impact of crypto funds in general. Models 4 to 6 test if the effect of crypto fund backing varies by funds’ investment strategies. Financial success is assessed via the funding amount collected during the ICO (in $, log) and the buy-and-hold abnormal token returns (BHAR) over 6 and 24 months. As controls, the following operating variables are included: (i) The timing of the ICO with regard to the startup’s operating milestones. Due to data availability, the 7 milestones have been clustered into five groups: ideation (idea and PoC), prototype, pilot, MVP, and operating success (full product and op. success). (ii) The last milestone cluster that has been reached before the end of the respective holding period (e.g., 6 or 24 months). (iii) The speed of the operating development since the ICO, measured by the number of milestone steps a startup has completed since the ICO (and before the end of the respective BHAR period) and encoded as one for top-quartile performers, and zero otherwise. (iv) The interaction between (ii) and (iii). Robust standard errors are reported in parentheses. All models include country and quarter-year fixed effects.
*p < .10; **p < .05; ***p < .01.
Comparing sample sizes across models, the number of observations reduces considerably from the valuation models (978 startups in columns [1] and [4]) to the secondary market models (354 firms for 6-month BHARs in columns [2] and [5] and 230 firms for 24-month BHARs in columns [3] and [6]). This is because many startups have not had their tokens listed on a secondary market exchange for the full holding period examined at the time of our data collection. The inclusion of operating characteristics before and after the ICO further reduces the samples.
The results in Panel A confirm Hypothesis 2, suggesting that crypto funds have a positive and statistically significant impact on the short-term financial success of their investee firms. In model 1, the estimated coefficient on the crypto fund dummy of 0.935, with a p-value below 1%, indicates that the investment of a crypto fund in an ICO increases valuation by more than 150%
Funding Amount and Secondary Market Performance: Investment Strategies
The sample split by investment strategy in Panel B of Table 7 suggests that, while both venture- and hedge-style crypto funds have a positive and statistically significant impact on a startup’s short-term financial success, hedge fund-style strategies are the driving force. Compared to fully crowdfunded ICOs, the presence of a fund with a venture-style approach increases the amount of capital secured during an ICO by 132%, and a fund with a hedge fund-style approach by a staggering 215%. A sizable difference between the two investment styles is also prevalent for the 6-month BHARs. In contrast, analyzing the 24-month BHARs, the outperformance of crypto fund-backed ventures disappears. Again consistent with Hypothesis 3, the estimated coefficients for both venture- and hedge fund-style strategies drop in absolute values and become statistically insignificant.
The decreasing influence of crypto fund backing on financial performance over time is reiterated in Figure 4. Panels A and B illustrate the influence of crypto venture fund and crypto hedge fund backing, respectively, by plotting the estimated coefficients of the fund dummy variable based on BHARs over holding periods from 6 to 24 months. 19 Two observations are noteworthy. First, the impact of crypto fund backing on short-term abnormal token returns is driven by hedge fund-style strategies. Second, the impact of these hedge funds on the financial performance of startups is only observable in the short run. The regression coefficients drop significantly over the 12- and 18-month holding periods.
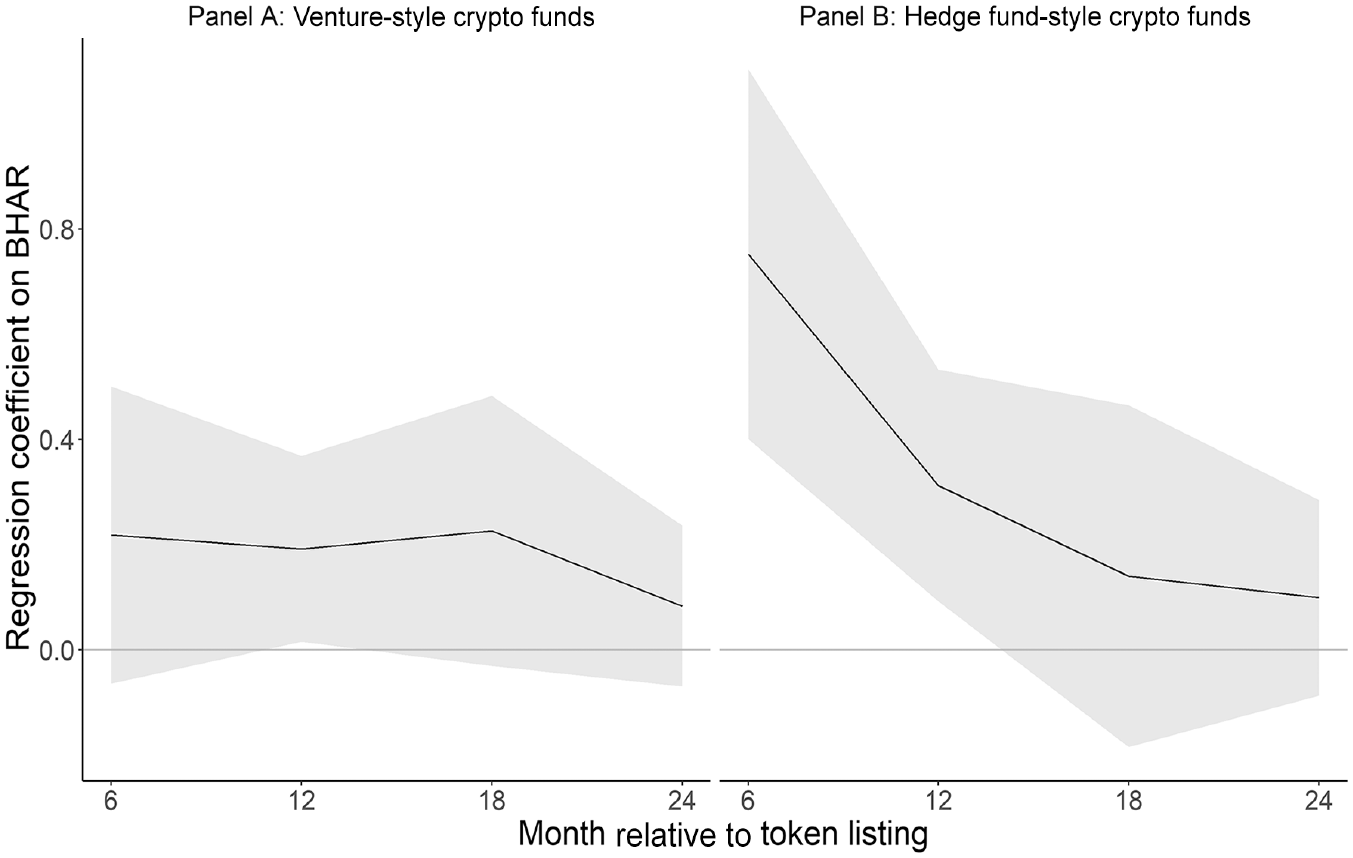
Drivers of startups’ financial performance: The impact of crypto funds’ investment strategies.
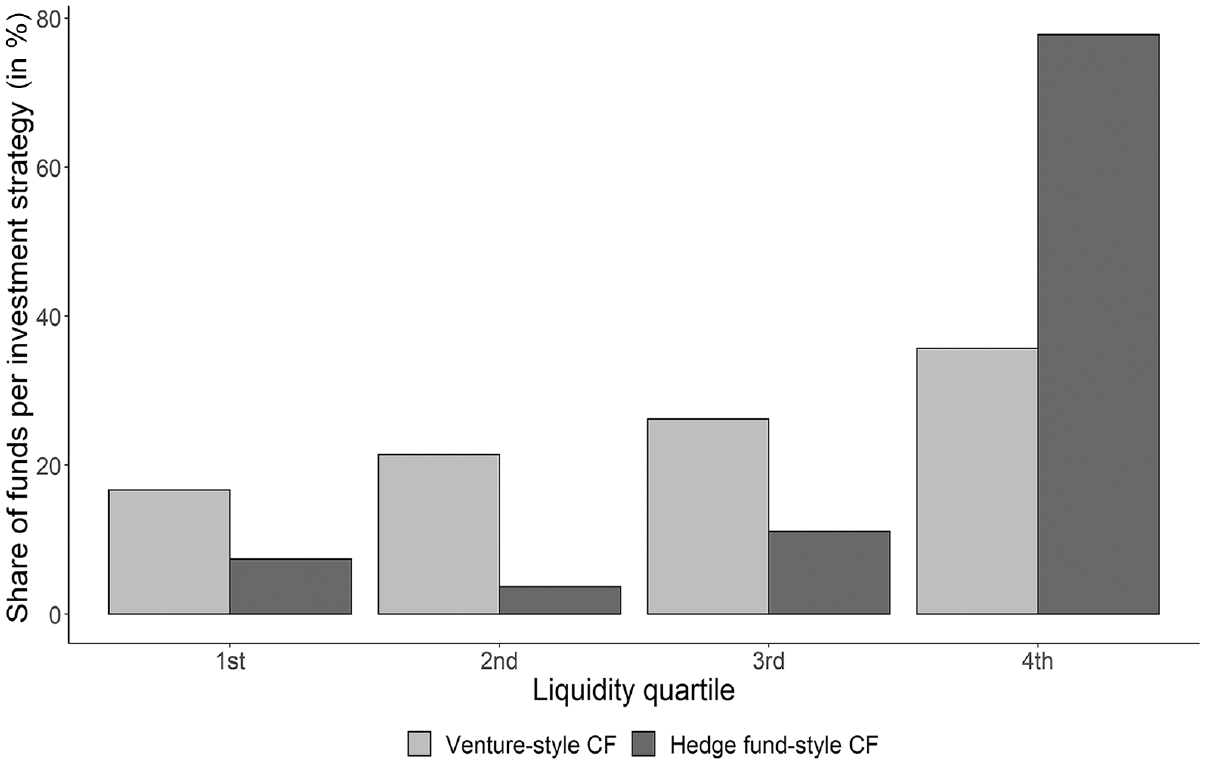
Figure 5 illustrates the pathway by which crypto hedge funds exert their short-term impact on startups’ financial performance. Split by investment strategy, the figure shows startups’ crypto fund backing across token liquidity quartiles. Token liquidity, measured in $ (log), is a token’s cumulative trading volume over a 6-month holding period. For crypto venture funds, the share of their backing ranges from 16% to 36% per quartile, and thus their engagement is fairly homogeneous across the liquidity distribution. For crypto hedge funds, however, the pattern looks very different. Whereas the share of their backing ranges from only 3% to 12% in the lower three quartiles, 78% of the ventures they invest in rank in the fourth (most liquid) quartile. Accordingly, crypto hedge funds focus their token investments on startups that are likely to experience high trading volumes in the secondary market. This high level of liquidity allows them to behave in opportunistic ways and use the “exit” as a credible threat (Hirschman, 1970).
Crypto fund investments and token liquidity.
Taken together, this set of analyses, combined with stylized facts on survival over time (Figure 3) and the assessment of operating performance (Tables 5 and 6), suggests that tokenized startups require more time to build an operationally successful business than the short investment periods crypto funds allow. This applies particularly to crypto funds that pursue hedge fund-style strategies. These funds may still exert influence on the operations of ventures through their trading behavior, with the intention to drive short-term financial results instead of long-term operating success.
Optimal Timing for Token Offerings
In this section, we analyze whether an optimal timing exists for startups along their life-cycle to raise capital through an ICO. Table 8 reports results for the impact of the timing of a token issuance and some additional operating characteristics on short- and long-run financial success. All models include the following operating characteristics: (i) the last milestone reached at the time of the ICO; (ii) the last milestone reached before the end of the holding period; (iii) a dummy variable indicating whether a startup experienced strong development in the post-ICO period, that is, between the ICO and the end of the holding period. Detailed descriptions of these variables are provided in section “Variable Definitions” and Table A1 in the Appendix. All regression models, dependent variables, and control variables follow the setup in Table 7.
Drivers of Startups’ Financial Success: The Impact of ICO Timing.
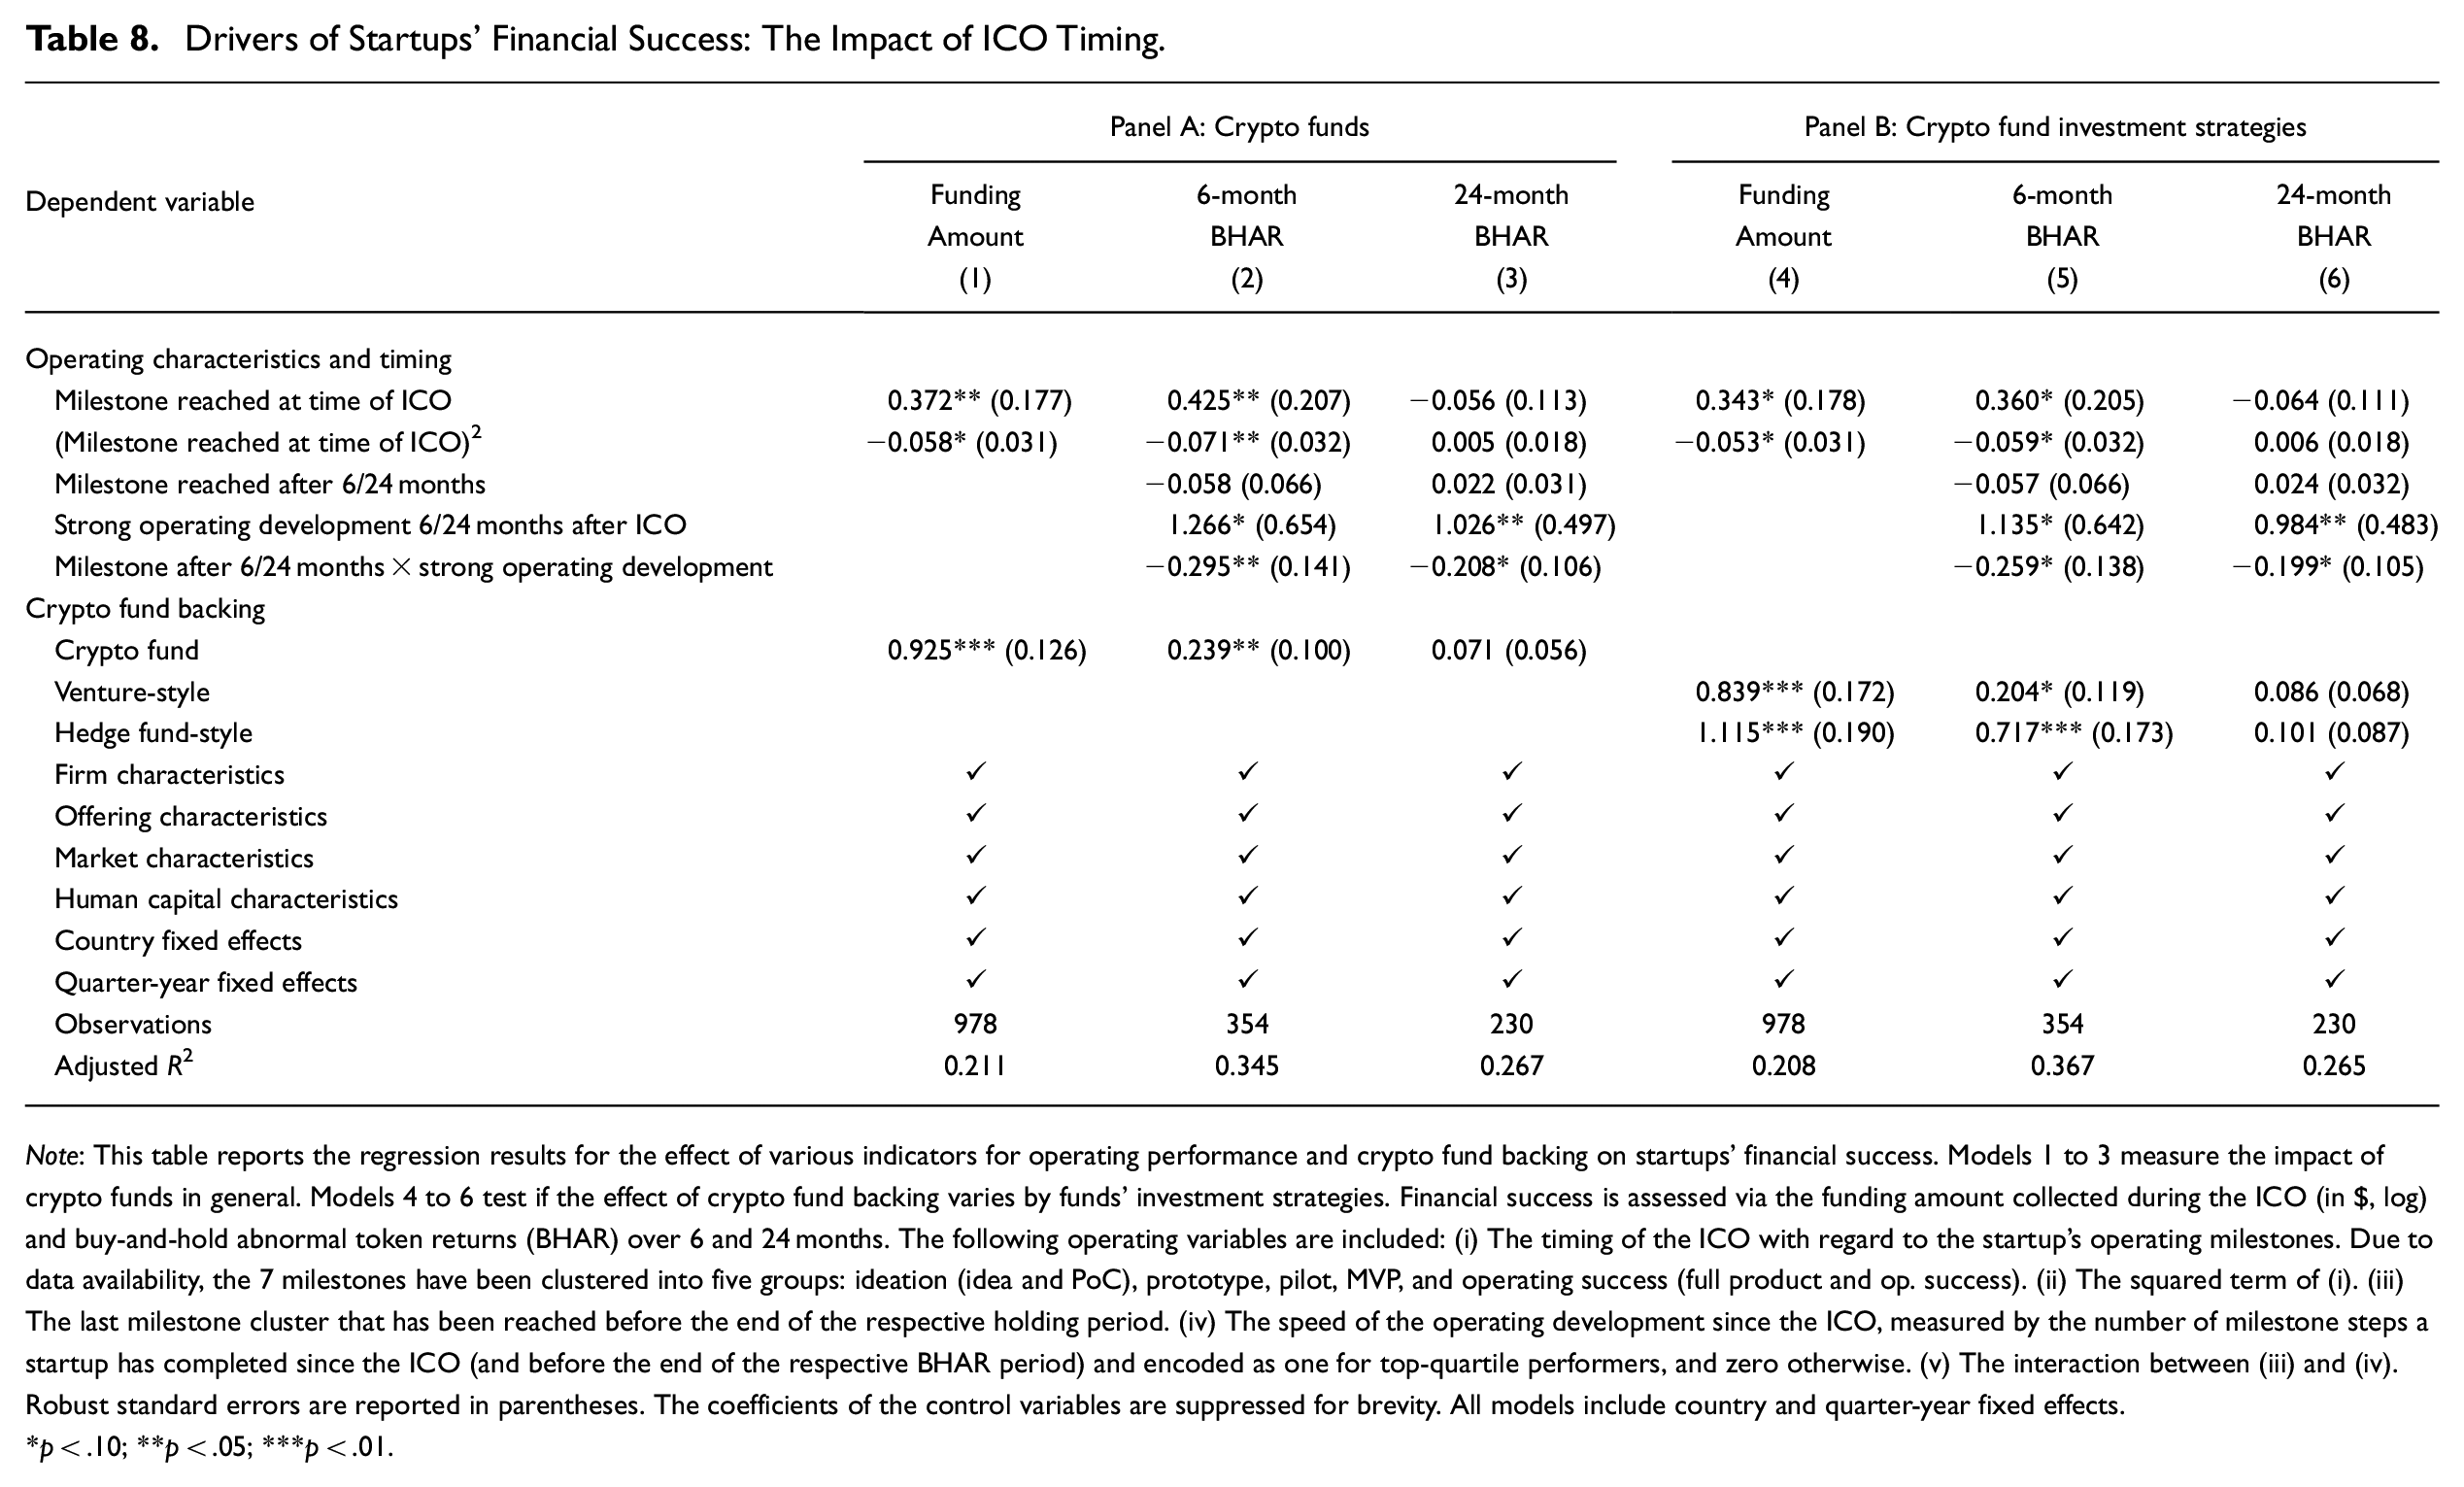
Note: This table reports the regression results for the effect of various indicators for operating performance and crypto fund backing on startups’ financial success. Models 1 to 3 measure the impact of crypto funds in general. Models 4 to 6 test if the effect of crypto fund backing varies by funds’ investment strategies. Financial success is assessed via the funding amount collected during the ICO (in $, log) and buy-and-hold abnormal token returns (BHAR) over 6 and 24 months. The following operating variables are included: (i) The timing of the ICO with regard to the startup’s operating milestones. Due to data availability, the 7 milestones have been clustered into five groups: ideation (idea and PoC), prototype, pilot, MVP, and operating success (full product and op. success). (ii) The squared term of (i). (iii) The last milestone cluster that has been reached before the end of the respective holding period. (iv) The speed of the operating development since the ICO, measured by the number of milestone steps a startup has completed since the ICO (and before the end of the respective BHAR period) and encoded as one for top-quartile performers, and zero otherwise. (v) The interaction between (iii) and (iv). Robust standard errors are reported in parentheses. The coefficients of the control variables are suppressed for brevity. All models include country and quarter-year fixed effects.
*p < .10; **p < .05; ***p < .01.
To test for an inverted U-shaped relationship between the timing of an ICO and financial success, we follow the approach outlined in Haans et al. (2016) and Lind and Mehlum (2010). All regression models include the variable Milestone reached at time of ICO and its squared term. For the secondary market models, we also include the interaction term between the milestone reached before the end of the holding period and the indicator variable for strong development during this time period to account for a possible interdependency between the two variables. For example, strong operating development may be less relevant if a startup has already become operationally successful at the time the tokens are issued, overshadowing the speed of development. Similarly, if a startup is at an earlier point in its life-cycle at the beginning of a holding period, strong operating development thereafter may be more relevant to evaluate future success. The regressions results in Panels A and B suggest that, for the short-term financial success measures, there exists an optimal point in time—defined relative to a startup’s operating milestones—to implement a token-based crowdfunding. The estimated coefficient of the variable Milestone reached at time of ICO in model 1 is positive and statistically significant (with a p-value below 5%), and its squared term is negative and statistically significant (with a p-value below 10%). Consistent with Hypothesis 4, these results indicate that the timing of an ICO and the total amount of capital raised exhibit an inverted U-shaped relationship. The estimates pinpoint perfect ICO timing (maximizing the amount of funding at issuance) as being right after the completion of the piloting milestone cluster
The presence of an inverted U-shaped relationship is confirmed by the three requirements described by Haans et al. (2016) and Lind and Mehlum (2010). First, the estimated coefficient on the quadratic term (Milestone reached at time of ICO)2 has the expected negative sign and is statistically significant. Second, the partial derivative of the total funding amount with respect to the timing of the token issuance is positive and statistically significant for the earliest possible timing, and negative and statistically significant for the latest possible timing. In particular, an ICO can be implemented at the earliest after the ideation cluster (Milestone reached at time of ICO = 1) and at the latest following the operating success cluster (Milestone reached at time of ICO = 5). The slope is
Model 2 confirms this shape of relationship for BHARs over the 6-month holding period: (i) the estimated coefficient of (Milestone reached at time of ICO)2 is negative (with a p-value below 5%); (ii) the slopes at the low and high end of potential ICO timings show the expected signs and are statistically significant (both at the 5% level); (iii) the turning point and its 95% confidence interval are located within the range of our sample data. The turning point at 2.98 indicates that the optimal timing of an ICO with regard to 6-month BHARs is again around the piloting milestone cluster. The results further suggest that the operating development subsequent to the ICO becomes a relevant driver of financial performance that is statistically significant at the 10% level. Moreover, the significantly negative coefficient of the interaction term between strong operating development during the holding period and the milestone reached up until the end of the 6-month holding period suggests that the impact of the speed of operating progress on financial performance decreases over the course of the life-cycle.
The effect of timing disappears in the longer run, while the operating development subsequent to the ICO remains important. In model 3, with the 24-month BHARs as the dependent variable, neither the linear nor the quadratic term for timing shows any statistical significance. In contrast, speed in the operating development remains a driving force for financial development that is statistically significant, albeit with declining impact as further operating milestones are achieved. Finally, all models in Panel B, in which only the crypto fund dummy variable is replaced with the indicator variables for the different crypto fund investment strategies, confirm these results.
Overall, these results suggest that there exists an optimal timing to conduct an ICO, which is around the completion of the piloting milestone cluster. This observation is relevant for startups and crypto funds alike because (i) the amount of capital raised drives operating success (as indicated in our operating performance analysis), and (ii) timing impacts short-term abnormal token returns in the secondary markets. However, the effect of timing on secondary market performance decreases over longer holding periods, while the speed of operating development that occurs in the post-ICO phase remains a factor that should be closely monitored by crypto investors.
In a final step, Table 9 examines how the impact of timing and operating development on financial success differs for startups with and without crypto fund backing. Apart from the sample splits in Panel A (with crypto fund backing) and Panel B (without backing), the model components mirror those already shown in Table 8. The inverted U-shape is observable for 6-month BHARs in the subsample of crypto fund-backed ICOs, with both related coefficients being statistically significant. In particular, for this holding period, (i) the quadratic term (Milestone reached at time of ICO)2 is negative (with a p-value below 5%), (ii) the slopes for the earliest and latest possible timings have the expected signs and are statistically significant (at the 5% and 10% level, respectively), and (iii) the turning point is located within the range of our sample data. In contrast, in the subsample of non-backed ICOs, an inverted U-shaped relationship is only observable in the model with the total funding amount as the dependent variable.
Drivers of Startups’ Financial Success: The Impact of ICO Timing and Crypto Fund Backing.
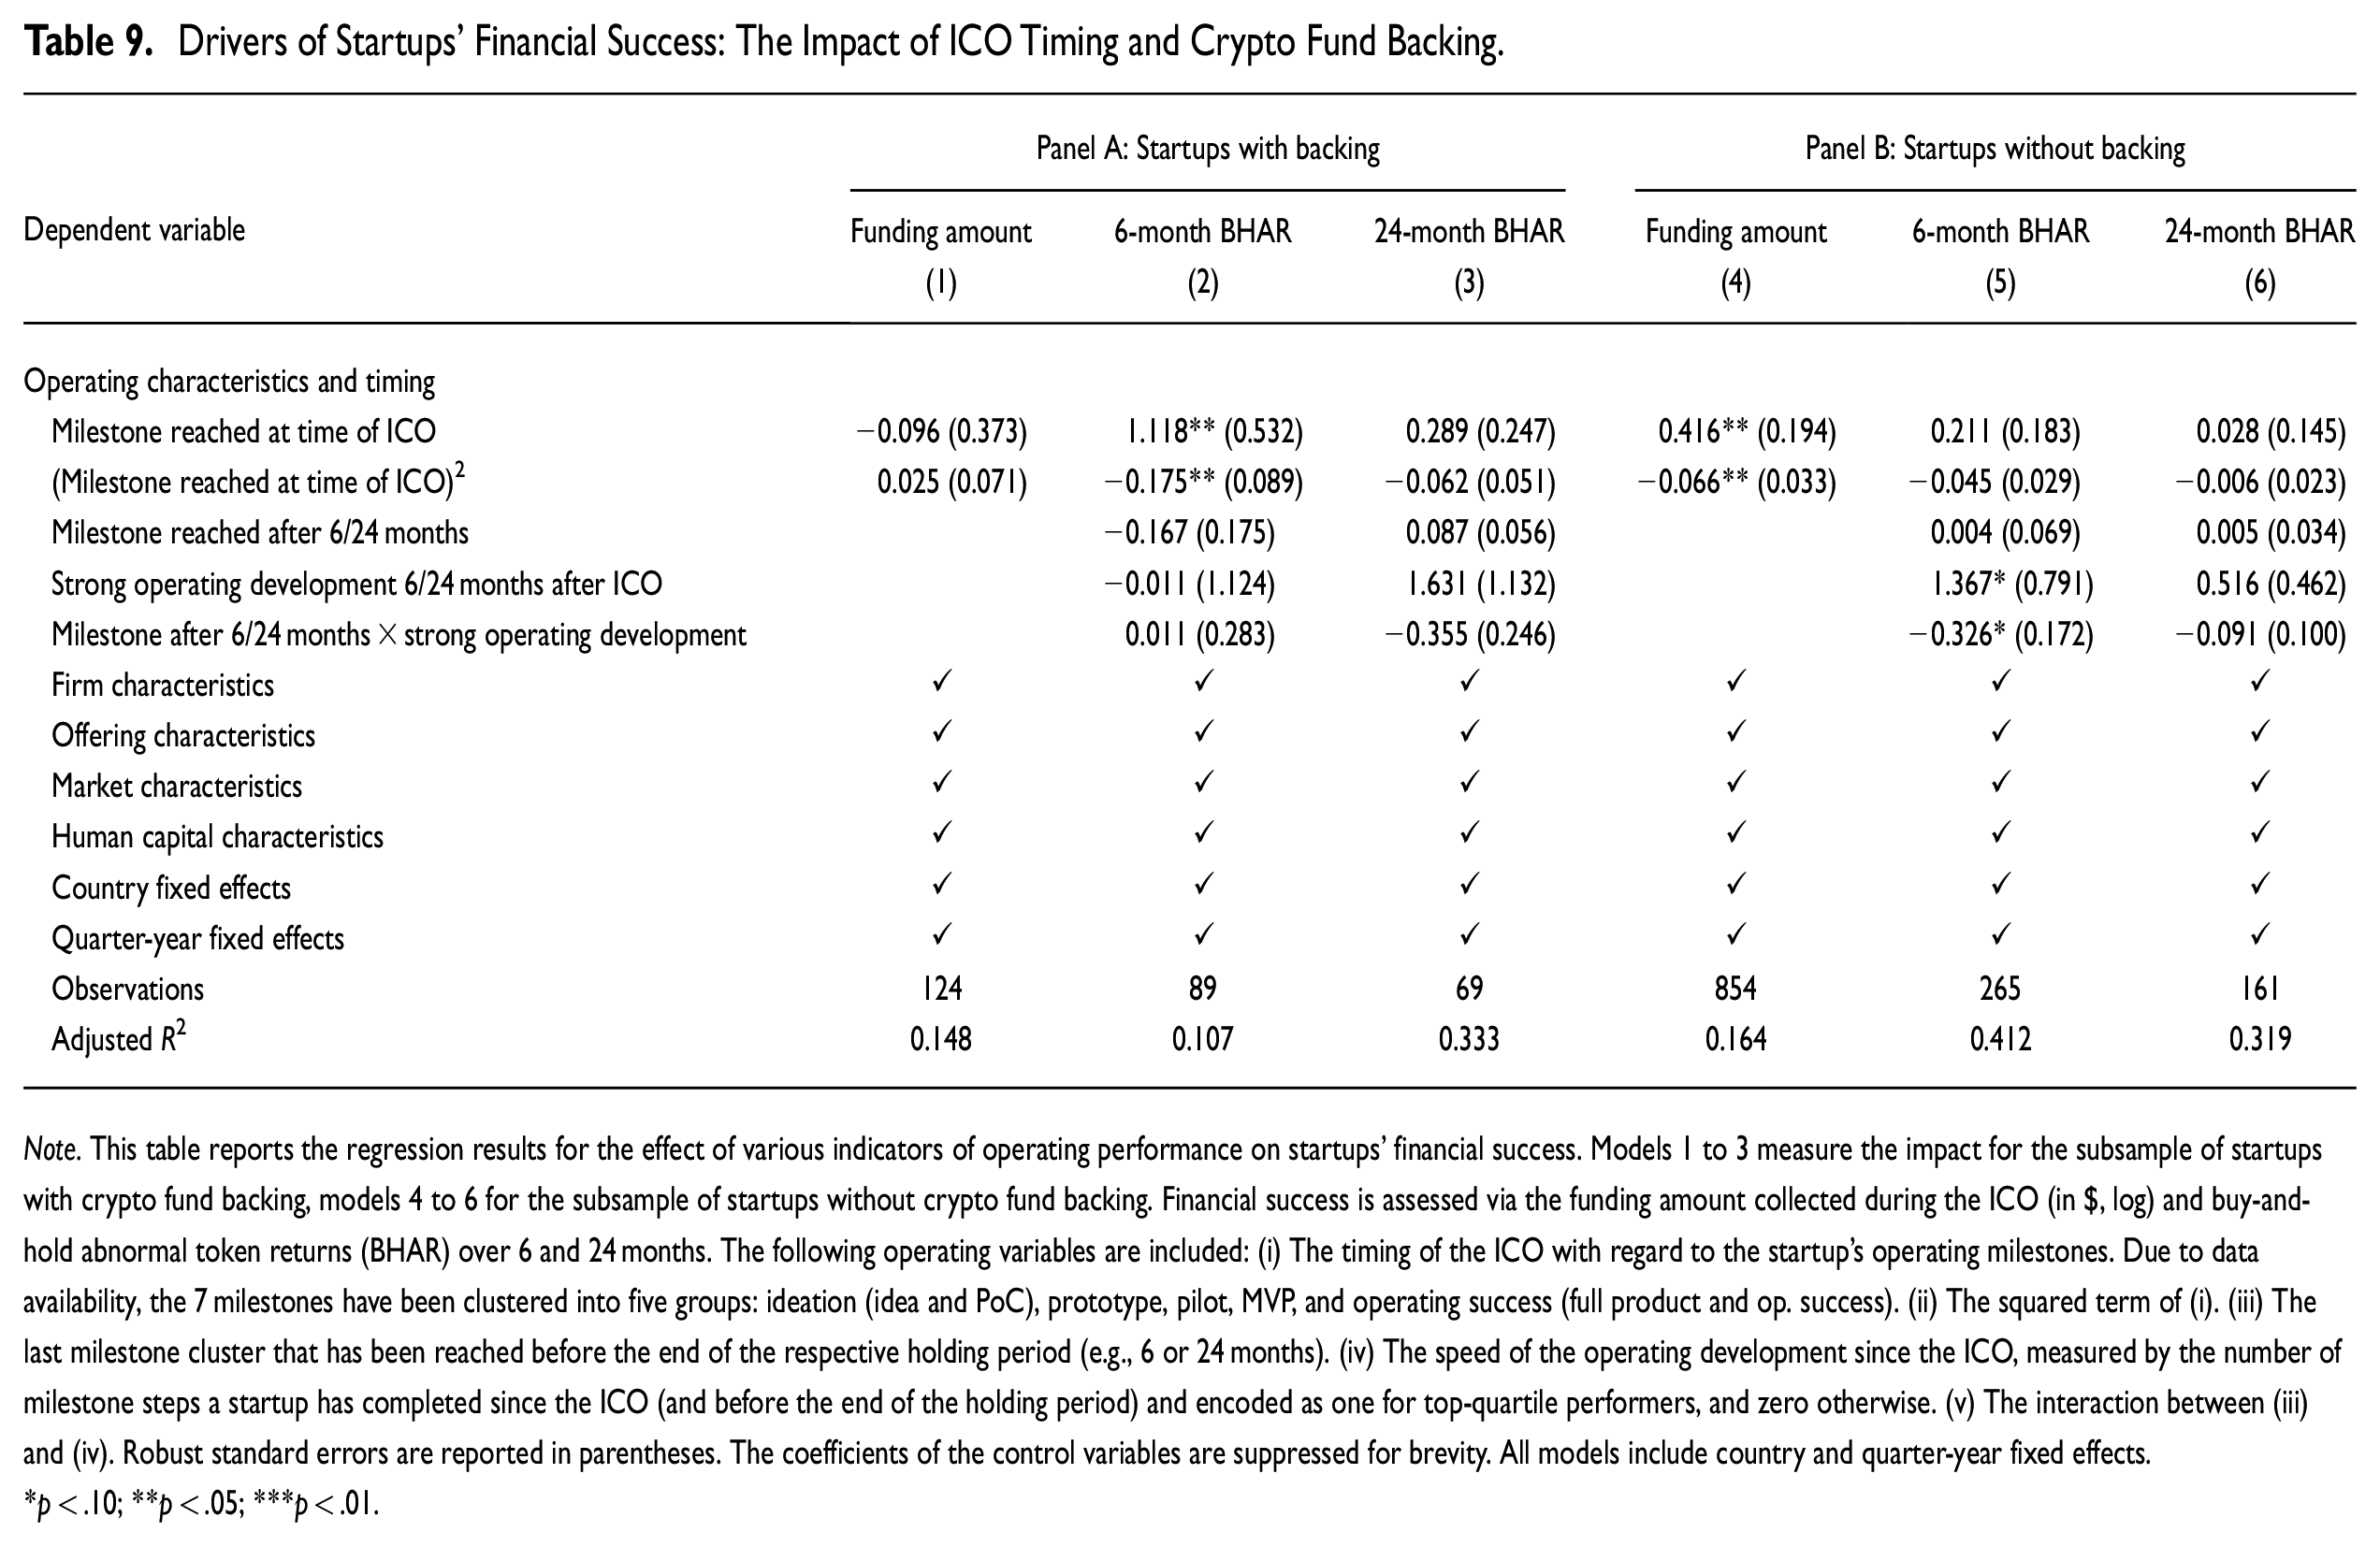
Note. This table reports the regression results for the effect of various indicators of operating performance on startups’ financial success. Models 1 to 3 measure the impact for the subsample of startups with crypto fund backing, models 4 to 6 for the subsample of startups without crypto fund backing. Financial success is assessed via the funding amount collected during the ICO (in $, log) and buy-and-hold abnormal token returns (BHAR) over 6 and 24 months. The following operating variables are included: (i) The timing of the ICO with regard to the startup’s operating milestones. Due to data availability, the 7 milestones have been clustered into five groups: ideation (idea and PoC), prototype, pilot, MVP, and operating success (full product and op. success). (ii) The squared term of (i). (iii) The last milestone cluster that has been reached before the end of the respective holding period (e.g., 6 or 24 months). (iv) The speed of the operating development since the ICO, measured by the number of milestone steps a startup has completed since the ICO (and before the end of the holding period) and encoded as one for top-quartile performers, and zero otherwise. (v) The interaction between (iii) and (iv). Robust standard errors are reported in parentheses. The coefficients of the control variables are suppressed for brevity. All models include country and quarter-year fixed effects.
*p < .10; **p < .05; ***p < .01.
The combined results of Panels A and B in Table 8 indicate that the optimal timing of an ICO is around the piloting milestone cluster. This is particularly relevant to maximizing funding from crowd investors. The findings further indicate that ICOs at this point in the life-cycle are attractive for crypto funds to invest in and benefit from their certification of venture quality in the short-run, the behavior we have termed “certification exploitation.”
Discussion and Conclusion
Summary of Main Results
This article examines three overarching hypotheses related to entrepreneurial finance in the context of blockchain-based crowdfunding. The Operating Underperformance Hypothesis proposes that institutional investor-backed ventures that conduct ICOs have weaker operating performance than solely crowdfunded ICO ventures, whereas the Financial Outperformance Hypothesis suggests that investor-backed ICO ventures exhibit stronger financial performance than fully crowdfunded ICO ventures. Moreover, the Optimal Timing Hypothesis holds that there is an inverted U-shaped relationship between the financial success of a token offering and its timing along the life-cycle of a startup venture.
We test these hypotheses using the Token Offerings Research Database (TORD), which provides the best available data coverage for ICOs conducted up to the end of 2021, and a hand-collected sample of 20,431 operating milestones reported by TORD ventures. ICOs offer a near-ideal laboratory to test these hypotheses because, unlike non-token-based crowdfunding markets such as equity or reward-based crowdfunding (Ahlers et al., 2015; Vismara, 2016), the market for tokens is highly integrated and consists of both individual and institutional investor types. This institutional setup suggests a straightforward empirical research design to test both the Operating Underperformance Hypothesis and the Financial Outperformance Hypothesis. In addition, defining operating milestones along a venture’s life-cycle—a granular classification ranging from ideation to functional product stages and beyond (Bellavitis et al., 2020; Bellavitis et al., 2021; Fisch, 2019; Howell et al., 2020; Huang et al., 2020; Momtaz, 2020)—provides variation across these life-cycle stages around which ventures can conduct their token issuance, enabling us to test the Optimal Timing Hypothesis.
Our empirical results provide support for all hypotheses. Institutional investor backing shortens a startup’s time-to-liquidation. For example, the smallest estimated hazard ratio of 1.235 (with statistical significance at the 5% level) suggests that the presence of crypto fund backing decreases the average time-to-liquidation by 23.5%, all else equal. When testing the financial success of ICOs in terms of the amount of capital raised, the estimated coefficient of the dummy for institutional investor backing is 0.935, with a p-value below 1%, suggesting that crypto fund backing in an ICO increases firm valuation, on average, by more than 150%
Overall, these results are consistent with our conjecture that institutional investors are able to use their reputation to drive up valuations and quickly exit the target after the ICO, an empirical pattern that we term “certification exploitation.” We conclude that institutional investors only increase the financial performance of ICO ventures in the short run when certification exploitation is at play. There is no statistically significant effect of professional investor backing on ventures’ financial performance in the long run. The results are robust to various modifications of our baseline model. 20 Moreover, given that we are the first to compile a representative sample with operating milestones in a crowdfunding segment, we are able to produce a number of stylized facts about the product-market performance of token-based crowdfunded firms, which we elaborate on next.
Theoretical Contributions and Practical Implications
Our study contributes to the entrepreneurial finance literature in several important ways. First, we develop a theory of certification exploitation, arguing that the presence of institutional investors can be harmful for the operating performance of ventures that tap capital markets through an ICO. We depart from the conjecture upheld in previous research (Fisch & Momtaz, 2020; Hsu, 2004) that certification of institutional investors always positively affects venture performance and argue that institutional investor backing can also have adverse consequences for the operating performance of tokenized ventures. 21 In particular, the tradability of tokens enables crypto funds to participate in a new form of professional “pump-and-dump” scheme in entrepreneurial finance (Dhawan & Putnins, 2022; Gandal et al., 2018; Hamrick et al., 2021; Hornuf et al., 2023; Li et al., 2023). Although we cannot directly observe the exits of crypto funds, the combined patterns of operating and financial performance of IOC ventures with and without crypto fund backing are consistent with a certification exploitation story.
Certification exploitation occurs when institutional investors, who can attest to the quality of the venture with their financial backing, quickly exit a target venture as long as token valuations are favorably impacted by their own certification. In particular, in a market with incomplete information, certifying institutional investors buy tokens at the pre-certification price and, thanks to liquid secondary markets, unwind their position immediately after achieving the post-certification price, with the difference being their certification profit. This interpretation is confirmed by the observation that our results are most pronounced for crypto hedge funds. We document that crypto hedge funds are mostly invested in those startups with the highest trading volume, which allows them to exit easily. While institutional investors are tied to their investments for several years in traditional entrepreneurial finance markets due to the illiquidity of startup markets and contractually defined lock-up periods (Cumming, 2008; Cumming et al., 2005; Cumming & Johan, 2013), our theory of certification exploitation is specific to the market for tokenized ventures (Alshater et al., 2023; Bellavitis et al., 2021; Brochado & Troilo, 2021; Fuchs & Momtaz, 2023), where institutional investors’ opportunistic behavior and their impact on token valuation can be interpreted as a novel form of a pump-and-dump mechanism.
Second, our findings contribute to the nascent literature on investor choice in entrepreneurial finance (Colombo et al., 2021; Cumming et al., 2024; Fisch & Momtaz, 2020; Momtaz, 2024). While prior studies document that specialized venture capital funds are well equipped to support startups during their early stages (Bertoni et al., 2011; Colombo & Grilli, 2010; Hsu, 2004), little is known about when precisely they should enter during the life-cycle of startups. Our results suggest that there are inverted U-shaped relationships between the timing of an ICO over the venture’s life-cycle and (i) the ICO’s fundraising success as well as (ii) its short-term financial performance. Although surely not conclusive, our findings offer building blocks for further theorizing around investor choice in entrepreneurial finance markets.
In addition to these theoretical contributions, our comprehensive data collection process, which includes more than 20,000 operating milestones reported by ICO ventures, offers several new stylized facts about the performance and survival of crowdfunded firms. These stylized facts are valuable given that Böckel et al. (2021, p. 433) summarize in their comprehensive review of the crowdfunding literature that there is a major “research gap related to the post-funding phase.” Similarly, Vanacker et al. (2019, p. 237) conclude that “the post-funding performance of crowdfunded firms is probably the least explored topic in entrepreneurial finance.” We find the following post-funding patterns: Only every other ICO venture ultimately develops a full product, and only about 20% reach the final stage of operating success. Conditional on achieving a given milestone, tokenized startups that develop a full product take approximately 19 months, and startups that are operationally successful need about 24 months from ideation to reach this stage. Finally, the most common reason why startups fail is that they are not able to develop their pilot into a minimum viable product or their minimum viable product into a full product. More than 60% of all startups in our sample are liquidated during the stages from pilot to full product development.
Our results further contribute to the growing literature analyzing ICO markets in several important ways. First, a number of articles examine indicators and drivers of ICO success (Adhami et al., 2018; Alexander & Dakos, 2022; Amsden & Schweizer, 2018; Belitski & Boreiko, 2021; Bourveau et al., 2022; Fisch, 2019; Florysiak & Schandlbauer, 2022; Howell et al., 2020; Hu et al., 2019; Huang et al., 2022; Lee et al., 2022; Lyandres et al., 2022; Roosenboom et al., 2020; Thewissen et al., 2022a, 2022b; Thewissen et al., 2023; Xia et al., 2023; Xia et al., 2024), whereas others study post-ICO returns in the spirit of IPOs (Benedetti & Nikbakht, 2021; Lyandres et al., 2022; Momtaz, 2020, 2021d). The studies that examine IPO success use the achievement of the stated funding goals, the amount of funds raised, or being listed on an exchange as measures of ICO success. In our tests, we focus on the post-funding operating performance of ICO ventures. A few recent studies analyze measures of operating performance of ICOs based on inputs into production or final outcomes, such as post-ICO employment growth (Howell et al., 2020), code revision activity and venture-initiated social media activity (Lyandres et al., 2022), the successful delivery of a product (Davydiuk et al., 2023), or the achievement of sustainability goals (Xia et al., 2023). What distinguishes our analysis from prior research is that we construct operating performance indicators that are much more granular. Our classification is based on 7 milestones, which enables a detailed analysis of the optimal timing of an ICO along the life-cycle of a startup venture.
Second, our results provide practical explanations complementing recent theorization on ICO markets. For example, certification exploitation by crypto funds is related to research by Cong et al. (2021), who study cryptocurrency prices using a theoretical framework. Their asset pricing model for tokens suggests that token prices are determined by aggregating the transaction demand from heterogeneous users (which is affected by user network externality) rather than discounting future cash flows as is done in standard valuation approaches. Cong et al.’s (2021) model further predicts a positive relationship between post-ICO operating performance and financial success in the long run. Our empirical results do not contradict this fundamental connection, but we document that the presence of crypto funds can drive a wedge between operating and financial performance.
Our findings also hold several implications for practice. For policymakers, certification exploitation remains a regulatory blind spot and calls for a more nuanced legislative approach. Certification exploitation with utility tokens describes a new form of pump-and-dump mechanism in the recent cryptocurrency literature, and one that takes place in a legal gray area. Its illegality is dependent, among other things, on the specific intentions of the crypto fund, which can be difficult to prove. With only the fund knowing whether it is a manipulator or a rule-abiding informed trader, it can be difficult for outsiders to come up with appropriate protective measures (Allen & Gale, 1992). Our theoretical insights and empirical results raise new questions for the regulation of ICOs, for example, whether lock-up periods or disclosure regulations of related party transactions should be transferred from the traditional capital market to the crypto domain.
For entrepreneurs, our results have important implications regarding investor choice and the timing of crowdfunding campaigns. Founders often try to get any investor on board just to maintain operational momentum. However, especially in tokenized markets, it is important that investors are selected strategically by founders, as they can influence both a venture’s operating performance and its financial performance. Moreover, it is crucial to determine when fresh capital is to be raised, because raising capital too early or too late can lead to underfunding and also affect the company’s further success. Even if the pilot milestone is the optimal time to raise capital through an ICO, as estimated in our study, the discussions with investors, platforms, and advisors must undoubtedly start months earlier so that the ICO can be optimally timed.
Limitations and Potential Avenues for Future Research
Our study represents a first step toward understanding how the tokenization-induced liquidity of entrepreneurial finance markets changes the nature of startup financing and performance in ways that matter for entrepreneurs, investors, and policymakers alike. Given the rapidly growing interest in markets for digital tokens, as evidenced by the large number of recent reviews (Alshater et al., 2023; Brochado & Troilo, 2021; among others), and the necessarily high level of abstraction in our analysis, it seems likely that a vivid literature concerning the liquidity aspects of tokenized venture finance will soon emerge. Although our study provides a first exploration into some of the relevant issues around startup tokenization, substantially more research is needed to address topics that have been left unaddressed in our study or issues that may arise due to its limitations.
Moreover, although we do not claim that all crypto funds engage in legal gray-area or even illegal activities through certification exploitation, future research should address the question of how to differentiate value-adding backers and purely opportunistic institutional investors. We provide a preliminary answer to this question by distinguishing between crypto hedge funds and crypto venture funds, with hedge fund-style investors being predisposed to engage in opportunistic behavior.
We highlight the limitation of our study that our narrative of certification exploitation is a theory, and we are only able to provide indirect evidence for it by examining the diverging performance patterns among backed and non-backed startups. For a more direct test of our theory of certification exploitation, one would need knowledge of when exactly and how crypto funds exit. Because crypto funds do not need to abide by disclosure laws for significant holdings, as do other institutional investors in traditional markets for securities, regulatory adaption will likely be necessary to generate the data needed to test some of the theoretical claims made in our article in more detail. Alternative regulatory measures from the venture capital and traditional IPO literature—such as contractual lock-up periods and investor protection against market manipulation (Cumming, 2008; Cumming & Johan, 2013)—will likely have to be adapted for ICOs, even if they are considered utility tokens. Otherwise, the new tokenized venture market threatens to collapse before the technology can be fully exploited for financial markets (Momtaz, 2021c). Research in this direction must be interdisciplinary, bringing technology together with scholarship in business, economics, and law.
Another limitation pertains to the evolution of the ICO market and its implications for the generalizability of our findings. Our sample period largely covers ventures that raised financing via ICOs during a time when ICOs were a “hot” market with relatively high valuations, followed by a relative implosion of the ICO market thereafter (Bellavitis et al., 2021), potentially calling into question the generalizability of our findings. Put differently, our sample is characterized by a macro-market environment with relatively high valuations followed by relatively low realized returns. Our models are designed to estimate the performance impact in a differential way by comparing investor-backed to non-investor-backed startups. As such, any macro-market trend should, in principle, be “differenced away.” For this reason, our findings should also be generalizable to other market periods, assuming that crypto funds are able to outperform in bear markets the way they do in bull markets. However, we recognize that further research is needed to ascertain such a relationship. It is also worth noting that the ICO market has started to recover recently (Alexander & Dakos, 2022), which will help to provide a good empirical context to examine the latter relationship.
Concluding Remarks
Alongside technological innovation, ICOs have made the market for entrepreneurial finance more liquid. Although liquidity is generally seen as beneficial for retail investors in particular (Diamond & Verrecchia, 1991), we conclude that liquid markets for startups may pave the way for a new form of moral hazard through what we call “certification exploitation.” Our theoretical arguments and empirical findings are a call for policymakers to address this regulatory blind spot and make entrepreneurial finance markets for tokenized startups more efficient.
Footnotes
Appendix
Pairwise Correlations.
| Variables | 1. | 2. | 3. | 4. | 5. | 6. | 7. | 8. | 9. | 10. | 11. | 12. | 13. | 14. | 15. | 16. | 17. | 18. | 19. | 20. | 21. | 22. | 23. | 24. | 25. | 26. | 27. | 28. | 29. | 30. | 31. | 32. | 33. |
|---|---|---|---|---|---|---|---|---|---|---|---|---|---|---|---|---|---|---|---|---|---|---|---|---|---|---|---|---|---|---|---|---|---|
|
|
|||||||||||||||||||||||||||||||||
| 1. Reached operating success | |||||||||||||||||||||||||||||||||
| 2. Reached at least full product | 0.48 | ||||||||||||||||||||||||||||||||
|
|
|||||||||||||||||||||||||||||||||
| 3. Funding amount | 0.05 | 0.03 | |||||||||||||||||||||||||||||||
| 4. 6-month BHAR | –0.01 | –0.02 | 0.002 | ||||||||||||||||||||||||||||||
| 5. 12-month BHAR | 0.06 | 0.002 | –0.004 | 0.49 | |||||||||||||||||||||||||||||
| 6. 18-month BHAR | –0.01 | –0.06 | –0.01 | 0.48 | 0.76 | ||||||||||||||||||||||||||||
| 7. 24-month BHAR | 0.01 | –0.05 | 0.05 | 0.39 | 0.69 | 0.76 | |||||||||||||||||||||||||||
|
|
|||||||||||||||||||||||||||||||||
| 8. Milestone reached at time of ICO | 0.10 | 0.16 | 0.02 | –0.06 | –0.01 | –0.01 | –0.06 | ||||||||||||||||||||||||||
| 9. Milestone reached 6 months after ICO | 0.16 | 0.29 | 0.08 | –0.07 | –0.07 | –0.08 | –0.11 | 0.71 | |||||||||||||||||||||||||
| 10. Milestone reached 24 months after ICO | 0.52 | 0.74 | 0.03 | –0.05 | –0.07 | –0.01 | 0.03 | 0.25 | 0.51 | ||||||||||||||||||||||||
| 11. Op. development during 6 months after ICO | 0.10 | 0.22 | 0.001 | –0.08 | –0.09 | –0.08 | –0.05 | –0.36 | 0.39 | 0.40 | |||||||||||||||||||||||
| 12. Op. development during 24 months after ICO | 0.35 | 0.49 | –0.09 | –0.004 | –0.01 | 0.06 | 0.03 | –0.65 | –0.19 | 0.57 | 0.52 | ||||||||||||||||||||||
|
|
|||||||||||||||||||||||||||||||||
| 13. Crypto fund | –0.04 | –0.06 | 0.25 | 0.18 | 0.13 | 0.12 | 0.04 | –0.01 | –0.04 | 0.01 | –0.03 | 0.02 | |||||||||||||||||||||
| 14. Crypto venture fund | –0.02 | –0.05 | 0.17 | 0.15 | 0.11 | 0.10 | 0.03 | 0.004 | 0.02 | 0.03 | 0.01 | 0.03 | 0.73 | ||||||||||||||||||||
| 15. Crypto hedge fund | –0.03 | –0.04 | 0.16 | 0.11 | 0.06 | 0.04 | 0.02 | –0.01 | –0.04 | –0.07 | –0.04 | –0.04 | 0.54 | –0.02 | |||||||||||||||||||
|
|
|||||||||||||||||||||||||||||||||
| 16. Expert rating | 0.05 | –0.01 | 0.16 | –0.07 | 0.05 | 0.02 | –0.01 | 0.06 | 0.08 | 0.05 | 0.04 | 0.04 | 0.09 | 0.06 | 0.06 | ||||||||||||||||||
| 17. GitHub open-sourced | –0.03 | –0.02 | 0.005 | –0.08 | 0.04 | 0.05 | –0.02 | 0.02 | 0.01 | –0.11 | 0.03 | –0.02 | 0.06 | 0.05 | 0.04 | 0.45 | |||||||||||||||||
| 18. Business model: Platform | –0.03 | –0.002 | 0.05 | 0.02 | 0.01 | –0.02 | 0.07 | 0.01 | 0.08 | 0.05 | 0.02 | 0.02 | 0.03 | 0.03 | 0.01 | 0.13 | 0.09 | ||||||||||||||||
| 19. # targeted industries | 0.01 | 0.01 | –0.03 | –0.07 | –0.03 | –0.06 | –0.03 | 0.04 | 0.04 | 0.09 | 0.02 | 0.11 | –0.04 | –0.02 | –0.02 | 0.24 | 0.18 | 0.34 | |||||||||||||||
| 20. Ethereum blockchain | 0.002 | 0.01 | 0.03 | –0.02 | –0.05 | –0.07 | –0.01 | 0.03 | 0.01 | –0.01 | –0.04 | –0.07 | 0.01 | –0.02 | 0.03 | 0.02 | 0.01 | 0.05 | –0.03 | ||||||||||||||
|
|
|||||||||||||||||||||||||||||||||
| 21. Pre-sale | 0.04 | 0.04 | –0.03 | –0.10 | –0.07 | –0.11 | –0.12 | 0.05 | –0.01 | 0.04 | 0.01 | 0.01 | –0.06 | –0.06 | –0.03 | 0.29 | 0.15 | 0.09 | 0.18 | –0.01 | |||||||||||||
| 22. Promotion scheme: Bonus | 0.01 | 0.02 | 0.002 | –0.06 | 0.09 | –0.07 | –0.06 | –0.04 | –0.03 | 0.08 | 0.07 | 0.12 | –0.04 | –0.03 | –0.02 | 0.08 | 0.03 | 0.04 | 0.06 | –0.01 | 0.04 | ||||||||||||
| 23. Promotion scheme: Reward | 0.001 | 0.01 | –0.07 | –0.05 | –0.04 | –0.10 | –0.08 | 0.08 | 0.07 | 0.09 | 0.01 | 0.08 | –0.06 | –0.04 | –0.04 | 0.30 | 0.18 | 0.06 | 0.16 | –0.002 | 0.16 | 0.11 | |||||||||||
| 24. KYC | 0.04 | 0.005 | 0.03 | –0.09 | –0.07 | –0.17 | –0.09 | 0.11 | 0.10 | 0.10 | –0.03 | 0.05 | –0.003 | 0.01 | –0.005 | 0.41 | 0.18 | 0.06 | 0.23 | –0.03 | 0.17 | 0.09 | 0.26 | ||||||||||
| 25. # competing ICOs | 0.02 | 0.03 | –0.02 | –0.16 | –0.16 | –0.27 | –0.18 | –0.08 | 0.06 | 0.05 | 0.22 | 0.07 | –0.07 | –0.08 | –0.04 | 0.05 | 0.06 | –0.04 | 0.07 | 0.02 | 0.03 | 0.01 | 0.12 | 0.11 | |||||||||
|
|
|||||||||||||||||||||||||||||||||
| 26. Bull market | –0.004 | –0.01 | 0.09 | 0.10 | 0.13 | 0.21 | 0.16 | –0.09 | –0.03 | –0.07 | 0.02 | –0.06 | 0.10 | 0.06 | 0.03 | –0.19 | –0.07 | –0.02 | –0.15 | 0.01 | –0.13 | –0.10 | –0.28 | –0.37 | –0.23 | ||||||||
| 27. Bear market | 0.02 | 0.08 | 0.05 | –0.12 | –0.12 | –0.23 | –0.17 | –0.06 | –0.01 | 0.07 | 0.06 | 0.05 | –0.01 | –0.01 | 0.01 | 0.15 | 0.09 | –0.03 | 0.12 | 0.01 | 0.14 | –0.05 | 0.17 | 0.21 | 0.57 | –0.33 | |||||||
| 28. Sideways market | 0.01 | –0.05 | –0.14 | 0.06 | –0.03 | –0.02 | 0.14 | 0.07 | –0.11 | –0.08 | –0.06 | –0.04 | 0.16 | 0.05 | 0.03 | 0.06 | –0.05 | 0.09 | –0.08 | 0.08 | 0.14 | –0.18 | –0.23 | –0.33 | |||||||||
| 29. Market volatility during issuance, value-weighted | 0.01 | 0.04 | 0.12 | –0.10 | 0.05 | 0.05 | 0.05 | –0.07 | 0.06 | 0.09 | 0.10 | –0.05 | –0.02 | –0.01 | –0.03 | –0.13 | –0.04 | –0.02 | –0.06 | 0.02 | –0.06 | –0.01 | –0.14 | –0.18 | 0.09 | 0.33 | 0.13 | –0.31 | |||||
|
|
|||||||||||||||||||||||||||||||||
| 30. # team members | 0.03 | 0.01 | 0.19 | –0.04 | –0.08 | 0.01 | –0.03 | 0.09 | 0.10 | 0.04 | 0.01 | 0.05 | 0.08 | 0.06 | 0.05 | 0.40 | 0.20 | 0.09 | 0.14 | 0.03 | 0.13 | 0.06 | 0.14 | 0.28 | 0.03 | –0.11 | 0.10 | –0.001 | –0.03 | ||||
| 31. Team members with technical degree | –0.02 | –0.01 | 0.11 | –0.07 | 0.03 | –0.005 | 0.001 | 0.07 | –0.01 | –0.03 | –0.09 | –0.04 | 0.08 | 0.07 | 0.02 | 0.16 | 0.10 | 0.03 | 0.05 | 0.04 | 0.02 | 0.04 | 0.04 | 0.15 | 0.06 | –0.05 | 0.12 | –0.12 | 0.01 | 0.30 | |||
| 32. Team members with PhD | 0.01 | –0.02 | 0.15 | 0.05 | 0.03 | 0.02 | 0.07 | 0.06 | 0.02 | 0.04 | –0.04 | 0.02 | 0.09 | 0.06 | 0.08 | 0.19 | 0.09 | 0.06 | 0.09 | 0.03 | 0.03 | 0.05 | 0.04 | 0.16 | 0.02 | –0.05 | 0.06 | –0.06 | –0.02 | 0.35 | 0.22 | ||
| 33. Team members with crypto experience | 0.01 | –0.01 | 0.14 | 0.01 | –0.13 | –0.09 | –0.03 | 0.03 | 0.02 | 0.04 | –0.02 | –0.06 | 0.07 | 0.05 | 0.03 | 0.26 | 0.08 | 0.06 | 0.05 | 0.01 | 0.02 | 0.03 | 0.05 | 0.19 | –0.03 | –0.04 | 0.01 | 0.02 | –0.04 | 0.34 | 0.27 | 0.18 | |
Declaration of Conflicting Interests
The authors declared no potential conflicts of interest with respect to the research, authorship, and/or publication of this article.
Funding
The authors received no financial support for the research, authorship, and/or publication of this article.