
Abstract
Necessity entrepreneurship (NE) describes the process of venturing a business out of need when alternative options are seemingly absent. Whereas prior research typically understands NE to be a homogenous construct, recent theorizing suggests the possibility of NE heterogeneity. In this paper we employ Sen’s capability approach to elicit NE variety. Using data gathered from 820 households in rural Tanzania, our cluster analysis generates four distinct types of NE that vary significantly regarding their entrepreneurial activities, determinants and outcomes. Our findings demonstrate the relevance of life satisfaction and reveal the role of choice in NE. Our study thereby advances a nuanced perspective of NE.
Keywords
Interest in entrepreneurship in developing economies is increasing, especially in African countries (Devine & Kiggundu, 2016; George, Corbishley, et al., 2016; Kimmitt et al., 2020; Klingebiel & Stadler, 2015). We adopt the definition of entrepreneurship as all types of self-employment in which people seek to create value by trading products or services on their own account and at their own risk (Hébert & Link, 1988; Stephan, 2018). Scholarship typically distinguishes between opportunity entrepreneurship (OE) and necessity entrepreneurship (NE) (Amorós et al., 2019; Block & Sandner, 2009; Coffman & Sunny, 2021; Fairlie & Fossen, 2019; Reynolds et al., 2005; Van der Zwang et al., 2016). Whereas OE describes activities that pursue promising market opportunities (Block & Wagner, 2010; Bradley et al., 2012; Brewer, 2014), NE is understood as entrepreneurial activities pursued out of need when other livelihood options, such as wage employment, are seemingly absent, or less attractive, practicable, or remunerative (Brewer & Gibson, 2014; Dencker et al., 2021; McMullen et al., 2008; O’Donnell et al., 2021). Research has established that OE and NE are copresent in developed economies (Block & Sandner, 2009; Block & Wagner, 2010; Fairlie & Fossen, 2019; Nikolova, 2019) and that NE is more prevalent than OE in developing economies (Brewer, 2014; Margolis, 2014; McMullen et al., 2008; Wierenga, 2020; Williams & Gurtoo, 2017; Yessoufou et al., 2018).
Although prior research has created valuable knowledge about NE antecedents (Amorós et al., 2019; Brewer & Gibson, 2014; McMullen et al., 2008) and outcomes (Bhuiyan & Ivlevs, 2019; Nikolova, 2019), “our theoretical understanding remains sorely limited” (Dencker et al., 2021, p. 60). We acknowledge three instances where explanations for NE are undertheorized. First, prior research distinguishes between OE and NE (Fairlie & Fossen, 2019), considering NE to be distinct and homogenous (Amorós et al., 2019; Poschke, 2013a). However, there are recent suggestions that NE could be a more heterogeneous construct than has been assumed (Amorós et al., 2019; Brewer, 2014; Dencker et al., 2021; O’Donnell et al., 2021; Rosa et al., 2006). For example, barefoot (Imas et al., 2012), grassroots (Wierenga, 2020), and family-frugal entrepreneurs (Kimmitt et al., 2020) could represent varieties of NE. To conceptualize NE heterogeneity, Dencker et al. (2021) applied Maslow’s (1954) motivational theory. In line with Coffman and Sunny (2021) and O’Donnell et al. (2021), we question this approach for its “foundational premise . . . that a person’s motivations (e.g., for food or safety) will centre on one type of need at the expense of all others” (O’Donnell et al., 2021). In addition to the assumed rigid hierarchy of needs, Dencker et al. (2021) conceptualize NE variety as emerging from the absence versus presence of supportive institutional levers in different contexts. However, their typology overlooks NE variety within the same institutionally supported context.
Second, many scholars appear to have accepted that NE is predominantly motivated by income (Block & Wagner, 2010; Dawson & Henley, 2012; Dencker et al., 2021). This assumption, though, overemphasizes income-driven hedonic aspects of human development (Kimmitt et al., 2020). Given the multidimensional nature of human development and initial empirical evidence in developing economies on different kinds of nonfinancial outcomes (Bhuiyan & Ivlevs, 2019; Kimmitt et al., 2020; Nikolova, 2019; Rahman et al., 2016), we conjecture that nonincome variables, such as life satisfaction, may motivate NE.
Third, prior research has focused on specific NE antecedents, such as access to human (Baptista et al., 2014; Kodithuwakku & Rosa, 2002; Wierenga, 2020), social (Khavul et al., 2009; Khayesi et al., 2014; Smith et al., 2001), and financial capital (Khavul, 2010) and specific outcomes, primarily income (Shepherd et al., 2019; Zahra & Wright, 2016). Only recently have life satisfaction (Kimmitt et al., 2020), mental health (Nikolova, 2019), and subjective well-being been considered as outcomes (Bhuiyan & Ivlevs, 2019; Nikolova, 2019; Rahman et al., 2016). Yet, little is known about constellations of variables that could explain NE outcomes (Bischoff et al., 2020; O’Donnell et al., 2021). In summary, although entrepreneurship in developing economies is typically regarded as an effective “development tool” (Rahman et al., 2016, p. 197) to address poverty and inequality, especially in resource-poor rural areas (Alvarez & Barney, 2014; Bruton et al., 2015; Cho, 2015; Reynolds et al., 2005; Sutter et al., 2019; Zahra & Wright, 2016), the whole field of rural entrepreneurship in less developed countries including Sub-Saharan Africa (SSA) “has been largely overlooked” by scholars (Pato & Teixeira, 2016, p. 3; see also George, Corbishley, et al., 2016). At the same time, ample evidence finds that institutional conditions and entrepreneurial constraints vary substantially between countries (Amorós et al., 2019; Munemo, 2012; Pato & Teixeira, 2016; Vermeire & Bruton, 2016).
With our country-level study, we aim to respond to the three shortcomings outlined above. By adopting Sen’s (1988, 1999b, 1999a) capability approach, we extend NE theoretical perspectives and, hence, elicit NE variety. This approach allows us both to explain NE variety between and within institutional contexts, and illuminate the respective financial and nonfinancial outcomes resulting from such NE variety. At the core of Sen’s capability approach stands the idea of development as the expansion of a person’s freedom to choose (Sen, 1999b) and the commodities and conversion factors at a person’s command (Sen, 1999a). Commodities or bundles of commodities are resource endowments—Sen employs these terms somewhat interchangeably. Conversion factors help transform the resource endowments into sets of capabilities. Depending on an individual’s specific preferences, that person then has the freedom of choice to pursue his or her preferred option(s), that is, to pursue those functionings that he or she values the most. In Sen’s view, those chosen options are the functionings, what a person values doing or being, or what a person eventually “manages to do or be” (Sen, 1999a, p. 7; see also Gries & Naudé, 2011)—understood here as entrepreneurial and nonentrepreneurial activities. Sen’s capability approach thus provides a holistic framework that can “accommodate the diversity of human beings and the complexity of their circumstances” (Dean, 2009, p. 263), and the different outcomes they might choose to pursue. More precisely, Sen’s capability approach acknowledges that although income is one measure of freedom to choose (Gasper, 2002), other outcomes, such as well-being, are also important considerations.
We investigate the research questions, which blend of resources and conversion factors translates into which bundles of entrepreneurial and nonentrepreneurial activities and what impact those bundles of activities have on household financial (income) and nonfinancial (life satisfaction) outcomes. Drawing on a cluster analysis of directly sourced country-level data from 820 households in rural Tanzania, we identify four distinct bundles of activities (NE types), which we label farmer entrepreneurs, subsistors, wage supplementors, and market innovators. The four NE types differ in their resource endowments, conversion factors, and outcomes.
Our paper adds to the literature on entrepreneurship in developing economies, especially SSA, and makes three contributions. First, we empirically demonstrate the presence and prevalence of NE variety within a developing economy context. In doing so, we demonstrate how current entrepreneurship theories leave explanations for NE heterogeneity wanting (Dencker et al., 2021). Second, we advance our scholarly understanding of NE and of entrepreneurial theories in context (Shepherd et al., 2019; Welter, 2011), in particular, that life satisfaction is an important and independent NE outcome in SSA (George, Corbishley, et al., 2016; Wiklund et al., 2019). We thereby critically question predominant assumptions regarding entrepreneurship, income, and life satisfaction and suggest new boundary conditions for entrepreneurship theory. Lastly, we explicate how the shortcomings of applying Maslow’s theory to explain NE variety (Coffman & Sunny, 2021; O’Donnell et al., 2021) can be overcome by integrating the holistic framework of Sen’s capability approach (Sen, 1999a) into NE scholarship.
Necessity Entrepreneurship in Developing Economies
Households in developing economies are embedded in dynamic and complex contexts that are affected by pressures such as climate change, population growth, urbanization, and resource constraints (FAO, 2020). In addition, institutionalized corruption, crime, and restricted access to resources such as financing constrain household incomes (Amorós et al., 2019; Åstebro, 2012; George, Corbishley, et al., 2016). The occupational choice between employment and entrepreneurship (Parker, 2018; Poschke, 2013b) is curtailed because the few employment opportunities available are perceived as less worthwhile or remunerative, so entrepreneurship is accordingly considered to be a “necessity-driven survival practice” (Williams & Gurtoo, 2012, p. 392).
Over the last decade, the push-pull framework dominated the theoretical debate around NE and with it the dichotomous view that contrasts NE and OE as more or less homogeneous concepts (Dencker et al., 2021). In this utility-driven framework, necessity entrepreneurs are described as being pushed into pursuing entrepreneurship rather than pulled by market opportunities (Amit & Muller, 1995; Block & Wagner, 2010; Dawson & Henley, 2012). Responding to institutional and resource constraints, rural households in developing economies typically seek to “work around” (Sydow et al., 2022, p. 331) such difficulties by allocating their limited resources—human, social, financial, and physical capital—between multiple activities, such as subsistence farming, occasional wage employment, and income generation from trading (Blattman et al., 2013; Gautam & Andersen, 2016; Ilyama et al., 2008; Mahama & Maharjan, 2017). In Africa, NE generally refers to small-scale commercial farming (Yessoufou et al., 2018), wholesaling, retailing, and small-scale manufacturing (Kodithuwakku & Rosa, 2002; Rosa et al., 2006). Although household pluri-activity is the norm in Africa (Barrett et al., 2001; Blattman et al., 2013; Brown et al., 2006; Collins et al., 2009) and other developing economies (Goodman & Kaplan, 2019), little is known about the specific bundles of entrepreneurial activities households pursue, their respective antecedents, processes, and outcomes (Dencker et al., 2021).
Previously, Maslow’s hierarchy of needs (1954) has been leveraged to explain NE variety (Dencker et al., 2021). This view rests on the assumption that individuals who struggle to fulfill basic needs (e.g., food or safety), will engage in different entrepreneurial activities than those individuals who seek to fulfill higher-level needs. The implicit claim of this perspective is that individuals who strive to fulfill basic needs cannot, or do not, seek to fulfill higher-level needs. The premise that “a person’s motivations (e.g., food or safety) will centre on one type of need at the expense of all others” (O’Donnell et al., 2021, p. 828) is, however, open to question. If a person can be relatively assured of his or her short-to medium-term survival, then his or her “attentions will turn to higher level needs” (O’Donnell et al., 2021 p. 828). Given that short-to medium-term survival is considered the norm in Tanzania (Wenban-Smith et al., 2016), the linear progression of needs fulfillment overlooks the agentic pursuit of multiple preferences. Furthermore, Dencker et al. (2021) suggest an NE typology that emerges from the absence versus presence of supportive institutional levers in different contexts. Their conceptualization therefore does not explain variety of NE within a single context—irrespective of its level of institutional support. Sen’s capability approach (Sen, 1999a, 1999b), explained in the next section, allows us to address these critiques.
Sen’s Capability Approach
Advancing beyond the central concepts of commodities, conversion factors, capabilities, and functionings (Sen, 1988; 1999b; 1999a) outlined above (see Figure 1), we recall that “if the positive conception of freedom is to reflect our ability to achieve valuable functionings and well-being, then there is clearly a case for viewing this freedom in terms of alternative bundles of functionings that a person may be able to achieve” (Sen, 1988, pp. 278–279; see also Sen, 1999a). The ability to achieve valued functionings and well-being is, in turn, guided by two central assumptions of the capability approach (Sen, 1988; 1999a): the concept of agency and the focus on possibilities as a prerequisite to achieve well-being. First, agency, understood as “a person’s ability to pursue and realize goals that he or she values” (Alkire, 2005, p. 3), implies that a person or—as in our research—households choose from a larger set of alternative options (Gries & Naudé, 2011). These options are grounded in households’ idiosyncratic resource endowments and conversion factors. The resulting bundles of household activities, the functionings, are, in turn, shaped by households’ preferences and are organized in a way to “achieve an optimal balance between expected returns and risk exposure conditional on the constraints they face” (Barrett et al., 2001, p. 316). This assumption also holds for households in poor and resource constrained countries (Sen, 1988; 2005; see also Barrett et al., 2001). Second, Sen (1985) postulates that households choose to allocate their resource endowments and conversion factors across those activities that promise to maximize their material and nonmaterial well-being (Brown et al., 2006). Utilizing Sen’s holistic framework of commodities, conversion factors, capabilities, and functionings (Sen, 1988; 1999b; 1999a), we theorize NE variety in the next section. Schematic diagram of Amartya Sen’s capability approach.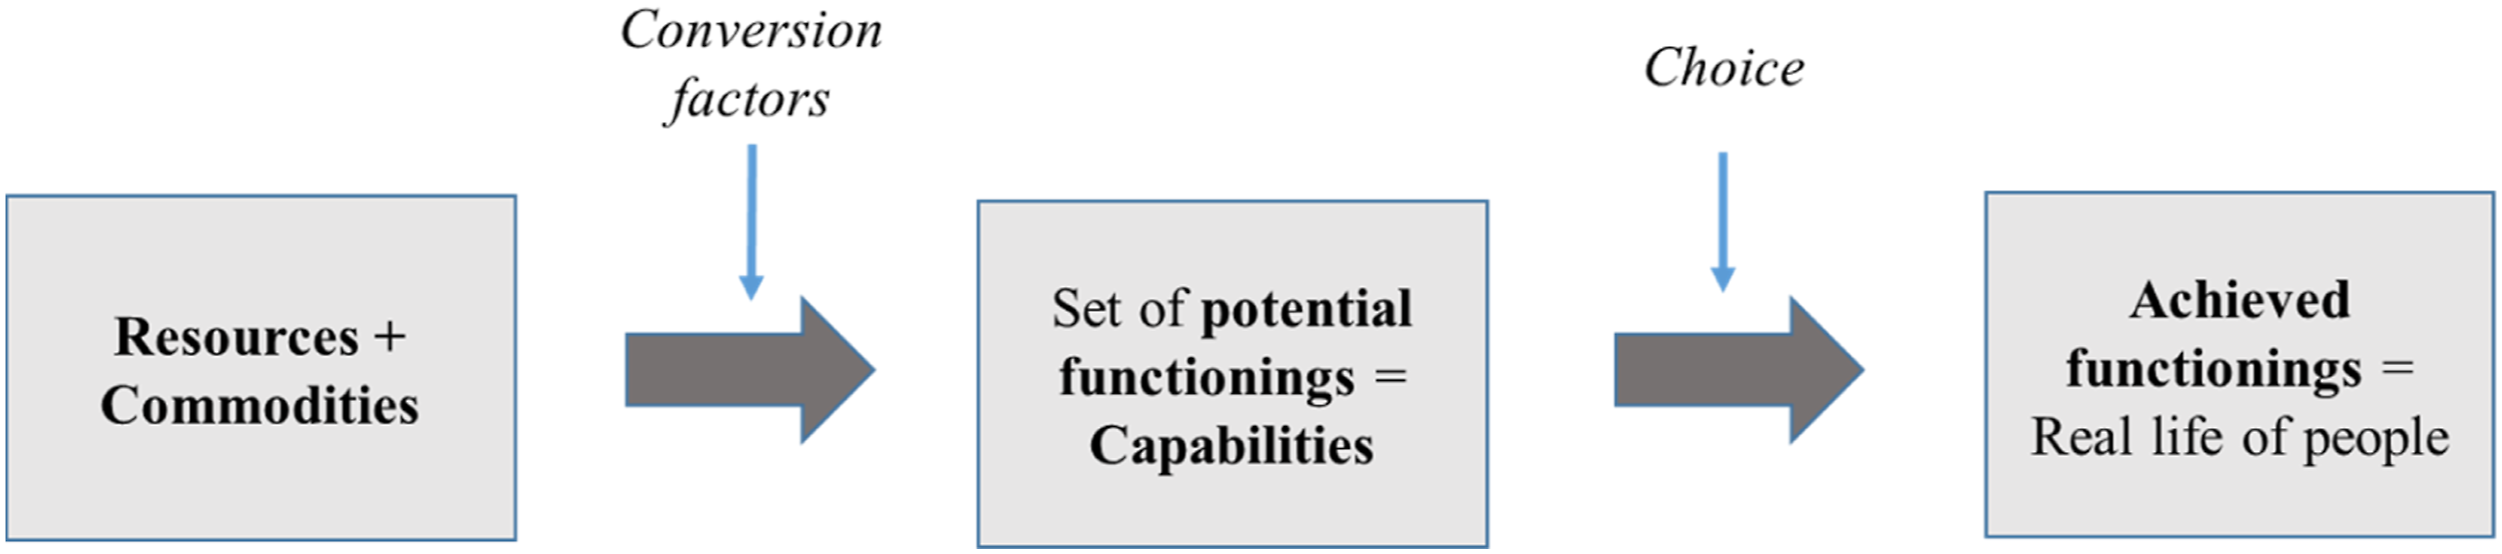
Necessity Entrepreneurship from a Capability Approach Perspective
We begin by questioning the predominant assumption that the motivation for NE, by its very nature, is lack of occupational choice (Blattman et al., 2013; Brewer, 2014; Dencker et al., 2021; Gries & Naudé, 2011; Hechavarria & Reynolds, 2009; Lindsay, 2014; Parker, 2018). According to Sen (1988), even in poor and resource constrained settings, a person still has choices. Admittedly, the range of choices may be significantly narrower for households in less developed countries than in more developed countries (Barrett et al., 2001; Sen, 1988), but they remain choices. For instance, a resource-constrained farmer may consider an offer by his neighbor to work for him as a wage-employee to be not sufficiently remunerative to pursue. He might decide instead to gather and sell freely available natural resources, such as wood, vegetables, and fruits. For Sen (1988) the fact that the farmer has a choice makes a difference in comparison to a person who has neither the offer from his neighbor nor any other alternative. Scrutiny of NE definitions and descriptions allows for this condition: “[T]hey had no better opportunities” (Brewer, 2014, p. 2), “other employment options are either absent or unsatisfactory” (Hechavarria & Reynolds, 2009, p. 418), and “being an entrepreneur is often easier than finding an employer” (Banerjee & Duflo, 2007, p. 162). A capability set is determined by a person’s resource endowments and the conversion factors that transform them into functionings (Sen, 1988; 1999b; 1999a, 2005). The capability set thus encompasses all options that are possible based on the given resource endowments and conversion factors.
Prior entrepreneurship scholarship has identified a range of resource endowments that facilitate NE (Alvarez & Barney, 2014; Bradley et al., 2012; Gras & Nason, 2015; Sutter et al., 2019). Such resources include financial (Carter et al., 2004; Khavul, 2010), social (Davidsson & Honig, 2003; Kodithuwakku & Rosa, 2002) and human capital (Baptista et al., 2014; Cho, 2015; Kodithuwakku & Rosa, 2002). Research in SSA has found entrepreneurship to be positively impacted by financial capital in Kenya (Bradley et al., 2012; George, Kotha, et al., 2016); social capital in Ghana (Boso et al., 2013), Uganda (Blattman et al., 2013; Khavul et al., 2009; Khayesi et al., 2014; Smith et al., 2001), Kenya (Sydow et al., 2022; Khavul et al., 2009), and Tanzania (Lanjouw et al., 2001) and by human capital in Kenya (Babu et al., 2016; Bradley et al., 2012) and Ethiopia (Babu et al., 2016). Physical capital, such as land ownership, also constitutes an important resource endowment (Collins et al., 2009; Kodithuwakku & Rosa, 2002). Alongside these findings on the presence and quantity of particular types of capital, Martin and Lorenzen (2016), using data from more and less entrepreneurially active households in rural Laos, empirically demonstrate that “increasing the diversity of assets (rather than the quantity of any one single asset) of the poor [is] more likely to be successful” (p. 231).
Instrumental in the transformation of commodities into functionings is the presence of conversion factors (Sen, 1988; 1999a). Sen differentiates between personal (age, sex, education), social (family relations, norms), and environmental (climate, region) conversion factors (Sen, 2005). Although there is some overlap between commodities and conversion factors (Gasper, 2002), the household unit acts as a repository of “capital goods, raw materials and labour” (Sen, 1999a, p. 10). Hence, the blend of resource endowments and conversion factors may increase or reduce a household’s capability set and thereby either encourage or constrain a household’s pursuit of entrepreneurial activities (Vermeire & Bruton, 2016). Moreover, the blend of a household’s resource endowments and conversion factors differs from household to household: “The more diverse a family household, the greater the variety of perspectives, knowledge, advice, skills, experience, and contacts that may be offered by the collective” (Gras & Nason, 2015, p. 555; see also Foo et al., 2005). Given households’ idiosyncratic blend of resource endowments and conversion factors, one can no longer expect their capabilities and functionings to be the same; they are more likely to differ. In summary, a deeper consideration of a household’s resource endowments, conversion factors, and functionings paves the way for an explanation of NE variety.
Necessity Entrepreneurship Outcomes
Income has typically been taken into account in assessments of entrepreneurial outcomes (Shepherd et al., 2019), particularly when viewed from the perspective of occupational choices (Parker, 2018; Poschke, 2013b). This approach also holds for SSA, where prior research has found that household entrepreneurial activities indeed provide a “development tool” (Rahman et al., 2016, p. 197) and an escape from poverty (Devine & Kiggundu, 2016; Reynolds et al., 2005; Zahra & Wright, 2016) by increasing household financial outcomes. The capability approach, however, views income as the means of achieving what a person truly values (Sen, 2000). By the same token, prior research has broadened the conception of entrepreneurial performance to include nonfinancial outcomes (Kautonen et al., 2017), such as life satisfaction. Life satisfaction is a multidimensional construct comprising several different domain satisfactions, such as education and health (Hsieh, 2003; 2016; Rojas, 2006) and forms one domain of subjective well-being (Bort et al., 2021; Wiklund et al., 2019). Life satisfaction is understood as the cognitive component of subjective well-being and is “primarily concerned with the respondents’ own internal [perceptional] judgment of well-being, rather than what policymakers, academics, or others consider important” (Diener & Suh, 1997, p. 201). Whereas subjective well-being has recently been considered in developing economies (Amorós & Christie, 2011; Bhuiyan & Ivlevs, 2019; Kimmitt et al., 2020; Stephan, 2018), the predominant motivation for NE has been attributed to fulfilling basic needs (Dencker et al., 2021). However, the assumption that subjective well-being is immaterial in those contexts reflects a narrow view of NE in which idiosyncratic household resource endowments, conversion factors, and preferences are not acknowledged.
Capabilities, Functionings, and Well-Being
Building on the assumption that a capability set is a prerequisite to achieving well-being, Sen postulates that the size of the capability set from which a person can choose reflects both an instrumental freedom and, “over and above its instrumental role” (Sen, 1988, p. 290), an intrinsic freedom. From the instrumental freedom perspective, households will always seek to maximize their financial and nonfinancial outcomes (Sen, 1988), for this will enable them to “lead the kind of lives they want to lead, to do what they want to do and be the person[s] they want to be” (Robeyns, 2005, p. 95; see also Sen, 1999a). The notion of intrinsic freedom goes one step further when Sen notes that the intrinsic freedom of choice per se leads to a certain degree of well-being because “‘choosing’ may itself be an important functioning . . . choosing is itself valuable, the existence and extent of choice have significance beyond that of providing only the means of choosing the particular alternative that happens to be chosen” (Sen, 1988, p. 290). In summary, “doing x and choosing to do x are, in general, not equivalent” (Sen, 1988, p. 292). We anticipate that intrinsic freedom is reflected in reported subjective well-being, or life satisfaction, for a person who has at least some choice and who values that freedom of choice as an end in itself will be more satisfied than his or her counterpart who does not have a choice—regardless of the circumstances. We thus set out to investigate, first, the activity bundles resulting from the idiosyncratic blend of household resource endowments and conversion factors and, second, the impact that these bundles have on household income and life satisfaction.
Data and Method
Research Site
Sub-Saharan Africa refers to land partially or fully below the Sahara Desert and comprises 46 countries that are grouped into West, Central, East, Southeast, Horn, and Southern Africa. Tanzania (in East Africa) is currently categorized as a developing economy striving to become a middle-income economy by 2025 (Anania & Nade, 2020). With an estimated population of 58 million, per capita income increased from $958 in 2016 to $1122 in 2019 (URT, 2018; World Bank, 2020). Tanzania is predominantly an agricultural economy (FAO, 2020), with 66.3% of its population being engaged in agriculture (URT, 2018) and accounting for approximatively 8.8 million farms (URT, 2016). Like most households in SSA (Gautam & Andersen, 2016; Ilyama et al., 2008; Mahama & Maharjan, 2017), Tanzanian rural households typically engage in multiple entrepreneurial and nonentrepreneurial activities in parallel. Such entrepreneurial activities include wholesale, retail, manufacturing, and the production and sale of the farmer’s own agricultural crops or processed products (FAO, 2018). Goodman and Kaplan (2019) also describe such a “combination of commercial farming, subsistence agriculture, and waged work” (p. 467) in their study of rural India. Household farming for subsistence needs, however, is not considered an entrepreneurial activity because no products are traded. This categorization is also true for occasional wage employment.
Data Collection
The unique dataset is part of the GlobE research initiative focusing on food security, technology, and knowledge transfer in Tanzania.
1
Two of the authors and their research teams collected the data from two regions in Tanzania that represent different agroecological systems: Morogoro (semihumid) and Dodoma (semiarid) (Figure 2). Within each region three representative villages were selected. The main criteria for selecting the villages in each region were climatological similarity, economic structure in terms of market access, cropping system, livestock, and village size (ranging from 800 to 1500 households). Research site and participating communities.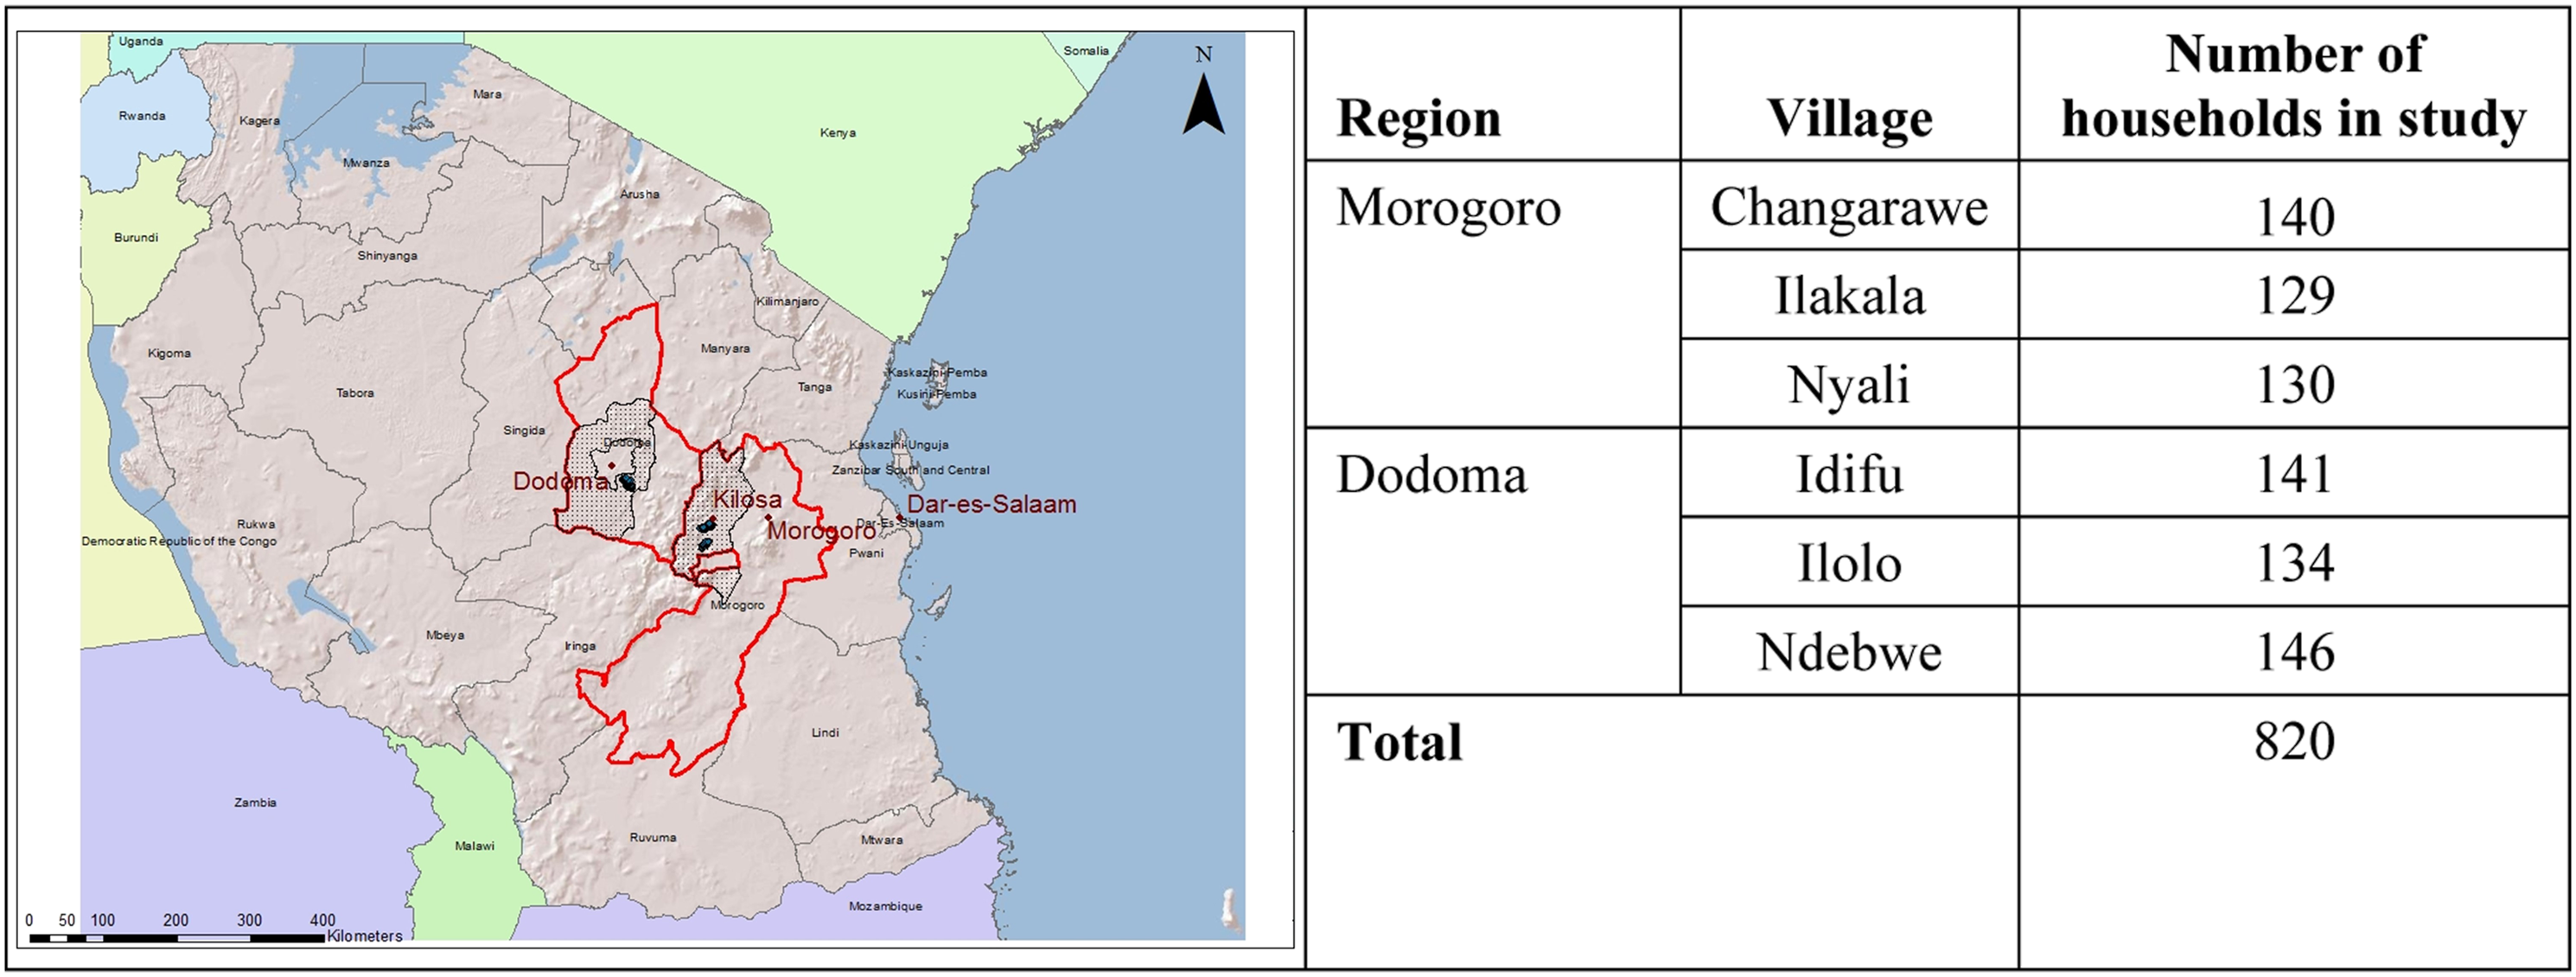
Within each village, the households were randomly selected from village household lists provided by the Tanzanian Agriculture Research Institutes (TARI) in Kilosa and Hombolo. The lists contained the names of the head of household and the corresponding village. After sorting the lists alphabetically, we randomly selected 30% of the households from each village (in proportion to village size) resulting in 820 households from Dodoma (n = 421) and Morogoro (n = 399) in total. Before the data collection, a team of postdoctoral, doctoral, and graduate students from Germany and Tanzania was established. The 12 enumerators from the Tanzanian University attended a one-week training course and pretested the survey instrument with households. (The results from the pilot survey are not included in the analysis.) Supported by the village leaders, the survey team contacted the heads of the preselected households and visited them in their respective houses. A structured interview lasting on average three hours was conducted with each head of household to gather detailed data on household resource endowments, income-generating activities, income, and life satisfaction. After each structured interview, the completed survey was cross-checked for plausibility and consistency by another enumerator. In cases of incomplete or inconsistent information, the enumerator revisited the household to gather the missing data. When a survey was complete, it was passed on to the team leader for review. Data collection lasted eight weeks.
As in prior entrepreneurship research in developing economies, the unit of analysis is the household (Bookwalter et al., 2006; Gras & Nason, 2015; Kimmitt et al., 2020). A household can be defined in multiple ways, such as “living together and building a common economic unit” (Hoffmeyer-Zlotnik & Warner, 1998, p. 51) or as a combination of elements such as “same housing,” “meals together,” and “shared economic unit” (Bien & Quellenberg, 2003, p. 280). In our study we employ the definition that a household is a “social group which resides in the same place, shares the same meals, and makes joint or coordinated decisions over resource allocation and income pooling” (Ellis, 1998, p. 6). The household is thus understood as a “single decision making unit” (Ellis, 1998, p. 6) in which family and firm are inextricably linked “as the basal system for economic activity” (Gras & Nason, 2015, p. 546). Accordingly, data was gathered from the head of household, for “the response of household heads is determined largely by factors shared by the entire household” (Bookwalter et al., 2006, p. 405) and holds for well-being because “household heads are truly reporting household well-being, rather than their individual level of satisfaction” (p. 405).
Measures
Operationalizing Sen’s capability approach has been considered difficult because of the complexity of the framework (Agee & Crocker, 2013; Chiappero-Martinetti & Salardi, 2008; Dean, 2009; Gasper, 2002; Robeyns, 2000, 2006) and the lack of specificity between commodities and conversion factors, and between capabilities and functionings (Gasper, 2002). “It is . . . unquestionable, and acknowledged by its supporters, that operationalization of the CA [capability approach] is an undertaking that poses daunting methodological and empirical challenges” (Chiappero-Martinetti, 2021, p. 246). For example, Sen has been reluctant to specify a list of capabilities (Sen, 1993; 2004; see also Dean, 2009). Given the informational problems associated with defining and measuring capabilities, and given our focus on well-being, “the appropriate metric is functionings” (Robeyns, 2006, p. 354) together with related well-being outcomes. In summary, our adopted empirical strategy employs measures for household resource endowments, conversion factors, income generation activities, income, and life satisfaction. Detailed information on all variables, their operationalization and respective sources is provided in Supplemental TableA1 of the Appendix.
Dependent variables
For the financial outcome, the total household net income was used. We calculated annual income according to Purchasing Power Parity (PPP) adjusted $2010 (denoted as $PPP) as defined and recommended by the World Bank (Johnson et al., 1990). The sources of income are (a) nonfarm self-employment; (b) wage employment; (c) collection of public natural resources, such as foraged wood, vegetables, and fruit; (d) livestock keeping; (e) agriculture (crop farming); and (f) remittances and transfers received. Remittances received comprise money and in-kind payments from friends and relatives who are not members of the same household. Transfers received are payments from temporarily absent (migrated) household members.
For the nonfinancial outcome, life satisfaction was selected for two reasons. First, it is the most widely used component of well-being (Kroeger & Weber, 2014; Kroll & Delhey, 2013) and is central to Sen’s capability approach: “‘Well-being’ is concerned with a person’s achievement” (Sen, 1999a, p. 3; see also Sen, 1999b). Second, self-reporting has been found to be statistically fairly reliable (Diener et al., 2013). Life satisfaction was measured by asking the participants: “All things considered, how satisfied are you with your life as a whole these days?” Responses were assessed on a scale ranging from 1 (completely dissatisfied) to 10 (completely satisfied). As a multidimensional construct, life satisfaction comprises several different domain satisfactions (Carp & Carp, 1982; Loewe et al., 2014; Rojas, 2006). To measure the individual domain satisfactions, the same question was adapted to seven commonly used domains of life satisfaction: education, health, safety, financial situation, housing, social integration, and leisure (Cummins et al., 2003; Hsieh, 2003, 2016). To illustrate, satisfaction with health was measured by asking the households “on a scale from 1 (completely dissatisfied) to 10 (completely satisfied), how satisfied are you with your health?”
Independent Variables
The independent variables comprise resource endowments and conversion factors (Sen, 2005). Empirically, the distinction between resource endowments and conversion factors is unclear (Gasper, 2002). Conceptually, Sen distinguishes resource endowments from conversion factors clearly for the most part, but sometimes he allows these two constructs to blur. For example, personal human capital is described as “human qualities that can be employed as ‘capital’ in production in the way physical capital is” (Sen, 1997, p. 1959) and as a conversion factor (Sen, 1999a; Robeyns, 2005). Similarly, social capital has been seen as resource endowment, conversion factor, and functioning (e.g., Ansari et al., 2012; Gasper, 2002). Although difficult to handle empirically, this blurring of concepts seems comprehensible given the complexity and multifaceted nature of those two capital types.
Previous studies that have implemented Sen’s capability approach empirically and operationalized resource endowments and conversion factors differ in both their conceptional and econometric approaches (Chiappero-Martinetti, 2021; Lessmann, 2012). Studies analyzing capabilities and well-being in the development context have typically used simple logistic regressions (Oni & Adenike Adepoju, 2014). Publications in the field of entrepreneurship in development contexts employing the capability approach are scarce and often qualitative (Kimmitt & Dimov, 2021; Wakkee et al., 2018). An exception is a quantitative analysis using a structural equation model that focuses on determinants of entrepreneurial activities in general (Naminse et al., 2019), but it does not distinguish between different types of entrepreneurship. To the best of our knowledge, no comparable studies exist that empirically assess resource endowments and conversion factors to explain NE and its impact on well-being in the context of developing countries.
Resource endowments and conversion factors
To operationalize resource endowments and conversion factors, we employed the following variables derived from the literature: (a) human capital (age, education, household size, gender); (b) social capital (mobile phone ownership, access to market information, and group membership in, say, a farmers’ group, women’s group, cooperative, or religious group); (c) financial capital (loan, savings, value savings); (d) physical capital (land owned); and (e)physical capital (non-land) (livestock measured in tropical livestock units, and asset score). The asset score was calculated based on the reciprocal ownership of the household’s productive and nonproductive assets, such as a bicycle, mobile phone, radio, motorcycle, or stove, as compared to the other households in the sample (Morris et al., 2000). Assets owned only by a few households therefore achieved a higher score than assets owned by almost all households.
Additional proxy measures for conversion factors were employed as well. Household governance measured internal family relations and constellations (Kimmitt et al., 2020) by means of items that asked respondents about their household structure (one or two parent household), decision-making processes (whether decisions were made individually by the head of household or shared between the household head and partner), and the involvement of children in the household. Furthermore, we investigated three types of household decisions by asking about agriculture, selling, and investment preferences. The investment preferences were divided into investments into business, agriculture, cases of emergency to buy food, and to pay for emergency medical treatment. To account for spatial characteristics of the rural environment, environmental characteristics were measured in “distance [kilometers] to village center” (Mahama & Maharjan, 2017; Soltani et al., 2012) and used as a regional dummy variable (Mahama & Maharjan, 2017) to indicate whether the household lived in Morogoro (Morogoro 1: yes, Dodoma 0: no). Doing so, this variable also accounted for the different climatic conditions in the two regions.
Additional indicators
Household commercialization index
The Household Commercialization Index (HCI) is constructed as the ratio of the value of crop sales to total value of crop production (Von Braun & Kennedy, 1994) and reports whether the households pursue additional income generation by selling part of their own crops.
Overall income from entrepreneurial activities
The Overall Income from Entrepreneurial Activities (OIEA) is the sum of income from crop commercialization (HCI) and income from nonfarm self-employment.
Entrepreneurial sophistication
This indicator comprises four components: (a) overall income from entrepreneurial activities (OIEA), (b) percentage of nonfarm self-employment, (c) business experience (duration of nonfarm self-employment activities in months per year), and (d) number of employees (hiring family and nonfamily members). For each component, the four clusters were ranked (1 through 4, with 4 being the highest score; 1, the lowest) in the order of their respective values. The rankings were then summed (producing a potential maximum score of 16 on entrepreneurial sophistication).
Data Analysis
To identify households’ different entrepreneurial activity bundles, resource endowments and conversion factors, we applied a two-step cluster analysis (Model 1). To measure the impacts of the respective entrepreneurial activity bundles on income and life satisfaction outcomes, we applied an endogenous switching regression (ESR) (Model 2).
Model 1: Two-step cluster analysis to identify typical entrepreneurial activity bundles
Cluster analysis is useful for conducting comparative entrepreneurship research (Crum et al., 2020; Gartner, 2008). However, few studies have adopted the method with data from developing economies (Marcotte, 2014). In our study, we applied a two-step cluster analysis to disentangle the sample into distinct clusters of functionings—represented by household entrepreneurial and nonentrepreneurial activity bundles (Chiu et al., 2001). The two-step cluster analysis has two advantages over other cluster algorithms, such as hierarchical or k-means cluster analyses. First, it accommodates data measured on different scales (metric, ordinal, or nominal) simultaneously. Second, either the Akaike Information Criterion or the Bayes Information Criterion can be selected to derive the most robust number of clusters based on statistical criteria (Moi & Sarstedt, 2011). Because we sought to generate objective clusters, the latter argument was superior to the more subjective cluster-selection process of hierarchical algorithms. In this study we applied the Akaike Information Criterion. The noise-handling procedure of the two-step cluster analysis identified two households as outliers, so we excluded them from further analysis. We followed an input-based approach using the shares of all possible income-generating activities as a share of total income (Barrett et al., 2001; Soltani et al., 2012). In addition, we included the HCI, accounting for agricultural business. Furthermore, a self-employment dummy from 2013 and 2016 was applied. This dummy shows whether the households have pursued self-employment activities to generate income throughout a period of 3 years. Four distinct clusters were derived from the analysis—farmer entrepreneurs, subsistors, wage supplementors, and market innovators.
Model 2: Endogenous Switching Regression to assess the impact on outcomes
Model 2 measures the impact that entrepreneurial activity bundles have on income and life satisfaction. The econometric challenge of impact assessment is to identify a suitable counterfactual against which to assess the impact of the treatment on a specific outcome and thereby control for endogeneity and self-selection bias. Ideally, the treatment is exogenously and randomly assigned to a given population. In this way the effect that observable and unobservable characteristics of households have on the desired outcome is the same, so the assessed impact can be attributed only to the treatment itself. This procedure would be a randomized controlled trial (Duflo & Kremer, 2008; White, 2013). In our case a research design based on a randomized controlled trial was not feasible, for treatments such as entrepreneurial behavior are not exogenous. We therefore used the ESR.
The ESR model had two main advantages for this study. First, it enabled us to generate two counterfactuals econometrically. One of them pertained to the observable entrepreneurially highly active households, which then shows what the outcome would be if they were not entrepreneurially active. The other counterfactual pertained to the households that were observably less entrepreneurially active, if at all. It showed what the outcome would be if they were entrepreneurially more active. Second, ESR accounted for both self-selection bias and endogeneity of the entrepreneurial activity bundles and the outcomes by estimating a two-stage equation model (Di Falco et al., 2011; Shiferaw et al., 2014) of the effect that cluster membership (treatment) has on net income and life satisfaction domains (outcomes). In the first stage we used a probit selection model for cluster membership (treatment). Substantively, this step also enabled us to assess which resources and conversion factors drive and explain household NE cluster membership. In the second stage we modeled the impact of cluster membership on total household net income and on life satisfaction by employing a tobit regression to account for censored outcome data (domain life-satisfaction measurement, scale 1–10) and an Ordinary Least Squares regression to estimate the treatment effect on households’ income (Shiferaw et al., 2014). The treatments used are the clusters with a high level of entrepreneurial sophistication (Cluster 4: market innovators, and Cluster 1: farmer entrepreneurs) compared to the clusters with low level of entrepreneurial sophistication (Cluster 2: subsistors, Cluster 3: wage supplementors).
The principle of ESR is to estimate two different counterfactual cases for being observable in either a distinct cluster or otherwise. As exemplified by Cluster 4, the ESR estimates the observed life satisfaction of Cluster 4 households and of households constituting Clusters 2 and 3 instead of Cluster 4. Next, the ESR investigates the expected life satisfaction in the counterfactual hypothetical cases: first, the one in which the Cluster 4 households would choose the activity bundles of Clusters 2 and 3 and, second, the one in which the households of Clusters 2 and 3 would instead choose Cluster 4 activity bundles. In this procedure the effect of the treatment on the treated (TT) was calculated as the difference between the observed Cluster 4 (a) and the expected outcome of Clusters 2 and 3 (c). The effect that the treatment has on the untreated (TU) was calculated as the difference between (b) and (d). The significance of the differences is tested by using the t-test for unequal variances. It allows us to estimate whether there is a statistically significant difference in the level of life satisfaction, accounting for the endogeneity problem.
Results
Description of Sample
Descriptive Statistics of Explanatory Variables: Resource Endowments and Conversion Factors, by Cluster.
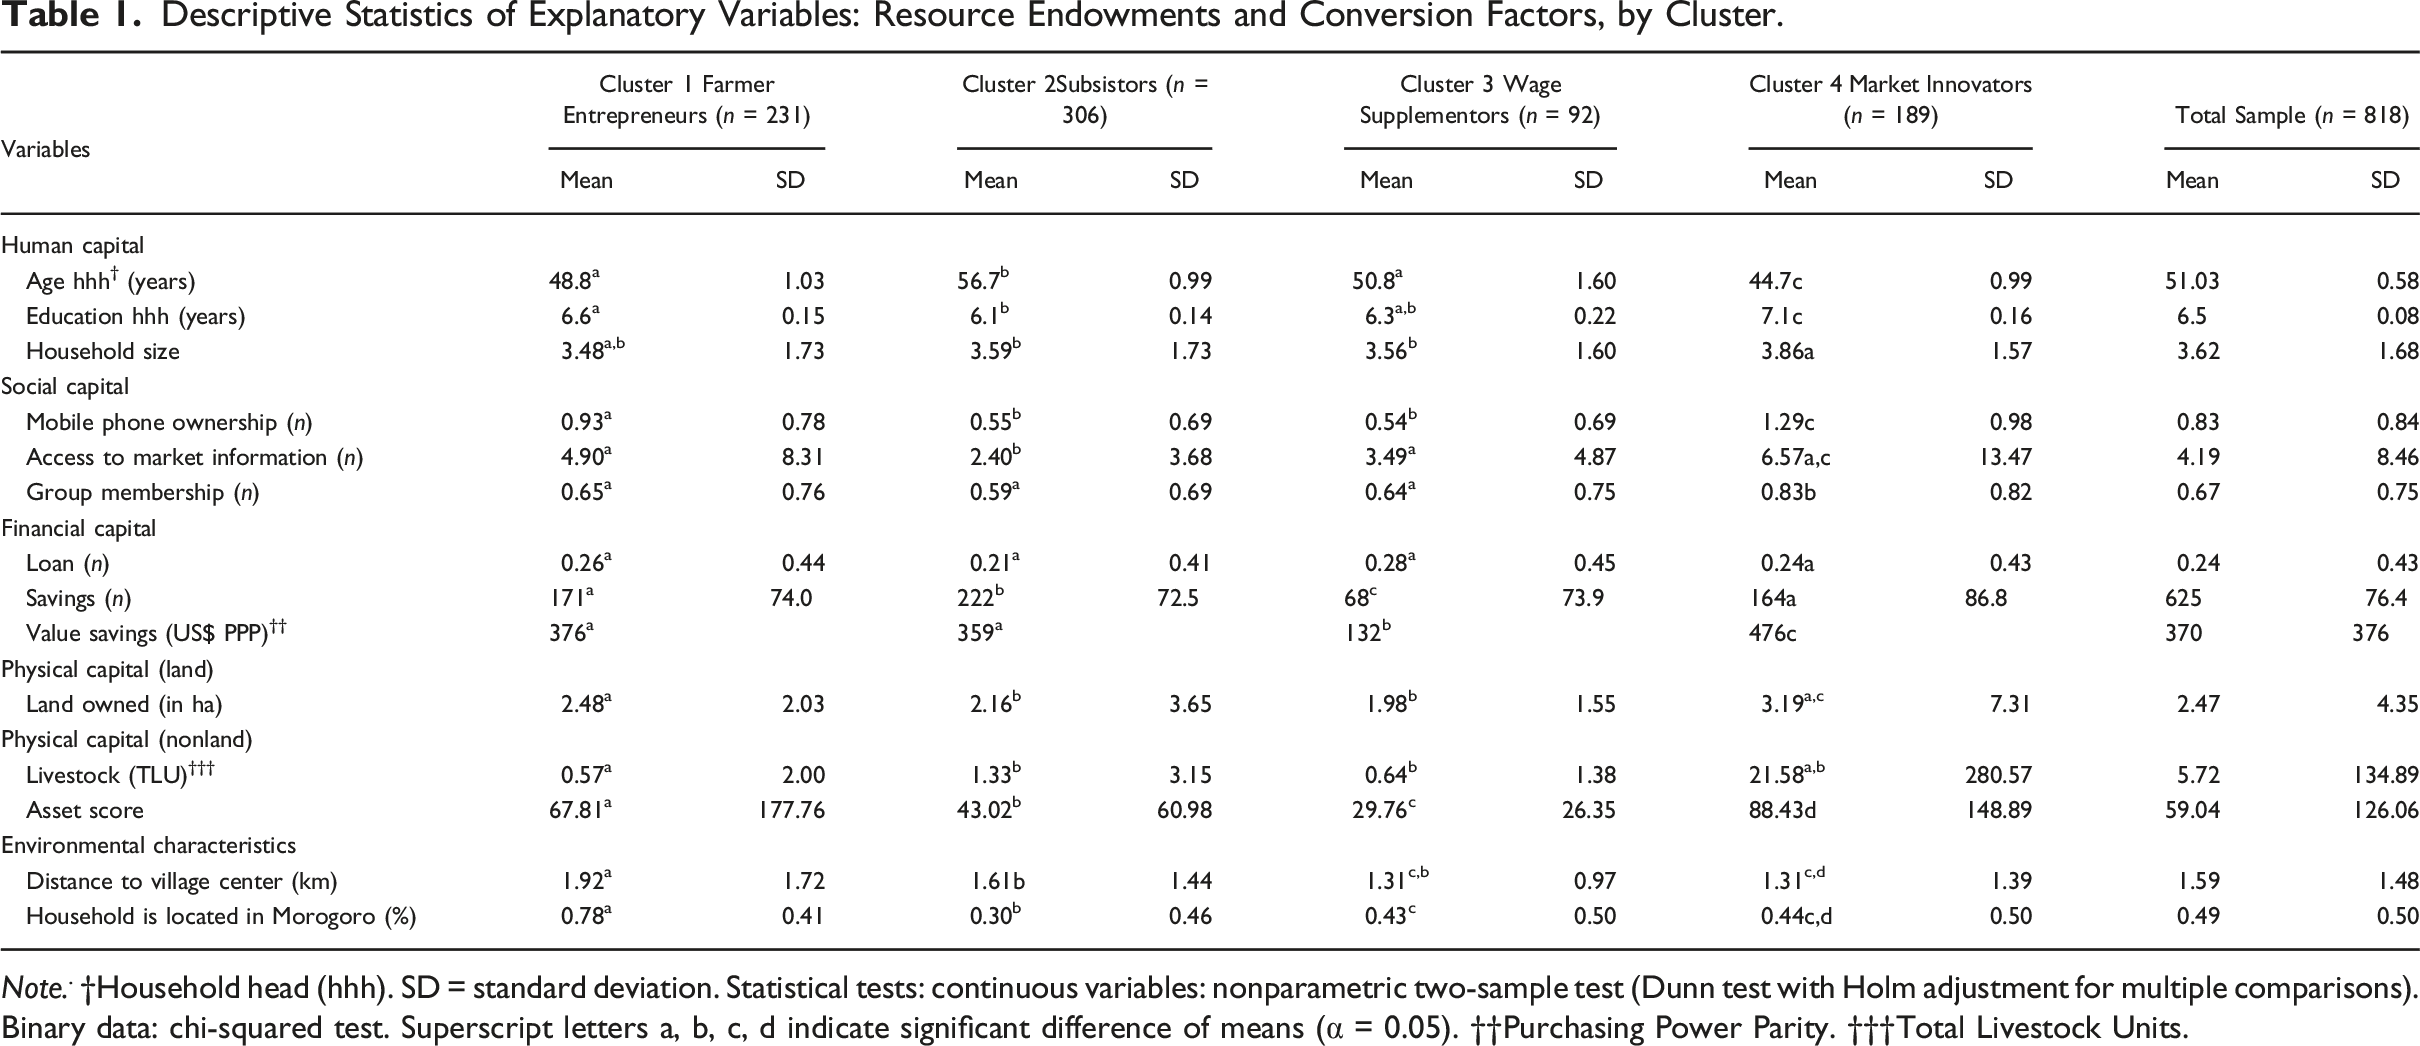
Note. . †Household head (hhh). SD = standard deviation. Statistical tests: continuous variables: nonparametric two-sample test (Dunn test with Holm adjustment for multiple comparisons). Binary data: chi-squared test. Superscript letters a, b, c, d indicate significant difference of means (α = 0.05). ††Purchasing Power Parity. †††Total Livestock Units.
Descriptive Statistics of Explanatory Variables: Conversion Factor Household Governance, by Cluster.
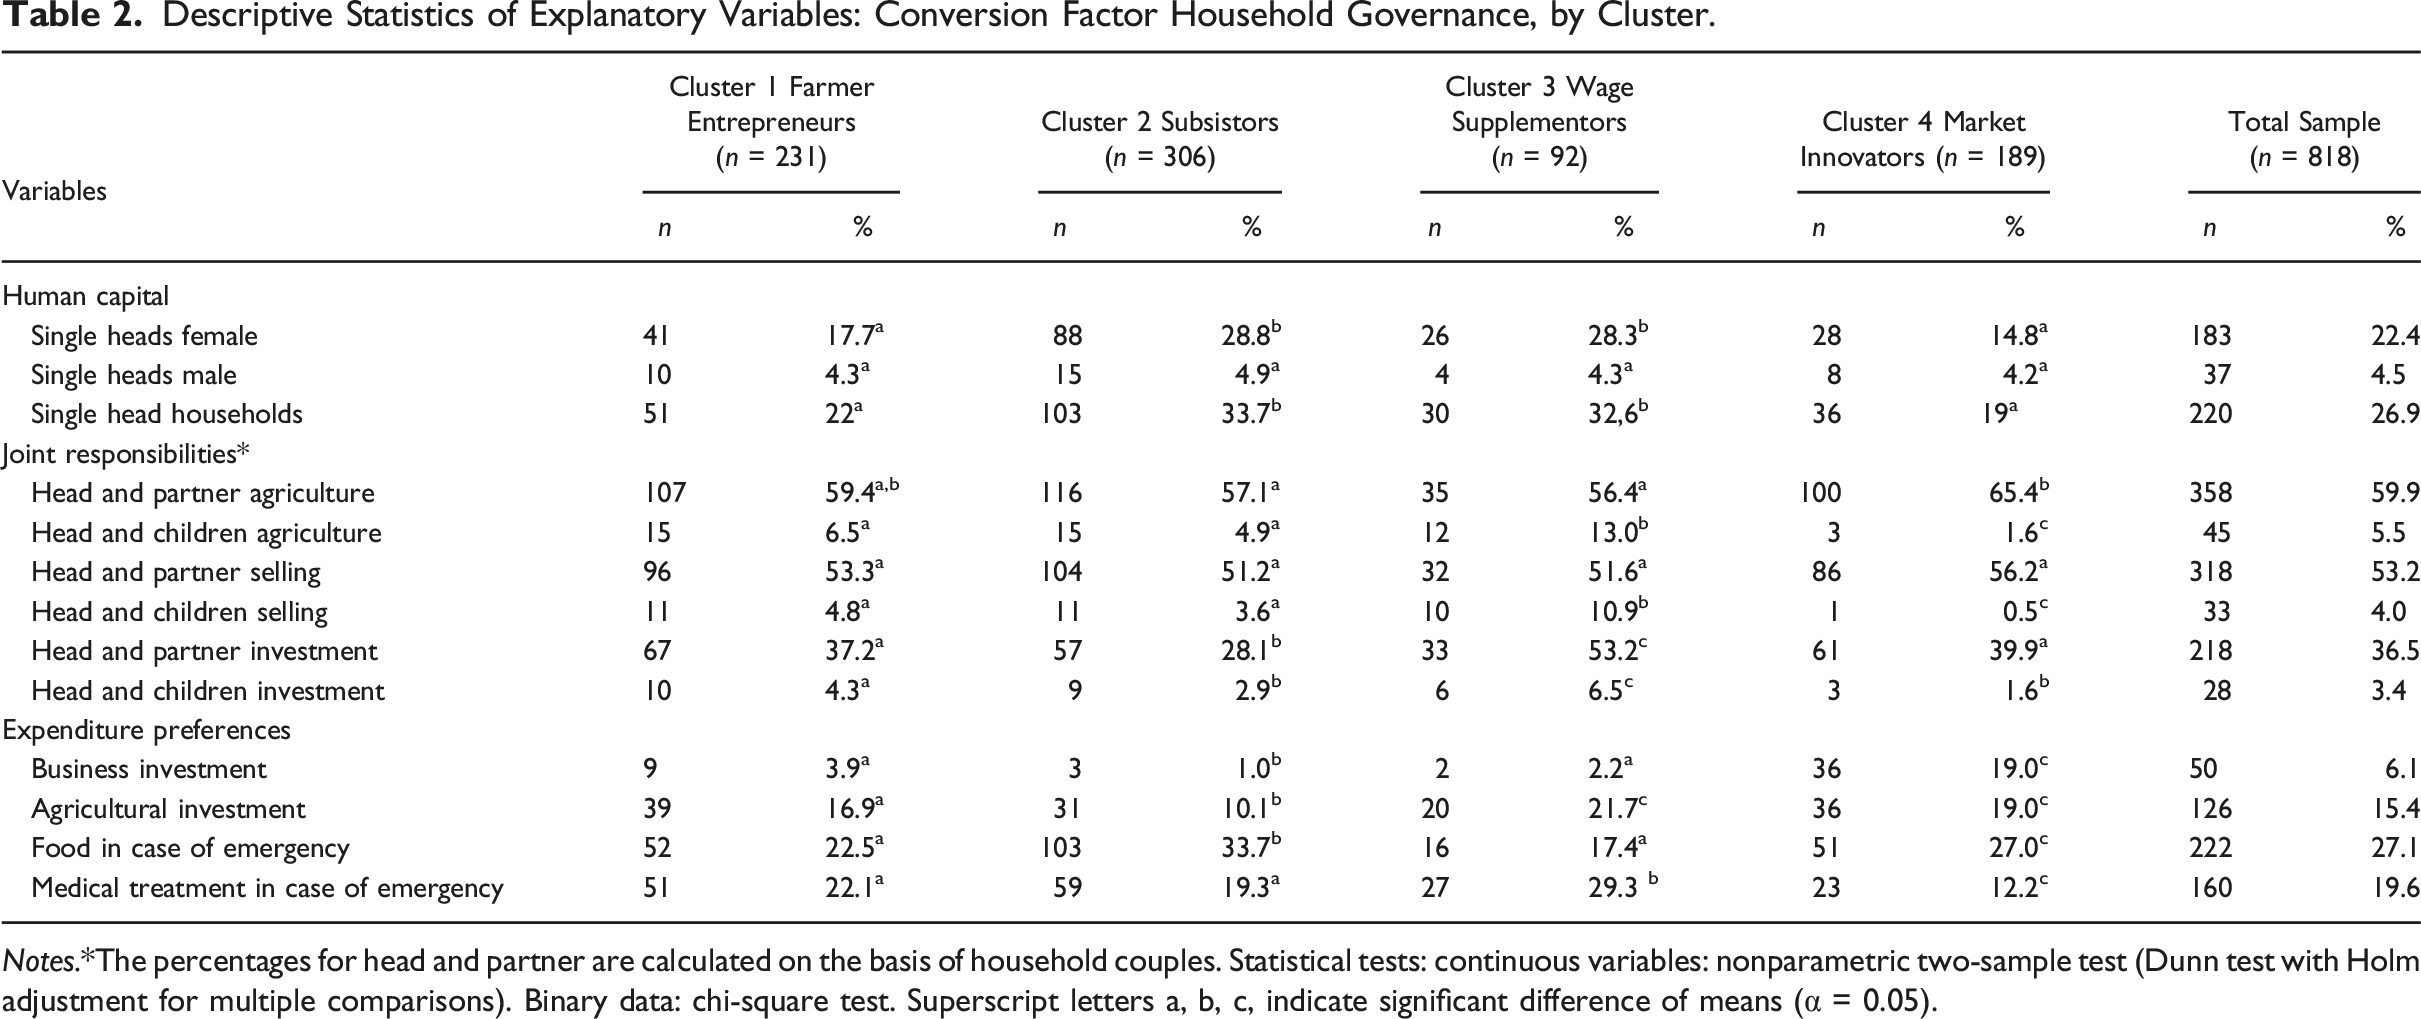
Notes.*The percentages for head and partner are calculated on the basis of household couples. Statistical tests: continuous variables: nonparametric two-sample test (Dunn test with Holm adjustment for multiple comparisons). Binary data: chi-square test. Superscript letters a, b, c, indicate significant difference of means (α = 0.05).
Varieties of Necessity Entrepreneurship
Descriptive Statistics of Explanatory Variables: Well-being and Entrepreneurial Sophistication by Cluster.
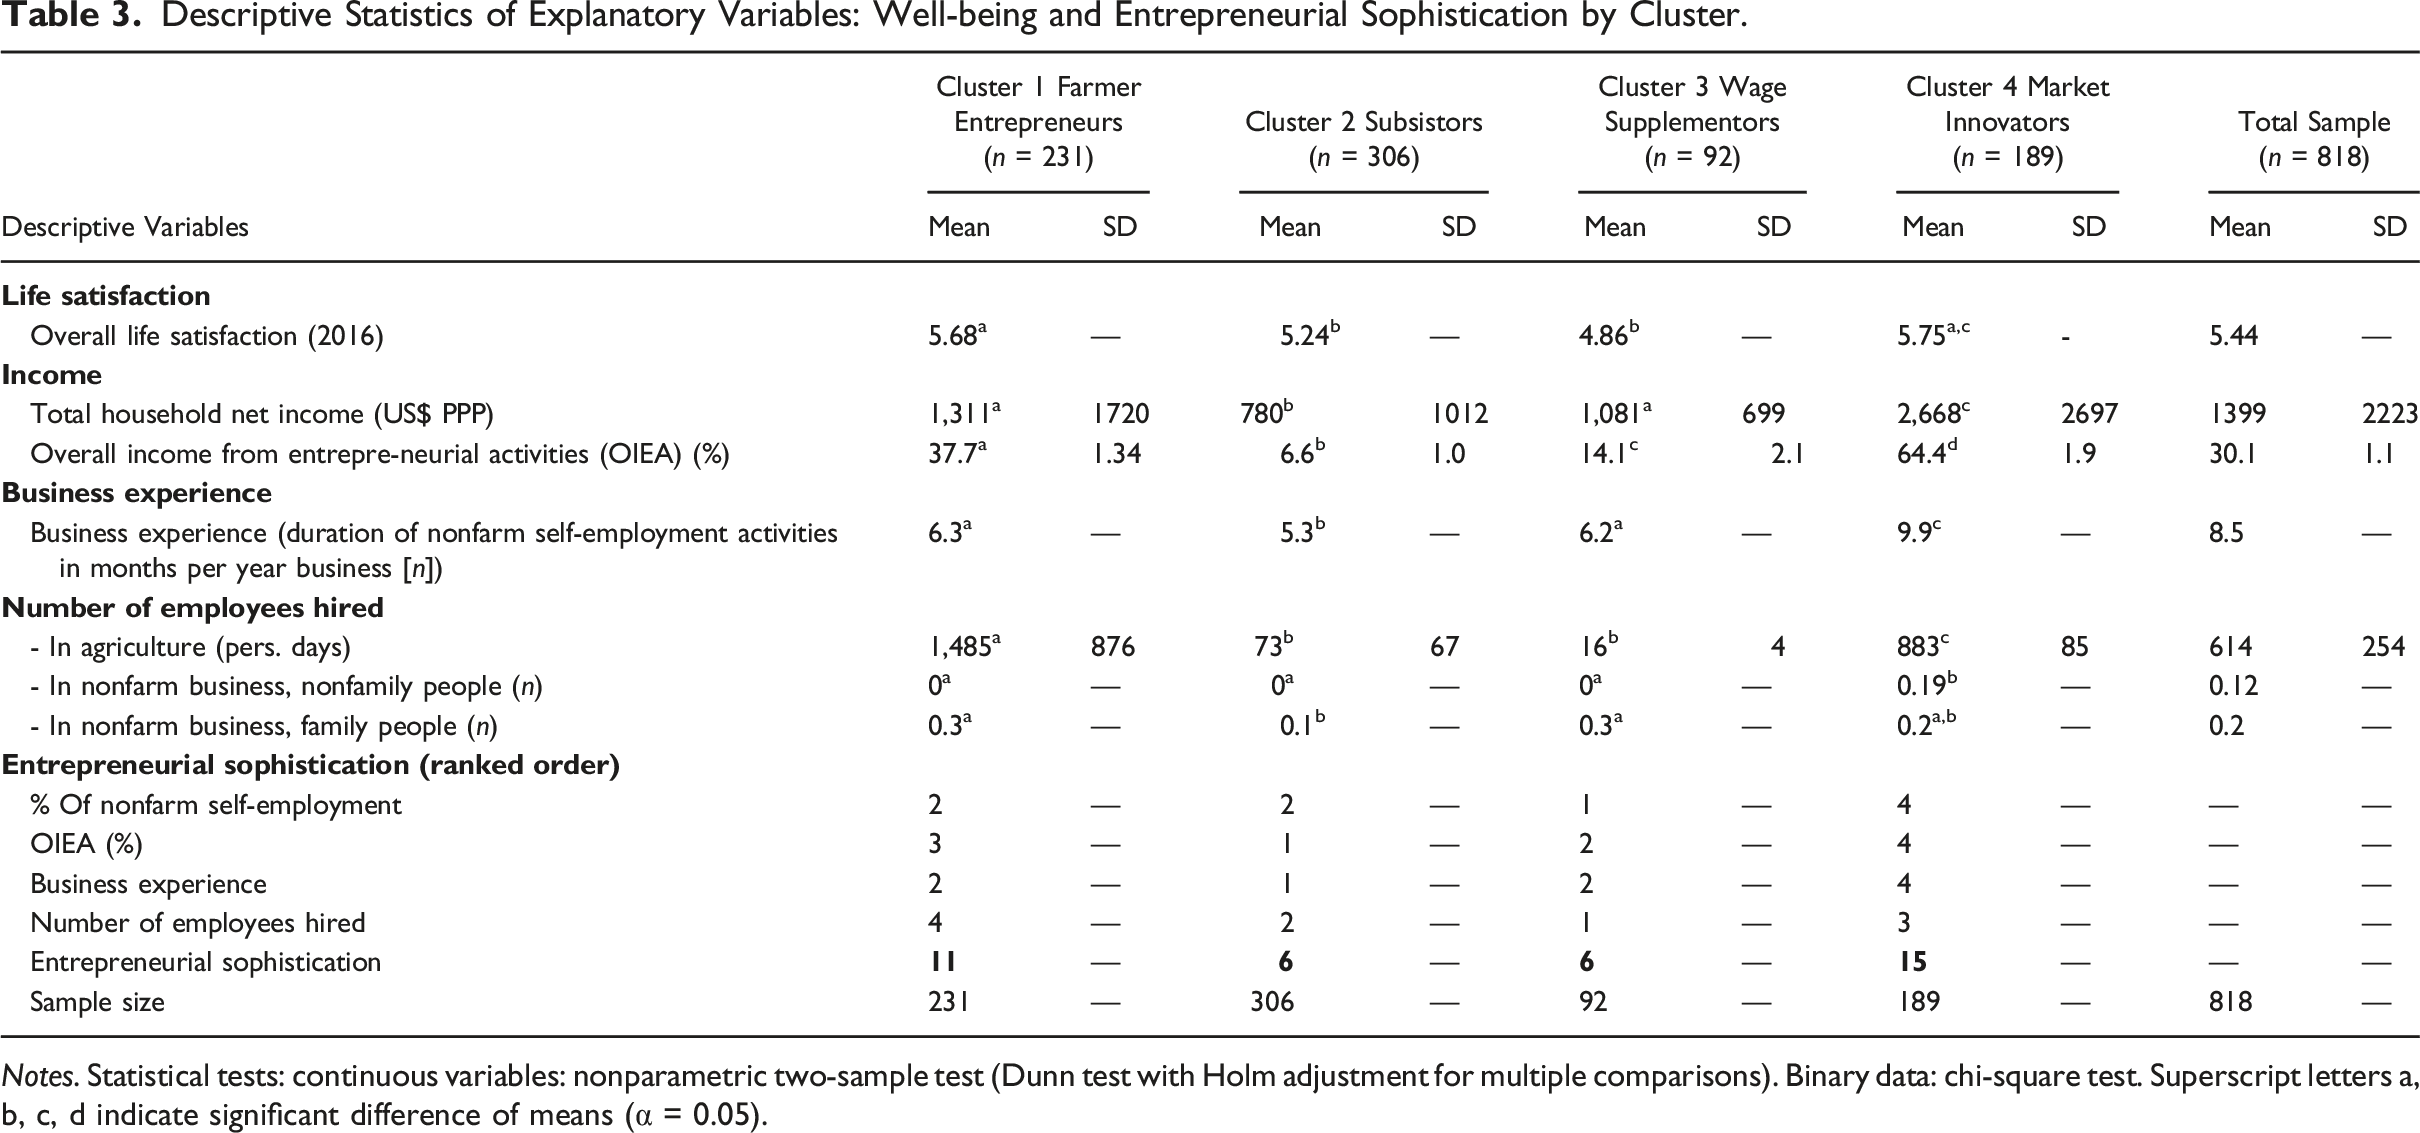
Notes. Statistical tests: continuous variables: nonparametric two-sample test (Dunn test with Holm adjustment for multiple comparisons). Binary data: chi-square test. Superscript letters a, b, c, d indicate significant difference of means (α = 0.05).
Cluster 1: Farmer entrepreneurs. Farmer-entrepreneur households (n = 231, 28%) generated the most income from selling their own agricultural produce (HCI 60%) (Supplemental TableA2). Beyond the trading of their own farm products, 15% of the farmer entrepreneurs were engaged in nonfarm self-employment activities, such as brewing, shopkeeping, construction, trading agricultural goods other than their own produce, or cooking (Supplemental TableA3). On average, nonfarm self-employment lasted for six months—reflecting its seasonal and casual nature (Supplemental TableA3)—and they generated 2.61% of their total income from such nonfarm self-employment activities (Supplemental TableA2). On aggregate, farmer entrepreneurs’ OIEA accounted for more than a third (37.7%) of the farm and nonfarm entrepreneurial activities (Table 3).
With an accumulated ranking of 11, the entrepreneurial activities pursued by farmer-entrepreneur households represented a moderate level of entrepreneurial sophistication. They accounted for the highest employment rate of nonfamily members in their own farming (1485 person days per year, 8 hours per day) and of nonfarm self-employment (0.3 family members and zero nonfamily members per month) (Table 3).
Looking more deeply into their resource endowments and conversion factors (Table 1), we found with respect to human capital that farmer-entrepreneur household heads were on average 48.8 years old and had attended school for 6.6 years, the second highest level of education compared to the other clusters. When it comes to social capital, farmer-entrepreneur households possessed on average 0.93 mobile phones and reported that they talk on average to 4.9 people in order to access relevant market information—through group membership as well (0.65). With respect to financial capital, 74% of the households had savings (cash, livestock) averaging $376 PPP. Of physical capital, the households in this cluster owned on average 2.48 hectares of land, 0.57 animals (in TLU), and achieved an asset score of 67.8 (Table 1). The asset score of farmer entrepreneurs was higher than that of subsistors and wage supplementors but lower than that of market innovators.
With regard to household governance, 22% of farmer-entrepreneur households were single-headed without partners (17.7% single female, 4.3% single male) (Table 2). In the remaining 78% of the households, 59% of the household heads took decisions on agricultural issues together with their partners, 53% on selling decisions, and 37% on long-term investment decisions. The main expenditure preferences of these households centered on emergencies involving food (23%), medical treatment (22%), and agribusiness investments (17%). Involving the children in household governance played a moderate role for farmer entrepreneurs (Table 2). Most of farmer entrepreneurs in this cluster (78%) were located in Morogoro, where climatic conditions were more suitable for agriculture than in Dodoma. Farmer entrepreneurs reported an overall life satisfaction of 5.68 (the figure for the entire sample was 5.44) and a mean income of $1311 ($1399 for the entire sample) (Table 3).
Cluster 2: Subsistors. The subsistors constituted the largest cluster (n = 306, 37%). They generated the most income from the collection of public natural resources (41% of total income) and agriculture (21% of total income). These households sold little of their own grown agricultural produce (HCI 9%) (Supplemental TableA2). Beyond these activities, 19% of the subsistors were engaged on average 5.3 months per year in nonfarm self-employment activities, such as brewing, cooking, making salt, collecting firewood, and making charcoal (Supplemental TableA3). Similar to the farmer entrepreneurs (Cluster 1), subsistors generated only 2.87% of their total income through such nonfarm self-employment activities (Supplemental TableA2). Aggregating farm and nonfarm entrepreneurial activities, we found that the OIEA of subsistors amounted to 6.6%, the lowest level of all the clusters (Table 3).
With an accumulated ranking of 6, the entrepreneurial activities pursued by subsistor households represented one of the lowest levels of entrepreneurial sophistication in the sample (Table 3). Subsistors had a low employment rate of nonfamily members in their own farming (73 person days per year, 8 hours per day) and in nonfarm self-employment (0.1 family members per month) compared to Clusters 1 and 4, but the first is still higher than for Cluster 2.
On average, subsistor household heads were 57 years old and had attended school for an average of 6.1 years. The subsistor cluster was older than all the others (Table 1). In terms of education, the heads of subsistor households were not significantly different from the wage-supplementor household heads, but subsistors were less educated than the heads of households in the other two clusters. When it comes to social capital, subsistor households possessed an average of 0.55 mobile phones (below the sample average of 0.83 but comparable to that of the wage supplementors) and reported that they talk to an average of 2.4 people in order to access relevant market information, often through group membership (0.59). This number was significantly below that of the other three clusters. Regarding financial capital, 222 (72.5%) households had savings (cash and livestock) averaging $359 PPP, which closely approximated that in Cluster 1 but was higher than that in Cluster 3. As physical capital, the households in Cluster 2 owned on average 2.16 hectares of land, 1.33 animals (in TLU), and achieved an asset score of 43.02.
With regard to household governance, 33.7% of subsistor households were single-headed without partners (28.8% single female, 4.9% single male) (Table 2). In the remaining 66% of the households, 57% of the household heads took decisions on agricultural issues together with their partner, 51% on selling decisions, and 28% on long-term investment decisions. The main expenditure preferences of these households centered on emergencies involving food (33.7%) and medical treatment (19.3%) (Table 2). Involving their children in household governance played a minor role for subsistor households (Table 2). One third of subsistors in this cluster (30%) lived in Morogoro; the majority in Dodoma. Subsistors generated the lowest average income ($780) of all the clusters but reported an overall life satisfaction of 5.24, which was similar to the level reported in Clusters 1 and 4 (Table 3).
Cluster 3: Wage supplementors. The wage-supplementor households constituted the smallest cluster in our sample (n = 92, 11%). Their main income source was wage employment (48% of total income), supplemented by the collection and sale of public natural resources (28% of total income) (Supplemental TableA2). Wage employment in rural Tanzania consisted predominantly of casual agricultural work. Wage supplementors sold almost one third of their own farm produce (HCI 28%) (Supplemental TableA2). Beyond these activities, 21% of the wage supplementors are engaged on average 6.2 months per year in nonfarm self-employment activities, such as brewing, trading of agricultural goods other than what they produce or deliver for themselves (Supplemental TableA3). Although the percentage of these households engaged in nonfarm self-employment exceeded that of their counterparts in Cluster 1 and was similar in terms of months per year, the households in Cluster 3 generated only 1.4% of their total income from such nonfarm self-employment activities, the lowest percentage of all the clusters (Supplemental TableA2). On aggregate, the farm and nonfarm entrepreneurial activities of wage supplementors meant that their OIEA was 14.1%, the second lowest value in our sample (Table 3).
With a score of 6 on accumulated entrepreneurial sophistication, the entrepreneurial activities pursued by wage-supplementor households equaled the level of subsistors (Table 3). More precisely, wage supplementors had the lowest employment rate of nonfamily members in their own farming (16 person days per year, 8 hours per day) and nonfarm self-employment (0.3 family members per month) compared to the analogous figures for the other three clusters.
Although there are many similarities between the wage supplementors and the subsistors, there are also many differences. Looking more deeply into their resource endowments and conversion factors (Table 1), we found that wage-supplementor household heads were on average 51 years old and had attended school for 6.3 years. When it comes to social capital, wage-supplementor households possessed an average of 0.54 mobile phones and reported that they talk to an average of 3.5 people in order to access relevant market information, often through group membership (0.64). Regarding financial capital, 73.9% of the households had savings (cash and livestock) averaging $132 PPP, the lowest amount of all the clusters in our study. In terms of physical capital, the wage-supplementor households cultivated on average 1.98 hectares of land, the smallest amount of all the clusters. They owned 0.64 animals (in TLU) and achieved an asset score of 29.7, ranking below even the subsistors.
With regard to household governance, 32.6% of wage-supplementor households were single-headed (28.3% single female, 4.3% single male) (Table 2). In the remaining 67.4% of the households, 56% of the household heads took decisions with their partner on matters of agriculture, selling (52%), and long-term investment (53%, by far the highest percentage in our sample). The main expenditure preferences of these households centered on emergencies involving medical treatment (29.3%), agricultural investments (21.7%), and food (17.4%) (Table 1).
Involving children in household governance seems to be very important to wage supplementors compared to the households in all the other clusters (Table 2). Almost half (43%) of these households were located in Morogoro; 47% in Dodoma. Wage-supplementor households reported the lowest level of overall life satisfaction (4.86) and generated a mean income of $1081 (Table 3).
Cluster 4: Market innovators. Market innovators (n = 189, 23%) were the most entrepreneurial cluster. Our data show many statistically significant differences between these households and those in the three other clusters. Nearly all (95%) of the market-innovator households were engaged in nonfarm self-employment activities, which constituted the main source (54% on average) of their total income (Supplemental TableA2). The entrepreneurial activities of market innovators accounted for the greatest diversity in the sample. Besides brewing, cooking, shop-keeping, trading, and construction, these households make and sell honey, rope, and mats; own maize mills or bars; and offer garage services. Lasting for 9.9 months of the year, nonfarm self-employment activities accounted for the longest duration in the sample (Supplemental TableA3). In addition, market innovators sell 32% (HCI) of their own agricultural produce (Supplemental TableA2). On aggregate, their nonfarm self-employment activities and the sale of their own farm produce amounted to an OIEA of 64% (Table 3). Nonfamily member employment in market innovators’ own farming stood at 883 person days (at 8 hours a day, per year). For their nonfarm entrepreneurial activities, market innovators hire both family members (0.2) and nonfamily members (0.19). With a cumulative score of 15, the market innovators achieved the highest level of entrepreneurial sophistication.
Looking more deeply into their resource endowments and conversion factors (Table 1), we found that market-innovator household heads were the youngest, with an average of 44.7 years, and the most educated, with 7.1 years of schooling, compared to the households of all the other clusters. When it comes to social capital, market innovators possessed an average of 1.29 mobile phones and reported that they talk to an average of 6.57 people in order to access relevant market information, often through group membership (0.83). In terms of financial capital, 86.8% of the households had savings (cash, livestock etc.) averaging $476 PPP, an amount higher than that in any of the other clusters. As for physical capital, the households in this cluster cultivated on average 3.19 hectares of land, an amount greater than the corresponding figure in any of the other the clusters. They owned 21.58 animals (in TLU) and achieved an asset score of 88.43, the highest in our sample.
With regard to household governance, 19% of market-innovator households were single-headed (14.8% single female, 4.2% single male) (Table 2). In the remaining 81% of the households with partners, the household heads took decisions together with their partner on agriculture (65.4%), selling (56.2%), and long-term investment (39.9%). The main expenditure preferences of these households centered on emergencies involving food (27%), business investments (19%), and agricultural investments (19%) (Table 1). Involving children in household governance played a marginal role compared to all other clusters (Table 3). Market-innovator households were almost equally distributed between Morogoro (44%) and Dodoma (56%) (Table 1). They reported the highest overall life satisfaction (5.75) in our sample—very close to that of Cluster 1 households—and generated the highest mean income—$2668 (Table 3)—twice as much as that reported in Cluster 1.
Determinants of Necessity Entrepreneurship Types
The descriptive statistics reported above show that the four NE clusters differ in their resource endowments, conversion factors, income, and life satisfaction. However, given that entrepreneurship is likely to be endogenous, the descriptive statistics do not allow a causal interpretation. The ESR model provides empirical evidence of both the impact of the distinct entrepreneurial activity bundles on income and life satisfaction, and indicates whether and how the determinants (resource endowments and conversion factors) drive the cluster membership.
Supplemental TableA4 presents the results of the probit regressions of the ESR model (first-stage estimation) for the participation in the cluster of market innovators and the cluster of farmer entrepreneurs. The dependent variable represents the cluster membership. The test of goodness of fit (Wald Chi2) reveals that the selected covariate variables provide a robust model of the conditional treatment of entrepreneurial activities that are highly significant.
Our findings demonstrate that the main drivers of the market-innovator cluster differ greatly from those of the farmer-entrepreneur cluster. More precisely, the probability of a household being a member of the market-innovator cluster in comparison to the wage-supplementor and subsistor clusters significantly increases with human capital (younger in age, more educated), physical capital (assets and, to a slight extent, land), and social capital (market information and mobile phone ownership). By contrast, the probability of a household being a member of the farmer-entrepreneur cluster in comparison to the wage-supplementor and subsistor clusters significantly increases with household governance, the sharing of more joint responsibilities in agriculture decisions, location in Morogoro region, and endowment with land and social capital (mobile phone ownership). The two more entrepreneurially active clusters (1 and 4) are better equipped with mobile phone and land ownership than the other two clusters are. Regarding conversion factors, we find that the significant variables are predominantly those that reflect personal and social conversion factors (for the market innovators) and social and environmental ones (for the farmer entrepreneurs).
Impact of Necessity Entrepreneurship Types on Outcomes
Estimated Means of the Endogenous Switching Regression using the Treatment Being in the Cluster of Market-Innovators.
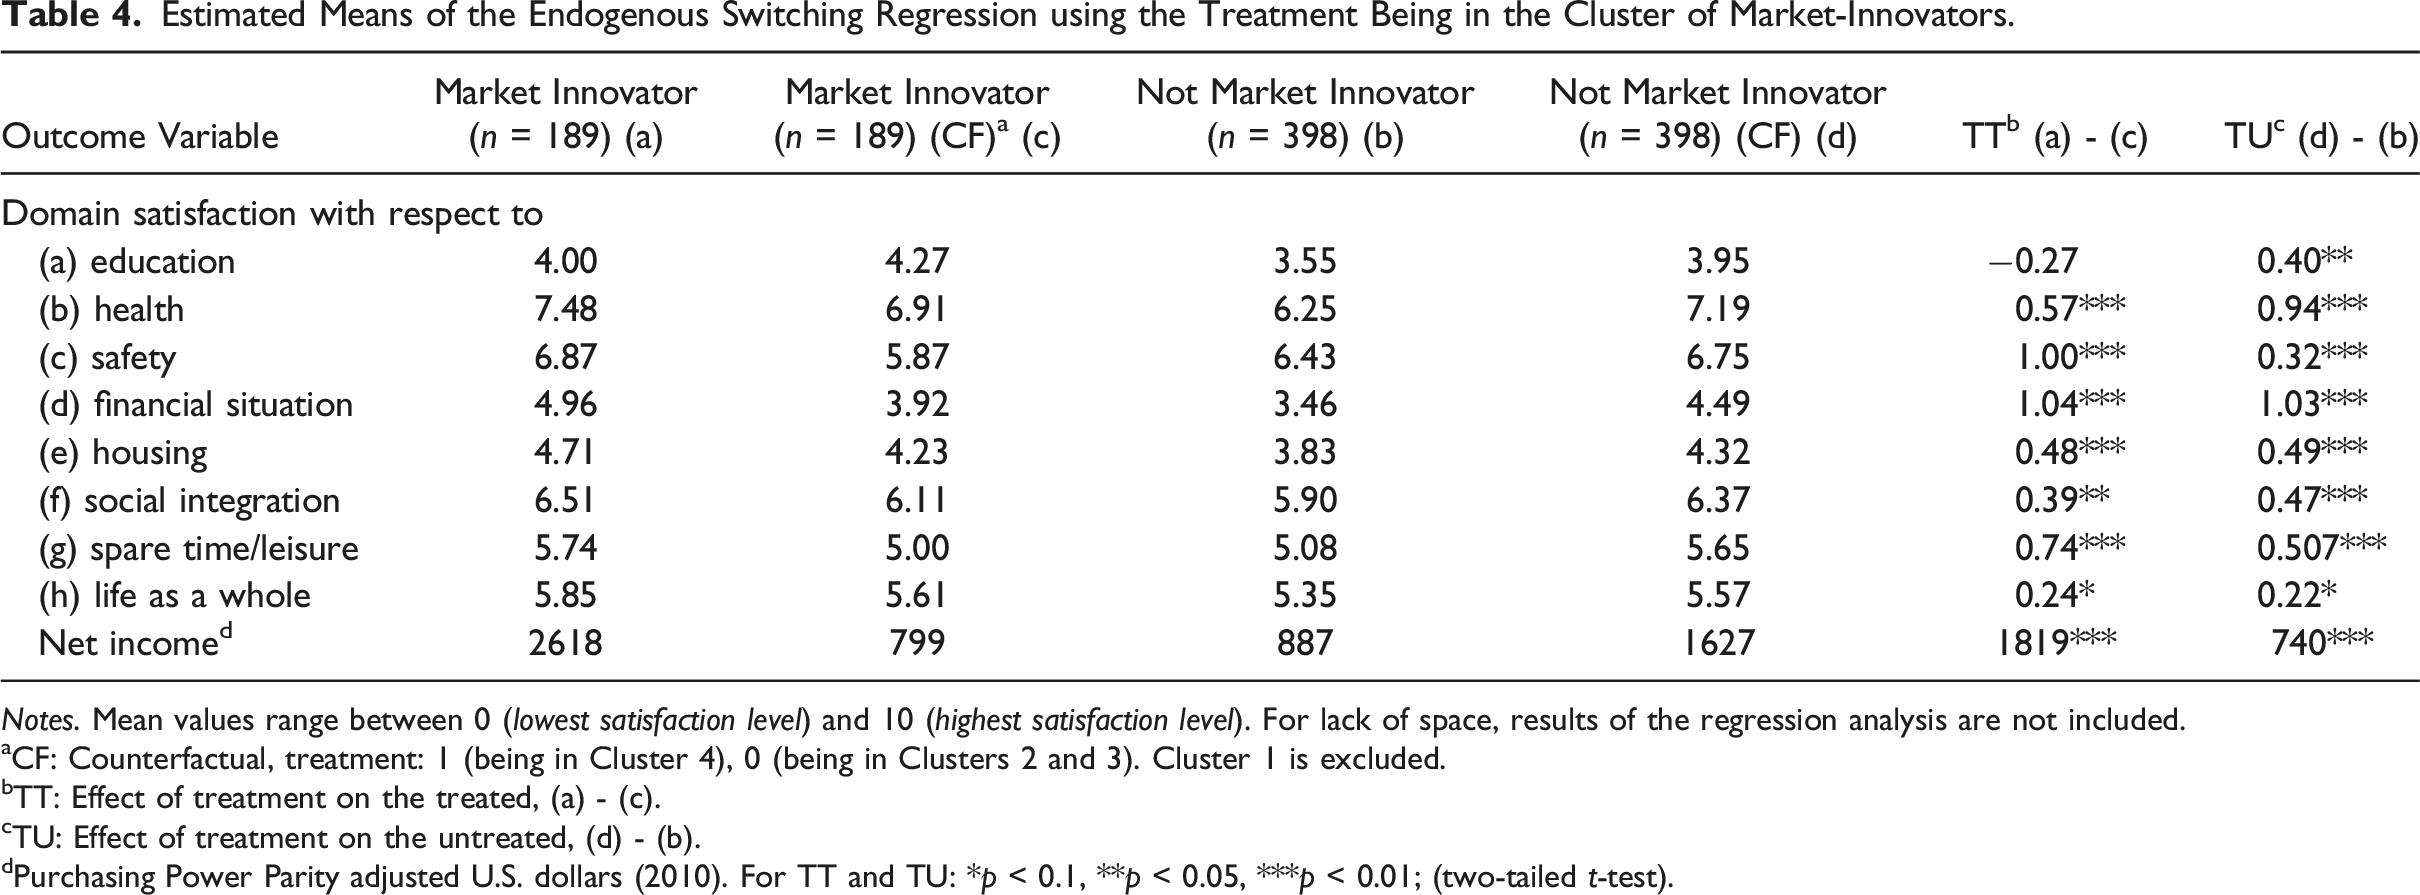
Notes. Mean values range between 0 (lowest satisfaction level) and 10 (highest satisfaction level). For lack of space, results of the regression analysis are not included.
aCF: Counterfactual, treatment: 1 (being in Cluster 4), 0 (being in Clusters 2 and 3). Cluster 1 is excluded.
bTT: Effect of treatment on the treated, (a) - (c).
cTU: Effect of treatment on the untreated, (d) - (b).
dPurchasing Power Parity adjusted U.S. dollars (2010). For TT and TU: *p < 0.1, **p < 0.05, ***p < 0.01; (two-tailed t-test).
Estimated Means of the Endogenous Switching Regression using the Treatment “Being in the Cluster of Farmer Entrepreneur”.
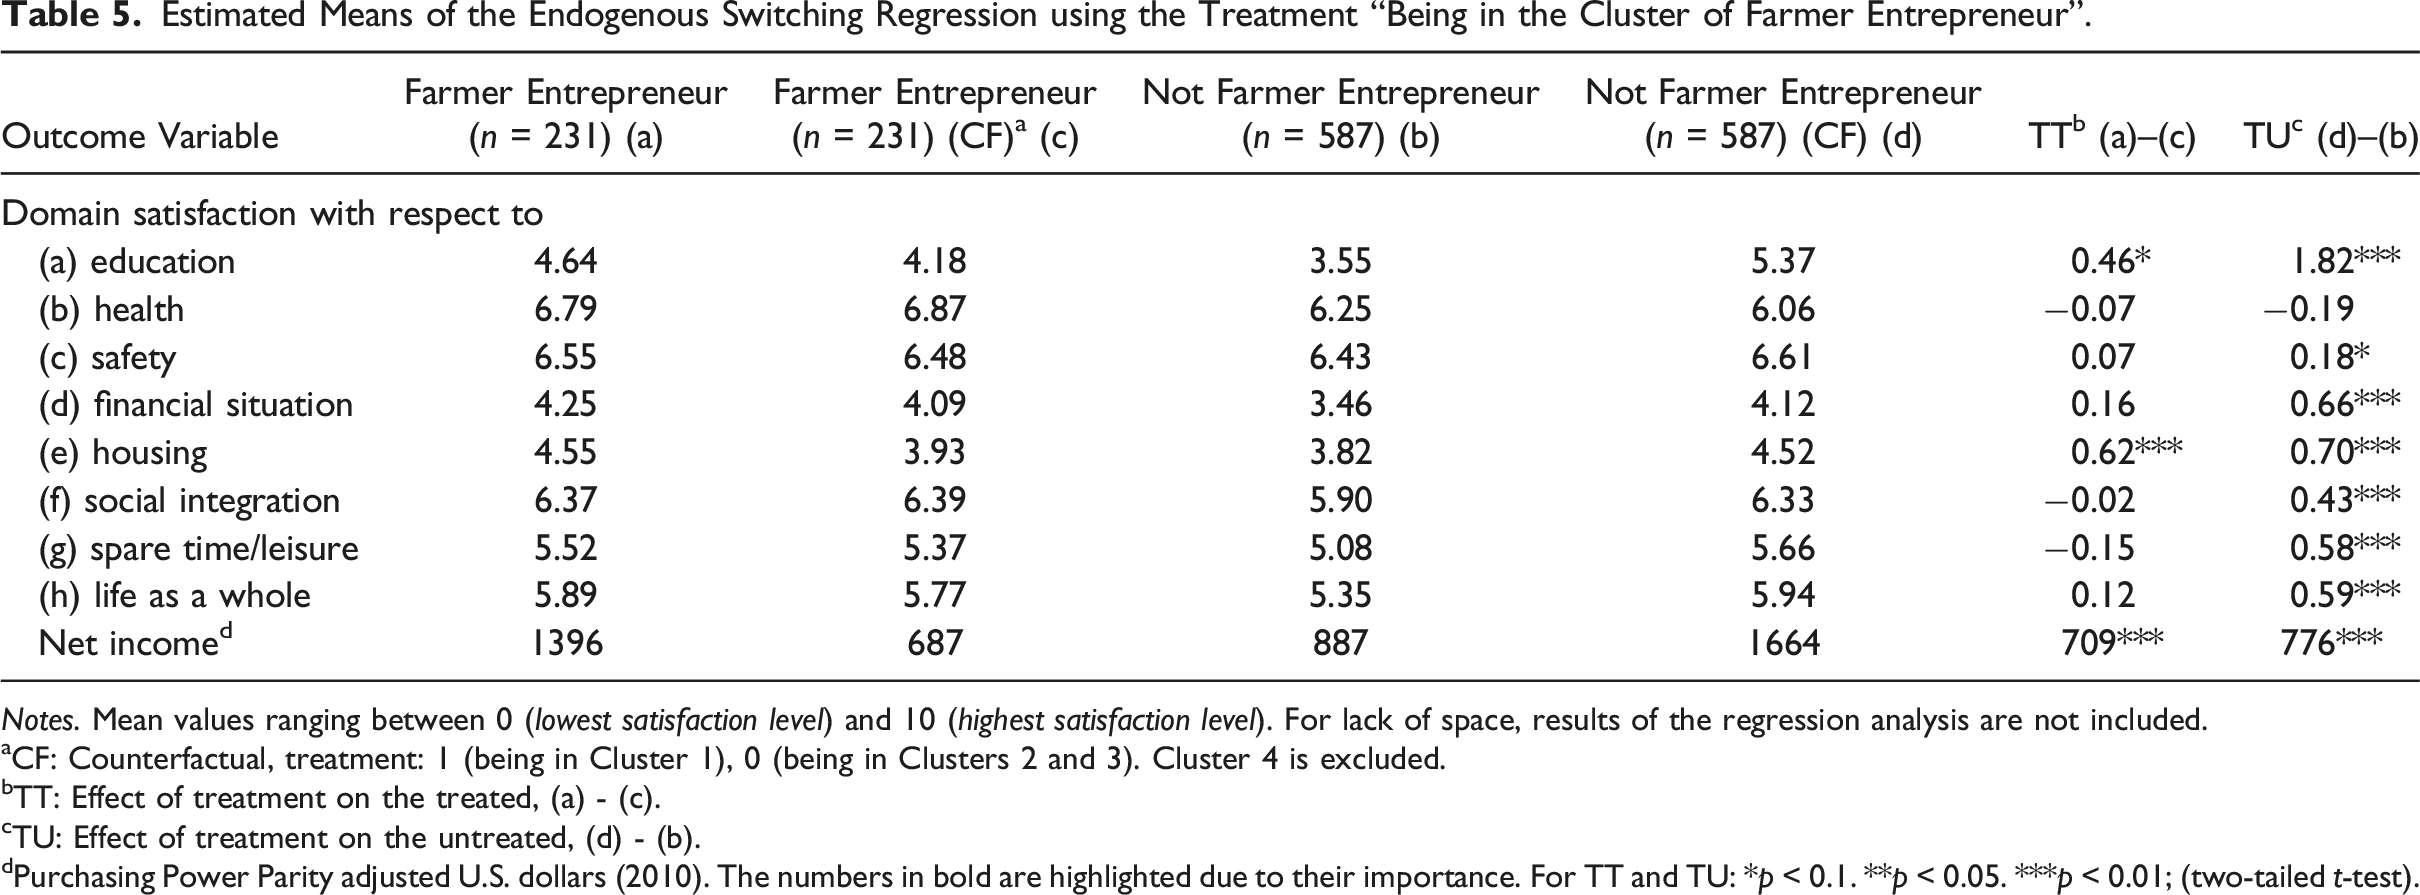
Notes. Mean values ranging between 0 (lowest satisfaction level) and 10 (highest satisfaction level). For lack of space, results of the regression analysis are not included.
aCF: Counterfactual, treatment: 1 (being in Cluster 1), 0 (being in Clusters 2 and 3). Cluster 4 is excluded.
bTT: Effect of treatment on the treated, (a) - (c).
cTU: Effect of treatment on the untreated, (d) - (b).
dPurchasing Power Parity adjusted U.S. dollars (2010). The numbers in bold are highlighted due to their importance. For TT and TU: *p < 0.1. **p < 0.05. ***p < 0.01; (two-tailed t-test).
To investigate further, we estimated the same ESR model by using farmer entrepreneurs as a treatment (Table 5). Here the results are remarkably different compared to the ESR results of the market innovators. The ESR results find that in their hypothetical counterfactual households, farmer entrepreneurs’ net income would halve (difference of $709) and the domain satisfaction in education would increase (0.46) (Table 4, TT). The TU effects show the greatest increase in satisfaction for subsistors and wage supplementors if they become farmer entrepreneurs. The only domain satisfactions that do not significantly differ are those pertaining to health. The domain satisfactions for education (1.82), safety (0.18), financial situation (0.66), housing (0.70), social integration (0.43), spare time (0.58), and life as a whole (0.59) would increase significantly (Table 4, TU).
Interpretation of Findings
The four empirically generated clusters of farmer entrepreneurs, subsistors, wage supplementors, and market innovators demonstrate the presence and prevalence of country-level NE variety. This finding is important for several reasons. First, the discrete entrepreneurial activity bundles (Supplemental TableA3) expose the shortcomings of the simplified distinction between opportunity entrepreneurship (OE) and NE in developed and in developing countries (Dencker et al., 2021) and the binary approach in occupational choice between employment and entrepreneurship (Parker, 2018; Poschke, 2013b). Although the NE variety in our clusters in rural Tanzania might neither capture the full range nor be generalizable to SSA (Dencker et al., 2021) or urban areas, it clearly suggests that the boundary between OE and NE is indistinct, illuminating the drawbacks of the literature’s dominant, binary categorization of OE and NE (Amorós et al., 2019; Block & Sandner, 2009; Fairlie & Fossen, 2019; Reynolds et al., 2005; Van der Zwang et al., 2016). One suggestion has been to consider OE and NE as two endpoints of an entrepreneurship continuum (Dencker et al., 2021). Although an entrepreneurship-type continuum would accommodate variation in the levels of entrepreneurial sophistication, such a continuum implies inherent trade-off(s) between OE and NE. Our findings, especially those on subsistors and age supplementors, suggest, however, that an entrepreneurship-type continuum would be unable either to capture or explain their distinctiveness.
Second, the empirical evidence of relatively high entrepreneurial sophistication and HCIs of market innovators and farmer entrepreneurs (Tables 3 and Supplemental TableA3) challenges the view that NE is mostly subsistence motivated (Bruton et al., 2015; Ogbuabor et al., 2013). Recent theorizing has proposed that, for necessity entrepreneurs in a developing country with low levels of human capital, the absence or presence of supportive institutional levers would “have a strong influence on the nature of the entrepreneurial process” (Dencker et al., 2021, p. 67) and, subsequently, on the level of entrepreneurial sophistication. Our results, however, demonstrate that higher entrepreneurial sophistication of market innovators cannot be explained by supportive institutional levers, for market innovators, subsistors, and wage supplementors are more or less equally spread over both of the regions we investigated. A connection between context and entrepreneurial activity bundles can be drawn only for farmer entrepreneurs, who are based predominantly (78%) in Morogoro, the region with much better climate conditions for agriculture. In sum, variables other than institutional levers, such as resource endowments and, in particular, conversion factors, may account for developing country or even regional NE variation.
Third, our finding that entrepreneurial households in rural Tanzania achieve higher income than their nonentrepreneurial counterparts do is not supported by current entrepreneurship theory (Stephan, 2018) pointing to the limits of generalizing established causal relations. Our finding may be explained by the push theory of NE—even though most wage employment in rural SSA is poorly paid, predominantly seasonal, not particularly attractive, and offering wages that are often insecure (Collins et al., 2009). More interesting, secure, and better paid employment in public-sector organizations is rare and usually requires higher formal education than that accessible in rural areas (Bradley et al., 2012). In terms of the push theory, self-employment may thus be the only way to earn income.
However, considering the specific SSA context (Decker et al., 2020), other explanations can be proposed. Previous research in SSA has found that certain entrepreneurial activities reduce household risks stemming from the extreme climate conditions in SSA. For instance, shop owners in SSA are less vulnerable than farmers are to “the problem of seasonality in natural resource-based livelihood” (Mahama & Maharjan, 2017, p. 77) and to increasingly extreme weather conditions (Kubik & Maurel, 2016). The reduced vulnerability of certain entrepreneurial activities improves their income security and ability to accumulate savings. These examples explain why households pursuing mainly entrepreneurial and entrepreneurially sophisticated activities are more likely to achieve incomes greater than those of households engaged in primarily nonentrepreneurial and less sophisticated activities (Tables 3 and 4). Furthermore, the findings suggest that entrepreneurial success in SSA can be disentangled from farming success (Kodithuwakku & Rosa, 2002). By highlighting the specificity of the SSA context (Åstebro, 2012; George, Corbishley, et al., 2016; Munemo, 2012), our findings thus suggest that the predominantly reported relationship between entrepreneurship and income (Stephan, 2018) is not universal.
Fourth, our results provide empirical evidence of life satisfaction as an important, yet independent, NE outcome (Tables 4 and 5). Although there appears to be consensus among scholars that an entrepreneur’s success and perceived quality of life are co-dependent (Kautonen et al., 2017; Rahman et al., 2016; Zahra & Wright, 2016), our findings specify that the effect of entrepreneurial activities on life satisfaction can deviate from the effect on financial income, and thereby demonstrate that this commutation is only partial. In our study, the subsistors with the lowest average income ($780 per annum) reported a significantly higher overall life satisfaction (5.24) than did the wage supplementors with significantly more income ($1081 per annum, 4.86 for life satisfaction). One might argue that what we observe in this case is an “adaption to misfortune and bad conditions” (Binder, 2014, p. 1202; Diener & Suh, 1997; Kroeger & Weber, 2014). This explanation is unconvincing and unlikely, though, because it would apply also to the wage supplementors. Schyns (1998) notes that potential adaption processes do not impede comparisons “since adaption processes are more or less the same everywhere” (p. 19). Another possible explanation for this finding might be found in the literature on subjective well-being (Binder & Coad, 2016; Kautonen et al., 2017; Stephan, 2018), in which entrepreneurs are typically reported to be clearly more autonomous and, hence, more satisfied with their life than their nonentrepreneurial, wage-employed counterparts (Benz & Frey, 2004; Stephan, 2018). However, the percentage of overall self-employment among wage supplementors in our sample is twice as high (14%) as that of subsistors (7%), meaning that the reasoning based on subjective well-being does not hold either. Moreover, we find that market innovators are not significantly more satisfied with their life as a whole than farmer entrepreneurs are with their own, although the income of the former is more than twice as high ($2668 vs. $1311). Again, these findings establish that the boundary conditions of entrepreneurship theory require specification (Stephan, 2018), such that relationships between resource endowments, conversion factors, household activity bundles, and outcomes are bounded by context.
Discussion—Necessity Entrepreneurship in the Light of Sen’s Capability Approach
Consolidating our interpretations, Sen’s (1988, 1999b, 1999a) capability approach provides a more holistic explanation of NE variety than can be achieved by occupational choice theory (Parker, 2018; Poschke, 2013b) and Maslow’s theory (Coffman & Sunny, 2021; O’Donnell et al., 2021). First, Sen’s approach offers an explanation of why the subsistor cluster empirically demonstrates that necessity entrepreneurs act on higher needs even when basic needs are not yet satisfied. The perspective afforded by the capability approach can solve this riddle if one accepts Sen’s reasoning that even in poor and resource-constrained NE contexts, households have preferences and make choices regarding their functionings. If Maslow’s hierarchy of needs (1954) is interpreted as the linear progression of needs fulfillment from basic to higher level needs (Dencker et al., 2021), this understanding overlooks the simultaneous pursuit of multiple preferences. Furthermore, the simultaneous pursuit of multiple preferences does not depend on trade-offs between financial and nonfinancial outcomes. The empirical evidence concerning income and life satisfaction of the market innovators in comparison to the farmer entrepreneurs and of subsistors in comparison to wage supplementors does not support the assumption that entrepreneurial financial success goes hand in hand with an entrepreneur’s perceived quality of life (Kautonen et al., 2017; Kimmitt et al., 2020; Rahman et al., 2016; Zahra & Wright, 2016). Recalling Sen’s reasoning on the construct of intrinsic freedom, we suggest that the freedom to choose can influence and increase households’ reported life satisfaction, as when subsistors choose not to be wage-employed. Invoking Sen, they value their freedom of choice and therefore report a higher life satisfaction than the wage supplementors do. Given the multidimensional nature of human development and the varying preferences involved, it is thus the construct of intrinsic freedom that could explain why our findings do not support the “income-satisfaction equation” (Kimmitt et al., 2020, p. 2) that is predominant in entrepreneurship theory. Reasoning with Sen that even subsistors have some freedom of choice, we see our results as a challenge to Gries and Naudé’s (2011) assertion that necessity entrepreneurs have no choice and that the enforcement to be entrepreneurial and the deprivation of agency makes it inherently impossible for necessity entrepreneurship to be a valued functioning.
Second, Sen’s capability approach can explain country-level NE variety within an institutionally equally supported context. It does so by applying the idea of conversion factors that complement the usually studied resource endowments. Although human capital is an important resource with which to pursue entrepreneurial activities (Dencker et al., 2021), it is the idiosyncratic bundles of resources and conversion factors that translate into different functionings (Sen, 1999a, 1999b). This finding implies that, even if a person has little human capital, there are other resources and, in particular, conversion factors that can be leveraged and that can account for NE variety within an institutionally equally supported context. The adoption of Sen’s capability approach and, hence, the introduction of conversion factors into the NE debate expands research on resource endowments (Linder et al., 2020) and clarifies the relevance and explanatory power of the specific constellation of resource endowments and conversion factors for NE.
Third, framing NE variety as a product of resource endowments, conversion factors, and preferences and thereby as households’ expression of their freedom to choose between alternative capabilities, Sen’s capability approach provides a new direction for theorizing household-level functionings. Although research has distinguished between OE and NE and has documented their copresence in developed and developing economies, our results provide evidence of household-level entrepreneurial pluralism. For example, some of the entrepreneurial activities that market innovators pursue could be considered as more opportunity than necessity-driven, but these households still pursue a substantial amount of necessity-driven entrepreneurial activities. Thus, a household’s functionings can encompass entrepreneurial activities that are motivated by more or less necessity and other activities in pursuit of more or less entrepreneurial opportunities. Thinking of household-level entrepreneurial portfolios as combining necessity and opportunity entrepreneurship and thereby transcending the idea of an NE–OE continuum would enable scholarship to map a realistic portrayal of NE and of entrepreneurial portfolios in general.
Lastly, beyond expanding NE research by bringing Sen’s capability approach into the debate, our study has the potential to enrich Sen’s capability approach. As noted in the data and method section, previous literature has reported a lack of clarity about the distinction between commodities and conversion factors and about their operationalization (Chiappero-Martinetti, 2021; Agee & Crocker, 2013; Chiappero-Martinetti & Salardi, 2008; Dean, 2009; Gasper, 2002; Robeyns, 2000). Our study provides initial suggestions for ways to specify and operationalize commodities and conversion factors at a household level for impact assessment. Most important, we use several items for household governance to capture dimensions of social conversion factors.
Limitations and Future Research
Our study comes with limitations. First, our measures are reported by the household head. In this data collection method, we follow Sen (1985, 1999b, 1999a) and prior entrepreneurship (Kimmitt et al., 2020) and development studies research (Bookwalter et al., 2006). Future research that collects complementary data from additional household members might advance theory on gender and other intrafamilial influences on household-level entrepreneurial choices. In addition, the data on resource endowments and conversion factors have incorporated typical measures (age, years of education, and gender). In future research such measures could be disentangled into resource endowments and conversion factors. For example, human capital could be differentiated into two kinds of knowledge: (a) explicit knowledge about facts (know-what), which can easily be codified and transferred, and (b) tacit knowledge (know-how), which is derived from experience such as skills and intuition and which is often unconscious and hard to transfer (Nonaka & Takeuchi, 1995; Polanyi, 1966). In the context of the capability approach, know-what could function as a resource endowment, with know-how serving as a conversion factor. Further suggestions on how to operationalize the different elements of the capability approach can be found in a recent collection of contributions edited by Chiappero-Martinetti et al. (2021). Second, our cross-sectional research design does not capture change in entrepreneurial activity bundles over time. Acknowledging that an entrepreneurial activity could be born of necessity and then develop into an opportunity, scholars conducting longitudinal research could advance knowledge on the dynamics of NE varieties. Third, our quantitative data and econometric analyses offer an initial insight into relationships between household resource endowments, conversion factors, functionings, and outcomes. Our method does not capture “why people value certain capabilities and not others, and why they fail or succeed in achieving them” (Boni & Frediani, 2021, p. 477). Further research that has adopted qualitative methods could advance knowledge on the process by which resource endowments undergo conversion into functionings.
Several additional avenues for theorizing and researching NE in general, and in developing economies in particular, follow from our research. First, we have provided empirical evidence of the presence and prevalence of NE variety in rural Tanzania. Further studies on NE variety in other developing and also developed economies in which the capability approach is brought to bear would be fruitful for investigating the scope of generalizability of our NE types. Second, researchers have regarded NE as being primarily motivated by income and basic needs and have ignored other motivations. Our findings that life satisfaction is an important NE outcome and that the relationship between income and life satisfaction does not necessarily commutate, offer potential for a broader conceptualization of occupational choice and the motivation for NE. Third, placing our research in the framework of Sen’s capability approach, we have theorized household-level entrepreneurial pluralism that combines NE and OE. Further research to theorize entrepreneurial pluralism would advance knowledge about entrepreneurial lives in developed and developing economies. Lastly, our study takes a first step into theorizing the household as an independent unit of analysis in NE. Research that deepens these investigations on rural households, in particular their intrahousehold governance structures and processes, would be valuable to pave the way for future theory development.
Conclusion
We set out to investigate necessity entrepreneurship and discovered country-level NE variety that is driven by household resource endowments and conversion factors and that impacts the specific household’s income and life satisfaction. Locating our empirical investigation in rural Tanzania, we employed Sen’s capability approach to foreground suggestions of NE heterogeneity (Dencker et al., 2021; Imas et al., 2012; Sarkar, 2018; Wierenga, 2020). By integrating resource endowments and conversion factors that households leverage into bundles of entrepreneurial and nonentrepreneurial activities and then into outcomes of income and life satisfaction, we provide a novel and holistic account of rural entrepreneurship (Pato & Teixeira, 2016) in an African country (George, Corbishley, et al., 2016; Vermeire & Bruton, 2016). This type of research has been much-called for (Devine & Kiggundu, 2016; Vermeire & Bruton, 2016). Moreover, we expand the theoretical NE repertoire by applying Sen’s capability approach to NE and framing its empirically demonstrated variety within a developing economy as a result of households’ idiosyncratic resource endowments, conversion factors, preferences, and choices. Lastly, we specify new boundary conditions for entrepreneurship theory by advancing our scholarly understanding of NE and of entrepreneurial theories in context (Shepherd et al., 2019; Welter, 2011), particularly the fact that life satisfaction is an important and independent NE outcome in SSA (George, Corbishley, et al., 2016; Wiklund et al., 2019). This study thereby overcomes the three shortcomings in NE research outlined in the introduction.
Supplemental Material
Supplemental Material - Varieties of Necessity Entrepreneurship – New Insights From Sub Saharan Africa
Supplemental Material for Varieties of Necessity Entrepreneurship – New Insights From Sub Saharan Africa by Christiana Weber, Anja Fasse, Helen M. Haugh, and Ulrike Grote in Entrepreneurship Theory and Practice.
Footnotes
Declaration of Conflicting Interests
The author(s) declared no potential conflicts of interest with respect to the research, authorship, and/or publication of this article.
Funding
The author(s) disclosed receipt of the following financial support for the research, authorship, and/or publication of this article: German Federal Ministry of Education and Research (BMBF); German Federal Ministry for Economic Cooperation and Development (BMZ).
Supplemental Material
Supplemental material for this article is available online.
Note
References
Supplementary Material
Please find the following supplemental material available below.
For Open Access articles published under a Creative Commons License, all supplemental material carries the same license as the article it is associated with.
For non-Open Access articles published, all supplemental material carries a non-exclusive license, and permission requests for re-use of supplemental material or any part of supplemental material shall be sent directly to the copyright owner as specified in the copyright notice associated with the article.