
Abstract
In the poultry industry, antimicrobials are commonly used to prevent and treat bacterial infections. However, antimicrobial use in food-animal production has been implicated in the emergence of drug resistance in both pathogenic and non-pathogenic microorganisms. The Clinical and Laboratory Standards Institute (CLSI) suggests using the agar dilution method when testing for the antimicrobial susceptibility (AMS) of Clostridium perfringens, the causative agent of necrotic enteritis. Yet multiple studies on C. perfringens use the microdilution method, which is faster. Using the standard agar dilution and the microdilution methods, we obtained and compared the minimal inhibitory concentrations values of 64 field isolates of C. perfringens for 11 antimicrobials (amoxicillin, bacitracin, ceftiofur, erythromycin, monensin, narasin, penicillin, salinomycin, tetracycline, tylosin, and virginiamycin). Given the high variability in the values obtained for most of the antimicrobials by the microdilution method, we could not calculate the correlation coefficient between the 2 antimicrobial susceptibility techniques. Our study highlights the importance of following CLSI protocols when testing the AMS of C. perfringens.
Antimicrobials are commonly used to prevent and treat bacterial infections in poultry.
1
However, antimicrobial use in food-animal production has been implicated in the emergence of drug resistance in pathogens.
7
To address this problem, the Chicken Farmers of Canada developed a national Antimicrobial Use Strategy, with the major aim of eliminating the preventive use of antimicrobials important to human health.
11
This Strategy, and other similar approaches, will put more pressure on the use of antimicrobials in veterinary medicine. Consequently, monitoring the evolution of antimicrobial resistance (
One of the most important bacterial pathogens in the poultry industry is Clostridium perfringens, the causative agent of necrotic enteritis.
18
For this bacterium, the CLSI suggests using the agar dilution method to test for AMS.
12
However, multiple studies on C. perfringens have used commercial microdilution plates—a faster and more economical method.15,17 The CLSI specifies that additional studies should be performed to validate broth microdilution for testing anaerobic organisms other than the Bacteroides fragilis group.
12
Hence, we compared minimal inhibitory concentration (
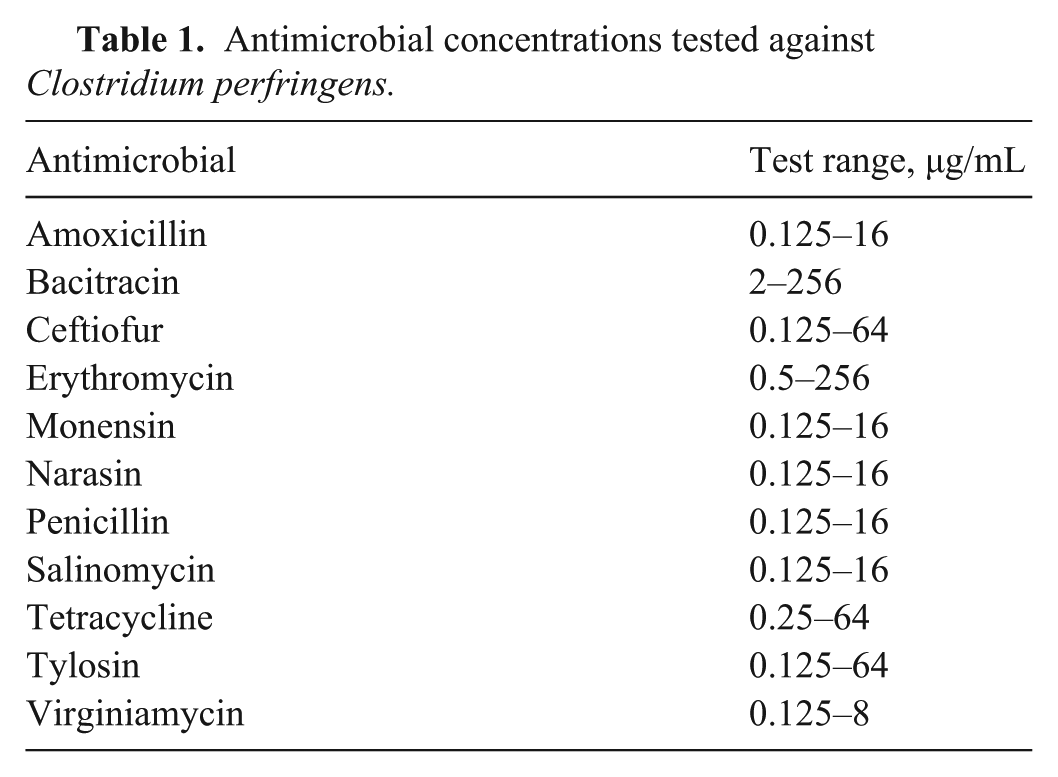
The 64 Clostridium perfringens strains that we used were isolated in previous work. 14 The MIC values for 11 antimicrobials were determined by the recommended agar dilution method following the CLSI guidelines for anaerobic bacteria. 12 We tested all isolates for their AMS to antimicrobials commonly used in the poultry industry, including amoxicillin, bacitracin, ceftiofur, erythromycin, monensin, narasin, penicillin, salinomycin, tetracycline, tylosin, and virginiamycin (50:50 ratio of virginiamycin S1 and virginiamycin M1; MilliporeSigma). We used amoxicillin instead of ampicillin, as amoxicillin is widely used in the poultry industry to treat bacterial infections. Isolates were tested in triplicate. All isolates were cultured 3 times on brucella blood agar (Oxoid) before AMS testing. Antimicrobial stock solutions were prepared by considering the potency of each antimicrobial used.
The broth microdilution method was performed following the CLSI guidelines for anaerobes. 12 A custom frozen AMS plate (Oxoid) was used, including all antimicrobials listed above (50 µL/well; Table 1 ). For these plates, 50 µL of bacterial suspension equivalent to a 0.5 McFarland turbidity was added in each well. C. perfringens ATCC 13124 was used as a control. For penicillin and tetracycline, the interpretive criteria and breakpoints for both techniques adhered to CLSI guidelines. 12 The bacitracin resistance breakpoint was set at >16 µg/mL, according to previous studies.8,16 No other breakpoints were available for the antimicrobials that we tested.
Antimicrobial concentrations tested against Clostridium perfringens.
MIC results were read by the same person throughout the study (
Table 2
;
Suppl. Tables 1, 2
). Replicates for each method were performed on different days, and the 2 methods also were tested on different days. Consistent observations were determined by including data that were within one doubling dilution of each other. Mean MIC values for each isolate were determined by choosing the values found in 2 or 3 of 3 replicates (agar dilution) or the highest values if within 1 doubling dilution (microdilution). If more than 1 doubling dilution was observed between all replicates, the isolate was excluded from the analyses. The intraclass correlation coefficient (
Minimal inhibitory concentration (MIC) distribution of Clostridium perfringens isolates (μg/mL) and percentage of isolates with consistent replicates (n = 64).
Blank cells = non-tested dilutions. The vertical bars for amoxicillin, penicillin, bacitracin, and tetracycline are the breakpoints at which a C. perfringens isolate is considered resistant.
Consistent results = MIC values within one doubling dilution of each other.
Unfortunately, given the low reproducibility of the microdilution method for most antimicrobials tested, we could not calculate the correlation coefficients between the 2 methods. Moreover, because we selected custom AMS plates from the same lot, and numerous plates arrived either broken or with dried wells, broth microdilution plates were tested in duplicate instead of triplicate. With the agar dilution method, a mean of 33.8% (replicate 1: 31.2%; replicate 2: 34.4%; replicate 3: 35.9%) of isolates were found to be resistant to bacitracin compared with 71.9% (replicate 1) and 40.6% (replicate 2) with the microdilution method. Bacitracin resistance levels obtained with the agar dilution method were consistent with a Québec study. 10 However, several other studies from Canada9,17 and the United States 19 obtained higher levels of resistance to bacitracin using the broth microdilution assay. As observed here, the number of bacitracin-resistant isolates was higher with this method. Both methods found no resistance to penicillin. All isolates had very low MIC values for penicillin (both techniques) and amoxicillin (microdilution only). The observed MIC differences in agar dilution and broth microdilution may be attributable to amoxicillin degradation during the preparation of the agar plates; however, this hypothesis needs to be confirmed. Use of ampicillin instead of amoxicillin in MIC determination assays, as suggested by the CLSI, could help avoid this problem. 12
For the rest of the antimicrobials tested, we observed high MIC values with the agar dilution method for erythromycin in 16 isolates (≥128 µg/mL), tetracycline in 45 isolates (≥16 µg/mL), tylosin in 15 isolates (≥16 µg/mL), and virginiamycin in 1 isolate (>4 µg/mL). As for the broth microdilution method, high MIC values were found for erythromycin in 14 isolates (≥128 µg/mL), tetracycline in 5 isolates (≥16 µg/mL), tylosin in 14 isolates (≥16 µg/mL), and virginiamycin in 12 isolates (>4 µg/mL). Differences in the virginiamycin results from both methods were expected because a 50:50 ratio (virginiamycin S1:virginiamycin M1) was used in the agar dilution method, whereas an unknown mix of Oxoid was used for the microdilution plates. Unfortunately, we were unable to obtain a virginiamycin mix directly from the manufacturer that would ensure the exact ratio of both virginiamycin molecules and better reflect what is used in the poultry industry.
We observed a higher number of isolates with high MIC values for tetracycline in the agar dilution method compared with the microdilution method. These results suggest that the broth microdilution method underestimates the MIC values for tetracycline. One possible explanation could be the degradation of tetracycline over time, as has been reported previously. 5 We used the agar plates within 24 h of preparation, limiting the effect of antimicrobial degradation. Additional work to determine the presence of tetracycline-resistance genes in resistant isolates found by the agar dilution method would help to confirm the phenotypic results.
During our experimentation, we detected 2 problems with the first batch of microplates. First, most of the plates had no growth in the wells corresponding to 0.25 and 0.5 µg/mL of virginiamycin. Second, for monensin, growth was observed in every plate in the 2 µg/mL well. The company was contacted about these inconsistencies; however, after doing additional tests, they were unable to explain the results. These manufacturing problems hindered our ability to determine MIC values for both antimicrobials.
Despite great advances in whole-genome sequencing and the detection of AMR genes, a reference method for determining phenotypic AMS is still needed, especially in clinical cases in which treatment hinges on those results. 4 Detection of AMR genes is vital in certain agents, such as methicillin-resistant Staphylococcus aureus or vancomycin-resistant enterococci. 3 This is not the case for C. perfringens. It is imperative to understand that, in many situations, the absence of an AMR gene does not necessarily predict susceptibility to a particular antimicrobial (because of unknown genes or untested genes). 4 Conversely, the detection of AMR genes by PCR does not predict resistance (because of gene inactivation or pseudogenes).2,13
Based on the CLSI guidelines, the agar dilution method is highly recommended for AMS testing of anaerobes. The exception is the Bacteroides fragilis group, for which the broth microdilution method is considered equivalent to agar dilution. 12 A previous study also compared broth microdilution and agar dilution methods for C. perfringens. 6 However, that study used the Wilkens–Chalgren medium, the reference method suggested at that time, instead of the supplemented Brucella medium. Interestingly, even though the media were different, similar variability was observed in the results obtained with the 2 methods. Based on our results, MIC values for some antimicrobials are over- or under-estimated using the broth microdilution method, and amoxicillin MIC values are over-estimated when using the agar dilution method.
Supplemental Material
sj-pdf-1-vdi-10.1177_10406387261429091 – Supplemental material for Comparison of antimicrobial susceptibility testing of Clostridium perfringens by agar dilution and broth microdilution methods
Supplemental material, sj-pdf-1-vdi-10.1177_10406387261429091 for Comparison of antimicrobial susceptibility testing of Clostridium perfringens by agar dilution and broth microdilution methods by Audrey Charlebois, Lila Maduro and Martine Boulianne in Journal of Veterinary Diagnostic Investigation
Footnotes
Acknowledgements
We thank Karine Lamarre for her valuable technical contribution.
Declaration of conflicting interests
The authors declared no potential conflicts of interest with respect to the research, authorship, and/or publication of this article.
Funding
Our work was funded by the Natural Sciences and Engineering Research Council of Canada (NSERC; RGPIN-2019-06923), a grant from the Agri-Innovation Program from Agriculture and Agri Food Canada (PAI-P270), and a grant from the Canadian Poultry Research Council, all awarded to Martine Boulianne (Chair in Poultry Research at the Université de Montréal).
Supplemental material
Supplemental material for this article is available online.
References
Supplementary Material
Please find the following supplemental material available below.
For Open Access articles published under a Creative Commons License, all supplemental material carries the same license as the article it is associated with.
For non-Open Access articles published, all supplemental material carries a non-exclusive license, and permission requests for re-use of supplemental material or any part of supplemental material shall be sent directly to the copyright owner as specified in the copyright notice associated with the article.