
Abstract
Senecavirus A1 (SVA; Picornaviridae, Senecavirus valles) infection causes an emerging infectious disease of swine that often leads to cutaneous vesicles on the snout and coronary bands and in the oral cavity of affected pigs, and causes epidemic transient neonatal loss in piglets. Virus isolation (VI) of SVA is required for viability testing, reference stock production, and monitoring virus evolution. We evaluated sampling and testing parameters leading to the successful propagation of SVA with a cross-sectional design based on 1,102 samples submitted to a reference laboratory. Logistic regression was used to evaluate the association between 16 variables and the outcome. When April was considered the reference month, the odds of SVA isolation failure were 17 and 100 times more likely during July and August, respectively. When foot samples were considered the referent, the odds of VI were 1.7 times more likely in unspecified samples. Compared to pooled samples, the odds of successful SVA isolation in individual samples were 8 and 45 times more likely in July and August, respectively. Laboratory parameters were not significantly associated with SVA isolation. The logistic model was moderately accurate (AUC = 0.68; 95% CI: 0.65–0.72%), suggesting that the model should be used cautiously for practical purposes. High environmental temperatures might negatively affect virus recovery. Using individual samples might improve SVA recovery when high ambient temperatures are recorded, as in the months of July and August.
Keywords
Senecavirus A1 (SVA; Picornaviridae, Senecavirus valles; also known as Seneca Valley virus) causes an emerging infectious disease of swine, first detected in U.S. pigs between 1988 and 2001. 15 Seroprevalence of SVA in 2016 was 12.2% in growing pigs and 34% in sows. 6 Clinical signs of SVA infection include epidemic transient neonatal loss (ETNL), and cutaneous vesicles on the snout and coronary band of the feet and in the mouth.6,12,15 SVA infection is indistinguishable by clinical signs alone from other vesicular diseases, such as foot-and-mouth disease, vesicular stomatitis, and swine vesicular disease. Foreign animal disease (FAD) investigations of porcine vesicular complaints during 2016–2017 increased from 438 to 1,395 owing to SVA. Failure to detect SVA negatively affects pork imports into the United States 20 and prompts false alarms to pork producers and regulatory authorities. Additionally, systemic signs of SVA infection and ETNL might result in a decrease in pork production. Therefore, accurate detection of SVA is essential.
Virus isolation (VI) detects live viruses from a sample and allows further analysis of the virus, compared to PCR, which detects both live and non-viable viruses. The conditions for sampling and culturing a virus in the laboratory affect the viability of a virus. SVA is more likely to be detected in lesion swabs, oral fluid, tissue, and oral fluid samples, which are thus preferred over blood samples.8,10,12 Effective VI is essential for analysis of viral variants, and for monitoring of evolution patterns or trends in the occurrence and prevention of SVA.
There is a gap in knowledge regarding the environmental and laboratory factors that affect successful isolation of SVA. Understanding the significant factors involved in the isolation of SVA will facilitate the surveillance, monitoring, and analysis of the virus. We investigated the association among successful SVA isolation, field sampling, and laboratory parameters for samples submitted to a state laboratory. We hypothesized that some of these factors would affect SVA isolation.
Materials and methods
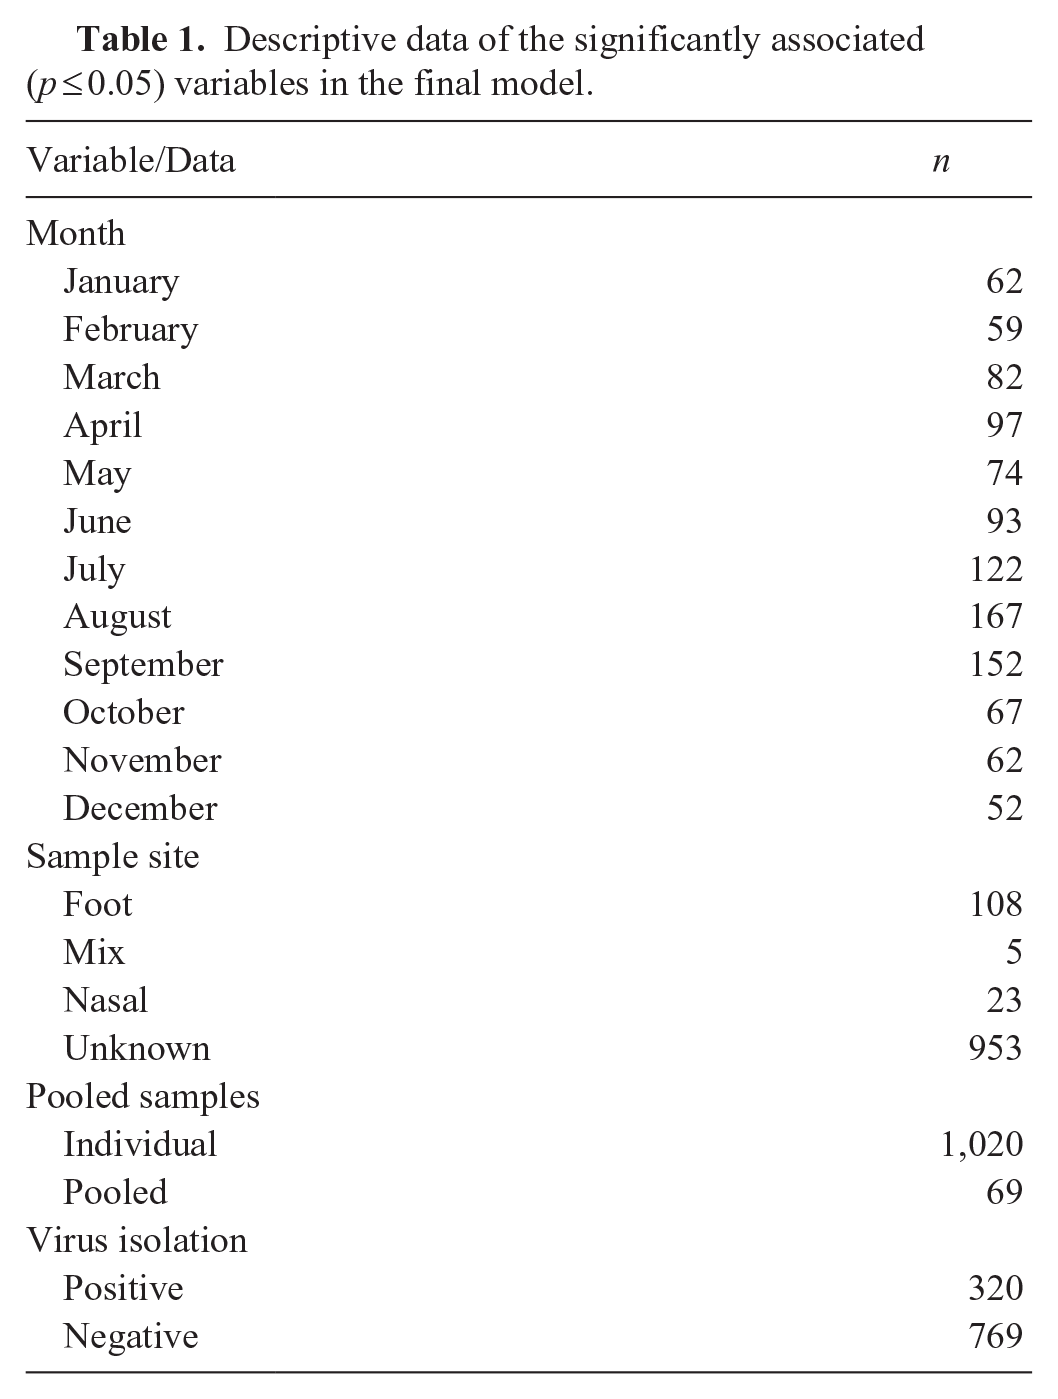
Regulatory personnel collected samples from pigs with vesicular lesions for SVA testing, and submitted the samples to the California Animal Health and Food Safety Laboratory (CAHFS; University of California–Davis, Davis, CA, USA) from January 2017 to September 2018. The sampling method was similar among the submitters, including sampling procedure, tools, and containers (i.e., sample media, sampling material). The reference population included 1,150 samples submitted to CAHFS for SVA testing by 12 regulatory officials from 7 counties in California. We excluded samples from our study based on missing date of collection (43 entries), samples that were not tested for SVA (16 entries), a sample that resulted in an indeterminate VI result (1 entry), and a sample with a negative value of duration (1 entry). Consequently, we included 1,089 porcine samples. Samples originated from Stanislaus County (n = 987; 90.6%), Fresno County (n = 88; 8.1%), and others (n = 14; 1.3%). Most samples (n = 1,055; 96.9%) were submitted to CAHFS within a day from the time of collection. Sampling sites included swabs of unspecified site (n = 953; 87.5%), foot (n = 108; 9.9%), nasal (n = 23; 2.1%), and a mix of nasal and foot samples (n = 5; 0.5%). Samples were submitted individually (n = 1,020; 93.7%) or pooled (n = 69; 6.3%). All pooled samples were collected from one premise from June to September 2017.
The submitted swab specimens were filtered (0.45 μm) to remove bacteria and debris, followed by vortexing the filtered swab. Swab specimens were stored at −80°C if they could not be processed immediately. Swab homogenate (0.75 mL) from each sample was grown in Vero cells and tested for SVA by reverse-transcription PCR (RT-PCR). Tested samples with Ct values >40 were considered negative, and no further testing was performed. However, swab specimens with PCR Ct results <35 were considered positive. Samples with positive SVA results were submitted for VI. Expiration dates for different types of each cell medium, confluency of cells, maximum allowed number of cell passages, number of cells/mL, and QC of growing cells were documented.
The VI procedure was similar for all submitted samples. In preparation for virus inoculation, the swab specimens were diluted to 1:3 with a mixture of Gibco Dulbecco modified Eagle medium (DMEM; ThermoFisher) solution containing 10,000 μg/mL of penicillin, 10,000 μg/mL of streptomycin, 500 μg/mL of ciprofloxacin in triple-distilled water, and 250 μg/mL of amphotericin B. VI was performed using Vero cells (ATCC CCL-81) supplemented with 2% fetal bovine serum (FBS), Eagle minimum essential medium (MEM; Media Tech), and DMEM solution.9,19 Cells were maintained at 37°C and 5% CO2 for up to 200 passages. Cell confluency of 70–90% was accepted for each inoculation. For cell propagation, the cell:medium ratio was proportioned to 1:15. A DMEM solution and 1:3 mixture of each prepared sample was inoculated into the 12-well plate with prepared Vero cells. Positive and negative controls for each sample were included in each plate. The cell passage for the positive control was inoculated with a known virus that causes cytopathic effect (CPE), and the negative control was inoculated with a DMEM solution. The known virus and the DMEM solution for controls were analyzed similarly to the swab specimens. The inoculated cell plates were stored under 37°C and 5% CO2 in an incubator. Incubated plates were rocked every 15 min. After inoculation, plates were observed daily for a week for CPE. After a week, the sample wells were scraped with a pipette tip and centrifuged, then the supernatant was submitted for the second PCR test. When the difference in Ct values of the original sample and the first inoculation (P1) was <6 Ct units, the result was deemed positive for VI. However, when the Ct value of P1 was ≥6 compared to the Ct value of the original sample, a second inoculation (P2) was performed using material from P1 as an inoculation sample, and a third PCR test was evaluated. The procedure for P2 was the same as the P1 procedure. Due to different dilution factors, VI was deemed positive when the difference in the Ct value between the P1 and P2 was <3. When the difference in Ct values was ≥3, the samples were classified as no virus was isolated. In summary, a positive outcome was defined by 1) <35 Ct value in the first PCR, and a difference between the first and second PCR of ±6 Ct value, or 2) <35 Ct value in first PCR, and a difference between the first and second PCR of ≥6 Ct value, and a difference between the second and third PCR within 3 Ct values. The numbers for the Ct value differences between PCR tests to determine a VI result were derived from calculations considering the dilution factor during inoculation.
We used a cross-sectional study design to evaluate the association between variables from collected data and successful SVA isolation. The outcome was defined as a positive or negative VI result of each sample. As noted above, 1,089 samples were available for analysis (Table 1; Suppl. Table 1). Sample parameters included the county of collection, collection site (abattoir), collected month, sample submitter, whether the sampled pig was submitted for autopsy, whether the sample was from vesicle or lesion, whether the sample was pooled or individually collected, and sampling site (nasal, foot). The sample information was recorded by regulatory personnel who submitted samples to the CAHFS laboratory. Laboratory parameters included duration (days) between submission and initiation of VI, date collected, logged date, cell passage number, cell confluency (%), and whether antibiotics were in extended use. Among them, quantitative parameters such as duration of time, cell passage number, and cell confluency were not categorized into groups. Laboratory personnel logged the laboratory and sample data into the CAHFS laboratory information system. Abnormal data entries were verified with laboratory personnel during the analysis process with corrections made.
Descriptive data of the significantly associated (p ≤ 0.05) variables in the final model.
The prevalence odds ratio (POR) was assessed to determine the strength of association between the parameters and the VI outcome. Logistic regression was used to determine the statistically significant association between variables and the dichotomous outcome. 2 Initially, univariate models for each variable were determined, followed by stepwise forward selection of variables, and choosing the model with the lowest Akaike information criterion value. One multivariable model without any interaction term and a second multivariable model with interaction term(s) were determined. The fitness of the 2 models was evaluated with a likelihood ratio test. A receiver operating characteristic (ROC) curve was used to evaluate the area under the curve (AUC) 1 and quantify the predictability of the final model. The 95% CI of the AUC was calculated using the DeLong method. Finally, validity was checked by multicollinearity and influential observation. RStudio (v.1.4.1103, https://github.com/rstudio/rstudio) and Excel (v.2109 Build 16.0.14430.20224; Microsoft) were used for data storage and analysis.
Results
SVA isolation was successful from 769 samples (70.6%) and negative from 320 samples (29.4%). Most of the successful samples had Ct value of ≤25 (Table 2). Most samples were submitted in August (n = 167, 15.3%; Fig. 1). The number of SVA isolations (n = 109; 10.0%) was highest in September, and that of negative isolations (n = 88; 8.1%) was highest in August (Table 3).
Association between Ct value of sample submitted and virus isolation (VI).
Attempts to isolate senecavirus A1 by month.
Logistic regression analysis result of the final multivariable model.
POR = prevalence odds ratio; Ref = reference value.
Significant (p <0.05) value.
Submitter, pooling samples, and the count of first and second cell passages were significantly associated with the success of VI (p < 0.05) in the univariate analysis, but were not significantly associated (p > 0.05) with successful VI in the final logistic regression model. The odds ratio (OR) of successful VI for submitters H, J, and M to the reference submitter (submitter A) were 0.29 (95% CI: 0.09–0.98%; p = 0.046), 0.29 (95% CI: 0.09–0.98%; p = 0.046), 0.50 (95% CI: 0.26–0.99%; p = 0.047), respectively. Reference samples were from submitter A in Stanislaus County; samples from submitters H, J, and M came from Fresno County. Individually submitted samples had higher ORs of successfully isolated SVA compared to pooled samples (OR = 6.30; p < 0.001). A unit increase in first cell passage count (OR = 1.01; p = 0.02) and a second cell passage count (OR = 1.01; p = 0.001) contributed to a higher OR of successful SVA isolation. Variable counts <5 did not yield a 95% CI (Table 4).
Logistic regression analysis result of the statistically significant univariable models.
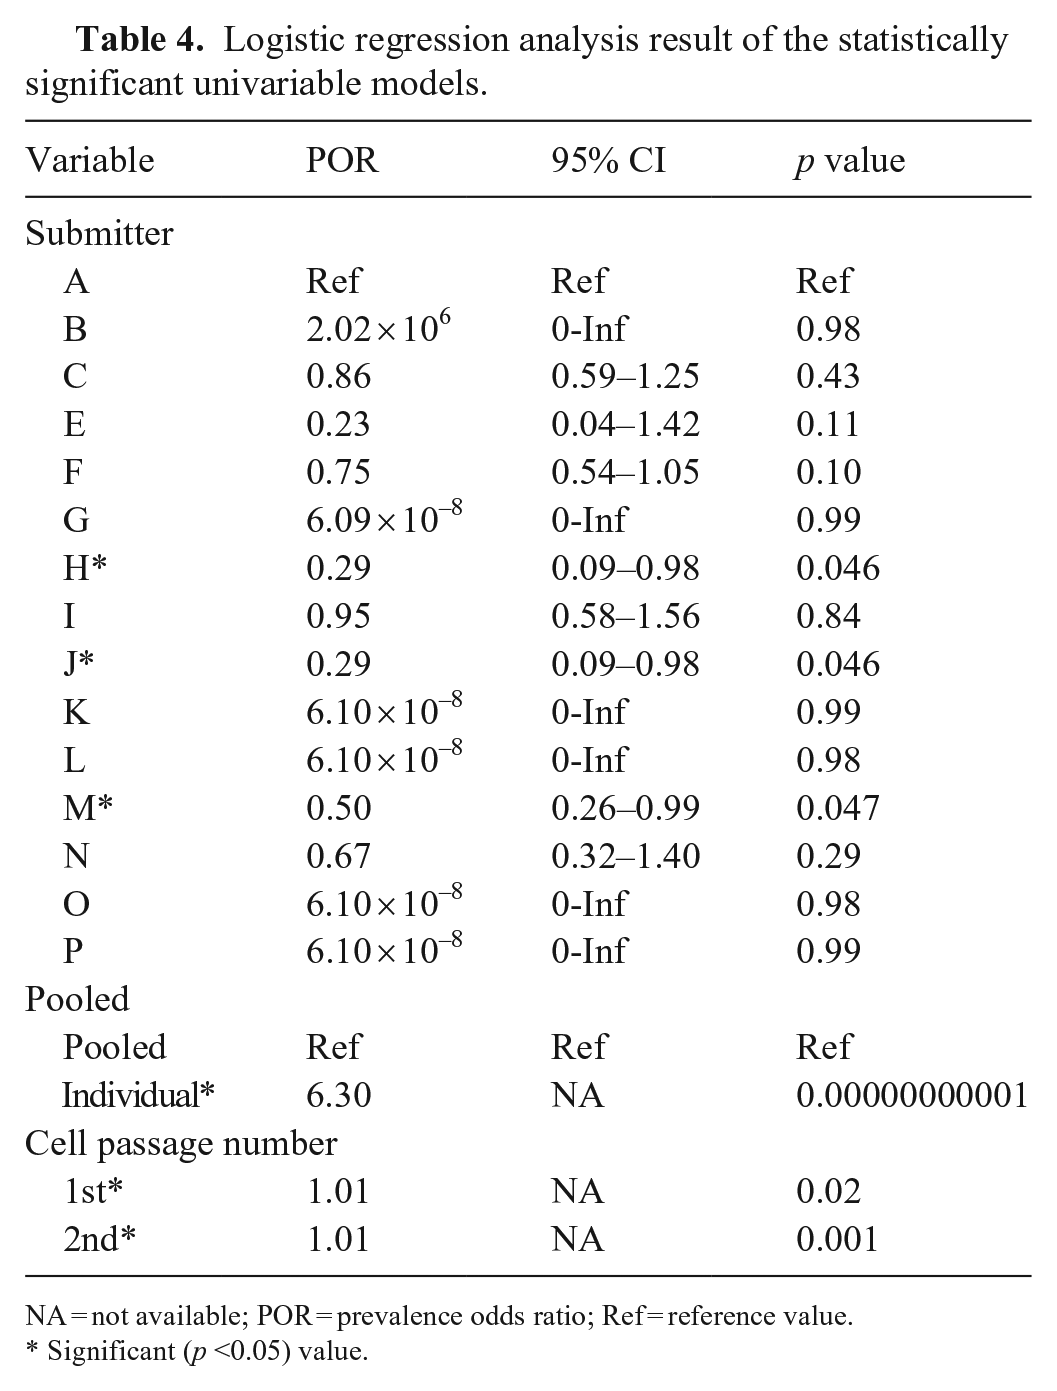
NA = not available; POR = prevalence odds ratio; Ref = reference value.
Significant (p <0.05) value.
The diagnostic probability of the final model had an AUC of 0.68 (95% CI: 0.65–0.72%), which is less-than-moderate accuracy. 16 The sampling month, specimen type (foot, nasal), pooling, and interaction between month and pooling were significant predictors of the VI result in the final model (Table 3). The odds of SVA isolation failure were 17 and 100 times, respectively, more likely during July (OR = 0.06; 95% CI: 0.01–0.49%; p = 0.01) and August (OR = 0.01; 95% CI: 0.001–0.071%; p = 0.000004) when April was considered the referent month. Among sample sites, the odds of positive SVA isolation from nonspecified swabs (OR = 1.72; 95% CI: 1.11–2.66%; p = 0.016) were more likely to result in successful VI when foot samples were considered the referent. There were no significant differences in the OR of SVA isolation between individual and pooled samples; however, compared to pooled samples, the ORs of individual samples were 45 (OR = 45.2; 95% CI: 6.62–309%; p = 0.0001) and 8 (OR = 8.12; 95% CI: 1.03–63.9%; p = 0.04) times more likely to generate positive SVA isolation in August and July, respectively. Laboratory parameters were not significantly (p > 0.05) associated with VI.
Other sample characteristics, such as the duration between submission and processing of sample, collected date, logged date, county, whether sampling was from vesicle, and cell confluency of the first and second inoculation, were not significantly (p > 0.05) associated with the outcome of VI.
Discussion
We found that individually submitted samples were associated with successful SVA isolation even in high environmental temperatures compared to pooled samples. Most pooled samples were collected in the summer, providing sufficient statistical power to evaluate the association between 2 types of sample submission and SVA isolation in the summer. The percentage of sample submissions and failed SVA isolation were higher during July and August than in other months. The pooled samples during summer resulted in fewer SVA detections despite the seasonality of SVA in summer. However, individually submitted samples had a positive association with VI in July and August, the 2 months with the highest percentage of SVA isolation failures. This suggests that, compared to the pooled samples, testing individual samples overcomes the low likelihood of SVA isolation. This is concerning because previous research5,13,17 suggested that the SVA prevalence is higher in summer compared to other seasons. However, our results should be interpreted with caution because the predictability of our final regression model is less than moderate.14,16 High ambient temperature during our study was recorded in July and August from 2017 to 2018. The high ambient temperature might negatively affect the viability of SVA at the time of sampling.10,11 Furthermore, maintaining appropriate sample temperature during shipping of samples to the laboratory is more difficult during the summer months compared to spring, fall, and winter.
We included day variables to determine if different sampling days (e.g., Monday vs. Tuesday) affected successful virus recovery. Although fewer samples were submitted and tested on weekends, there was no significant difference in SVA isolation results compared to weekdays. Furthermore, the other laboratory parameters evaluated were not significant factors associated with the prediction of VI results, except for a slight increase in odds of successful VI with each one unit increase of cell passage numbers. This suggests that the laboratory procedures that we utilized are consistent. The low odds of SVA isolation in samples provided by submitters H, J, and M might be due to longer delivery time periods.3,7,11 Stanislaus County, where the reference submitter was primarily located, is geographically close to the laboratory that analyzed the samples, and the submitter delivered the samples within hours, whereas submitters H, J, and M shipped samples overnight.
The higher VI prevalence ratio of unspecified swabs is likely due to a relatively large sample size compared to other sample types. 18 The univariate model of individually submitted samples likely shows a positive association with successful SVA isolation due to the larger sample size in individually submitted samples compared to pooled samples. However, pooling or submitting individual samples might be a confounder of the month. Pooling can limit the ability to detect virus in the sample due to the introduction of inhibitors or dilution, 4 resulting in unsuccessful propagation of SVA.
Our study had limitations because it was retrospective and utilized convenience samples. Selection bias was likely present because only reported farms were sampled for investigation. Some submission forms did not include sufficient details of the lesion site where samples were collected. Additionally, the time from sample collection to VI and sample storage temperature were not available for our study. Also, samples might have been pooled from different lesions from one animal or pooled from multiple animals. Future studies should precisely consider detailed information on the variables included in the samples submitted. The data were recorded manually, introducing potential transcription errors. However, all of the numerical data entries in our dataset were deemed consistent, suggesting correct data entry.
Supplemental Material
sj-pdf-1-vdi-10.1177_10406387251327604 – Supplemental material for Evaluation of sampling and laboratory parameters contributing to successful isolation of senecavirus A1 from pigs
Supplemental material, sj-pdf-1-vdi-10.1177_10406387251327604 for Evaluation of sampling and laboratory parameters contributing to successful isolation of senecavirus A1 from pigs by BoMyoung Kim, Munashe Chigerwe and Beate M. Crossley in Journal of Veterinary Diagnostic Investigation
Footnotes
Declaration of conflicting interests
The authors declared no potential conflicts of interest with respect to the research, authorship, and/or publication of this article.
Funding
The authors received no financial support for the research, authorship, and/or publication of this article.
Supplemental material
Supplemental material for this article is available online.
References
Supplementary Material
Please find the following supplemental material available below.
For Open Access articles published under a Creative Commons License, all supplemental material carries the same license as the article it is associated with.
For non-Open Access articles published, all supplemental material carries a non-exclusive license, and permission requests for re-use of supplemental material or any part of supplemental material shall be sent directly to the copyright owner as specified in the copyright notice associated with the article.