
Abstract
The observation of amyloid-β (Aβ) lesions using autofluorescence in transgenic mice and human Alzheimer disease patients has been reported frequently. However, no reports verify the autofluorescence of spontaneous Aβ amyloidosis in animals, to our knowledge. We validated the autofluorescence of Aβ lesions in spontaneous squirrel monkey cases under label-free conditions; lesions had intense blue-white autofluorescence in fluorescence microscopy using excitation light at 400–440 nm. Thioflavin S staining and immunohistochemistry of the same specimens revealed that this blue-white autofluorescence was derived from Aβ lesions. Hyperspectral analysis of these lesions revealed a characteristic spectrum with bimodal peaks at 440 and 460 nm, as reported for Aβ lesions in mice. Principal component analysis using hyperspectral data specifically separated the Aβ lesions from other autofluorescent substances, such as lipofuscin. A non-labeled and mechanistic detection of Aβ lesions by hyperspectral imaging could provide valuable insights for developing early diagnostic techniques.
Alzheimer disease (AD) is a progressive neurodegenerative disorder characterized by cognitive decline in memory, learning, and thinking, and accounts for 75% of dementia in the elderly. 2 As of 2022, it is estimated that there are ~6.5 million patients in the United States, and by 2060 the number will exceed 13.8 million. 15 However, despite the severity of the disease, all attempts to develop curative therapies have failed, and only palliative treatments that slow disease progression have been applied. 10 Given that palliative treatment is more effective when applied early, further clarification of the disease and the development of early diagnostic methods are needed.
Pathologic features of AD include senile plaques consisting of amyloid-β (Aβ) and amyloid angiopathy in the brain. Given that histologic detection of these lesions is the basis for definitive diagnosis and correlates with disease progression, 7 accurate detection of lesions in the early stages of the disease is essential for diagnosis and subsequent treatment. Commonly, amyloid lesions are detected histologically using amyloid-binding dyes such as Congo red and thioflavin S (ThS) or immunohistochemistry (IHC).1,14 However, these methods require skilled technologists and time-consuming processing. In addition, it is difficult to reuse tissue specimens used for IHC for other analyses because of tissue damage caused by the heat or acid treatments used for antigen retrieval.
Autofluorescence of amyloid lesions has been reported. 5 Aβ lesions are known to emit autofluorescence and do not require special processing or fluorescent substances for their observation. Label-free autofluorescence imaging has the advantage that the sample can be reused in its original state for other analyses. Therefore, label-free autofluorescence imaging has been actively studied, including autofluorescence imaging of amyloid plaques in transgenic mice reproducing the lesions of AD, 3 and label-free fluorescence imaging in human cases affected by AD.6,12 However, the autofluorescence of spontaneous Aβ amyloidosis in naturally occurring animal models has not been reported. We analyzed the autofluorescence of spontaneous Aβ lesions in squirrel monkeys and attempted label-free imaging of autofluorescence in cerebral Aβ lesions.
Materials and methods
Case information
We used brain tissue from 8 squirrel monkeys (Saimiri boliviensis) in our experiments (Suppl. Table 1). All cases were used in previous experiments, and amyloid deposition had been identified histologically in the brain. 8 After autopsy, brain tissue was fixed in 10% neutral-buffered formalin, coronally sectioned at 5-mm intervals, and embedded in paraffin wax. The experiments were approved by the Animal Care and Use Committee at the Medical Institute of the University of Tokyo and performed according to the guidelines for animal experiments issued by the Medical Institute of the University of Tokyo.
Fluorescence microscopy
Formalin-fixed, paraffin-embedded (FFPE) specimens of the bilateral frontal lobe were cut at 5 μm and mounted on glass slides (MAS-05; Matsunami Glass). One tissue section was prepared per case. After deparaffinization with xylene and hydrophilic treatment with ethanol, each specimen was rinsed with pure water, dried, and subjected to fluorescence microscopy (Suppl. Fig. 1). Prior to fluorescence microscopy, each unstained specimen was examined under white light, and senile plaques and blood vessels were identified based on morphologic characteristics by a Japanese College of Veterinary Pathologists–certified veterinary pathologist (T. Murakami). Senile plaques were recognized as 20–30-µm, spherical-to-radial structures in the cerebral cortex in brightfield microscopy. A fluorescence microscope (BX51; Olympus) with a custom filter (λex 370–420 nm; dichroic mirror, 420 nm; λem 430 nm) was used to examine autofluorescence. For reference, excitation light irradiated on tissue sections appears violet to the naked eye. RGB images were acquired using a complementary metal-oxide-semiconductor (CMOS) camera (STC-MCCM200U3V, Omron Sentech; Suppl. Fig. 2).
Hyperspectral image acquisition
To obtain hyperspectral images, a custom system was developed. A hyperspectral camera (NH series, Eba Japan; 1,000 × 1,000 pixels, 350–700 nm) was integrated into a fluorescence microscope (BX51) equipped with a custom filter (λex 370–420 nm; dichroic mirror, 420 nm; λem 430 nm). A 300 W xenon lamp (MAX-303; Asahi Spectra) was introduced as the excitation light source. Hyperspectral data were acquired in the spectral range 350–700 nm with 5-nm step (71 bands). The scanning speed was 10 lines/s, and a 1-megapixel hyperspectral image was obtained in 100 s. Hyperspectral images were obtained with a 20× objective lens (UPlanFL; Olympus) from 3 cortical areas with amyloid deposition per case.
Principal component analysis of hyperspectral images
Using scikit-learn, 9 an open-source machine learning library in Python, principal component analysis (PCA) was performed using the spectral information of each pixel of hyperspectral images as the explanatory variable. All pixels and all measured wavelength components in the hyperspectral images were used for the analysis. Before analysis, the 3-dimensional data consisting of the coordinate and wavelength information of the hyperspectral image was formatted to be a 1-row array according to the library specification in scikit-learn. In addition, smoothing was performed before PCA to reduce the effect of noise. The PCA results were transformed into heat maps based on their similarity to Aβ lesion–specific components, using the variable that best represents the fluorescence information about the Aβ lesions in the data.
Detection of Aβ lesions by ThS staining and IHC
ThS staining and IHC were performed on the unstained sections that had been used for the autofluorescence examinations. First, each specimen was stained with 1% ThS solution for 8 min and sealed using nonfluorescent inclusion material (Fluoromount-G; SouthernBiotech). ThS fluorescence images were observed with a fluorescence microscope (BX51; Olympus) equipped with a U-MWBV2 filter (λex 400–440 nm; dichroic mirror, 455 nm; λem 475 nm) and captured using a CMOS camera (WRAYCAM-VEX120; Wraymer) at the same site where autofluorescence and hyperspectral images were acquired.
For IHC, an anti-Aβ mouse monoclonal antibody (clone AB9, Novus Biologicals; 1:1,000 dilution) was used as a primary antibody. For antigen retrieval, specimens were immersed in 70% formic acid for 5 min before reacting with the primary antibody. A horseradish peroxidase–labeled polymer anti-mouse immunoglobulin antibody (Dako) was used as the secondary antibody. A diaminobenzidine tetrahydrochloride substrate kit (Liquid DAB + substrate chromogen system; Dako) and hematoxylin were used for color development and counterstaining, respectively. IHC images were captured using a CMOS camera (WRAYCAM-VEX120; Wraymer) attached to a BX51 microscope at the same site at which autofluorescence and hyperspectral images were acquired.
Spectral analysis of autofluorescence of Aβ lesions
Hyperspectral images were analyzed (Hyperspectral image analyzer; Eba Japan). In the pseudocolor images obtained from hyperspectral images, blue luminescent areas (total pixels: 1,590) were selected where ThS staining and IHC confirmed Aβ deposits. The fluorescence spectrum obtained from each pixel within the selected region was averaged to obtain the fluorescence spectrum of the Aβ lesion. For the fluorescence spectrum of lipofuscin, the yellow autofluorescence found in neuronal cytoplasm (total pixels: 1,559) was selected, and the fluorescence spectrum obtained from each pixel was averaged. For the background fluorescence spectrum, some regions (total pixels: 6,559) that did not contain autofluorescence of Aβ lesions or lipofuscin were selected, and the fluorescence spectrum obtained from each pixel was averaged.
Results
Autofluorescence of Aβ lesions
In all 8 cases, fluorescence microscopy of unstained FFPE sections of squirrel monkeys revealed intense blue-white autofluorescence of plaque-like structures of 20–30-μm diameter in the cerebral cortex and vessel walls (Fig. 1). In addition, various amounts of yellow granular fluorescence were observed in the neurons, which appeared to be caused by lipofuscin. The neuropil had green fluorescence. A comparison of autofluorescence images with ThS staining and IHC on the same slides showed that the blue-white autofluorescent lesions were consistent with Aβ-positive areas.
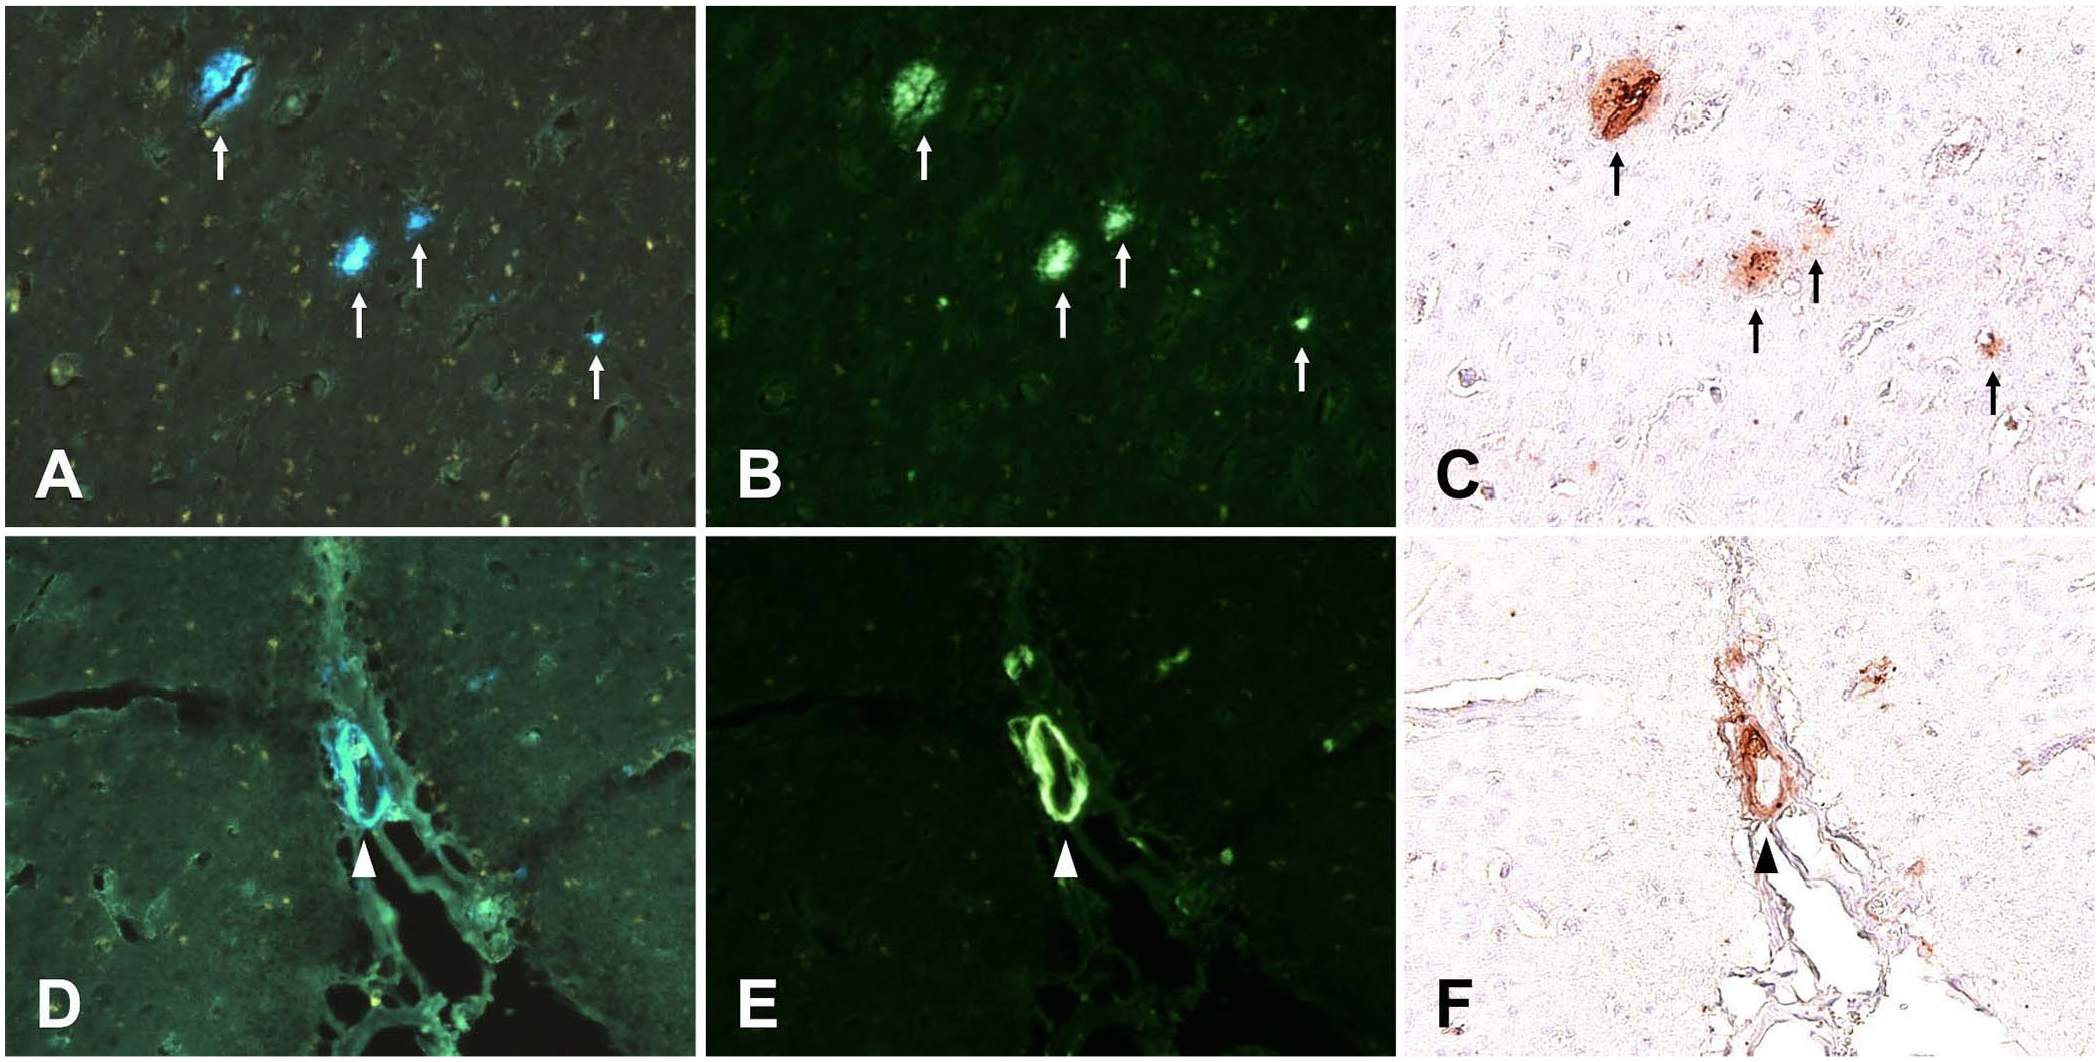
Autofluorescence, thioflavin S fluorescence, and immunohistochemistry of amyloid-β (Aβ) lesions in the cerebral cortex of a squirrel monkey. Each of the 3 photographs in the upper and lower rows is from the same field in the same section. Arrows and arrowheads indicate amyloid plaque (A–C) and vascular amyloid deposition (D–F), respectively.
Hyperspectral analysis of Aβ lesions
Hyperspectral analysis of the autofluorescence of Aβ lesions in squirrel monkeys revealed sharp bimodal peaks at 440 and 460 nm and a gentle shoulder at 490 nm (Fig. 2; Suppl. Fig. 2). On the other hand, the autofluorescence spectra of lipofuscin and neuropil had single dull peaks at 510 and 480 nm, respectively (Fig. 2; Suppl. Fig. 2). These spectral properties of each lesion-derived autofluorescence were uniform in all animals.
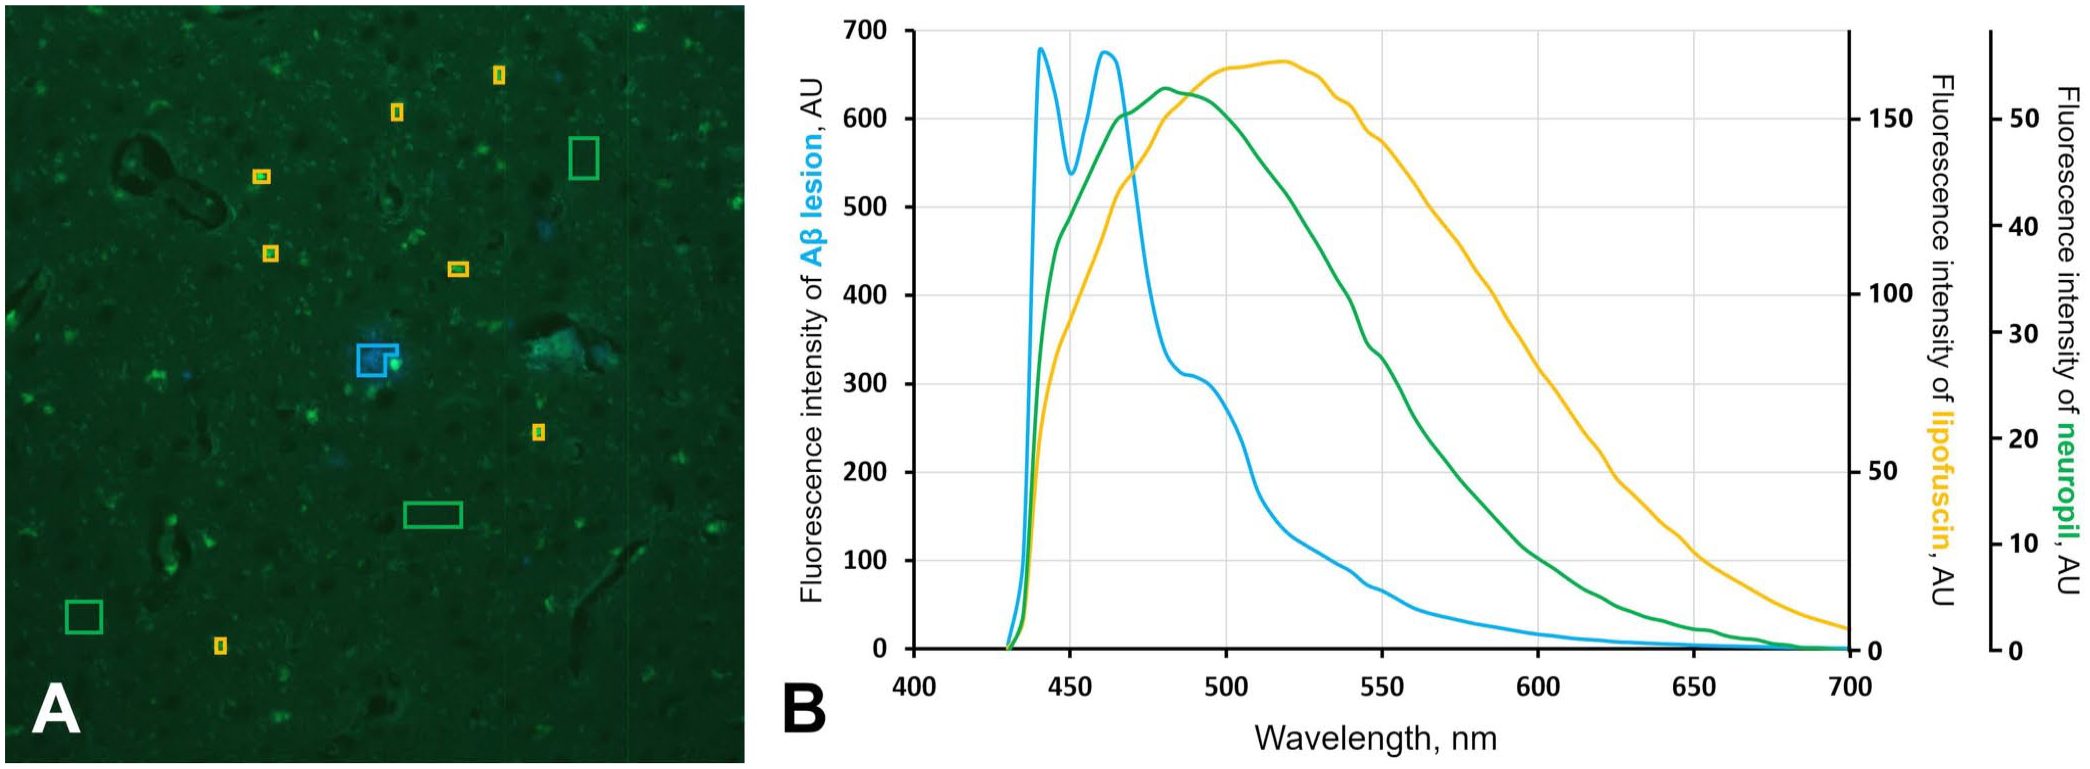
Fluorescence spectra of amyloid-β (Aβ) lesions in squirrel monkeys.
Label-free detection of Aβ lesions using PCA
PCA using the hyperspectral data was performed to specifically identify the fluorescence spectrum of the amyloid lesion (Fig. 3). The eigenvector of principal component 1 (PC1) exhibited only a positive maximum of ~460 nm, suggesting that the visualized image reflects the brightness of the image. On the other hand, PC2 identified amyloid lesions specifically. The eigenvector exhibited bimodal positive maxima of 440 and 460 nm, similar to the fluorescence spectrum of amyloid lesions, and negative maxima of 530 nm. The latter negative maxima may contribute to separating amyloid lesions and lipofuscin. PC3 appeared to detect amyloid lesions but was unable to separate them from lipofuscin.
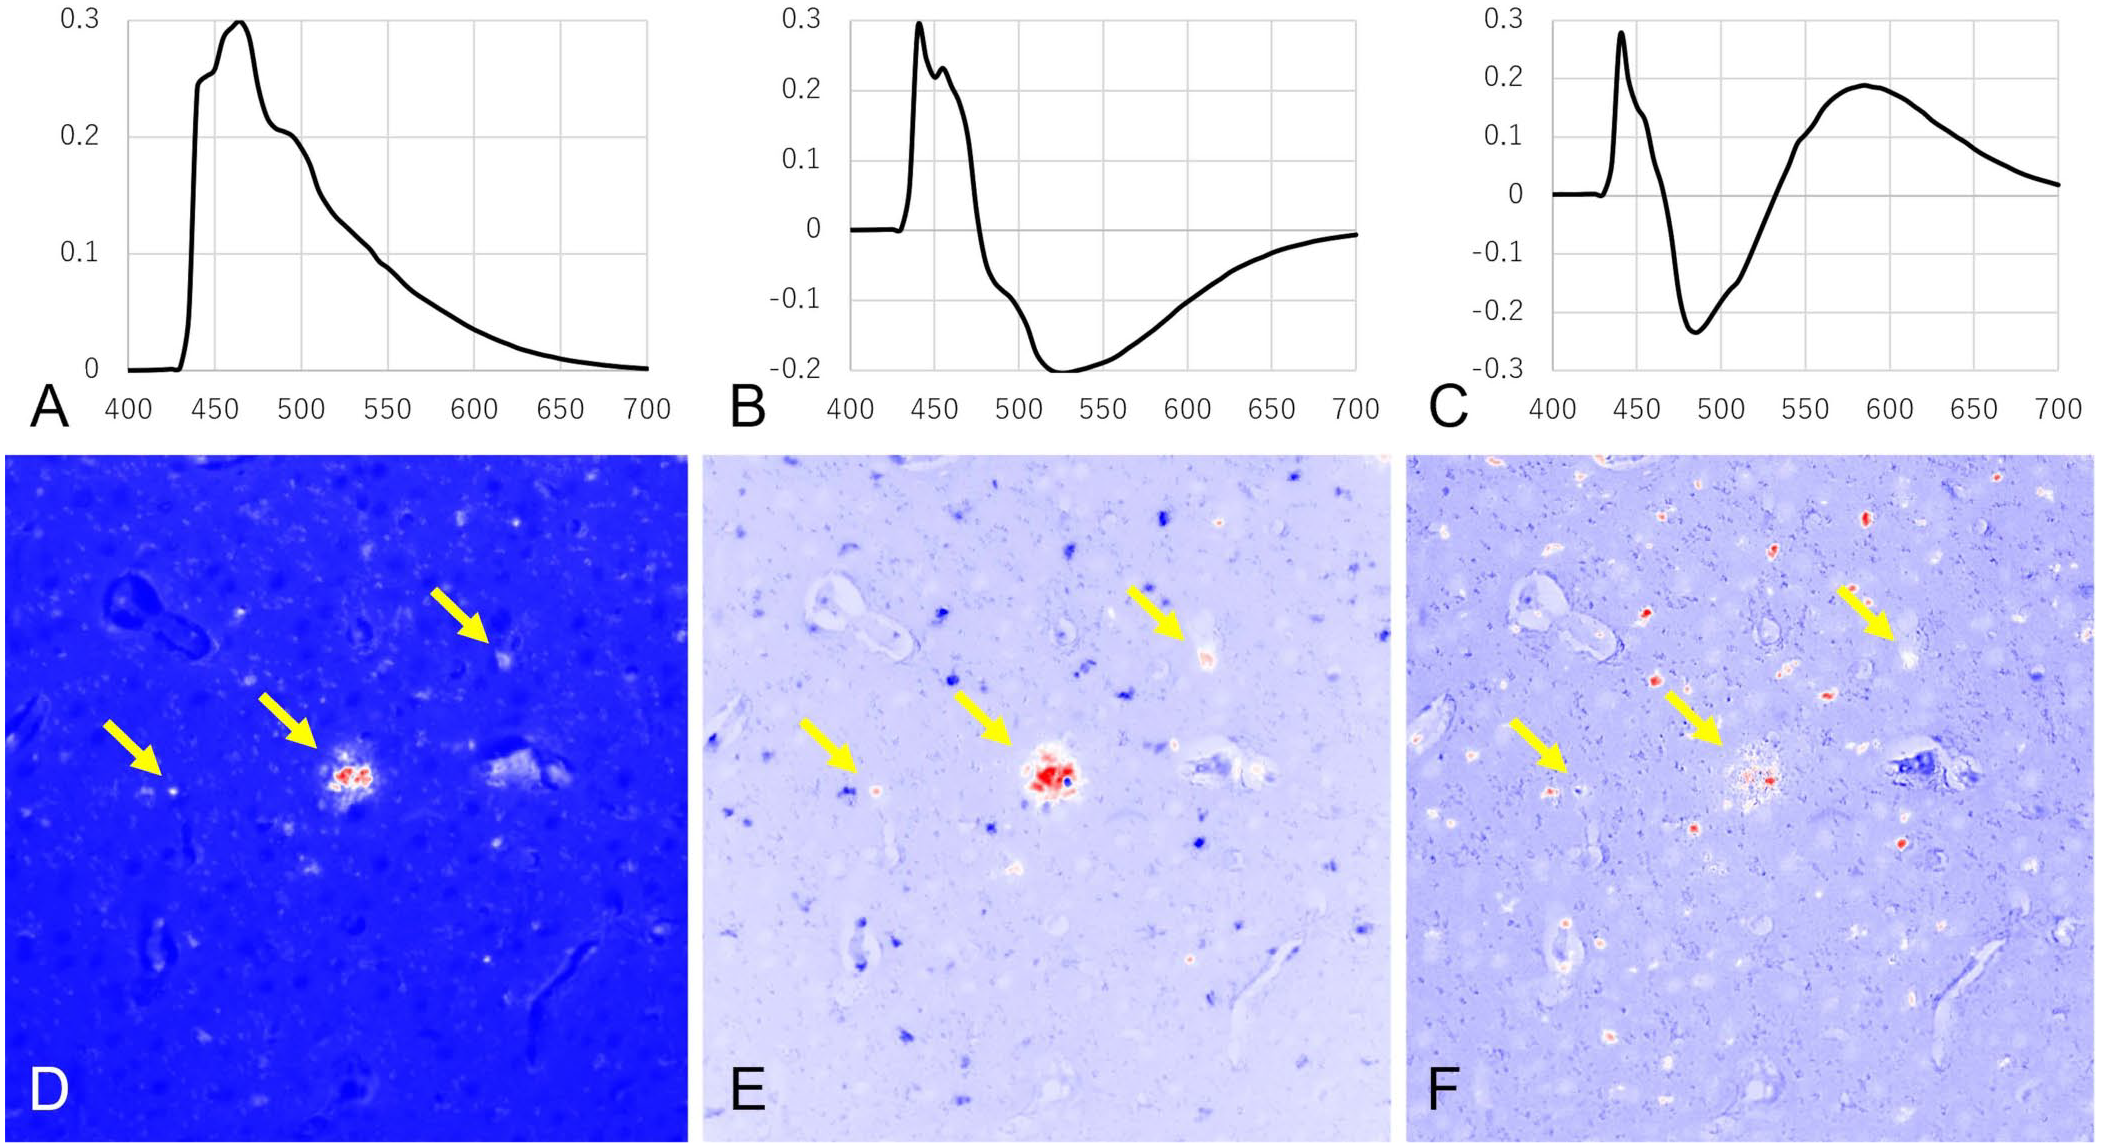
Specific detection of amyloid-β (Aβ)-derived autofluorescence in a squirrel monkey by principal component analysis. The upper images show the eigenvector of (
Discussion
We found characteristic blue-white autofluorescence from cerebral cortical plaques and vessel walls in squirrel monkeys, consistent with the Aβ-positive areas of ThS staining and IHC. Notably, these autofluorescences were distinct, and their fluorescent hue differed from the background and other fluorescent substances, such as lipofuscin. Our findings, and studies that showed autofluorescence of Aβ lesions in transgenic mice,3,13 indicate that Aβ deposition occurring in spontaneous Aβ amyloidosis in squirrel monkeys can be detected fluorescently without labeling. Our study provides important insights for future extrapolation of this technology to humans by demonstrating label-free visualization of amyloid in monkeys, which is closely related to humans.
Autofluorescence imaging is free from special pretreatments or reagents, thus causing limited damage to tissues, and can be examined sooner than with conventional methods. Autofluorescence imaging will be powerful as a pre-protocol for diagnosis because unstained specimens observed for autofluorescence can be sent for other analyses such as ThS staining or IHC. Studies that showed autofluorescence of Aβ lesions in mouse models used 360 or 405 nm excitation light, 3 but prolonged exposure to UV light can cause tissue damage. We found that autofluorescence could be observed using excitation light at 400–440 nm under conditions that cause less UV damage to the sample.
The autofluorescent color of Aβ lesions was different from that of lipofuscin and the neuropil, and was discernible on observation of RBG images. However, it is challenging to identify some lesions with low fluorescence intensity or lesions overlapping with another fluorescent material. Therefore, we performed hyperspectral imaging to analyze fluorescence characteristics in more detail. Based on hyperspectral analysis, Aβ lesions had a characteristic fluorescence spectrum with bimodal peaks, similar to the autofluorescent spectrum of Aβ lesions identified in mouse models. 3 Our study corroborates previous studies by showing a similar characteristic spectrum in spontaneous cases, indicating that the autofluorescence properties of Aβ in disease-model animals and spontaneous cases may be universal.
We found that PCA could precisely extract the spectrum specific to Aβ lesions from the hyperspectral data. Future development of machine learning based on multivariate analysis of hyperspectral images may allow automated detection of Aβ lesions without expert knowledge. Aβ deposits are also found in the retina and are correlated with the amount of deposition in the cerebral cortex. 11 In fact, analysis of retinal reflectance spectra using hyperspectral cameras has already revealed that the retinas of AD patients exhibit a different spectrum. 4 In the future, hyperspectral analysis of Aβ lesions in the retina in vivo may allow for label-free, noninvasive diagnosis.
Supplemental Material
sj-pdf-1-vdi-10.1177_10406387231204876 – Supplemental material for Label-free autofluorescence and hyperspectral imaging of cerebral amyloid-β lesions in aged squirrel monkeys
Supplemental material, sj-pdf-1-vdi-10.1177_10406387231204876 for Label-free autofluorescence and hyperspectral imaging of cerebral amyloid-β lesions in aged squirrel monkeys by Ryohei Oba, Naoki Ujike, Yuki Ono, Takayuki Okano and Tomoaki Murakami in Journal of Veterinary Diagnostic Investigation
Footnotes
Declaration of conflicting interests
The authors declared no potential conflicts of interest with respect to the research, authorship, and/or publication of this article.
Funding
Our research was funded by the Japan Society for the Promotion of Science (grant 22K19242), the Program on Open Innovation Platform with Enterprises, Research Institute and Academia (OPERA) from the Japan Science and Technology Agency (JST), and the Adaptable and Seamless Technology transfer Program through target-driven R&D (A-STEP; grant JPMJTM20CY) from JST.
Supplemental material
Supplemental material for this article is available online.
References
Supplementary Material
Please find the following supplemental material available below.
For Open Access articles published under a Creative Commons License, all supplemental material carries the same license as the article it is associated with.
For non-Open Access articles published, all supplemental material carries a non-exclusive license, and permission requests for re-use of supplemental material or any part of supplemental material shall be sent directly to the copyright owner as specified in the copyright notice associated with the article.