
Abstract
Anticoagulant rodenticides (ARs) are used to control rodent populations. Poisoning of non-target species can occur by accidental consumption of commercial formulations used for rodent control. A robust method for determining ARs in animal tissues is important for animal postmortem diagnostic and forensic purposes. We evaluated an ultra-performance liquid chromatography coupled with mass spectrometry (UPLC-MS) method to quantify 8 ARs (brodifacoum, bromadiolone, chlorophacinone, coumachlor, dicoumarol, difethialone, diphacinone, warfarin) in a wide range of animal (bovine, canine, chicken, equine, porcine) liver samples, including incurred samples. We further evaluated UPLC-MS in 2 interlaboratory comparison (ILC) studies; one an ILC exercise (ICE), the other a proficiency test (PT). The limits of detection of UPLC-MS were 0.3–3.1 ng/g, and the limits of quantification were 0.8–9.4 ng/g. The recoveries obtained using UPLC-MS were 90–115%, and relative SDs were 1.2–13% for each of the 8 ARs for the 50, 500, and 2,000 ng/g spiked liver samples. The overall accuracy from the laboratories participating in the 2 ILC studies (4 and 11 laboratories for ICE and PT studies, respectively) were 86–118%, with relative repeatability SDs of 3.7–11%, relative reproducibility SDs of 7.8–31.2%, and Horwitz ratio values of 0.5–1.5. Via the ILC studies, we verified the accuracy of UPLC-MS for AR analysis in liver matrices and demonstrated that ILC can be utilized to evaluate performance characteristics of analytical methods.
Keywords
Anticoagulant rodenticides (ARs) are used to control rodent populations.16,18,19,31 Poisoning of non-target species of animals, particularly domesticated animals, poultry, and pets, can occur by accidentally consuming commercial formulations for rodent control.14,15,20,30 Malicious adulterations or baiting have also been reported.6,23,25 A robust method for the determination of ARs in animal tissues is important for animal postmortem diagnostic and forensic purposes. Liquid chromatographic methods have been reported for the analysis of ARs in animal tissues.7,8,13,17,29 Analytical methods for determination of ARs in biological samples have been reviewed. 9 An ultra-performance liquid chromatography coupled with mass spectrometry (UPLC-MS) method 24 has been developed by the University of Kentucky Veterinary Diagnostic Laboratory (UK-VDL), and the method has been tested successfully under anonymized conditions by the originating laboratory and a second laboratory participating in the Veterinary Laboratory Investigation and Response Network (Vet-LIRN). The validation was performed using triple-quadrupole mass spectrometry, and anonymized samples were tested using an Orbitrap mass analyzer. 24 The method involved using 10% methanol in acetonitrile (v,v) extraction, followed by a dispersive solid-phase extraction (dSPE) clean-up with magnesium sulfate, Florisil, alumina B, and primary-secondary amine (PSA; 175, 100, 50, 50 mg, respectively) prior to UPLC-MS analysis.
We further evaluated the method reported by the UK-VDL 24 using an Orbitrap mass analyzer operating in full-scan MS with data-dependent acquisition (dd-MS 2 ). We validated the method for AR quantification in liver samples from a wider range of animal species, including bovine, canine, chicken, equine, and porcine species. In addition, the method was recommended to laboratories participating in 2 interlaboratory comparison (ILC) studies; one an ILC exercise (ICE) organized by Vet-LIRN (https://www.fda.gov/animal-veterinary/science-research/veterinary-laboratory-investigation-and-response-network), and the other a proficiency test (PT) organized by the Food Emergency Response Network (FERN, https://www.fernlab.org/). The ICE was designed to provide a safe and structured way of evaluating the utility of potential methods without grading the performance of participants. 21 The PT was designed to evaluate the performance of participants. 12 For both ICE and PT, the procedures for preparing samples, shipping samples, submitting results, and homogeneity and stability analyses all followed the International Organization for Standardization ISO/IEC 17043:2010 standard. A total of 14 analysts from 13 laboratories participated in the ICE; 23 laboratories participated in the PT.
Materials and methods
Liver samples and chemicals
We purchased bovine, chicken, and porcine liver samples from local grocery stores in Chicago and the surrounding area, and verified them to be free of detectable ARs through analysis. We obtained incurred canine and equine liver samples, as well as blank canine and equine liver samples used for in-house evaluation, recovery studies, and for the preparation of ILC samples, from the Veterinary Diagnostic Laboratory of the College of Veterinary Medicine, Iowa State University (Ames, IA, USA), as part of its animal postmortem diagnostic program. All liver samples were stored at ≤ −25°C until use.
We purchased analytical standards of coumachlor and dicoumarol (Sigma-Aldrich), and obtained brodifacoum, bromadiolone, chlorophacinone, difethialone, diphacinone, and warfarin standards from the U.S. Environmental Protection Agency National Pesticides Standard Repository (https://www.epa.gov/pesticide-analytical-methods/national-pesticide-standard-repository). LCMS-grade acetonitrile, methanol, water, ammonium acetate, and HPLC-grade chloroform (Optima; Thermo Fisher), ammonium hydroxide (28% in water; Sigma-Aldrich), and syringe filters (0.22-µm polytetrafluoroethylene [PTFE], 13-mm diameter; MicroSolv Technologies) were purchased. The dSPE clean-up kits containing anhydrous magnesium sulfate (175 mg), Florisil PR (100 mg), alumina basic (50 mg), and PSA (50 mg) were purchased (United Chemical Technologies).
Preparation of analytical standards
Individual AR stock solutions (1,000 µg/mL) were prepared by accurately weighing 25 mg of each compound and dissolving in 25 mL of methanol (bromadiolone, coumachlor, warfarin), acetone (brodifacoum, chlorophacinone, difethialone, diphacinone), or chloroform (dicoumarol) in volumetric flasks. Stock solutions were stored at ≤ −25°C and stable for 12 mo. Intermediate standard solutions containing 50 µg/mL of each AR were prepared by diluting the individual stock solutions with methanol in 25-mL volumetric flasks. Further dilutions with methanol were conducted to obtain concentrations of 1 and 2.5 µg/mL. Three standard mixtures (1, 2.5, and 50 µg/mL) containing 8 rodenticides were used for preparing calibration standards or recovery studies. Spike solutions for preparation of ILC samples were prepared in 25-mL volumetric flasks by diluting the respective AR stock solutions with methanol.
In-house validation of the UPLC-MS method
Instrumentation and analysis
The AR analysis was performed using a UPLC-MS method reported by the UK-VDL. 24 A Dionex UltiMate 3000 UHPLC coupled with a Q Exactive mass spectrometer (Orbitrap; Thermo Fisher) was used. The liquid chromatographic separation was performed on an Accucore C18 HPLC column (100 × 2.1-mm, 2.6-µm particle size; Thermo Fisher) with an injection volume of 1 µL. A gradient mode was used for separating the ARs at 25°C with a flow rate of 0.3 mL/min starting with 60% of mobile phase A (0.01 M ammonium acetate in water, pH 9) and 40% mobile phase B (methanol) for 1 min to 57% B at 9 min, to 77% B at 15 min, to 81% B at 18 min, to 95% B at 18.5 min, and then held for 3 min, followed by re-equilibration for 3.5 min, with a total run time of 25 min. The column eluent was diverted to waste for the first 1.2 min before entering the Orbitrap mass analyzer. The system was equipped with a heated electrospray ionization (ESI) interface. The ESI was operated in negative mode with each run comprised of a full MS scan (70–800 m/z) followed by data-dependent acquisition (DDA) with time segment and normalized collision energy (NCE) using retention windows of 0.6 min. The sheath gas (N2) and auxiliary gas (N2) flow rates were set at 35 and 10 arbitrary units, respectively. The source heater and capillary temperatures were set at 320°C and 150°C, respectively. The spray voltage was set at 2.5 kV.
The full scans were acquired using the Orbitrap analyzer with a resolution of 70,000 FWHM at 200 m/z. The automatic gain control was set at 1 × 10⁶ arbitrary units, and the maximum injection time was set at 200 ms. The DDA experiment with a resolution of 17,500 FWHM, an isolation window of 4 m/z, and maximum injection time of 200 ms was performed with an inclusion list containing the 8 ARs (Table 1). The precursor ions (exact masses of [M-H]–) for each AR were calculated based on the molecular formula using Xcalibur 2.2 (Thermo Fisher). The expected retention times and fragment ions for each AR were determined by analyzing individual standards (1 µg/mL in 60% mobile phase A/40% B, v/v).
Data-dependent acquisition mode (dd-MS 2 ) parameters used to analyze anticoagulant rodenticides, including retention times, precursor and fragment ions, and normalized collision energies.
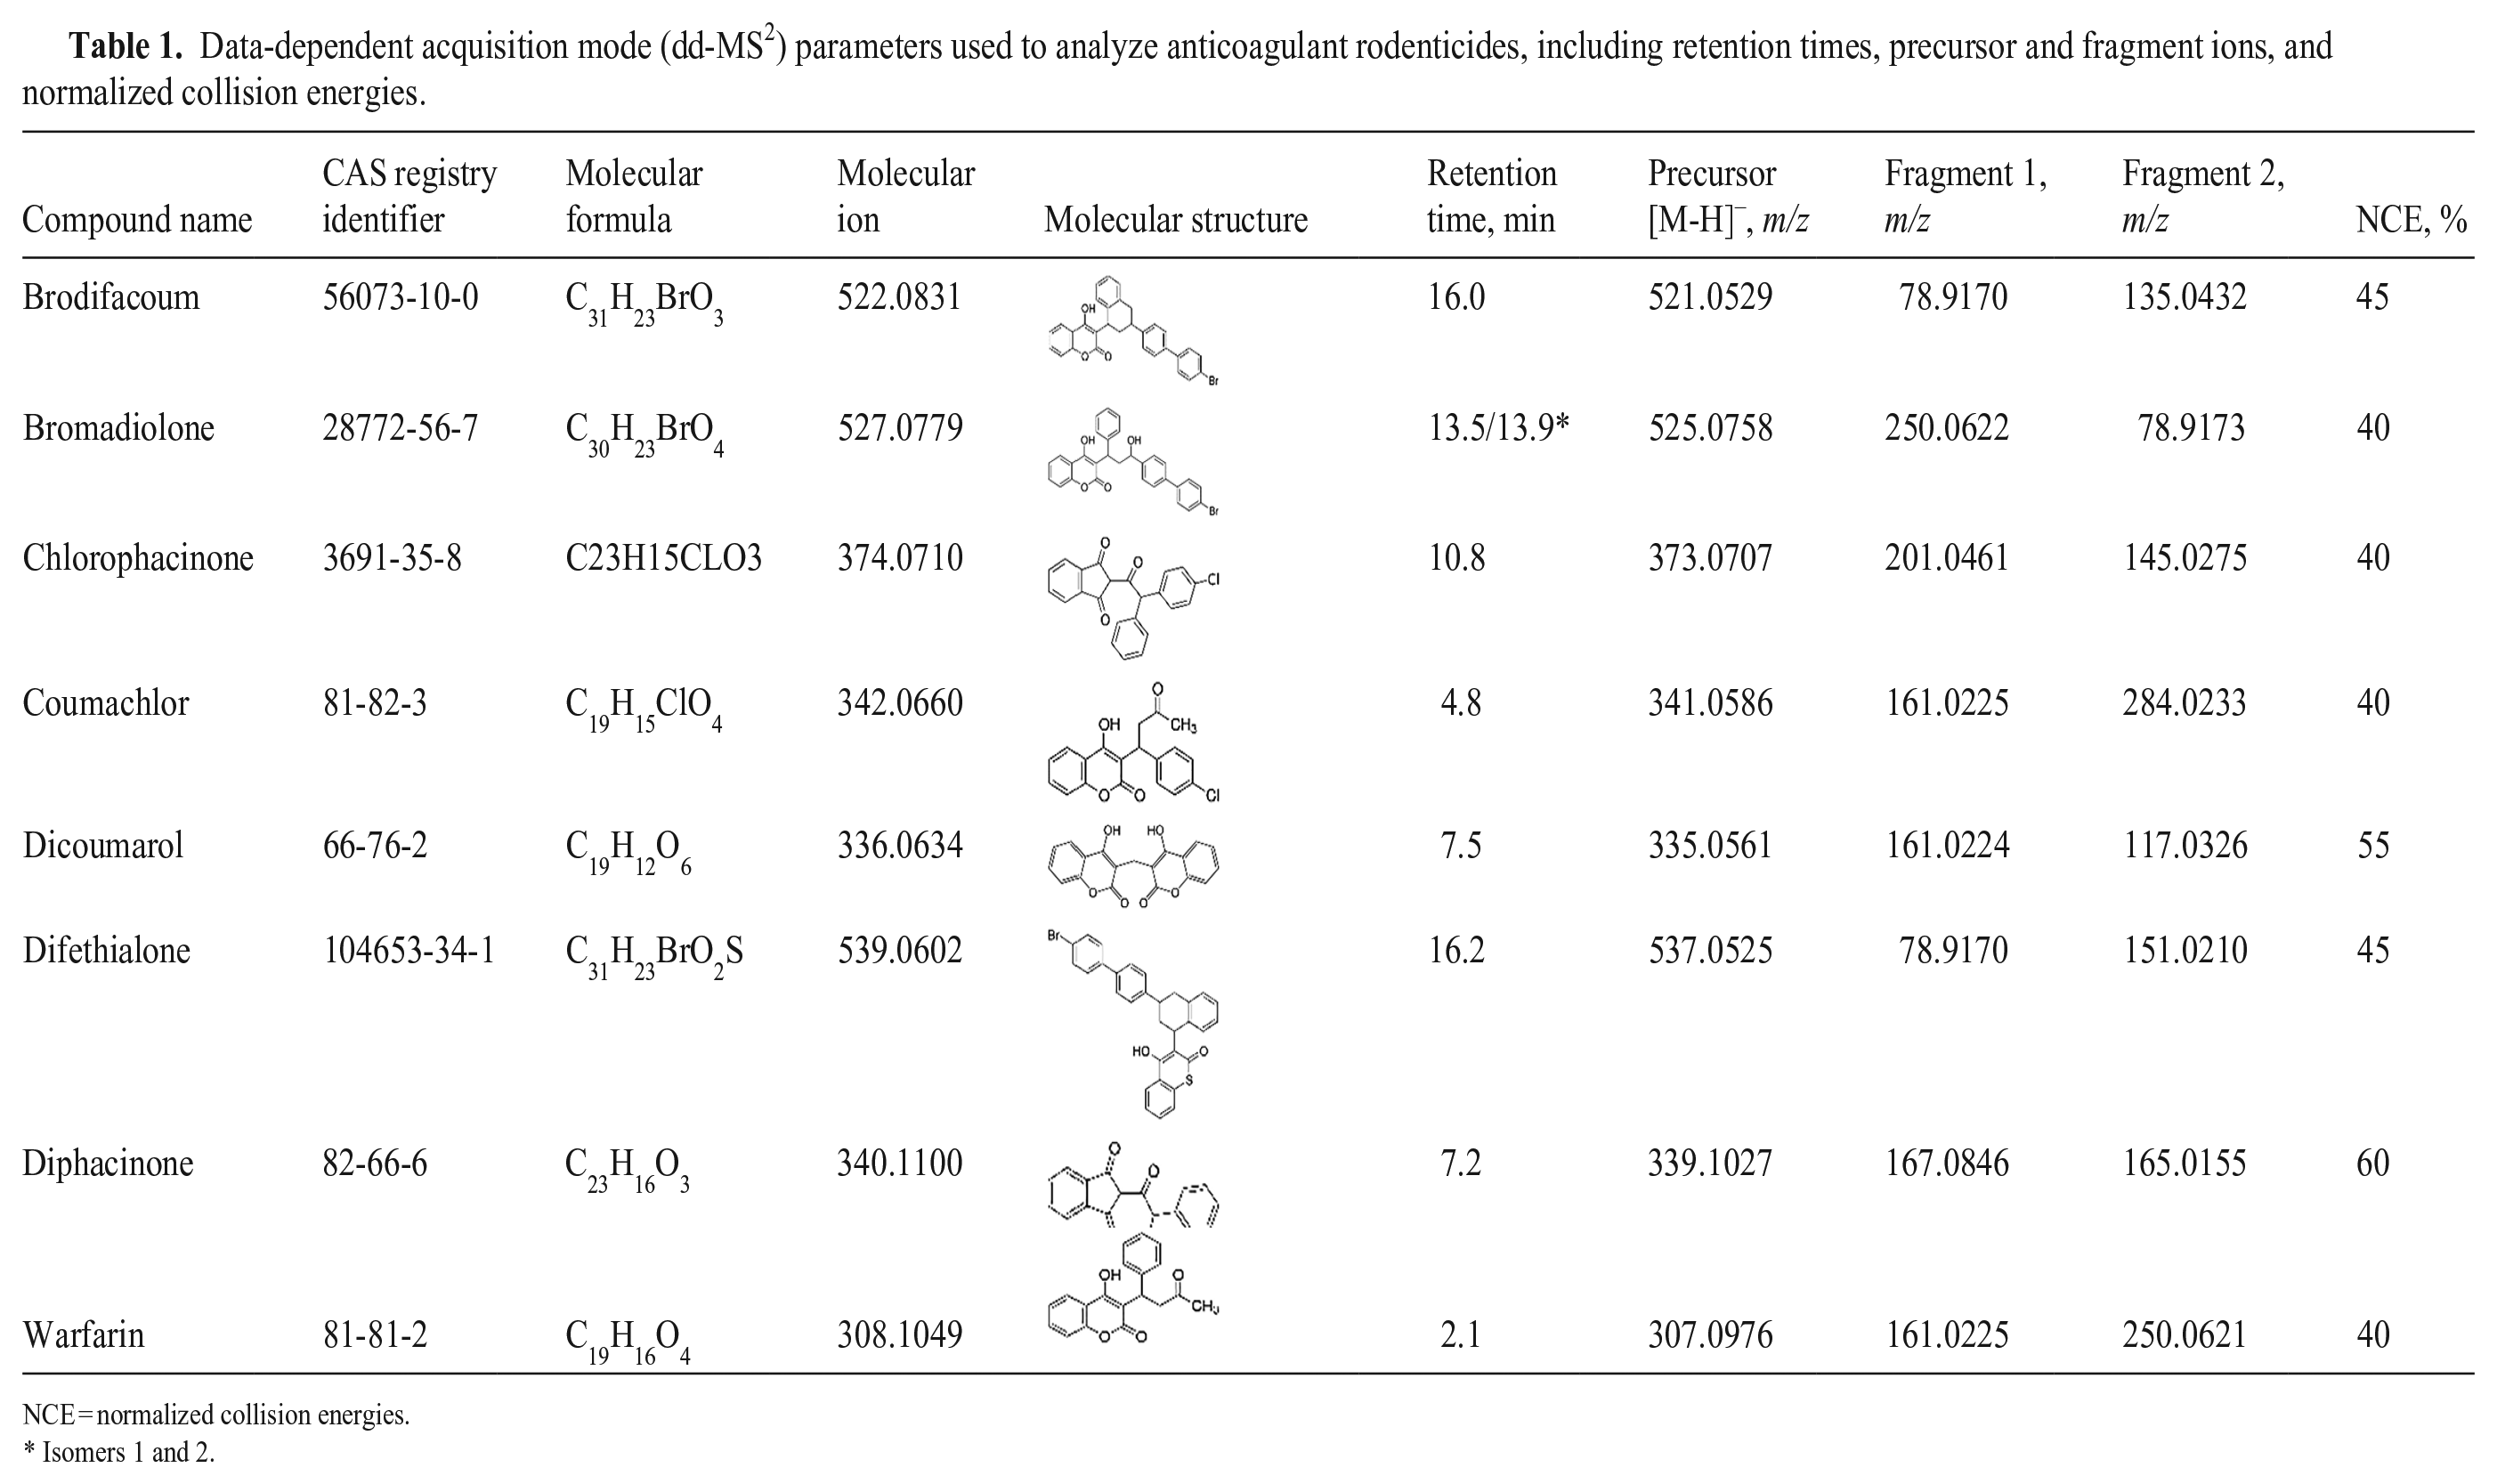
NCE = normalized collision energies.
Isomers 1 and 2.
The precursor ions from the full scans with mass accuracy of ≤ 5 ppm were used to quantify AR concentrations in the study using Xcalibur 2.2. Peak area response for each AR was plotted as a function of AR concentration, and regression parameters for a linear trendline fit were calculated without weighting using the Xcalibur software. Determined sample concentrations were calculated using the peak area response of the analyte and the appropriate regression parameters. The DDA (dd-MS 2 data) was used for confirmation. AR identifications were performed based on retention times (± 2.5%), mass accuracy of precursor ions [M-H]– (≤ 5 ppm mass accuracy), and the presence of the fragment ions (≤ 10 ppm mass accuracy) using Xcalibur Qual Browser (Thermo Fisher).
Sample preparation
We adapted a previously reported sample preparation procedure. 24 Chopped and homogenized liver samples (1.0 ± 0.05 g) were transferred to 50-mL polypropylene centrifuge tubes, and an aliquot of 6 mL of extraction solution containing 10% methanol in acetonitrile (v/v) was added to each sample, followed by 10 s vortex and 5 min pulverizing (Geno/Grinder; Spex SamplePrep) at 650 rpm. Samples were then shaken for 30 min (Vari-Mix platform rocker; Thermo Fisher) at a setting of 30, followed by centrifugation at 829 × g for 5 min. The resulting supernatants were further processed using dSPE.
An aliquot of supernatant (5 mL) was transferred to a 15-mL centrifuge tube containing anhydrous magnesium sulfate (175 mg), Florisil PR (100 mg), alumina basic (50 mg), and primary-secondary amine (PSA, 50 mg). The mixture was vortexed for 10 s, then shaken for 30 min followed by centrifugation at 829 × g for 5 min. The cleaned liver extract (4 mL) was carefully transferred to a clean 15-mL centrifuge tube and evaporated to dryness at 45°C under a gentle stream of nitrogen using a nitrogen evaporator (N-Evap; Organomation). The resultant residue was dissolved in 1 mL of methanol by vortexing for 10 s followed by sonication for 5 min prior to filtration through a 0.22-µm (13-mm diameter) PTFE filter (MicroSolv Technology) into a 2-mL amber glass vial for analysis.
Determination of matrix effect on analysis of ARs in liver samples
To determine the effect of liver matrix on analysis of ARs, standard curves for each AR were generated for solvent only (methanol) as well as in all 5 liver matrices (bovine, chicken, canine, equine, porcine). Three types of calibration standards were prepared: solvent-only, preprocess matrix-matched, and postprocess matrix-matched. The preprocess matrix-matched calibration standards were prepared by adding appropriate amounts of standard solutions (1, 2.5, or 50 µg/mL) to 1.0 ± 0.05 g of liver sample to achieve spike concentrations of 12.5, 25, 50, 75, 125, 500, 1,000, or 2,500 ng/g, followed by sample preparation as described previously. The matrix blanks were prepared by extracting blank matrices. The solvent-only and postprocess matrix-matched calibration standards were obtained by diluting the 1, 2.5, or 50 µg/mL standard solutions with methanol or matrix blanks to achieve working concentrations of 8.33, 16.7, 33.3, 50, 83.3, 333, 667, and 1,670 ng/mL, equivalent to the respective preprocess matrix-matched calibration standards after considering the dilution factor of 1.5.
Response of the postprocess matrix-matched standard was compared to the solvent-only standard to determine the matrix effect (signal suppression or enhancement) in the ion source during MS analysis. A slope ratio of 1.00 indicates no matrix effect, a ratio of < 1 indicates signal suppression, and a ratio of > 1 indicates signal enhancement.3,4 Similarly, the responses of the preprocess and postprocess matrix-matched standards were compared to determine analyte loss during the sample preparation (analyte extraction and clean-up). A slope ratio of 1.0 indicates no loss was observed; a slope ratio < 1 indicates some loss. The percentage of loss was calculated as (1 – slope ratio) × 100%.3,4
Determination of recovery on spiked samples
The recovery studies for the determination of ARs were conducted using liver samples spiked with 50, 500, and 2,000 ng/g of each AR, each with 5 replicates. The spiking procedure included adding 20 µL of 2.5 µg/mL, or 10 or 40 µL of 50 µg/mL AR spike standard solutions to 1.0 ± 0.05 g blank liver matrices (50-mL polypropylene centrifuge tubes) to achieve the respective spike levels. A steel ball was added to each tube, and the spiked samples were thoroughly vortexed, followed by homogenization (Geno/Grinder) at 650 rpm for 5 min twice, to allow thorough mixing of ARs in the matrices. The spiked samples were extracted using the sample preparation procedures above, and analyzed using UPLC-MS.
Determination of limit of detection and limit of quantification
Eight liver samples from each species spiked with 8 ARs, each at a concentration of 12.5 ng/g, were analyzed using UPLC-MS, and the results were used to determine the limit of detection (LOD) and limit of quantification (LOQ). The peak area response of each AR was plotted against the corresponding preprocessed matrix-matched standard curve, and the concentration was calculated. The LOD and LOQ were calculated according to the U.S. Environmental Protection Agency (EPA) procedure used to determine the method LOQ. 5 The SDs of the responses were calculated from the 8 replicate spiked liver samples for each AR. The LOD was calculated at 3 × SD [critical t0.010 = 2.998 at degree of freedom (df) = 7] × dilution factor, 5 and the LOQ was calculated at 3 × LOD.
Interlaboratory comparison studies
Preparation of ILC samples
Twelve samples (5 canine and 7 equine liver samples) were prepared for the ICE; 8 bovine liver samples were prepared for the PT. The ILC samples were prepared by adding three, 4-mL aliquots of the respective spike solution of AR to 600 g of homogenized liver samples using an industrial food processor (Robot Coupe) to achieve spike levels of low (100–150 and 230–275 ng/g), medium (450–530 ng/g), and high (1,900–2,000 ng/g) concentrations of each AR in liver matrix. The liver sample was further homogenized for 30 s at low speed after each 4-mL addition and for 2 min after the final addition. The homogenized, spiked liver samples were subdivided into 15-mL plastic bottles (15 g each), and stored at ≤ −25°C until shipping.
All ILC samples were anonymized and assigned randomly to the participating laboratories to prevent collusion between participants and to maintain the integrity of the reported results. Anonymized replicate samples (duplicates or triplicates) were provided for each spike level. ILC samples were shipped overnight to participating laboratories on dry ice. Along with the ILC samples, a standard solution containing the 8 ARs (10 µg/mL in methanol) was provided to the participants, to be used for identification and quantification. Blank matrix/matrices were also provided for preparing matrix-matched standards to generate calibration curves to quantify the identified compounds. The number of samples provided (12 for ICE; 8 for PT) were consistent with the respective network program requirement. Instructions for sample handling, analysis, and result-reporting procedures were provided to the participating laboratories prior to the ILC. The UPLC-MS method 24 was recommended for use to the participating laboratories; however, alternative or equivalent methods were accepted. When using the UPLC-MS method, the participating laboratories were required to follow the sample preparation procedures and UPLC conditions; however, no limitation to the type of MS analyzer platform was specified, as long as the participating laboratories achieved a sensitivity (LOQ ≤ 50 ppb) similar to the published method. 24
Homogeneity and stability studies
The homogeneity and stability studies of the ILC samples were conducted to ensure that every participant received comparable samples and that the samples sent to the participants were appropriate for testing. The homogeneity and stability studies were performed according to ISO/IEC 17043:2010 standards, 12 and the statistical analyses were performed according to ISO 13528:2015 standards. 11 For the homogeneity study, samples (10 for ICE; 5 for PT) of each spike level in the final package form were randomly selected throughout the sub-sampling process, and the concentrations of the 8 ARs were determined in duplicate for each test portion using UPLC-MS. For the stability study, 3 sub-samples of each spike level in the final package form were randomly selected, stored at ≤ −25°C, and tested 1 wk after the shipment of the ILC samples to participating laboratories.
Statistical analysis and evaluation of method performance
Results obtained from participating laboratories that used the recommended method 24 from both ICE and PT were statistically analyzed according to ISO 5725-2 10 and used for evaluation of the accuracy and precision of the method. The accuracy of the method was calculated using consensus values of the 3 spike levels derived from the participants for each of the 8 ARs. Precision was measured using relative repeatability SD (%RSDr, within-laboratory variation) and relative reproducibility SD (%RSDR, between-laboratory variation). RSDr was calculated using the results of the anonymized replicate samples from each laboratory for each spike level. RSDR was calculated using the mean value of the replicates obtained from the participants for each spike level. The Horwitz ratio (HorRat) values were calculated according to AOAC guidelines for collaborative study of a method of analysis and were used to assess the acceptability of the method. 2
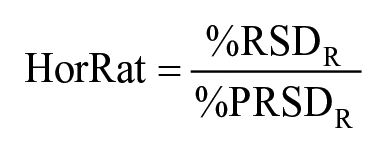
where %RSDR is relative reproducibility SD, %PRSDR is relative predicted reproducibility SD, % PRSDR = 2C−0.1505, and C is spike concentration expressed as g/g. A HorRat value should be between 0.5 and 1.5 for a properly performed method. 2
The statistical analysis was performed using ProLab Plus software (QuoData), which was developed for assessing the quality and accuracy of results through ILCs. 22 The mean values were determined according to AOAC International guidelines for collaborative studies to validate characteristics of a method of analysis. 1 Cochran statistics (largest individual within-laboratory variance) and Grubbs tests (with extreme averages) were performed for outlier identification and removal as recommended by AOAC guidelines, using ProLab Plus software. Recoveries and HorRat values were calculated using Excel 2018 (Microsoft).
In addition, student t-test at a confidence level of 95% was conducted and used to determine if there was any significant difference between the results obtained from ICE and PT.
Results and discussion
In-house validation of detection of ARs in liver samples using UPLC-MS
The slope ratios of the postprocess matrix-matched standards over the solvent-only standards obtained for all 8 ARs in the livers of all 5 species were 0.96–1.1 (Suppl. Table 1; Table 2), which indicates little matrix effect for all 8 ARs in dSPE-treated extracts of the 5 liver matrices studied,3,4 except for warfarin in canine liver (1.31). Similar results have been observed in a previous study 24 for equine liver samples spiked at levels of 50, 500, and 2,000 ng/g.
Summary of method validation results for anticoagulant rodenticides in liver by UPLC-MS.
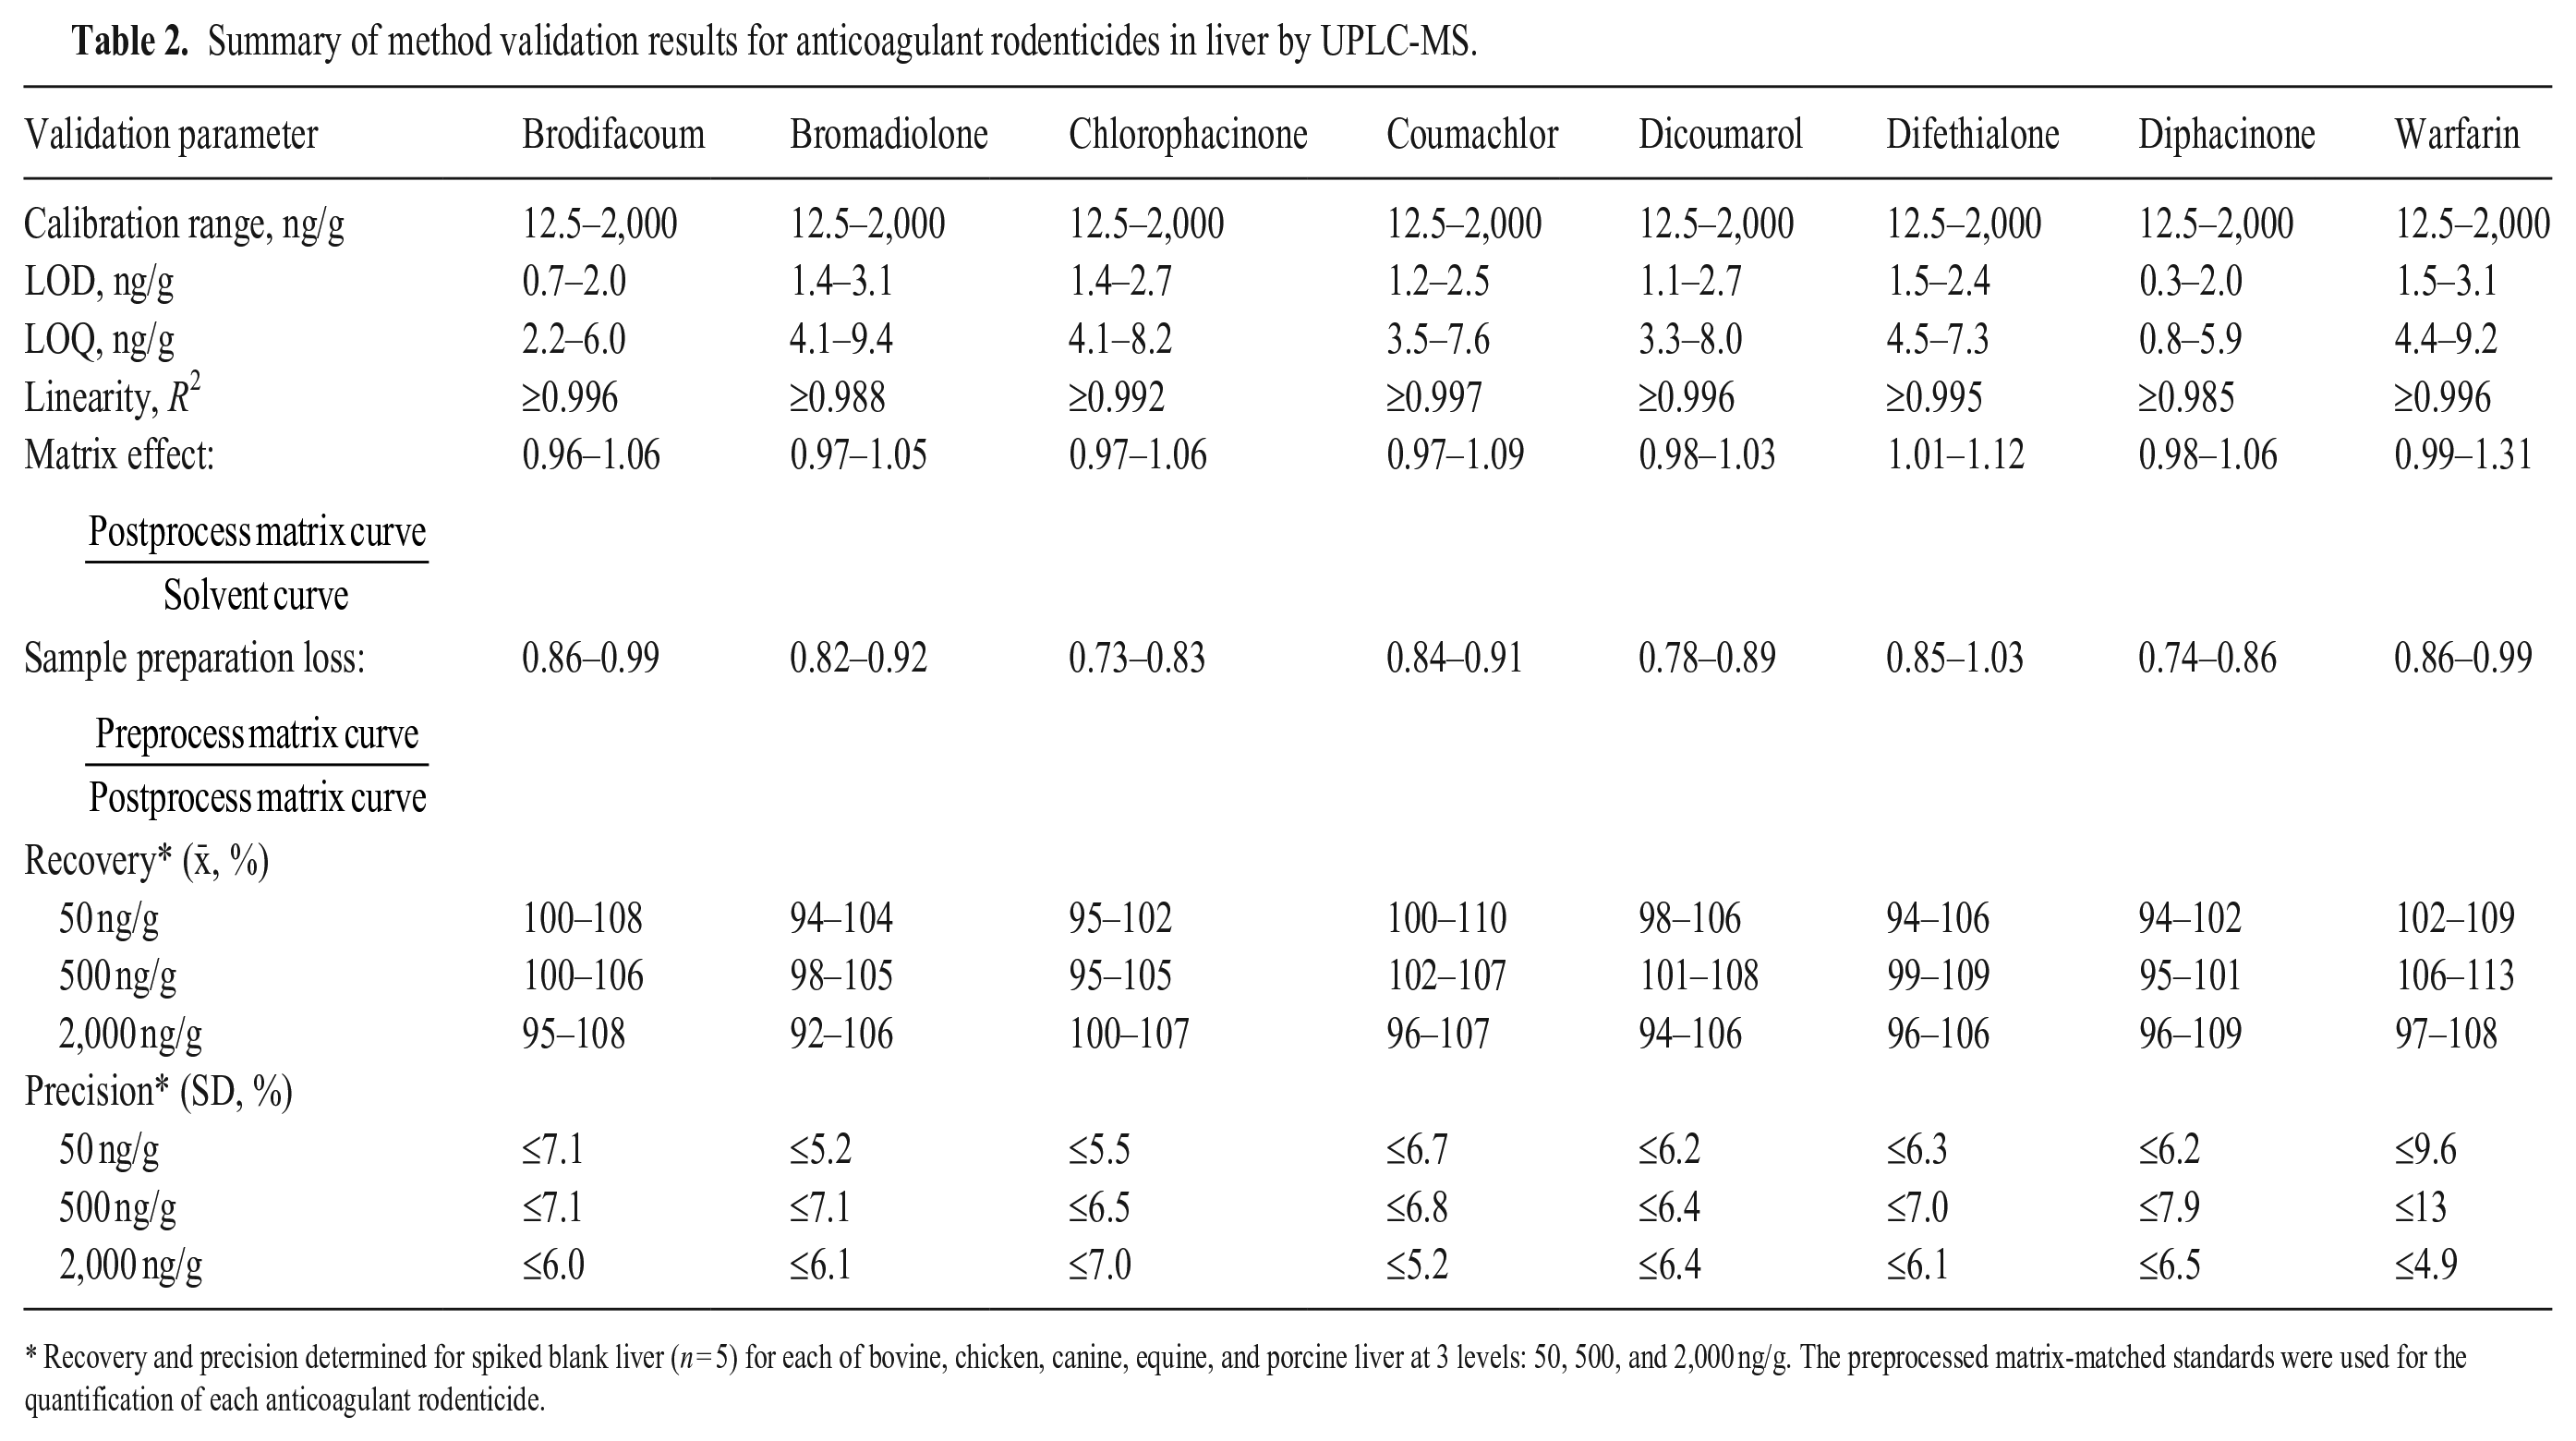
Recovery and precision determined for spiked blank liver (n = 5) for each of bovine, chicken, canine, equine, and porcine liver at 3 levels: 50, 500, and 2,000 ng/g. The preprocessed matrix-matched standards were used for the quantification of each anticoagulant rodenticide.
The slope ratios of the preprocess matrix-matched standards over the postprocess matrix-matched standards obtained (0.73–1.03; Table 2) indicated that there were up to 27% losses of ARs during the sample-preparation process. This AR loss varied with different analytes and matrices, and there may be a general trend for this loss (Suppl. Table 1). The greatest loss across species was in ARs that elute in the middle of the gradient elution program (di- and chlorophacinone, dicoumarol). This trend in losses may be related to the indandione chemical structure of the ARs. A loss of each AR of 29–49% has been reported in equine liver during the sample-preparation process (50, 500, and 2,000 ng/g). 24 The regression coefficients of the 8 ARs in the concentration range were > 0.99 for all 5 (bovine, chicken, canine, equine, porcine) liver matrices studied, indicating good linearity.
We concluded that, to achieve accurate results, preprocess matrix-matched standard curves must be used for quantification of ARs in liver samples to account for analyte loss in sample preparation. We used this approach for all further analyses of ARs in our study. The calibration curve for each analyte met or exceeded the U.S. Department of Health and Human Services’ Food and Drug Administration (FDA) recommendations for bioanalytical methods 27 ; the back-calculated accuracy for calibrants was within ± 15% of nominal concentration and R2 ≥ 0.99.
Quantified using preprocess matrix-matched standard curves, the recoveries for the 8 spiked ARs at all 3 spike levels (50, 500, 2,000 ng/g) in the 5 liver matrices (bovine, chicken, canine, equine, porcine) were 93–113%, with relative SDs typically < 10% (Table 2; Suppl. Table 2).
Using 8 spiked samples for each liver matrix at a concentration of 12.5 ng/g and the preprocess matrix-matched standard curves, the LODs and LOQs obtained for each AR were within 15% of the expected level, with at least one confirmation ion present (Fig. 1; Table 2; Suppl. Table 3), meeting the FDA’s requirements for confirmation of the ARs using exact mass data.26,27 The LODs obtained for the spiked ARs in bovine, chicken, canine, equine, and porcine livers were 0.3–3.1 ng/g, and the LOQs were 0.8–9.4 ng/g.
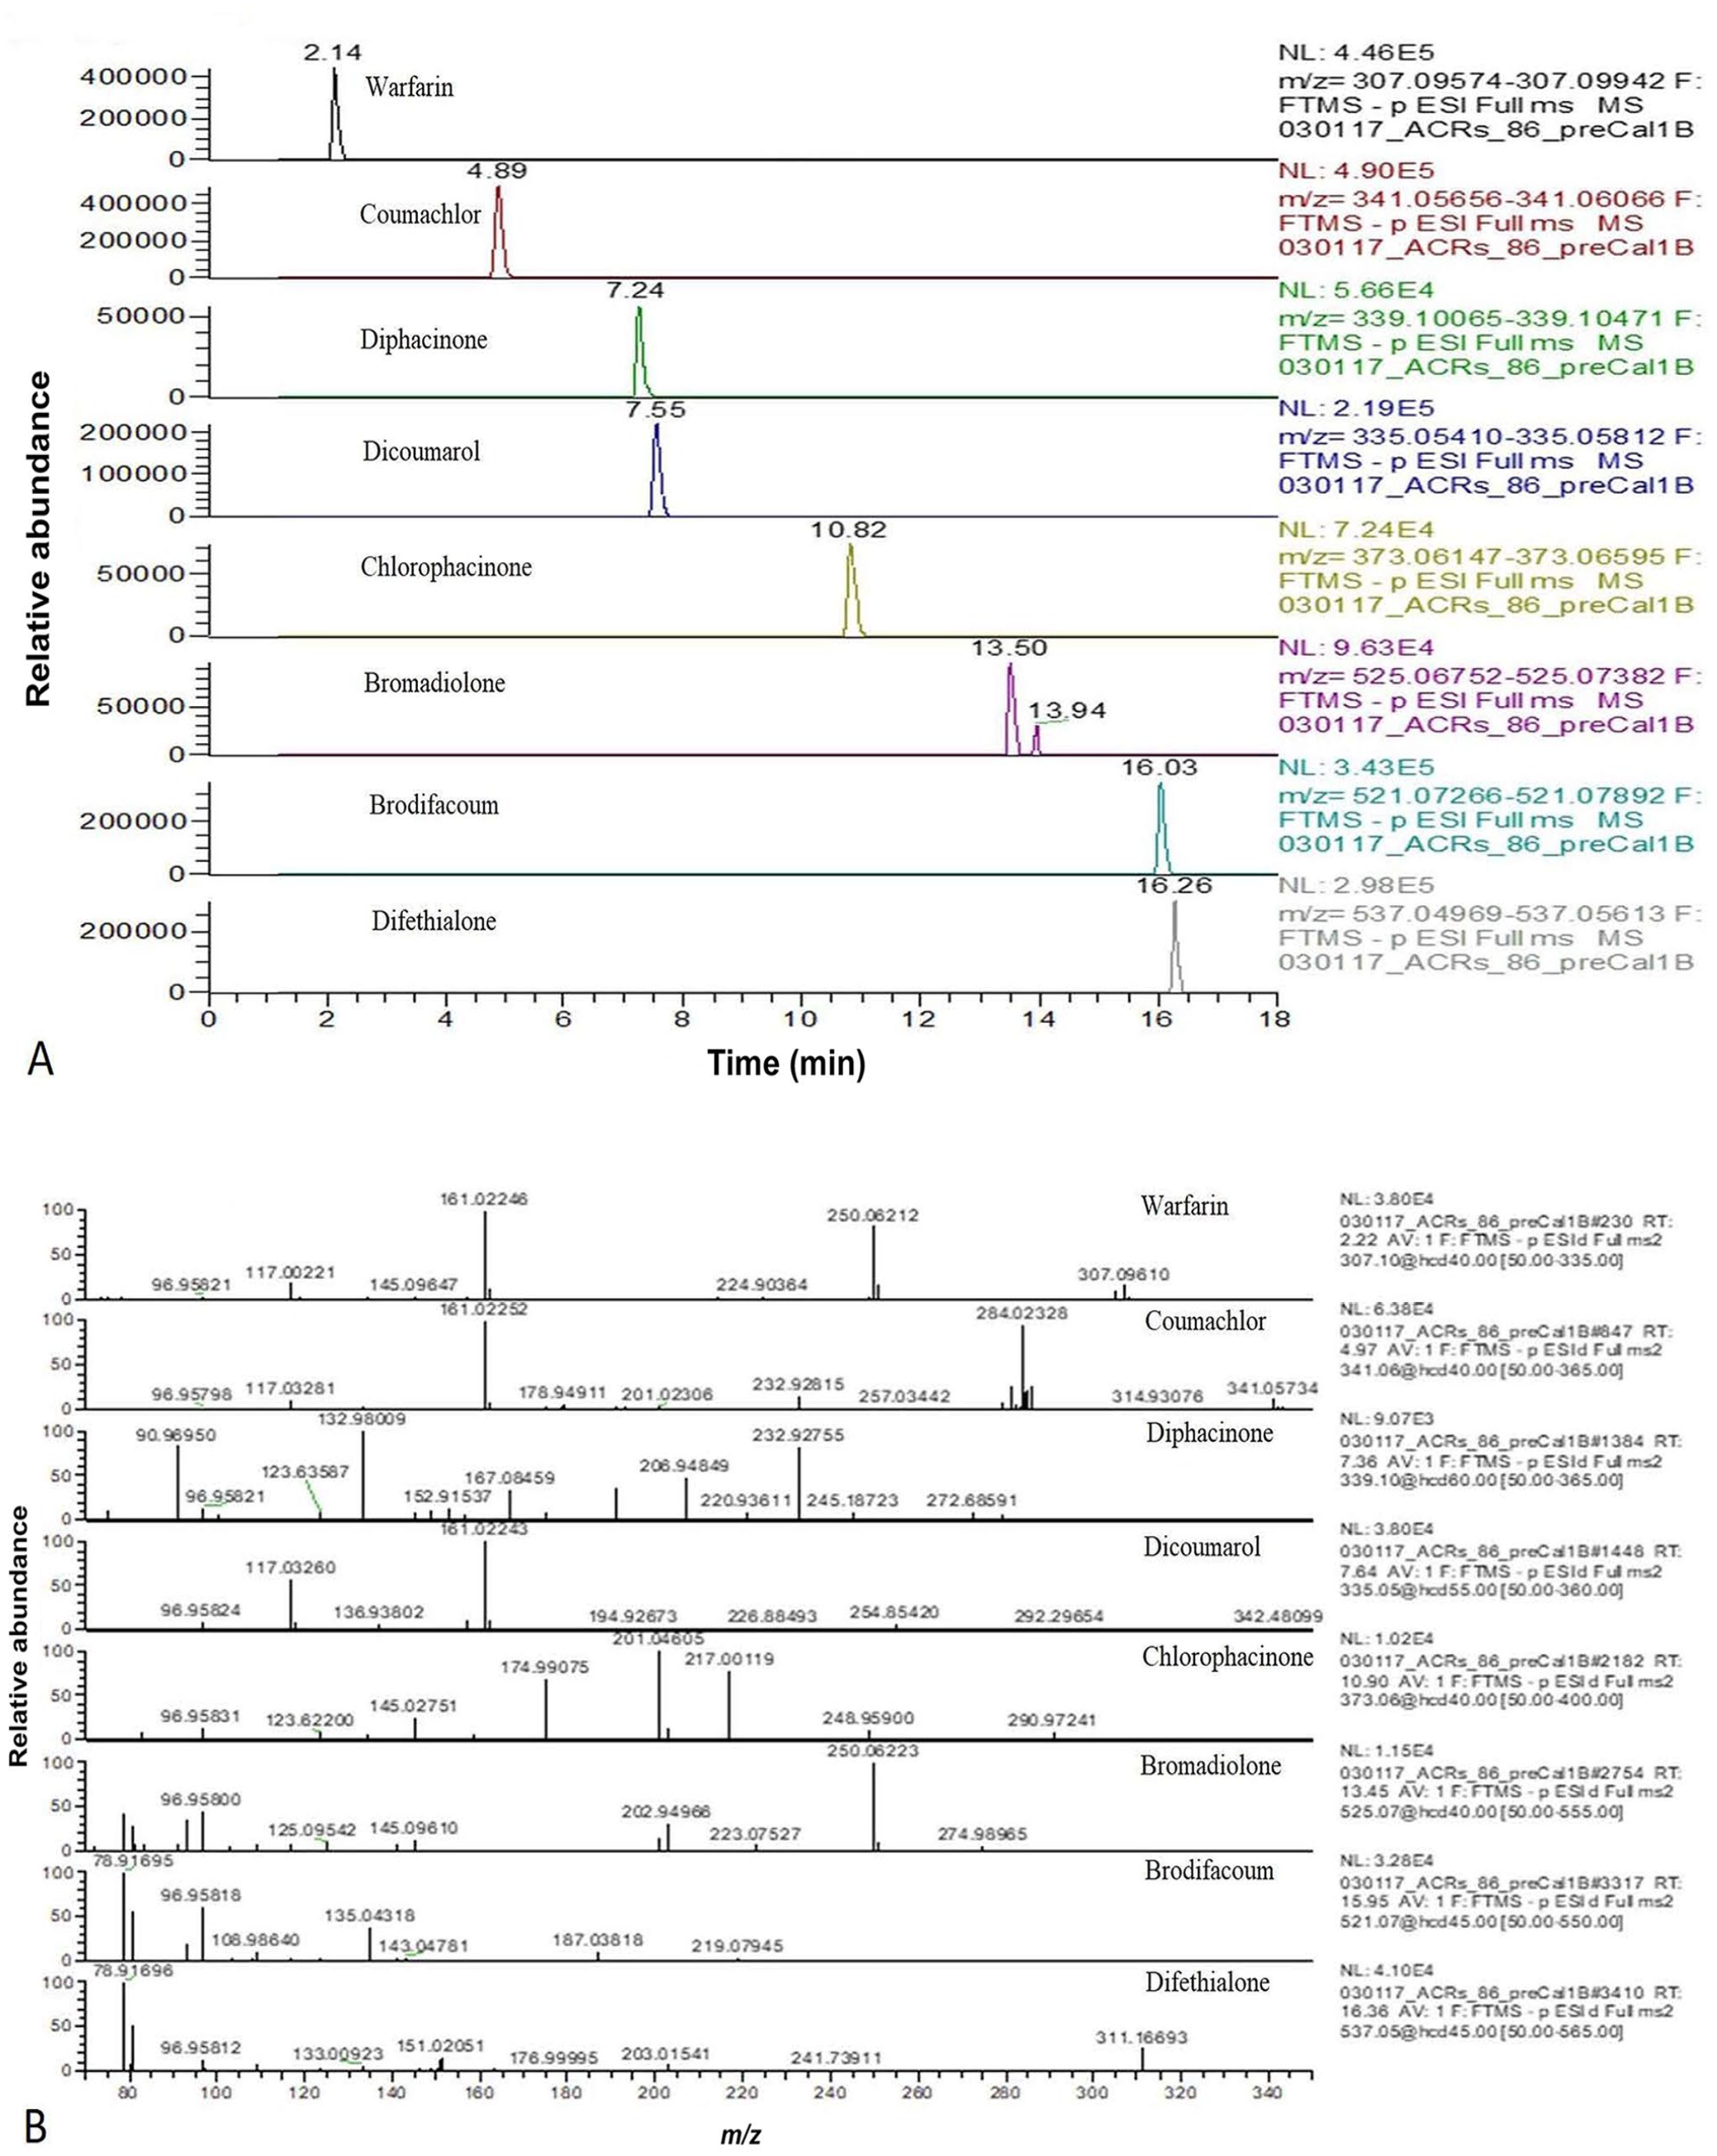
Typical extracted ion chromatograms (EICs) and mass spectrum of 8 anticoagulant rodenticides (ARs)
ARs in incurred liver samples
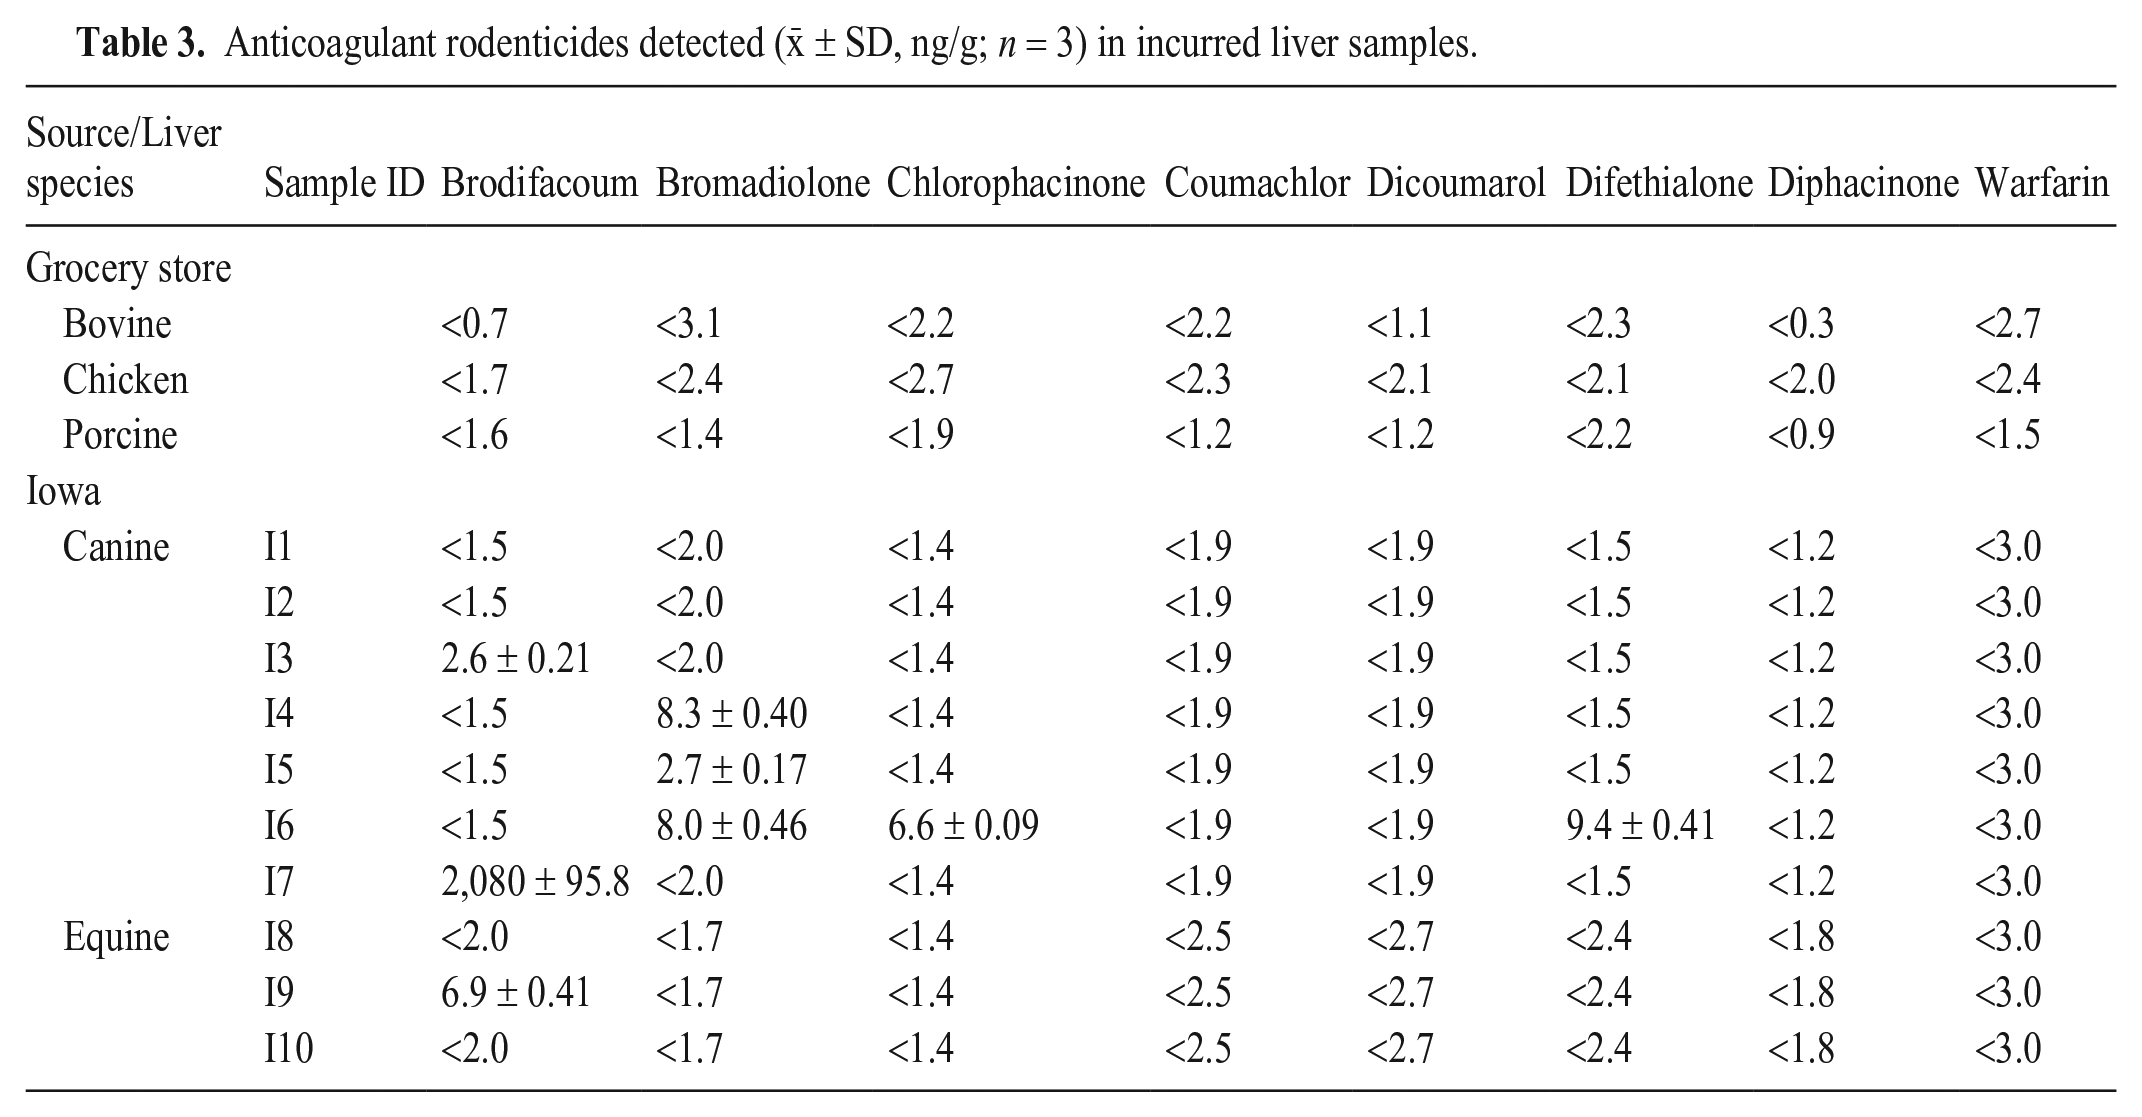
No residues of any of the 8 ARs studied were detected in the bovine, chicken, and porcine liver samples purchased from local grocery stores, nor in 2 of the 7 canine liver samples and 2 of the 3 equine liver samples (Table 3). Only 1 equine and 5 canine liver samples had quantifiable levels of ARs, with 1 canine sample containing multiple ARs (Table 3). Canine samples I3 and I7 contained brodifacoum (2.6 and 2,082 ng/g, respectively), and samples I4 and I5 contained bromadiolone (8.3 and 2.7 ng/g, respectively). Canine sample I6 contained chlorophacinone (6.6 ng/g), bromadiolone (8.0 ng/g), and difethialone (9.4 ng/g). Equine sample I9 contained brodifacoum (6.9 ng/g). Based on these results, the liver samples without any detectable AR residues were used as control blank liver for the in-house evaluation studies and for preparation of the ILC samples.
Anticoagulant rodenticides detected (x̄ ± SD, ng/g; n = 3) in incurred liver samples.
Homogeneity and stability of ILC samples
The mean concentration of each AR from the 10 replicate spiked samples compared to the target concentrations were in the range of 90–120% for all spike levels, with relative within-sample SDs of 2–12% and relative between-sample SDs of 0–3% (Suppl. Tables 4A, 4B). These results were consistent with those obtained during method validation for spiked liver samples. The relative between-sample SDs (0–3%) were lower than the relative within-sample SDs (2–12%, analytical error), indicating that the samples were considered adequately homogeneous. After storage for 1 wk at ≤ −25°C (simulating the shipping time and conditions), the mean recoveries of the ARs were consistent (91–116% of the target concentrations) with those determined in the homogeneity study (90–120%), demonstrating that the ILC samples were stable during the shipping process (Suppl. Tables 4A, 4B).
Method performance evaluation using data obtained from ILC participating laboratories
A total of 14 analysts from 13 Vet-LIRN laboratories (12 U.S. state laboratories, 1 from Canada) participated in the ICE. A total of 23 FERN laboratories participated in the PT, including 11 of the U.S. Department of Agriculture’s Food Safety and Inspection Service (FSIS) and 12 of the FDA. A total of 37 participants submitted results for the 2 ILCs, 14 from the ICE, and 23 from the PT. Four ICE participating laboratories and 11 PT participants used the recommended UPLC-MS method for sample extraction protocol and UPLC parameters, although various MS analyzers were used for MS analysis. The brands of MS analyzers used by the participating laboratories included Thermo Fisher, Agilent, Waters, Sciex, and Applied Biosystems. The collaborating laboratory used a different MS analyzer (Orbitrap mass analyzer, versus the triple-quadrupole MS), and obtained consistent results on anonymized liver samples. 24
The results from the laboratories that used the recommended UPLC-MS method for the analysis of ARs in liver samples were closer to the respective spike levels, and with smaller SDs (Fig. 2). In contrast, laboratories that used other analytical methods reported results farther from the respective spike levels, and with larger SDs. This trend is evident for both the ICE and PT studies, and for all 8 ARs at all 3 spike levels (Fig. 2). These larger variations of results reported by laboratories that used other analytical methods may be the result of the nature of unknown performance of the wider range of non-recommended analytical methods used by these participating laboratories.
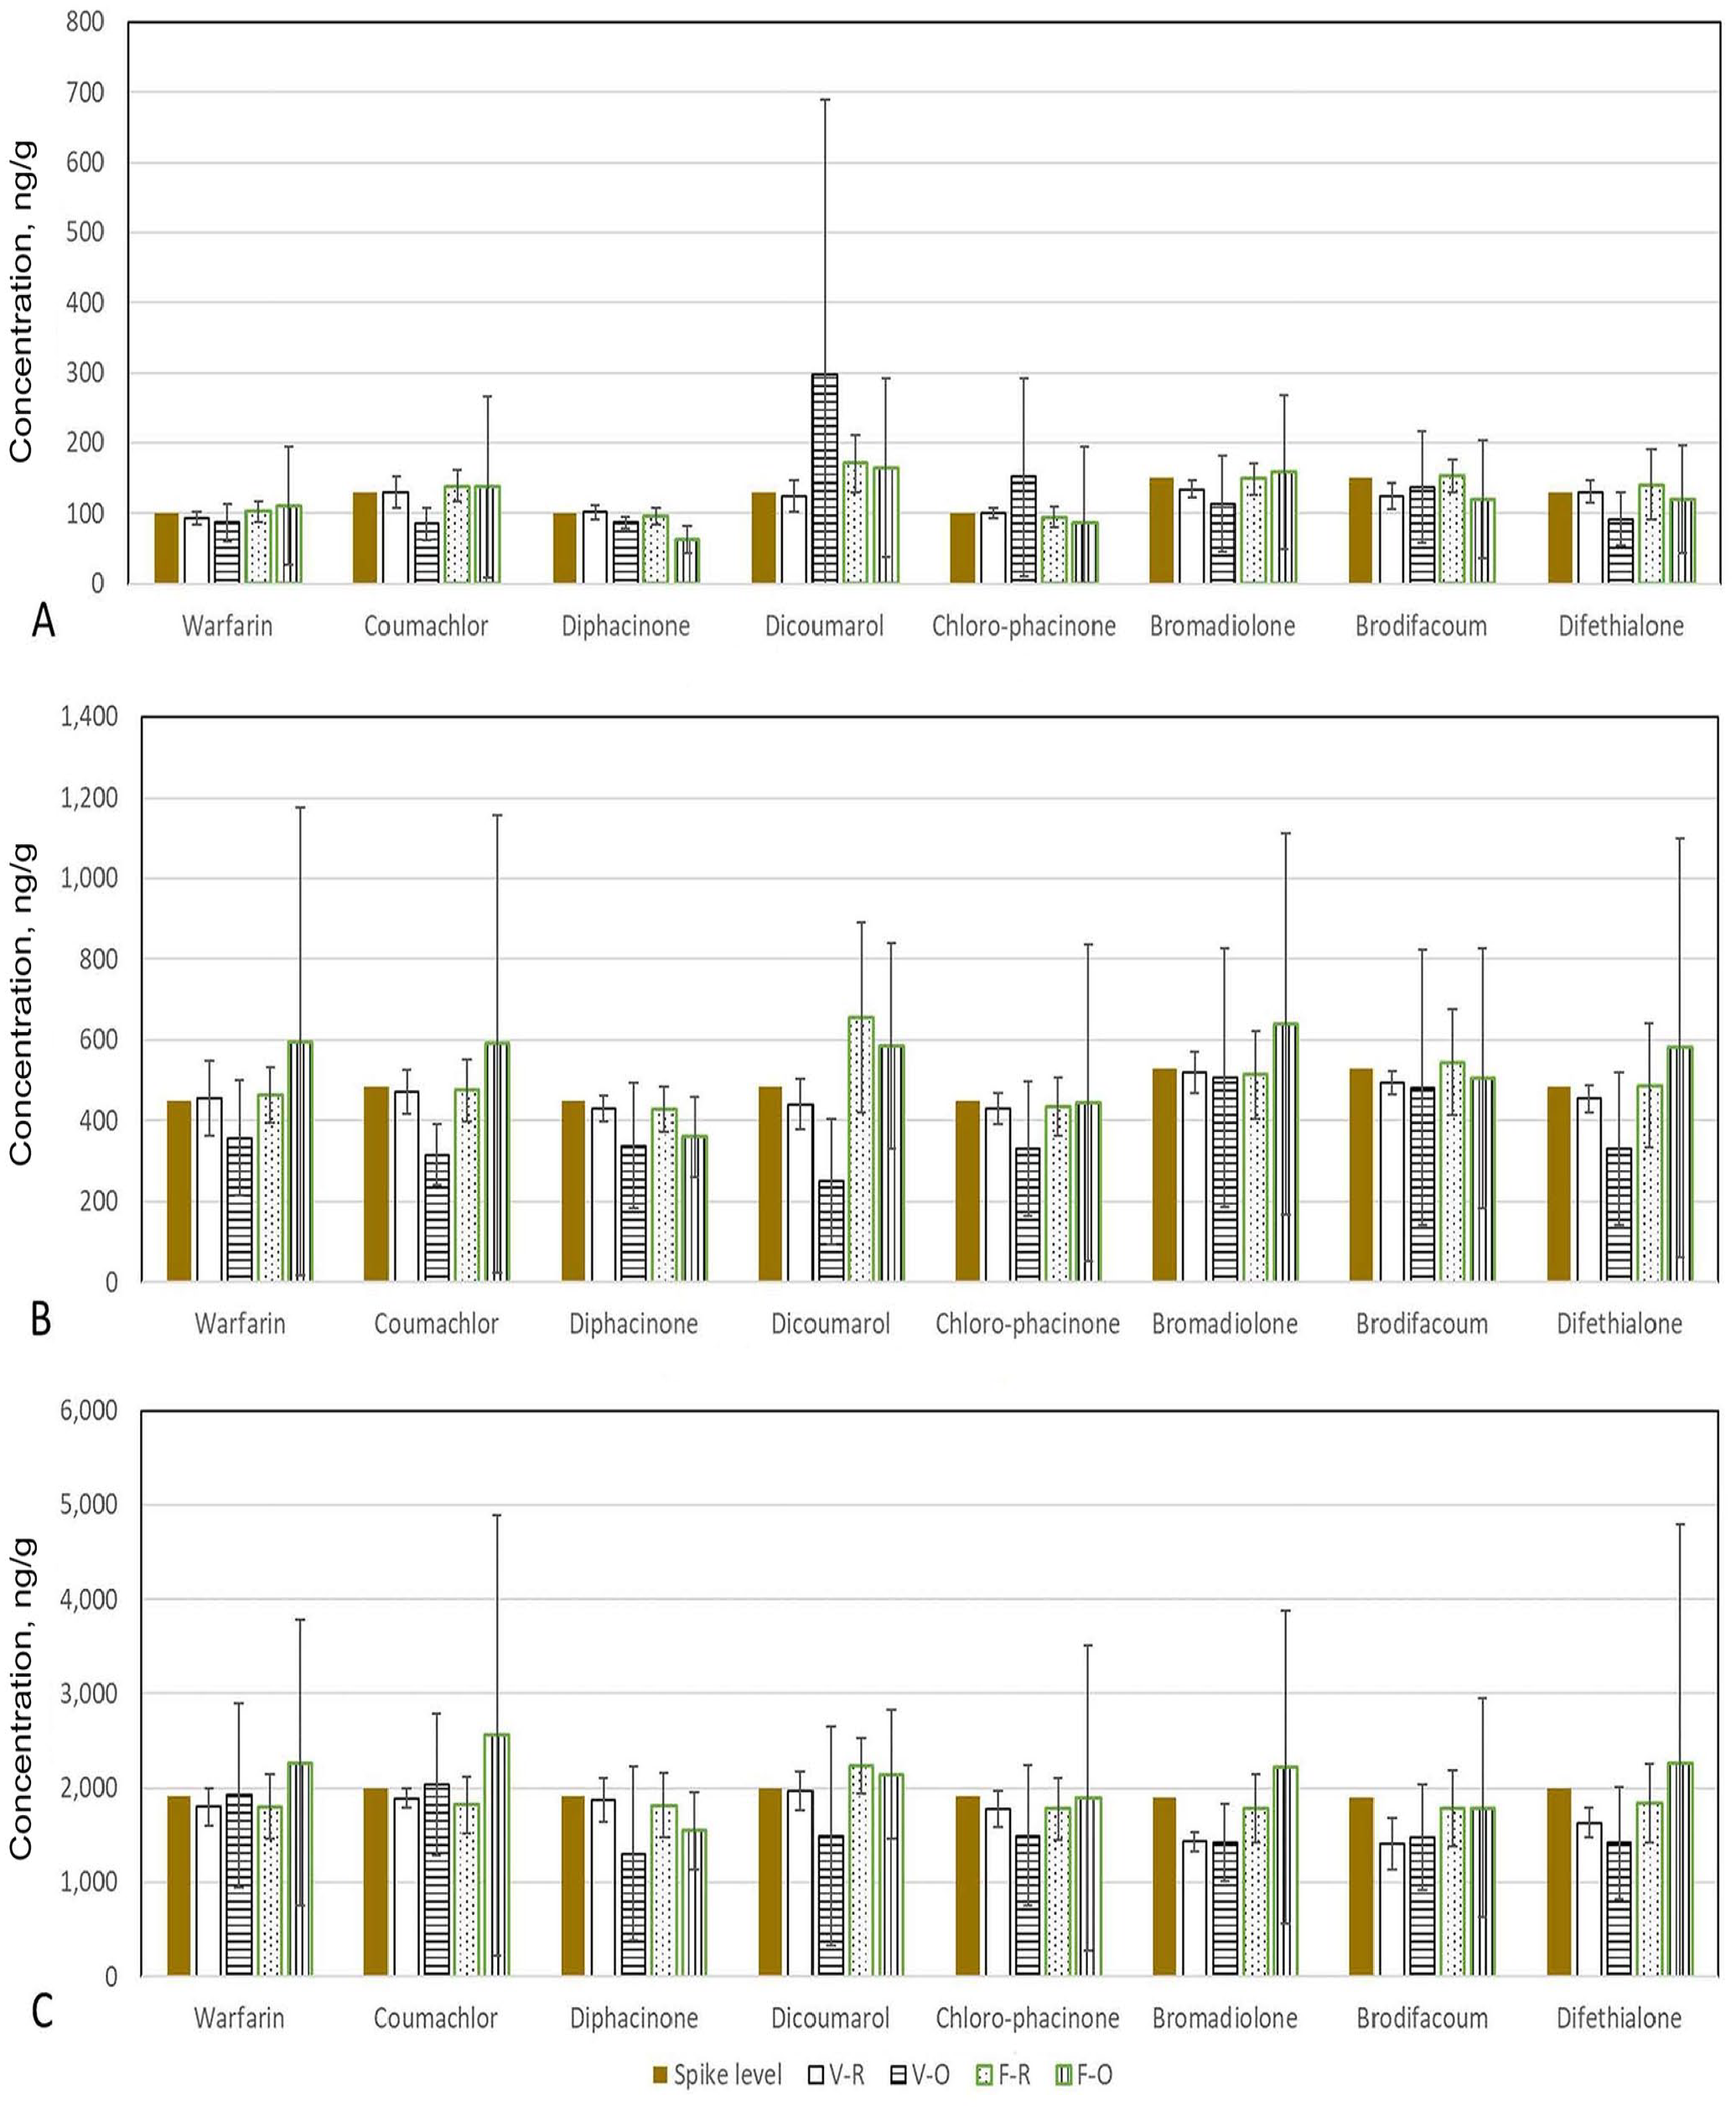
Mean concentrations and SDs of each anticoagulant rodenticide (AR) reported by participating laboratories from both the interlaboratory comparison exercise (V) and proficiency test (F) studies, using either the recommended UPLC-MS method (R), or other methods (O) on liver interlaboratory comparison samples with (
We excluded 6 datasets (from 3 FERN PT laboratories) from the analysis, 3 as a result of not passing the Cochran test (1 × high spike level for warfarin, 1 × medium level for dicoumarol, and 1 × high spike level for brodifacoum) and 3 as a result of not passing the Grubbs test (1 × low-level for chlorophacinone, 1 × difethialone, 1 × mid-level for bromadiolone). No more than one set of data was removed for any AR at a given spike level. The t-test results showed that there was no significant difference (t-values ≤ critical values) between the means obtained for all ARs at all spiked levels, except for dicoumarol spiked at the medium level (t-value > critical value). Therefore, the 2 sets (ICE and PT) of data were combined and further analyzed (Table 4C).
For ICE, the accuracy for all ARs and spike levels was 74–106%, with RSDr of 3.5–11.4% and RSDR of 4.8–20.1% (Table 4A). For PT, the accuracy was 91–132%, with RSDr of 3.8–9.9% and RSDR of 8.5–31.5% (Table 4B). The overall mean accuracy values were 86–118%, with RSDr of 3.7–11% and RSDR of 7.8–31.2% (Table 4C). Although some accuracy values exceeded ± 15% of nominal values (expected for non-anonymized samples in in-house experiments), 27 all accuracy values were considered satisfactory considering conditions of both ILCs’ anonymized analysis and possibly because of slight heterogeneity of test samples.
Summary of statistical parameters obtained from the 4 ICE (interlaboratory comparison exercise) laboratories that used the recommended UPLC-MS method.
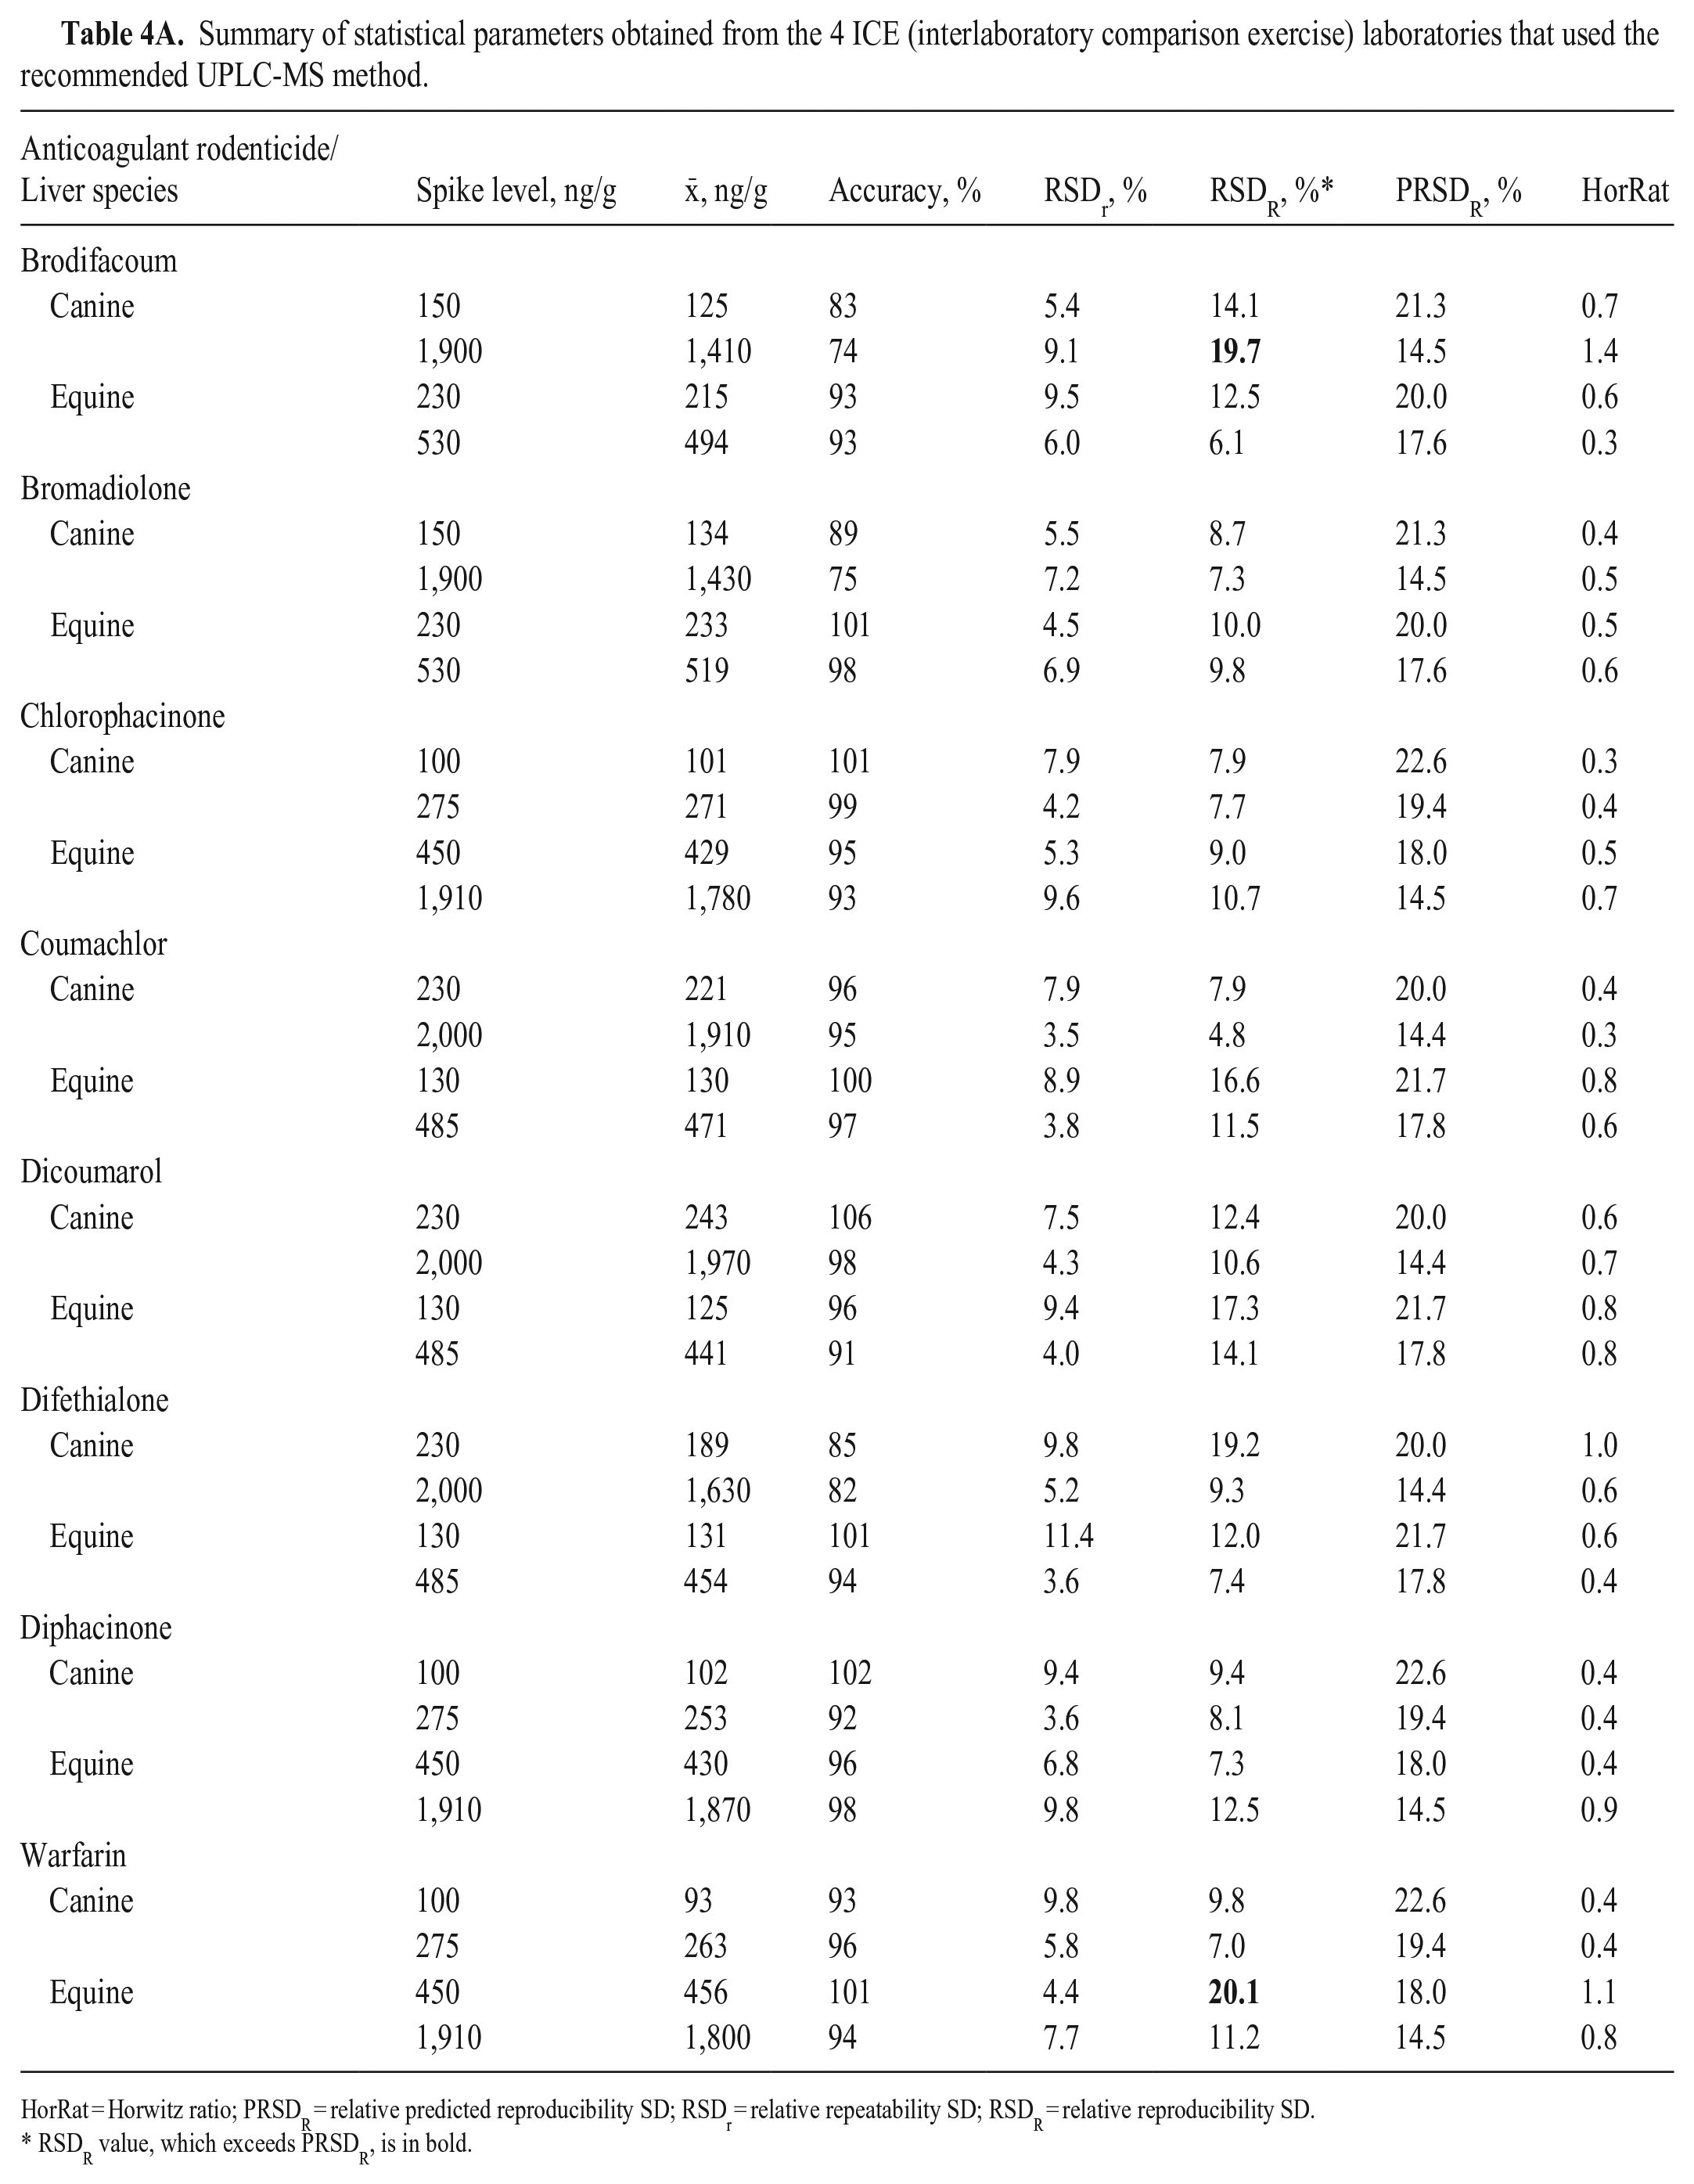
HorRat = Horwitz ratio; PRSDR = relative predicted reproducibility SD; RSDr = relative repeatability SD; RSDR = relative reproducibility SD.
RSDR value, which exceeds PRSDR, is in bold.
Summary of statistical parameters obtained from the 11 PT (proficiency test) laboratories that used the recommended UPLC-MS method.
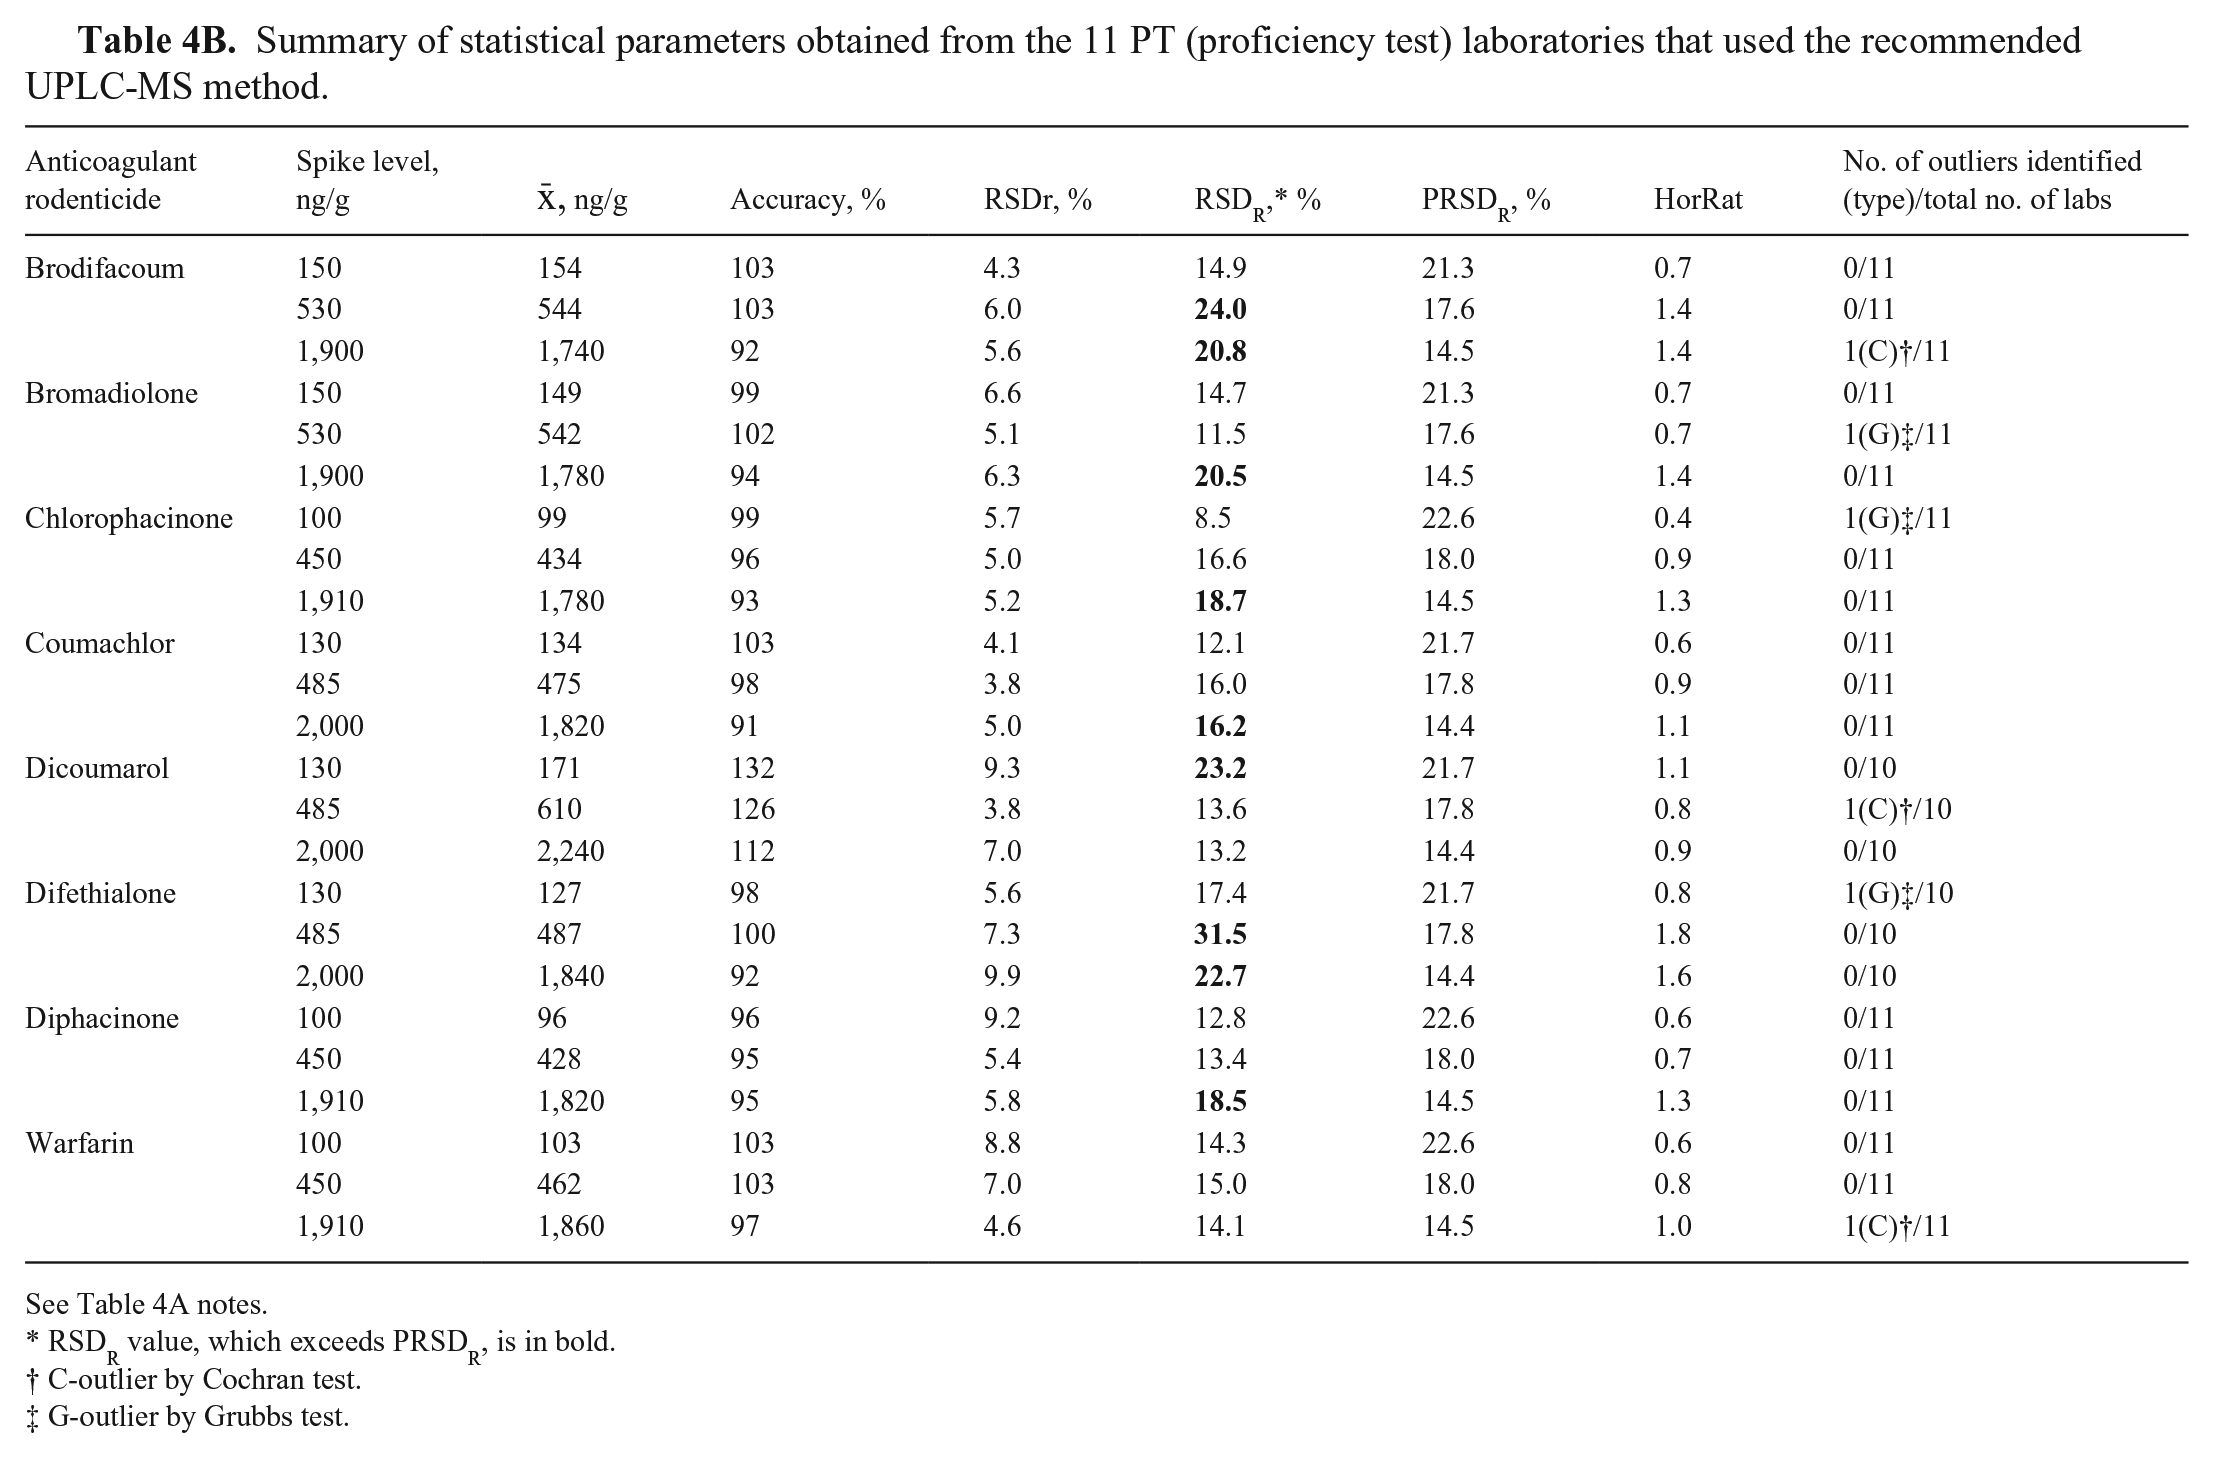
See Table 4A notes.
RSDR value, which exceeds PRSDR, is in bold.
C-outlier by Cochran test.
G-outlier by Grubbs test.
Summary of statistical parameters obtained from the ICE (4) and PT (11) laboratories.
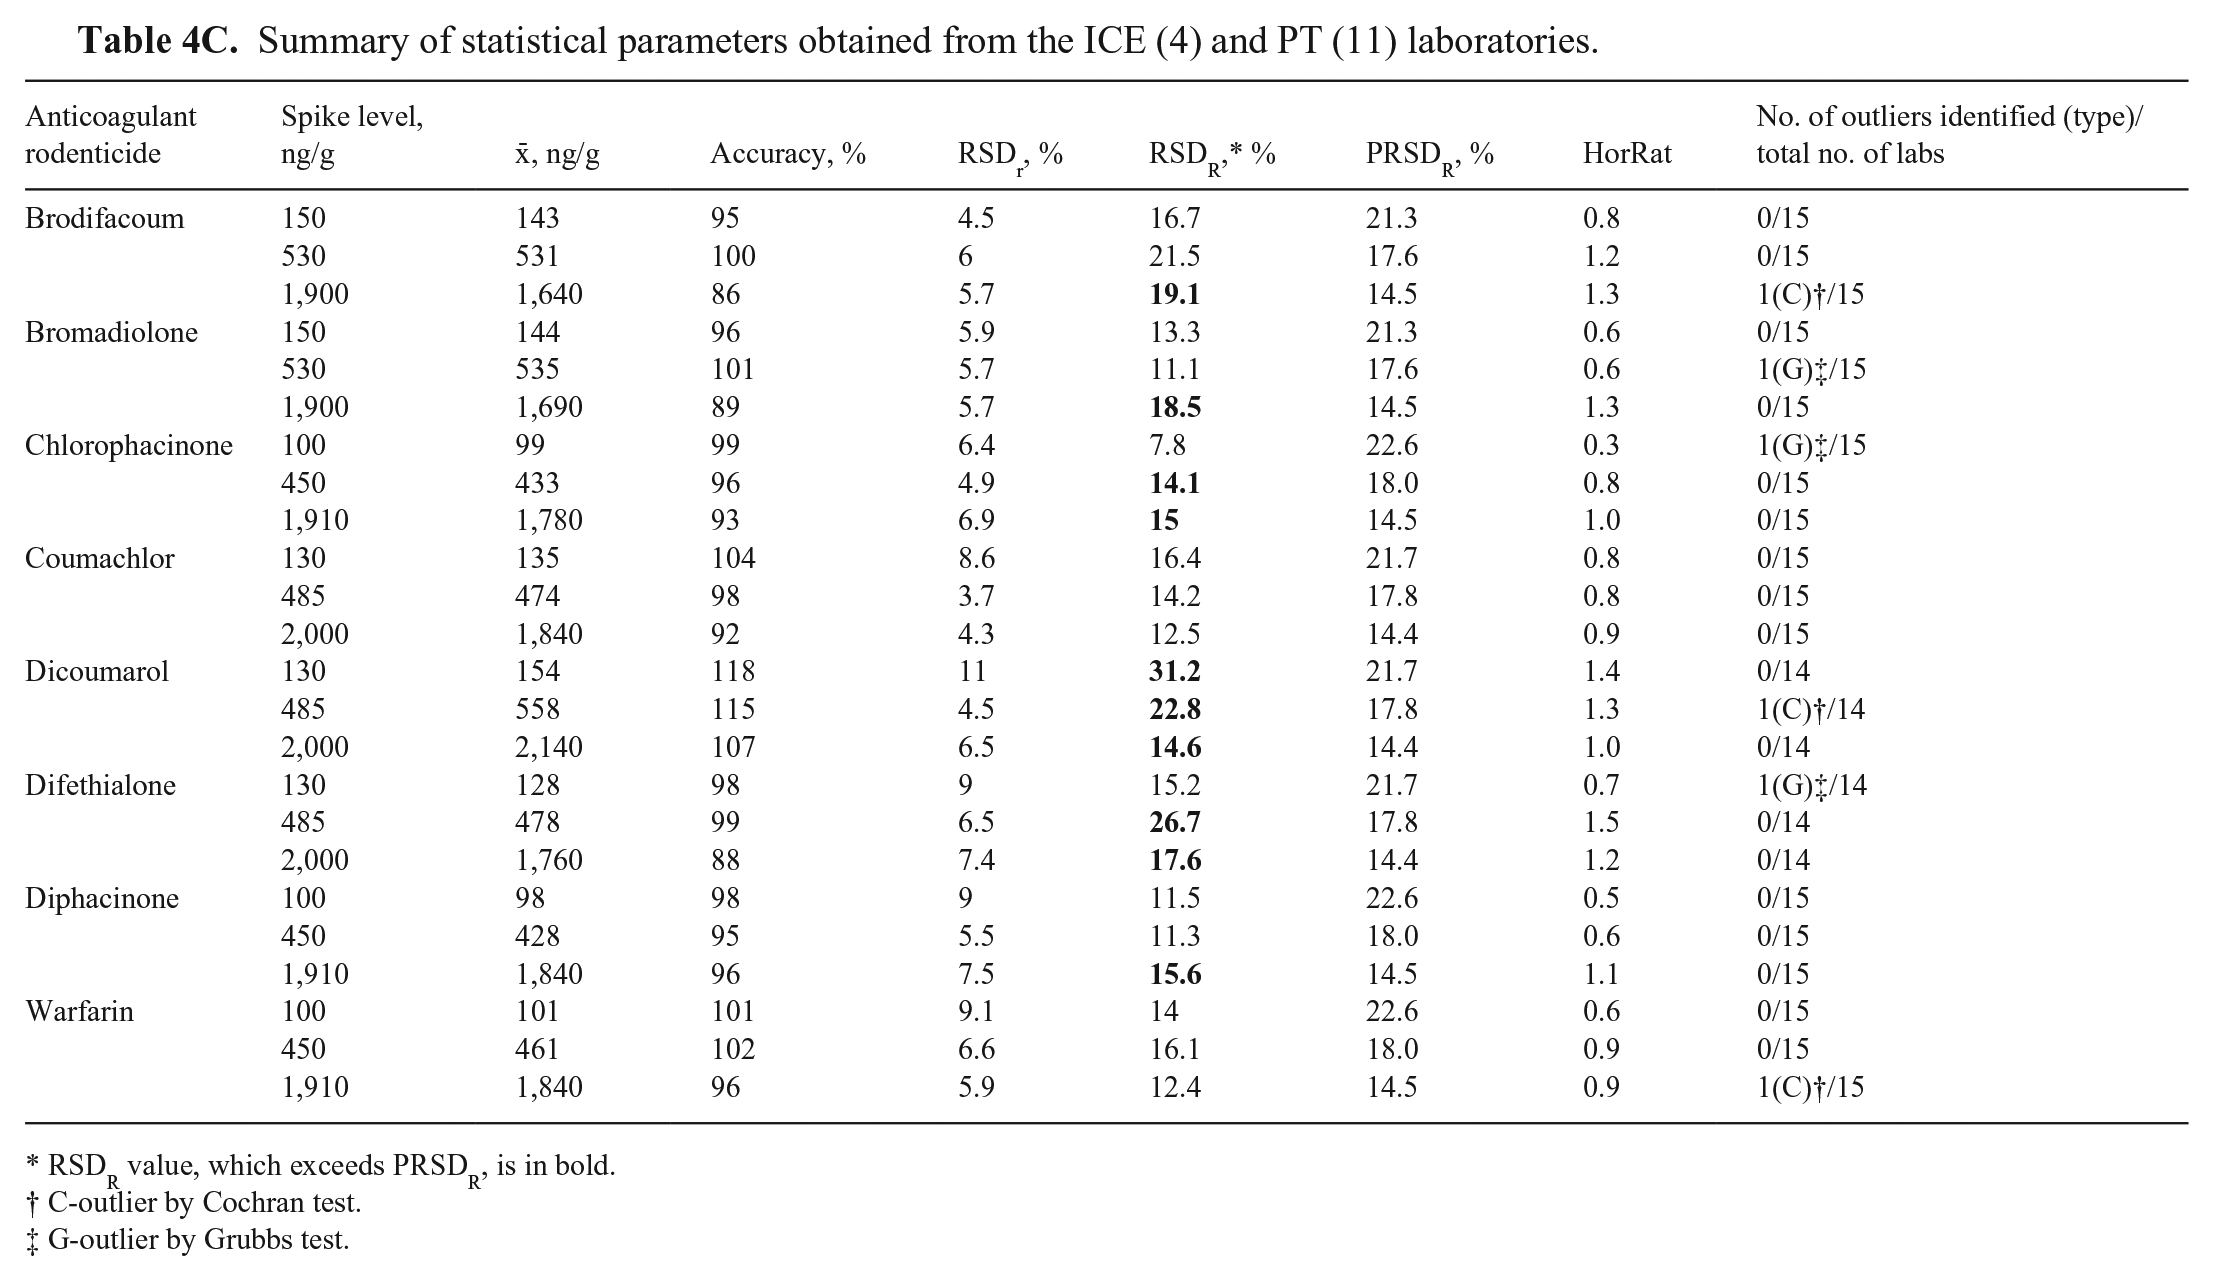
RSDR value, which exceeds PRSDR, is in bold.
C-outlier by Cochran test.
G-outlier by Grubbs test.
Of the 32 HorRat values obtained for ICE (Table 4A), 20 were 0.5–1.5 and 12 were 0.3–0.4. Of the 24 HorRat values obtained for PT (Table 4B), 21 were 0.5–1.5, 1 was < 0.5, and 2 were 1.6–1.8. Of the 24 HorRat values obtained for the combined dataset of both ICE and PT (Table 4C), 23 were 0.5–1.5, and 1 was < 0.5. The high numbers of HorRat values < 0.5 for the ICE may be the result of the small number of participants. All HorRat values for both ILCs were within the expected ≤ 2.0 value, confirming satisfactory precision of results. 28
The accuracies of results based on the recommended UPLC-MS method during both ILCs were considered satisfactory, confirming the in-house results obtained on non-anonymized samples from multiple animal species prior to the ILCs. Causes of outliers identified in the PT were not established and could have occurred because most participants used the recommended method as first-time users without extensive training or basic method verification. Performance of ILC participants may have improved if organizers required that participants correctly set up the recommended method, adequately trained the analysts, and verified the method performance in their laboratories prior to analysis of ILC samples. In conclusion, our ILC study results indicate adequate performance of the UHPLC-MS method for quantification of ARs in a wide range of animal liver matrices.
Supplemental Material
sj-pdf-1-vdi-10.1177_10406387231178558 – Supplemental material for Validation and interlaboratory comparison of anticoagulant rodenticide analysis in animal livers using ultra-performance liquid chromatography–mass spectrometry
Supplemental material, sj-pdf-1-vdi-10.1177_10406387231178558 for Validation and interlaboratory comparison of anticoagulant rodenticide analysis in animal livers using ultra-performance liquid chromatography–mass spectrometry by Yang Chen, Salvador Lopez, Ravinder M. Reddy, Jason Wan, Andriy Tkachenko, Sarah M. Nemser, Lori Smith and Renate Reimschuessel in Journal of Veterinary Diagnostic Investigation
Footnotes
Acknowledgements
We acknowledge the cooperation extended by the Vet-LIRN and FERN member laboratories. The diligence and hard work of the laboratory scientists involved is greatly appreciated.
Declaration of conflicting interests
The authors declared no potential conflicts of interest with respect to the research, authorship, and/or publication of this article.
Funding
The ILC was organized and conducted by the FDA Vet-LIRN network in collaboration with the Illinois Institute of Technology (IIT; Bedford Park, IL, USA). The PT was organized and conducted by the FDA FERN network in collaboration with IIT. Laboratories were not charged to participate in the exercises.
Supplemental material
Supplemental material for this article is available online.
References
Supplementary Material
Please find the following supplemental material available below.
For Open Access articles published under a Creative Commons License, all supplemental material carries the same license as the article it is associated with.
For non-Open Access articles published, all supplemental material carries a non-exclusive license, and permission requests for re-use of supplemental material or any part of supplemental material shall be sent directly to the copyright owner as specified in the copyright notice associated with the article.