
Abstract
Blood glucose measurements provide important diagnostic information regarding stress, disease, and nutritional status. Glucose analytical methodologies include dry chemistry analysis (DCA) of plasma and point-of-care (POC) glucometer analysis of whole blood; however, these 2 methods differ in cost, required sample volume, and processing time. Because POC glucometers use built-in equations based on features of mammalian blood to convert whole blood measurements to plasma equivalent units, obtained glucose data must be compared and validated using gold-standard chemistry analytical methodology in reptiles. For in-water, trawl-captured, immature Kemp’s ridley sea turtles (Lepidochelys kempii) from Georgia, USA, we observed significant, positive agreement between the 2 glucose determination methods; however, the glucometer overestimated glucose concentrations by 1.4 mmol/L on average in comparison to DCA and produced a wider range of results. The discordance of these results suggests that POC glucometer glucose data should be interpreted in the context of methodology- and brand-specific reference intervals along with concurrent packed cell volume data.
The use of point-of-care (POC) devices, including handheld glucometers, is increasing in wildlife health studies as a result of improved logistics and handling in the field, low costs, small required sample volume, and near real-time results.26,31 Glucose analysis in wild and rehabilitating sea turtle patients provides important state-of-health information, including acute stress, disease, various underlying metabolic derangements, and nutritional status; hence, glucose is considered a critical diagnostic analyte and is important for decision-making during sea turtle rehabilitation. 24 Plasma or serum glucose analysis by standard chemistry analyzers is considered the gold standard compared to glucometers; however, laboratory chemistry analyses come at increased costs with longer turnaround times.10,15 POC glucometers using combined glucose oxidase and potentiometry have been validated for use in 2 sea turtle species (green sea turtles, Chelonia mydas; loggerhead turtles, Caretta caretta)16,22; however, method comparison and validation have not yet been reported in Kemp’s ridley sea turtles (syn. Atlantic ridley; Lepidochelys kempii). Glucometers can be useful in field assessments or during mass strandings of this critically endangered species, 30 especially as “cold-stunning” events continue to occur during winter months along the East Coast of the United States. 11 Glucometer analysis of whole blood in sea turtles has shown a slight positive bias in comparison to plasma analysis by dry chemistry analysis (DCA).16,22 Therefore, for free-ranging, immature Kemp’s ridley sea turtles from Georgia, USA, our objectives were to 1) compare glucose concentrations using 2 different analytical methods: DCA using plasma and POC glucometer using whole blood; 2) determine the impact of packed cell volume (PCV) on glucometer measurements; and 3) establish reference intervals (RIs) for the glucometer.
Sample collection and processing followed previously documented procedures. 21 Briefly, Kemp’s ridley sea turtles were captured using trawling3,4 and sampled from 31 May–15 Jul 2016 (n = 16) and 5 Jun–19 Jul 2017 (n = 18) off Brunswick, GA. No animals were captured or sampled more than once. Blood was collected from the external jugular vein 19 of each turtle and was placed into 10-mL sodium heparin vacutainer tubes (Becton Dickinson). An aliquot of well-mixed heparinized whole blood was used to determine PCV and glucose using a POC glucometer (TRUEtrack; Nipro Diagnostics) based on combined glucose oxidase and potentiometry for use in whole blood.
Whole blood samples were centrifuged immediately (within 5 min of collection) on the research vessel at 944 × g (3,600 rpm) for 5 min. Plasma was separated, visually assessed for the presence of lipemia and hemolysis,2,25 and stored in liquid nitrogen onboard for several days until stored in a shore-based ultralow freezer for up to 3 mo. Frozen plasma samples were shipped overnight on dry ice to the University of Miami Avian & Wildlife Laboratory for glucose analysis using glucose oxidase and reflectance photometry by dry slide chemistry analyzer (250XR; Ortho Clinical Diagnostics).
Statistical analyses were performed using statistical software (v.19.1; MedCalc). Agreement between glucose results for the DCA using plasma and the POC glucometer using whole blood was assessed using Passing–Bablok regression and Bland–Altman difference plots. Differences in glucose concentrations between the 2 methods were determined using a paired sample t-test. Because the POC glucometer works best at a PCV range of 0.30 to 0.55 L/L, we also re-ran Passing–Bablok regressions and Bland–Altman difference plots after removal of samples with a PCV < 0.30 L/L (n = 8). Linear least-squares regressions were used to establish a conversion equation between POC glucometer concentrations and plasma glucose concentrations. Lastly, RIs (95%, with associated 90% confidence intervals) for whole blood glucose using the glucometer were also calculated using parametric methods based on recommendations for sample sizes ≥ 20, but < 40. 9 Normality was assessed using the Shapiro–Wilk test; outliers were detected using the Reed test.
We included 34 Kemp’s ridley sea turtles in our study. The animals were considered to be in good health based on 1) results of physical examination, 2) absence of excessive epibiota, and 3) good visual body condition. 21 Mean ± SD glucose concentrations using the DCA with plasma were 6.8 ± 1.1 mmol/L (range: 4.7–9.2 mmol/L; n = 34) and using the glucometer with whole blood were 8.2 ± 2.2 mmol/L (range: 4.9–13.5 mmol/L; n = 33; Table 1). Mean ± SD PCV was 0.32 ± 0.05 L/L (range: 0.20–0.44 L/L; n = 33; Table 1). 21 One adult female (min. straight carapace length = 61.5 cm) was excluded from the calculation of RIs, because this individual was the only mature turtle captured (breeding size of Kemp’s ridleys is ≥ 58 cm standard straight carapace length) 8 and RIs established here are for immature Kemp’s ridley sea turtles; a second turtle was missing a reading for glucose by glucometer.
Measures of central tendency, range, and reference intervals (RIs; with 90% confidence intervals for upper and lower limits) for plasma glucose using dry chemistry analysis (DCA) and whole blood glucose using a glucometer for in-water, immature Kemp’s ridley sea turtles (Lepidochelys kempii). Parametric methods for sample sizes ≥ 20 but < 40 were used to calculate RIs. 9 Normality was assessed using the Shapiro–Wilk test; outliers were detected using the Reed test. All plasma samples were free of hemolysis and lipemia, except for one sample with mild (1+) lipemia, which is not considered to cause interference using DCA. 25
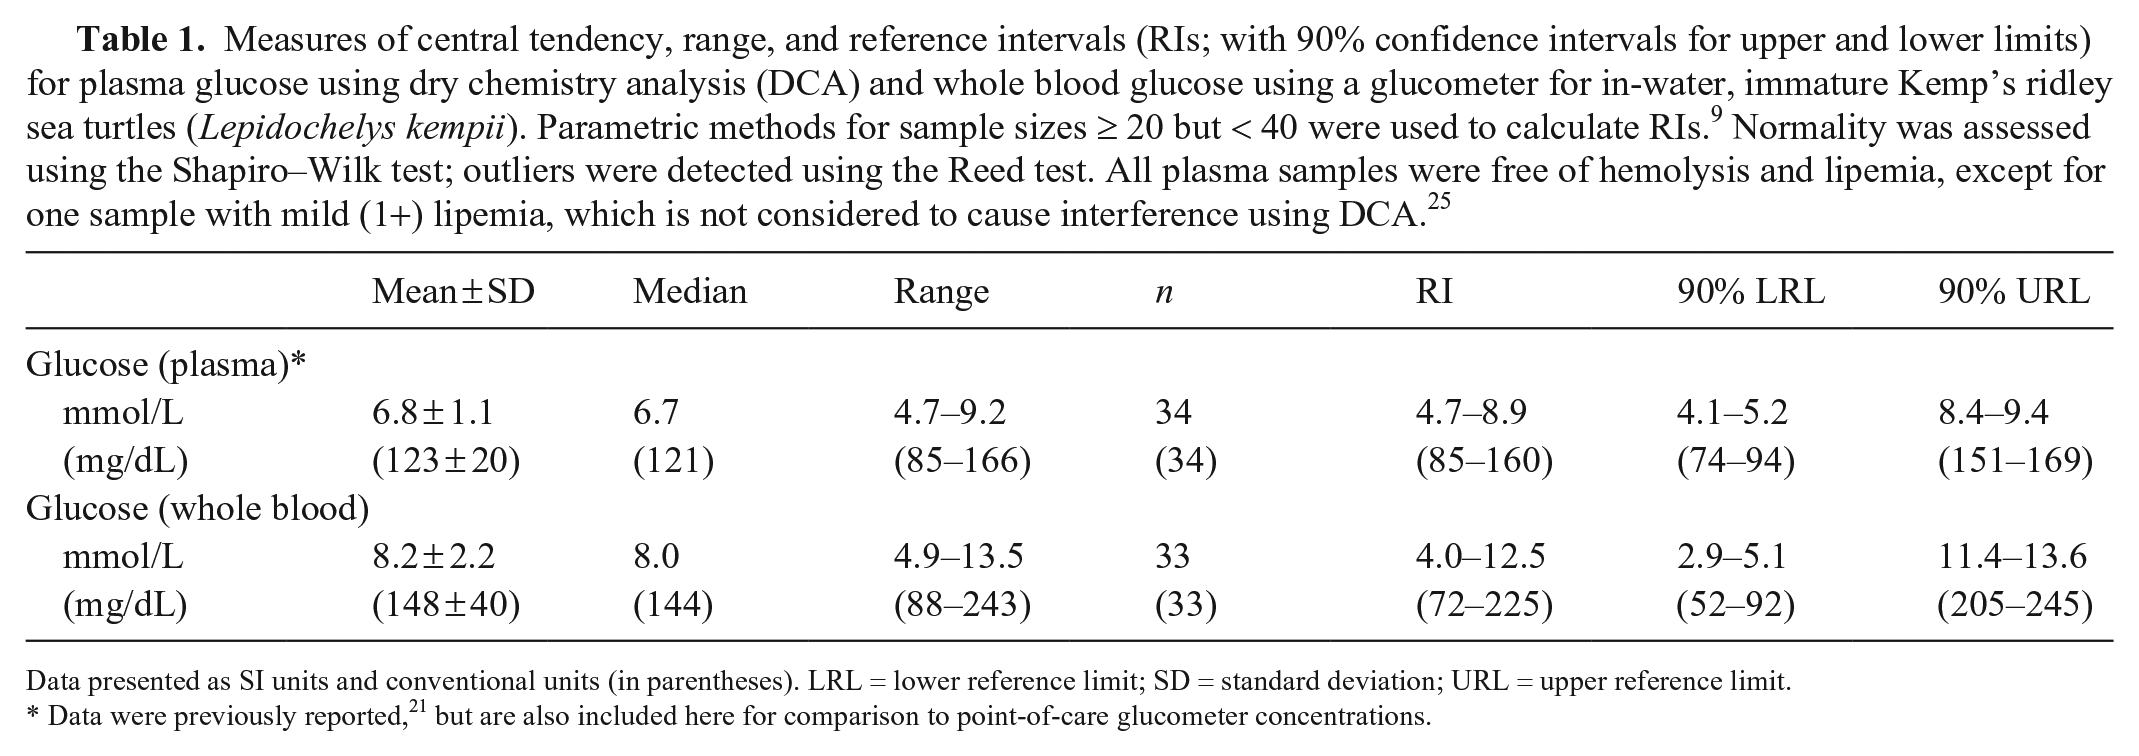
Data presented as SI units and conventional units (in parentheses). LRL = lower reference limit; SD = standard deviation; URL = upper reference limit.
Data were previously reported, 21 but are also included here for comparison to point-of-care glucometer concentrations.
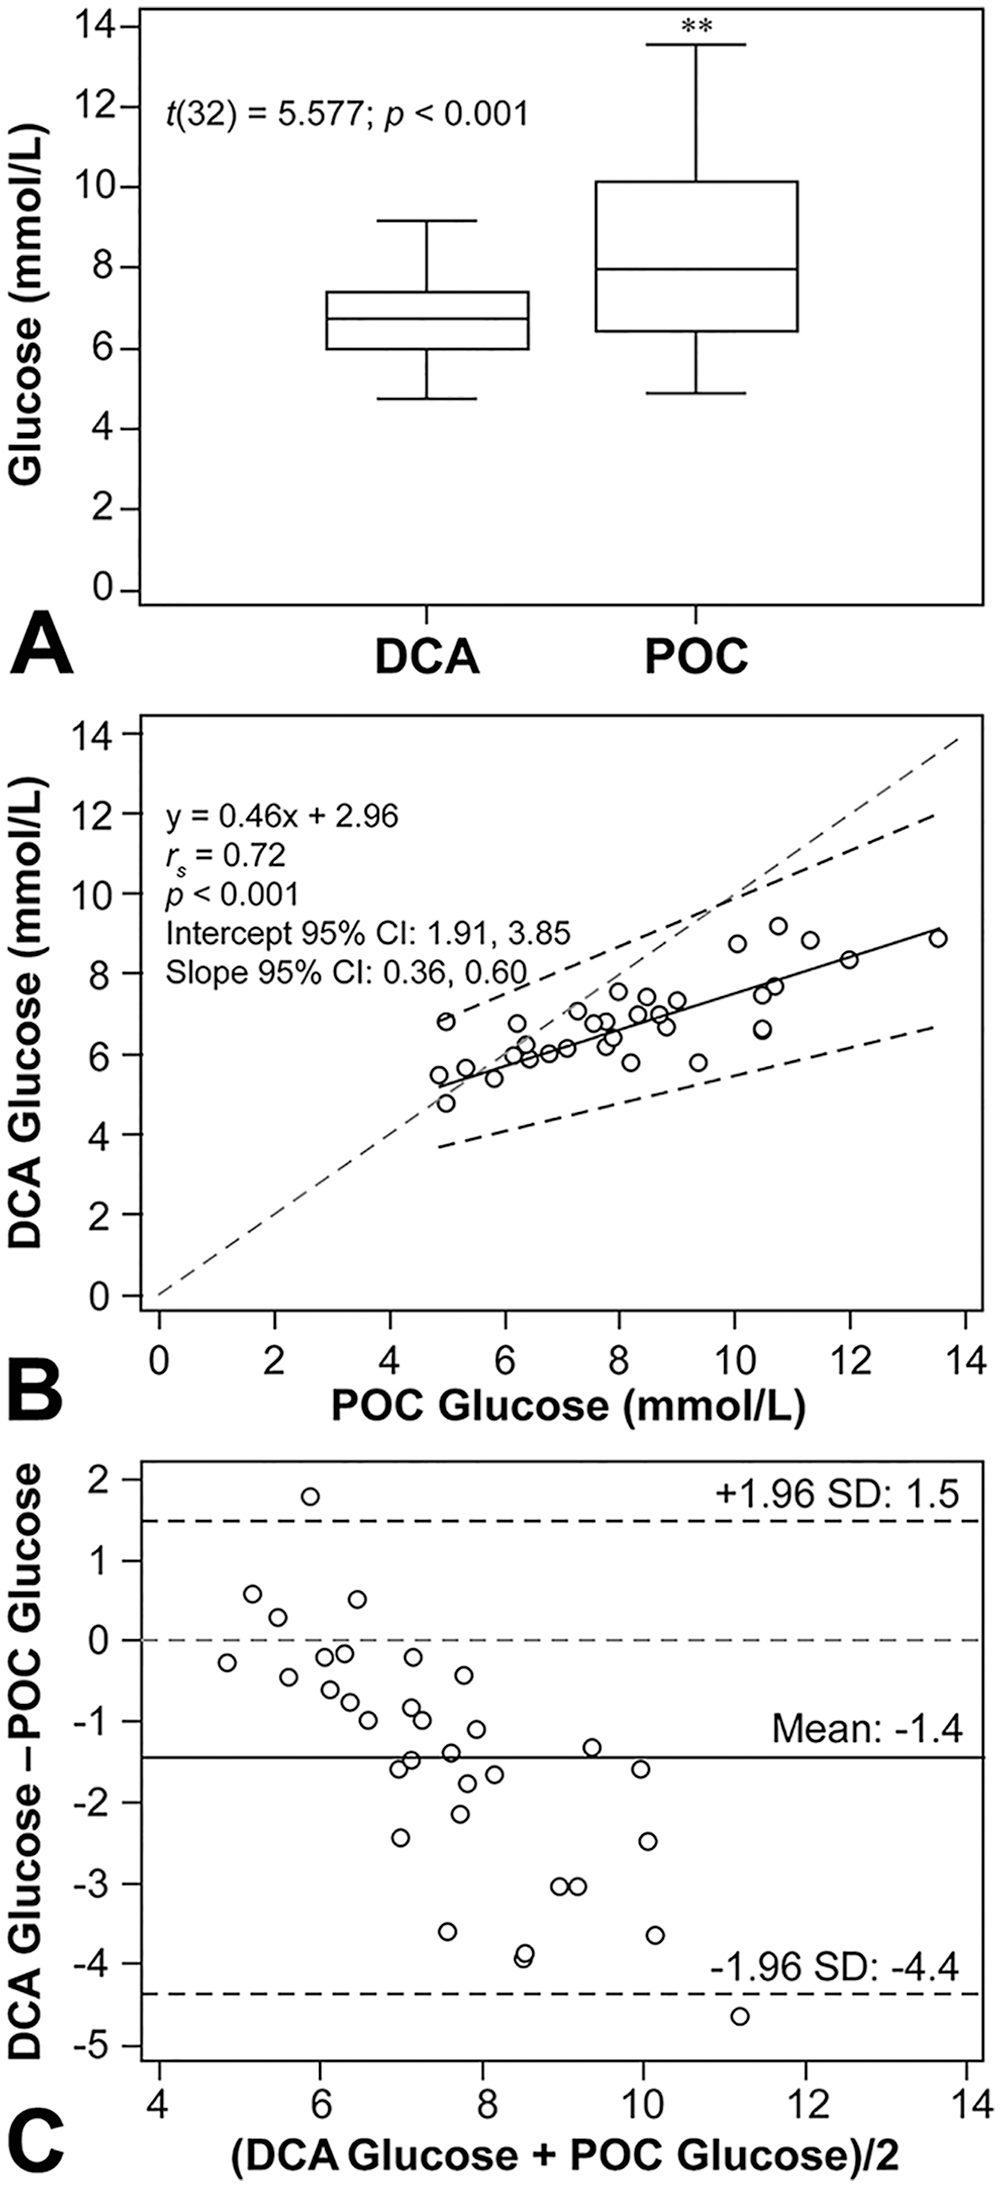
A paired sample t-test indicated that glucose measurements differed significantly (t(32) = 5.577; p < 0.001) between glucose concentrations determined by DCA and the POC device (Fig. 1A). Passing–Bablok regression analysis showed a strong linear association between the 2 methods (rs = 0.72; p < 0.001; Fig. 1B); however, both systematic and proportional differences were observed between the 2 methods, and the Bland–Altman plot indicated a negative bias (−1.4 mmol/L; limits of agreement: −4.4 and 1.5 mmol/L), with the POC glucometer giving higher results than the DCA (Fig. 1C). A total of 29 of 33 (88%) samples had higher glucose concentrations when analyzed by glucometer compared to the DCA. When glucose measurements associated with PCV values < 0.30 L/L were removed from method comparisons, the Passing–Bablok regression rs value increased (0.72 to 0.80) and the Bland–Altman bias decreased (−1.4 mmol/L to −1.2 mmol/L); however, both systematic and proportional differences were still observed between the 2 methods.
Previous studies on glucose comparisons using DCA and POC glucometers have been conducted in green and loggerhead sea turtles.16,22 The glucometer brand that we used is different from the one employed in those studies16,22; however, both brands use the same electrochemical-based methodology with glucose oxidase and potentiometry versus other optical methodology-based glucometers. Glucose consumption by RBCs continues after blood collection, and concentrations have been shown to rapidly decrease with delayed plasma separation times and sample exposure to increased temperatures.7,16 Because our samples were processed immediately (i.e., within 5 min of collection), we can assume that our glucose measurements, both by DCA and glucometer, were not affected by continued RBC consumption.
Baseline plasma glucose concentrations for Kemp’s ridley sea turtles range from 2.3 to 11.5 mmol/L.1,5,6,14,17,24,25 Results from the DCA (range: 4.7–9.2 mmol/L) showed clinically normal glucose measurements for all immature turtles sampled. Similarly, glucose results from the glucometer (range: 4.9–13.5 mmol/L) also fell within the normal range of glucose concentrations for Kemp’s ridley sea turtles, except for 2 samples (12.0 mmol/L and 13.5 mmol/L). The effects of capture technique cannot be ruled out, given that forced submergence, albeit minimal, may have impacted blood glucose concentrations. 21
Similar to other studies, the POC glucometer produced significantly higher concentrations (by 1.4 mmol/L in our study) compared to DCA results.16,22,27,31 The 2 methods were strongly correlated; however, 25 of 33 (76%) and 8 of 33 (24%) samples had a ≥ 10% and ≥ 40% difference between the methodologies, respectively. Hence, this brand of glucometer consistently produced results that were above the total allowable error of 10% for glucose set by the American Society for Veterinary Clinical Pathology, 13 which raises concern that this bias may affect clinical decisions. In green and loggerhead sea turtles, POC glucometers overestimated glucose concentrations by 0.1 mmol/L and 0.4 mmol/L, respectively.16,22 This demonstrates the need for analyzer- and brand-specific RIs for glucometers, despite the use of identical analytical methodology by different manufacturers.
Handheld glucometers are designed for optimal use in humans, and reasons for the observed variations and range in results of our study likely include dissimilarities in analytical methodologies (DCA uses hexokinase and glucose-6-phosphate dehydrogenase; the POC glucometer uses glucose oxidase and potentiometry), reptilian RBC morphology (e.g., nucleated RBCs in reptiles vs. non-nucleated RBCs in mammals; variations in nuclear and cell size during phases of erythroid regenerative responses), PCV, electrolyte concentrations of the samples of interest, in addition to a variety of pre-analytical factors (e.g., prandial status, filling of glucose strips, partial pressure of oxygen, and even drying of isopropyl alcohol on skin before venipuncture).10,16,22 These observed differences are also important from a clinical perspective. If using a glucometer to determine glucose concentrations in rehabilitating sea turtle patients or during population health assessments, caution is warranted in the interpretation of data because of consistently higher glucose data by glucometer across studies compared to regular chemistry analysis.16,22 For example, hypoglycemia may go unnoticed or may be more severe than realized if using only a glucometer to determine glucose concentrations. These methodological differences should always be considered, given that decisions for treatment (e.g., fluid administration) based on these results may differ depending on which method and brand were used. Linear regression analysis revealed a significant relationship (r2 = 0.61; p < 0.001) between whole blood POC glucose concentrations and plasma DCA glucose concentrations, which can be described as:
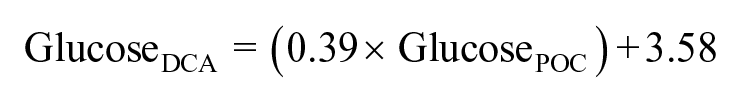
Using this equation, the coefficients of variations between the actual plasma DCA glucose concentrations and the calculated concentrations ranged from 0.1% to 11.3% (mean ± SD: 3.7 ± 3.2%), indicating that plasma glucose concentrations can be accurately predicted by whole blood glucometer concentrations using the TRUEtrack glucometer in Kemp’s ridley sea turtles.
It is possible that the reduced accuracy of the glucose measurements in sea turtles using human glucometers occurs as a consequence of the comparatively low PCV of sea turtles compared to humans, given that the device is most accurate at PCVs of 0.30 to 0.55 L/L.16,27 PCV has been shown to influence POC glucose measurements in humans 27 and domestic mammals.12,18,20,23,28,29 These units also use built-in equations specific for mammalian blood to convert whole blood measurements to plasma equivalent units, and such equations may not be suitable for use with reptiles.10,16 With PCV < 0.30 L/L or at the lower range of PCV for the species, POC glucose readings in whole blood tend to be higher than with mid- or upper-range PCV. Hence, an anemic sea turtle patient with PCV < 20% will have higher POC glucose, possibly masking underlying hypoglycemia. Such limitations of using glucometers must be considered in decisions regarding additional testing and medical care.
Footnotes
Acknowledgements
We thank the crew of the research vessel Georgia Bulldog, including Lindsey Parker, Lisa Gentit, and H. “Truck” McIver. We also thank the team involved with blood processing: Christopher Evans, Austin Pickhardt, Julie Dingle, Sharleen Johnson, S. Michelle Pate, and Shannon Howard. We thank Drs. Craig Harms and Charlie Innis for providing feedback on earlier drafts of this manuscript.
Declaration of conflicting interests
The authors declared no potential conflicts of interest with respect to the research, authorship, and/or publication of this article.
Funding
This project was supported by the National Marine Fisheries Service Southeastern Regional Office Award NA13NMF4720182.
Compliance with ethical standards
Our study was carried out in accordance with Endangered Species Act Section 10(a)(1)(A) permit 19621, Georgia Department of Natural Resources Scientific Collection Permit CN21303, and approved Institutional Animal Care and Use Committee protocol UF IACUC 201706823.