
Abstract
Epidemics of H3N8 and H3N2 influenza A viruses (IAVs) in dogs, along with recognition of spillover infections from IAV strains typically found in humans or other animals, have emphasized the importance of efficient laboratory testing. Given the lack of active IAV surveillance or immunization requirements for dogs, cats, or horses imported into the United States, serotype prediction and whole-genome sequencing of positive specimens detected at veterinary diagnostic laboratories are also needed. The conserved sequences at the ends of the viral genome segments facilitate universal amplification of all segments of viral genomes directly from respiratory specimens. Although several methods for genomic analysis have been reported, no optimization focusing on companion animal strains has been described, to our knowledge. We compared 2 sets of published universal amplification primers using 26 IAV-positive specimens from dogs, horses, and a cat. Libraries prepared from the resulting amplicons were sequenced using Illumina chemistry, and reference-based assemblies were generated from the data produced by both methods. Although both methods produced high-quality data, coverage profiles and base calling differed between the 2 methods. The sequence data were also used to identify the subtype of the IAV strains sequenced and then compared to standard PCR assays for neuraminidase types N2 and N8.
Keywords
Introduction
Influenza A virus (IAV) testing and subtyping is an important component of the veterinary diagnostic laboratory repertoire. In addition to its natural reservoirs among different species of wild birds, IAV has demonstrated stable circulation in domestic poultry, humans, swine, mink, and horses, as well as causing epizootics in marine mammals.7,29,33 Small companion animals (primarily dogs, cats, and ferrets) as well as horses are also susceptible to IAV infection. Human IAVs can infect dogs and cats, although likely inefficiently. Influenza A(H1N1)pdm09 virus has been documented to have infected several household pet cats and caused substantial mortality in a domestic cat colony. 8 A 2016 influenza A(H7N2) virus outbreak among shelter cats in New York City led to 2 human infections and prompted a major public health response.2,24 Two recent transfers of IAV into dogs have produced sustained canine transmission. In ~ 1999, an equine influenza A(H3N8) virus entered the dog population, likely among racing greyhounds in Florida, and later became established in shelter dog populations.6,21–23 The transfer of an avian influenza A(H3N2)-like virus into the canine population likely occurred in China or Korea in ~ 2005. After circulating in East Asia, that virus was introduced into the United States in early 2015, causing an outbreak in several midwestern and southern states.21,30,31 Multiple subsequent reintroductions of H3N2 strains from Asia to the United States and Canada have occurred since 2015.31,34
Given the propensity for zoonotic transmission of IAVs, veterinary diagnostic laboratories have a key role in surveillance of IAV distribution in animals, and in understanding the likelihood of human exposure. One strategy is detection of the matrix gene via reverse-transcription real-time PCR (RT-rtPCR), as well as targeted molecular subtyping of the hemagglutinin (HA) and/or neuraminidase (NA) gene segments. 11 However, specific detection of one or more those segments is prone to failure because of strain variation, and whole-genome sequencing (WGS), as it becomes more widely used by veterinary diagnostic laboratories, presents a more robust and flexible alternative to PCR for typing IAV submissions. Compared to basic subtyping, WGS also provides more detailed information on the composition and likely properties of any new virus, and thereby improves our understanding of IAV transmission within and between species.
WGS of IAV typically employs multi-segment RT-PCR (M-RT-PCR). This technique takes advantage of the fact that the 8 RNA segments in IAV share highly conserved regions at their ends: 12 nucleotides at the 3’-terminus (MBTuni-12), and 13 nucleotides at the 5’-terminus (MBTuni-13). M-RT-PCR therefore utilizes a set of primers that can amplify RNA segments of any IAV lineage by targeting these conserved regions at the ends of the genomic segments. 36 Several variations of this method, in terms of primer sequences and thermocycling profiles, have been proposed for use with commercial library preparation kits.
We compared 2 previously described M-RT-PCR methods for influenza WGS. The first, method A, was proposed in an Illumina technical note (https://www.illumina.com/content/dam/illumina-marketing/documents/products/appnotes/miseq-nextera-xt-influenza-application-note-770-2015-053.pdf) and modifies the MBTuni primers by adding Illumina Nextera transposon sequences to the end conserved region in order to improve coverage at the ends of segments. 15 The second, method B, adds different tails to the conserved region of the MBTuni primers and uses both versions of the variable MBTuni-12 position 4.18,36 We used sequencing data generated following amplification by each of these methods for subtyping and reference-based assembly. The resulting assemblies were also utilized to evaluate published PCR primers for N2 and N8. 11
Materials and methods
Two sets of samples were selected for inclusion in our study. Set 1 included 25 IAV-positive samples (21 canine, 3 equine, 1 feline) from routine diagnostic specimens submitted to the Cornell University Animal Health Diagnostic Center (Ithaca, NY) during 2017–2018. These were chosen to represent the typical host distribution of clinical submissions and to cover a variety of subtyping results. Set 2 consisted of 10 equine samples submitted during 2018–2019. Samples from both sets were originally determined positive for IAV by rtPCR, using the Centers for Disease Control and Prevention (CDC) universal IAV assay 26 on the OpenArray platform. 10 Virus isolation and propagation in embryonated chicken eggs was attempted for 7 of the respiratory swab supernatants from set 1 using standard methods. 4
Influenza whole-genome amplification was performed on both sample sets using 2 M-RT-PCR methods that differ by primer sequences used and thermal cycling profiles. Method A uses primer concentrations of 300 nM for F1 and R1 and 200 nM for F2 and R2; method B uses 2 forward primers of 100 nM each and 1 reverse primer of 200 nM (Table 1). For both methods, M-RT-PCR was performed using the Superscript III one-step RT-PCR kit with Platinum Taq (Invitrogen) on the GeneAmp 7900 thermocycler (Applied Biosystems). The thermal cycling conditions for method A started with an RT step at 42°C for 60 min and 94°C for 2 min, followed by 2 sets of amplification cycles. The first set contained 5 cycles of 94°C for 30 s, 45°C for 30 s, and 68°C for 3 min. The second set contained 31 cycles of 94°C for 30 s, 57°C for 30 s, and 68°C for 3 min. The thermal cycling conditions for method B began with an RT step at 55°C for 30 s, followed by 42°C for 50 min and 94°C for 2 min. Following the RT step were 5 cycles of 94°C for 15 s, 42°C for 30 s, and 68°C for 3 min 20 s. The second set of cycling was 35 cycles of 94°C for 15 s, 57°C for 30 s, and 68°C for 3 min 20 s, with a final extension of 68°C for 5 min. PCR products were visualized using gel electrophoresis and purified with AMPure XP beads (Beckman Coulter) at a ratio of 0.4×.
Primers for influenza A virus multi-segment reverse-transcription PCR (M-RT-PCR) for whole genome amplification.
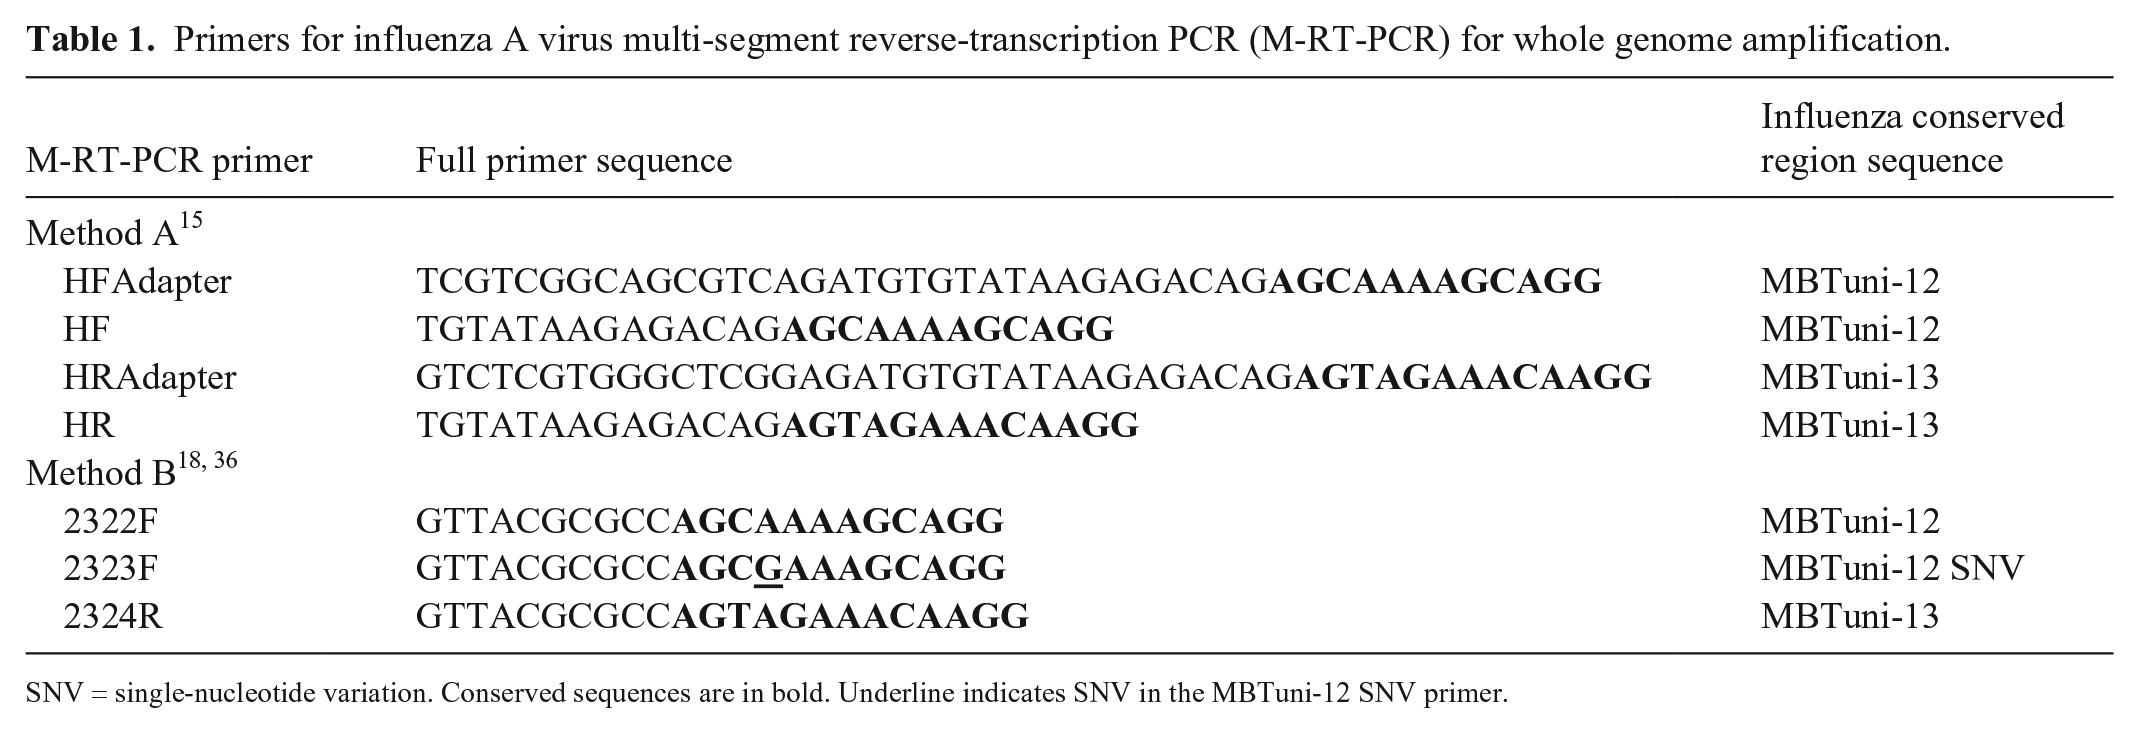
SNV = single-nucleotide variation. Conserved sequences are in bold. Underline indicates SNV in the MBTuni-12 SNV primer.
Of the 25 set 1 samples amplified, 16 (12 canine, 3 equine, 1 feline) were chosen for WGS based on the quality of gel images and concentrations post-cleanup (Fig. 1). Purified PCR products were prepared for sequencing (Nextera XT DNA library preparation kit; Illumina) using an AMPure XP bead ratio of 1.8× for IAV libraries during the final cleanup step. The bead-based normalization step was omitted and replaced with concentration-based normalization using Qubit fluorometric quantification with the Qubit dsDNA HS assay kit (Thermo Fisher Scientific). Sequencing libraries were prepared from purified PCR products for all set 2 samples using a different protocol (Nextera DNA Flex library preparation kit; Illumina). Quality of the DNA fragmentation and library preparation was assessed (set 1: AATI fragment analyzer, set 2: DNA ScreenTape analysis; Agilent). Pooled libraries were then sequenced (set 1: MiSeq sequencer, set 2: iSeq sequencer; Illumina) using 2 × 150 bp chemistry. Read quality was assessed (FastQC v.0.11.8, https://www.bioinformatics.babraham.ac.uk/projects/fastqc/).
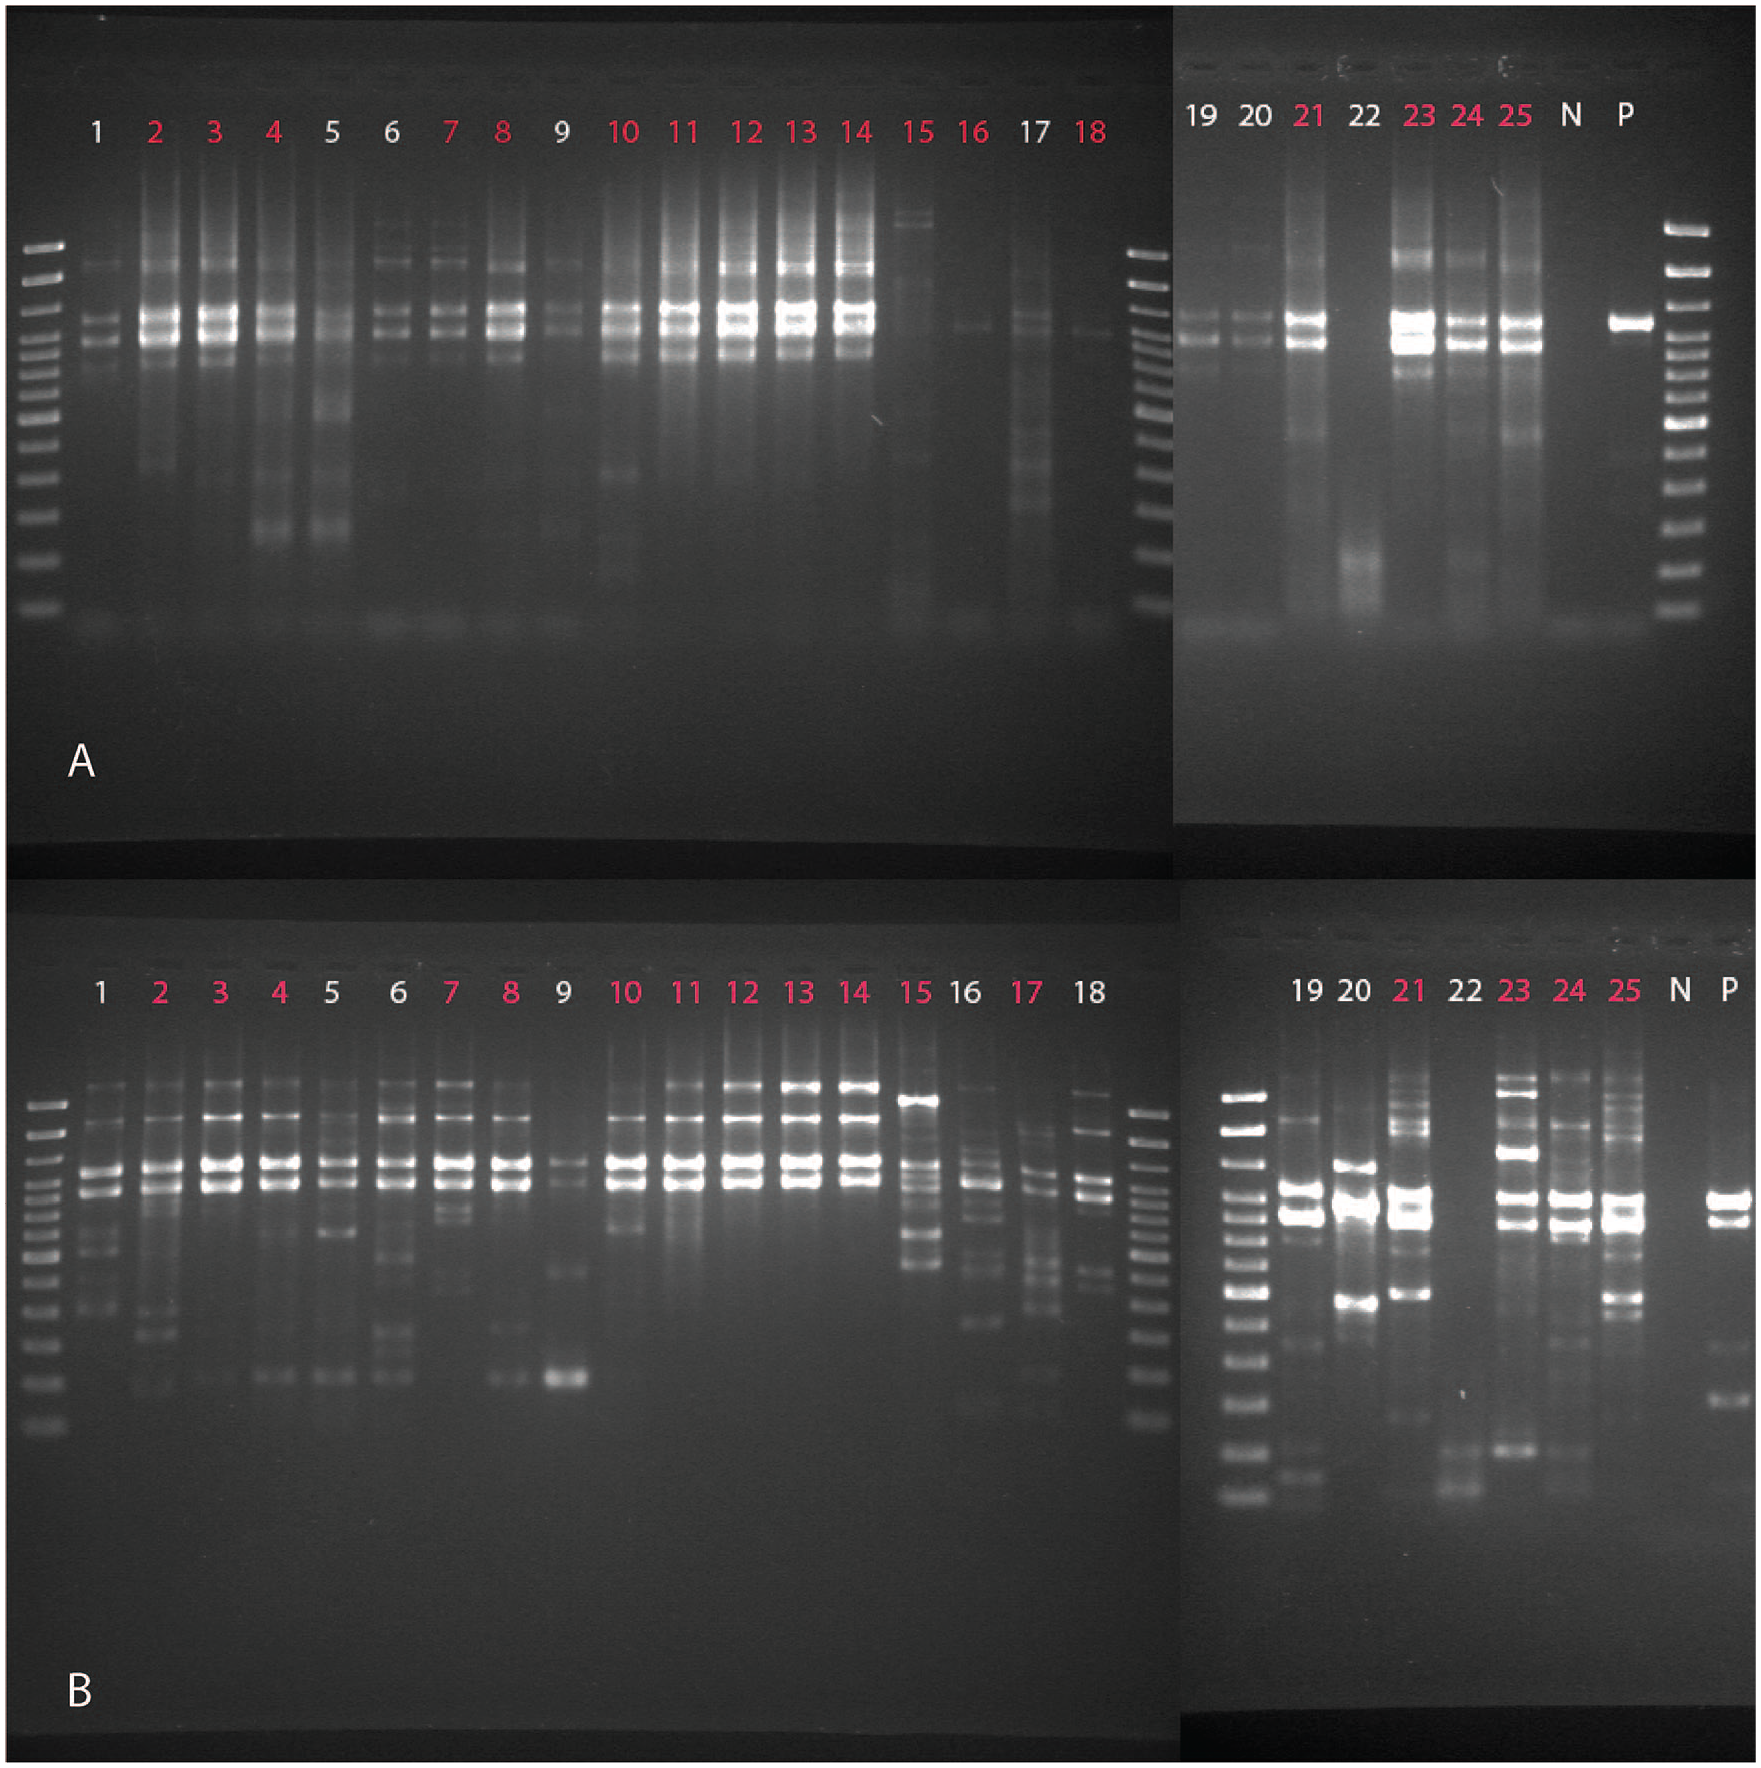
Gel image of M-RT-PCR product with the samples run with
NA typing by PCR was attempted on all samples from set 1 using assays for N2 and N8 described previously. 11 The primers were also searched against the assemblies from both sets using blastn 5 with a word size of 7 in order to assess how well they matched the sequence data and to investigate typing failures. Coverage and identity thresholds were set to 95% and relaxed until alignments were found.
HA and NA subtypes were also determined by using Mash v.2.119,20 to screen reads against custom databases of segment 4 and segment 6 sequences. To build this database, all non-redundant segment 4 and segment 6 sequences were downloaded from NCBI Influenza Virus Resource (https://www.ncbi.nlm.nih.gov/genomes/FLU/Database/nph-select.cgi?go=database) 1 and filtered to remove sequences containing < 99% canonical nucleotides and sequences not within 100 bp of the median length for that segment. The remaining sequences were then clustered at 95% identity using CD-HIT v.4.7.9,17 Subtype annotations for each cluster were checked by identifying clusters in which multiple subtypes were present and by manually inspecting phylogenetic trees built using RAxML v.8.2.9 28 from alignments of representative sequences generated using MAFFT v.7.427. 13 When the subtype of a cluster representative appeared to be misidentified on the basis of phylogenetic position and/or annotations for other cluster members, a new representative was chosen that matched the expected subtype. The final sketches are available as part of FluStAR (https://github.com/pkmitchell/FluStAR).
Reference-based assemblies were then generated for each sample using Snippy v.4.3.6 (https://github.com/tseemann/snippy) with default variant calling parameters. Differences in base calls between the 2 methods were investigated by identifying sites that differed between each pair of assemblies. Prior to assembly, reads files were error-corrected using Lighter v.1.1.2 27 and trimmed with Trimmomatic v.0.36 3 to remove Nextera adapters and poor-quality bases with the following parameters: (Leading: 2, Trailing: 2, Minlen: 25, SlidingWindow: 4:5). Reference sequences were chosen based on subtype and host species. The IAV A/canine/Illinois/41915/2015(H3N2) genome was used for canine H3N2 samples, A/equine/Concepcion/RO7C/2018(H3N8) for equine H3N8 samples, and A/cheetah/California/D0912239/2009(H1N1) for feline H1N1 samples. If the subtype could not be determined from the sequence data, Kraken2 35 was used to assess whether the read set consisted primarily of non-IAV sequence data, which would indicate that viral amplification failed. One assembly for each sample was submitted to NCBI (Suppl. Table 1).
Per-base read pileup depths were determined for each assembly using SAMtools v.1.9. 16 Overall coverage depth was calculated as the average depth per base for each amplification method. In order to assess the coverage profiles of the 2 amplification methods, the coverage for each segment relative to the whole genome was first calculated as the average read depth for that segment divided by the average read depth across the entire assembly for each sequence. Wilcoxon signed-rank tests comparing these coverage values between the 2 methods were then computed for each of the 8 genomic segments. The p-values were adjusted for multiple comparisons using the Benjamini–Hochberg method. To assess within-segment variations in coverage, the coverage for each site relative to the average coverage for the segment was calculated and plotted for each assembly. All statistical analyses were performed using R v.3.4.2. 25 Coverage analyses were conducted separately for set 1 and set 2; for set 1, analyses were restricted to canine H3N2 samples given the low number of samples of other subtypes.
Results
Library preparation and sequencing quality control
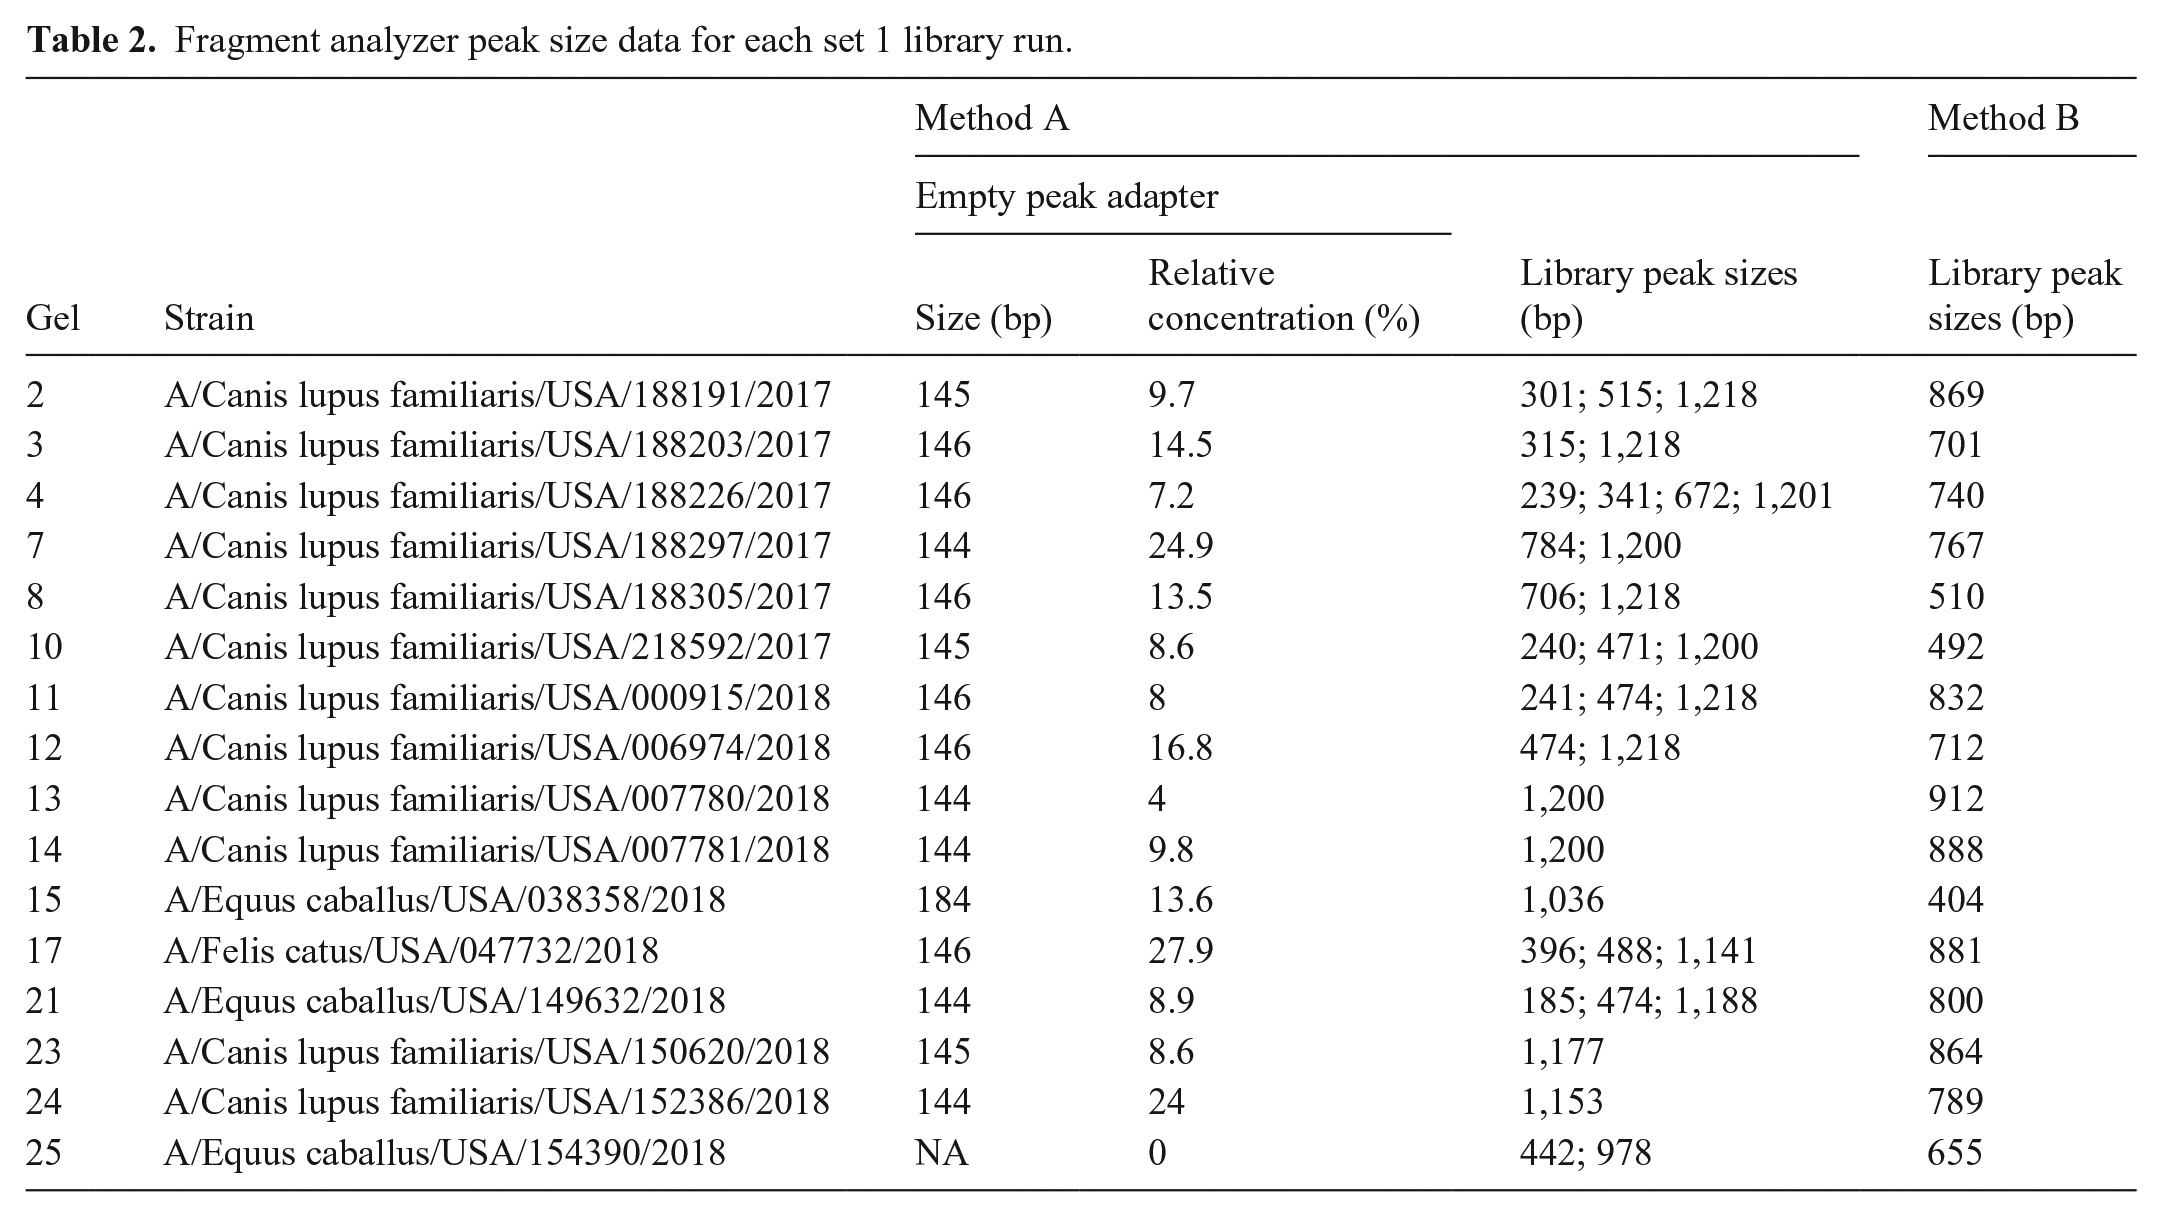
Among set 1 libraries prepared using method A, 14 of 16 had a Fragment Analyzer peak of 144–146 bp, and 1 had a peak at 184, suggesting the presence of empty adapters (https://support.illumina.com/bulletins/2019/10/what-are-adapter-dimers-.html?langsel=/us/). Relative concentrations for these peaks ranged 4–27.9%. The remaining method A sample did not have a Fragment Analyzer peak, suggesting that it did not contain empty adapters. No libraries prepared using method B produced these peaks. Libraries from method B also yielded a very even fragment size distribution, with a single peak at 100% concentration for all samples. In contrast, 11 of 16 libraries from method A had multiple peaks in addition to the previously mentioned empty adapter peaks (Fig. 2, Table 2).
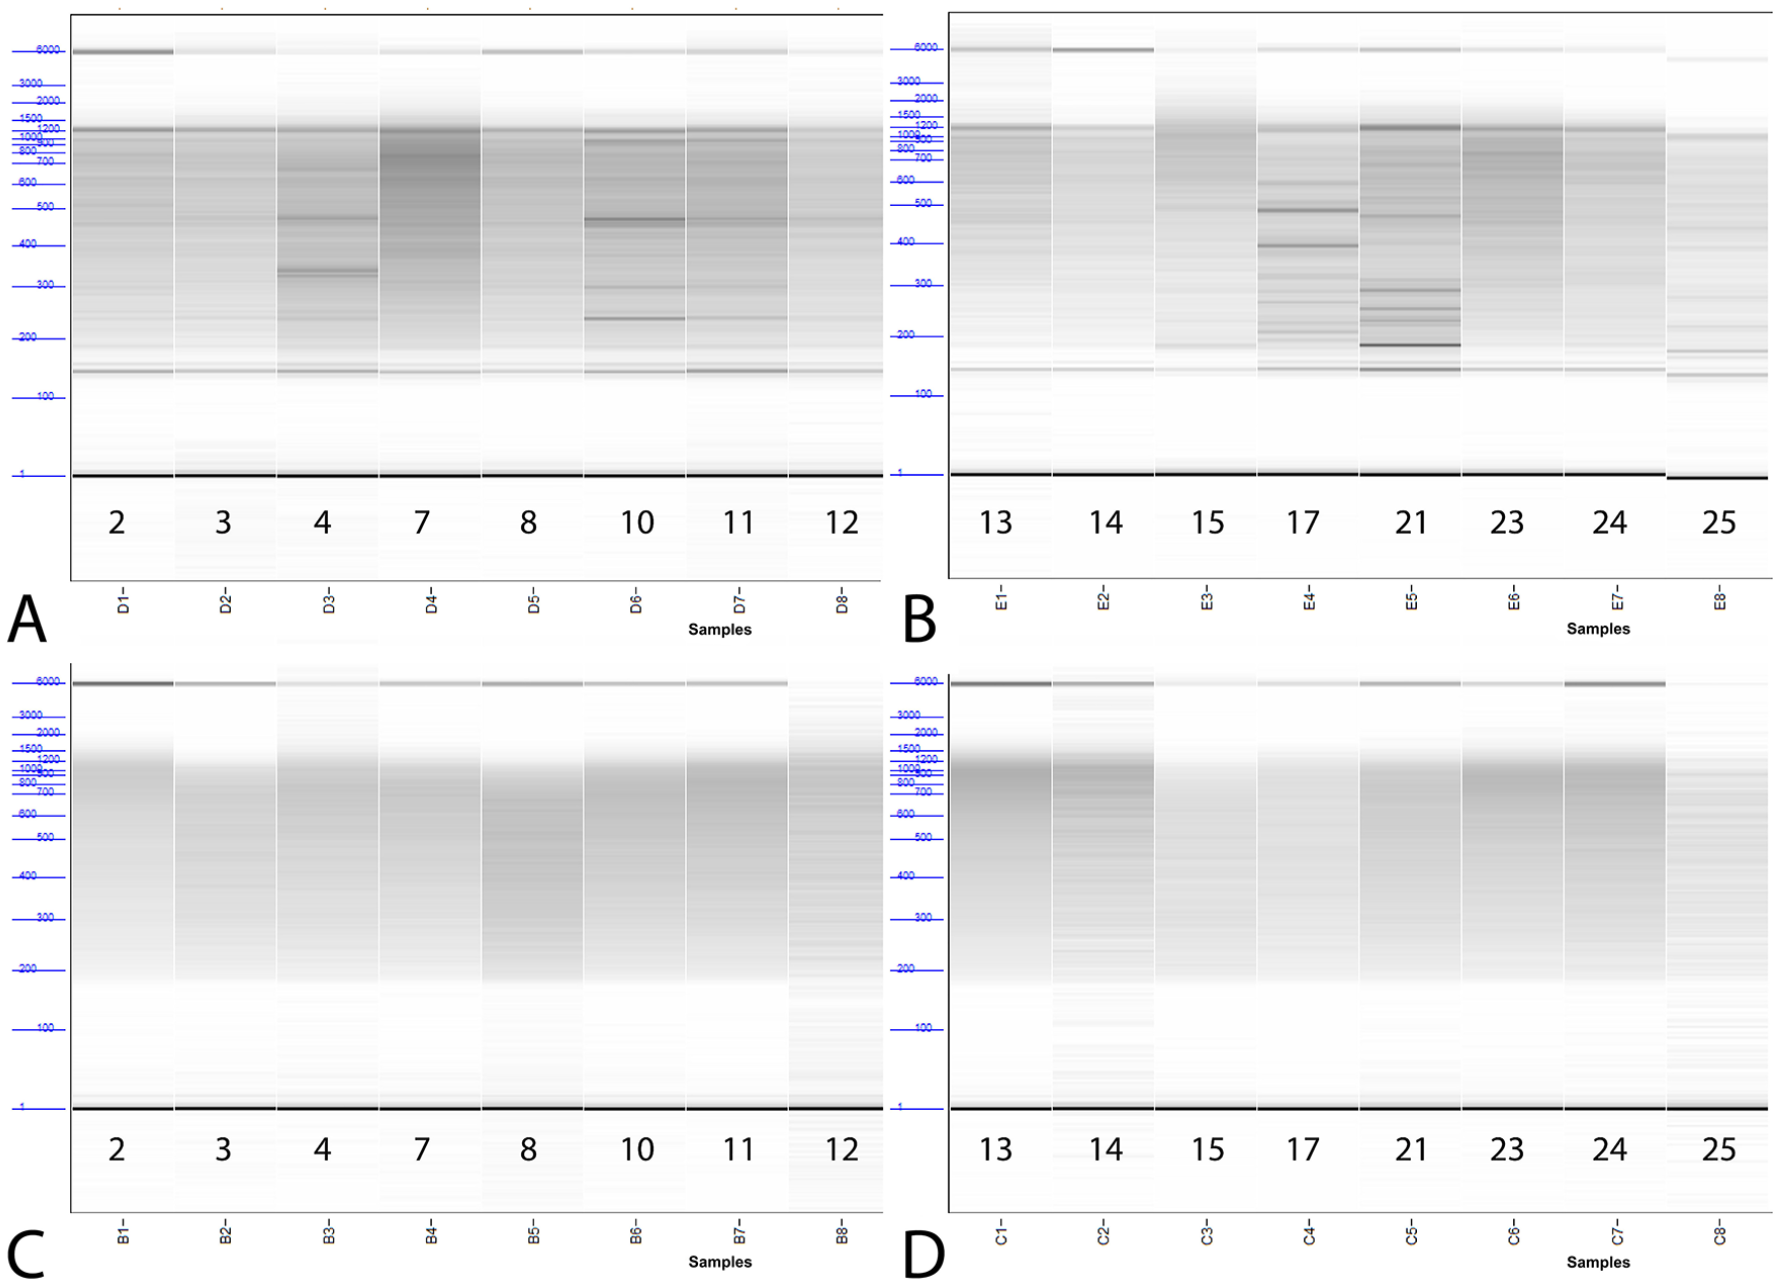
Fragment analyzer results of libraries prepared for sequencing using method A (
Fragment analyzer peak size data for each set 1 library run.
Empty adapter peaks were not observed for any set 2 samples, and 9 of 10 libraries from both amplification methods produced a single peak of 464–524 bp. The remaining method A sample had a primary peak (83.3% relative concentration) at 489 bp and a secondary peak (16.7% relative concentration) at 751 bp. The remaining method B sample had a primary peak (99.1% relative concentration) at 508 bp and a secondary peak (0.9% relative concentration) at 2,054 bp.
Method A produced more sequencing reads per sample than method B. However, reads from method B were longer and had higher quality scores. These differences were considerably less pronounced in set 2 samples compared to set 1 samples (Fig. 3).
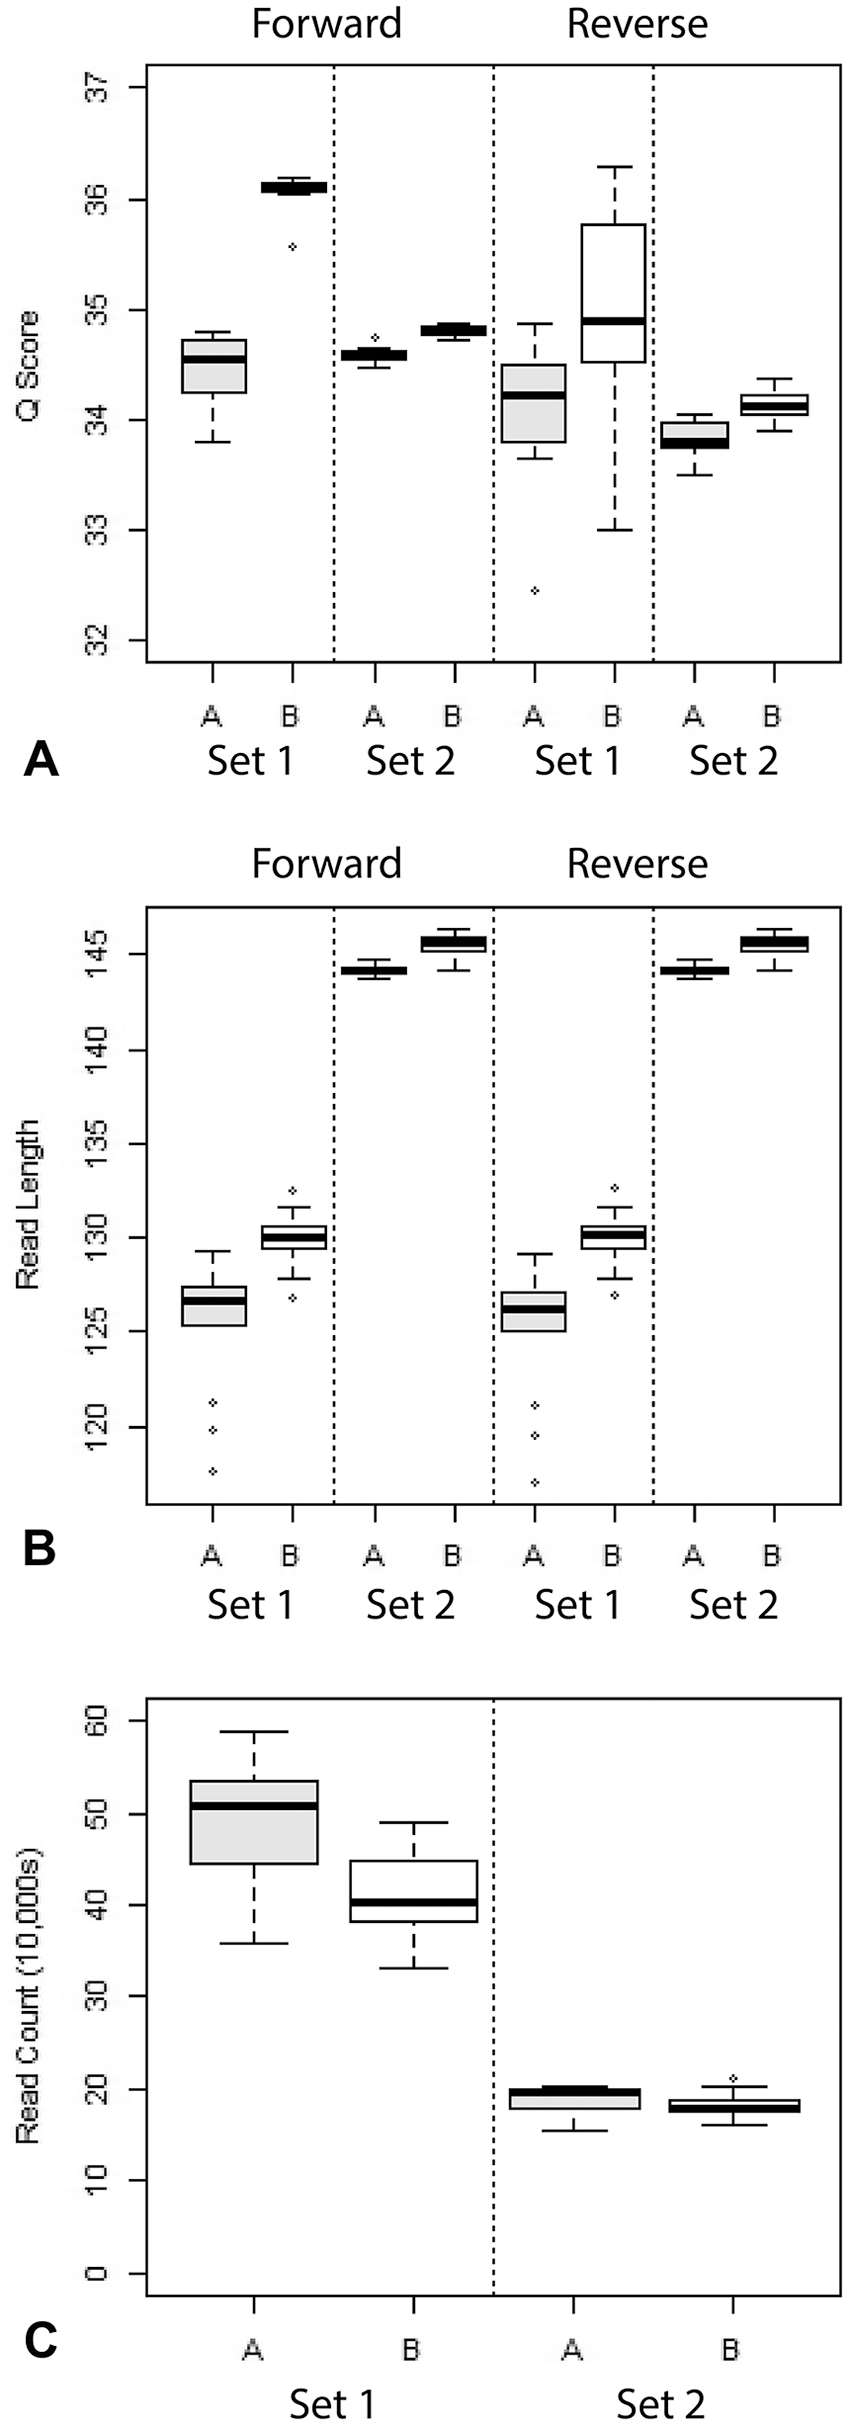
Comparison of
Viral subtyping and isolation
Of the 16 set 1 samples selected for sequencing, 7 were typed as N2 by PCR, 1 was typed as N8, and 8 were inconclusive. Using the sequence-based method, 12 were identified as H3N2, 2 as H3N8, and 1 as H1N1. Of the 10 set 2 samples, 9 were identified as H3N8 using the sequence-based method. One sample from set 1 and one sample from set 2 could not be subtyped. Sequence-based subtyping results were identical between method A and method B, and all samples for which a NA subtype was identified by PCR had matching results by sequencing. All H3N2 samples were from canine hosts, both H3N8s were equine, and the H1N1 was from a cat, but represented a human H1N1 pandemic virus (Table 3). Sequencing reads from both amplification methods for the samples that could not be subtyped were found to be primarily non-IAV, and these samples were excluded from further analysis.
PCR and sequence-based subtyping for set 1 samples.
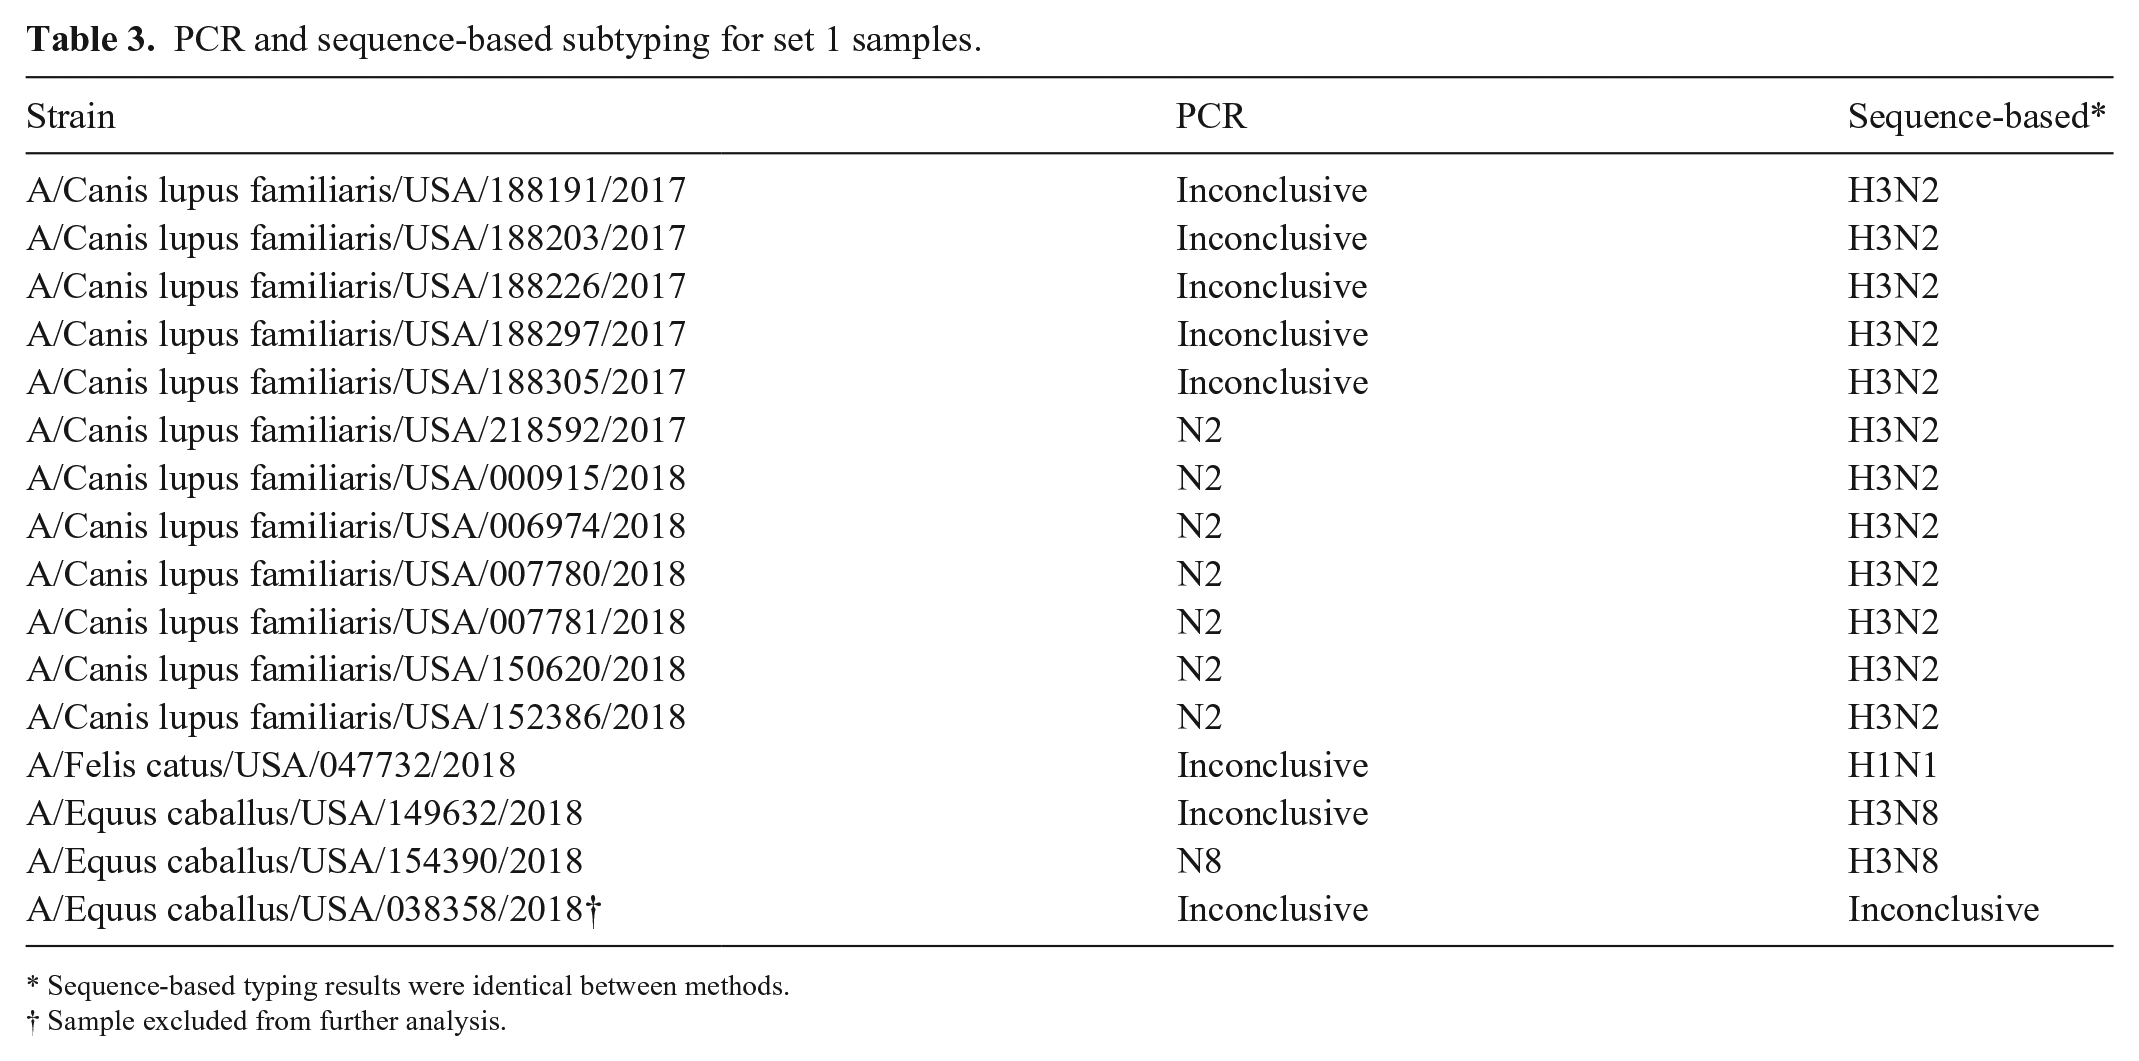
Sequence-based typing results were identical between methods.
Sample excluded from further analysis.
All 12 H3N2 samples had perfect matches to the N2 reverse primer and had 1 single-nucleotide variation (SNV) relative to the N2 forward primer, with a G in position 10 rather than an A. The 11 H3N8 samples differed from the forward primer sequence at 3 or 4 of 25 sites, with 1 sample from set 1 differing from the remaining 10 samples by 1 SNV. The reverse primer had lower homology with the 11 H3N8 sequences as a result of structural changes, and 2 sites in the primer binding region varied among H3N8 samples (Table 4). The sequence identified at the N2 and N8 primer binding regions did not differ between the 2 M-RT-PCR amplification methods for any pair of sequences.
N8 reverse primer comparison.
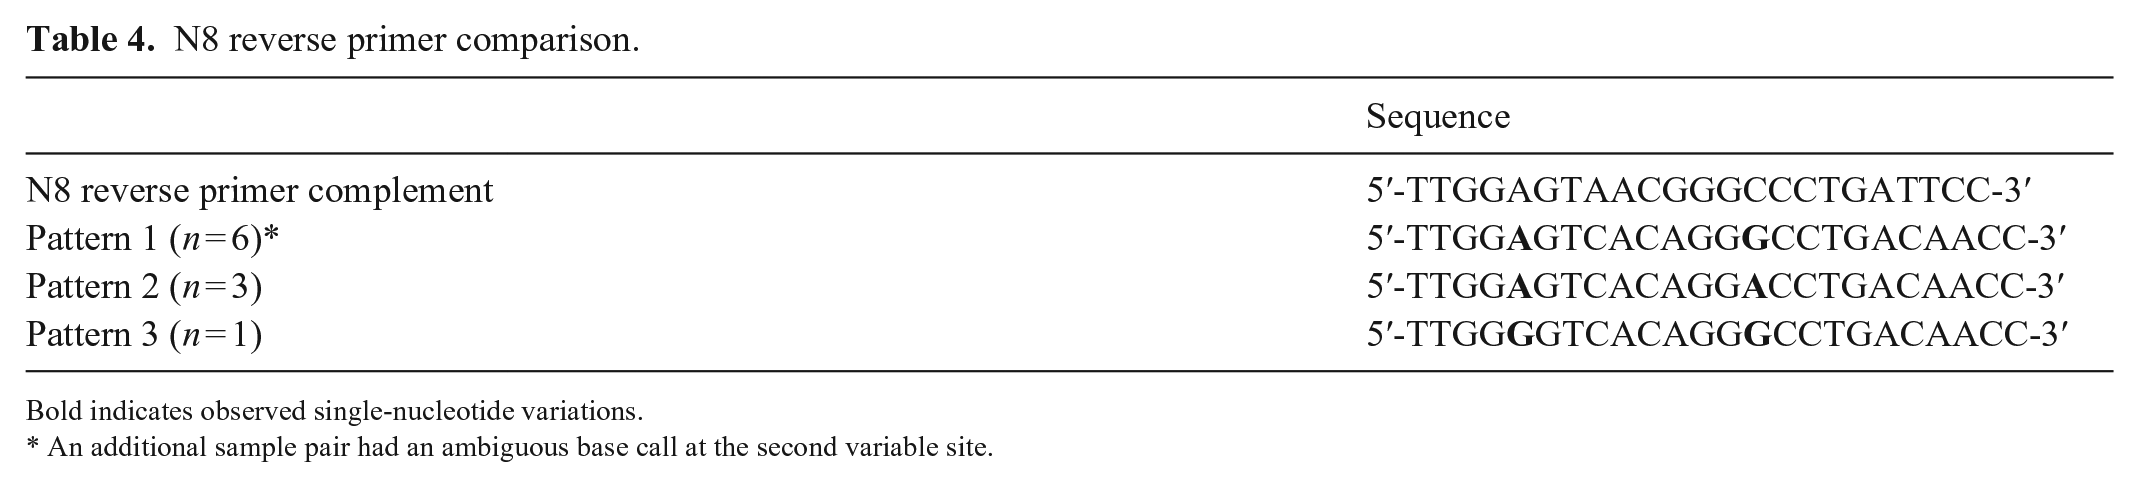
Bold indicates observed single-nucleotide variations.
An additional sample pair had an ambiguous base call at the second variable site.
IAV was successfully isolated from one of the samples that was completely sequenced and published in NCBI (A/Canis lupus familiaris/USA/006974/2018; Suppl. Table 1). Isolation was attempted unsuccessfully for samples A/Canis lupus familiaris/USA/218592/2017 and A/Felis catus/USA/047732/2018. The other 4 samples for which isolation was attempted (1 of which was successful) were not selected for sequencing.
Coverage
Overall coverage depth in H3N2 samples from set 1 was higher for method B than for method A, although this was not consistent across all segments. Method A produced higher coverage for segments 4 and 6, the HA and NA segments, and there was no difference in coverage between the 2 methods for segments 7 and 8. The remaining segments had higher coverage using method B. In set 1, method B produced significantly higher average relative coverage for segments 1 and 2, whereas method A produced higher coverage for segments 4, 6, 7, and 8 after normalizing to overall coverage depth (Fig. 4, Table 5). Method B also had higher overall coverage depth in set 2, but the average relative coverage did not differ between amplification methods for any segment (Table 5). In set 1, which had high overall coverage, unaligned and low coverage sites were rare, with most samples having 0 such sites by either method. However, in set 2, which had lower overall coverage, the median number of low coverage and unaligned sites for method 1 samples was 888, whereas for method 2 samples, the median was 0. The feline H1N1 sample in set 1, and 2 of the equine H3N8 samples in set 2, produced low coverage over most of segment 2 by both amplification methods. These were excluded from NCBI upload (Suppl. Table 1).
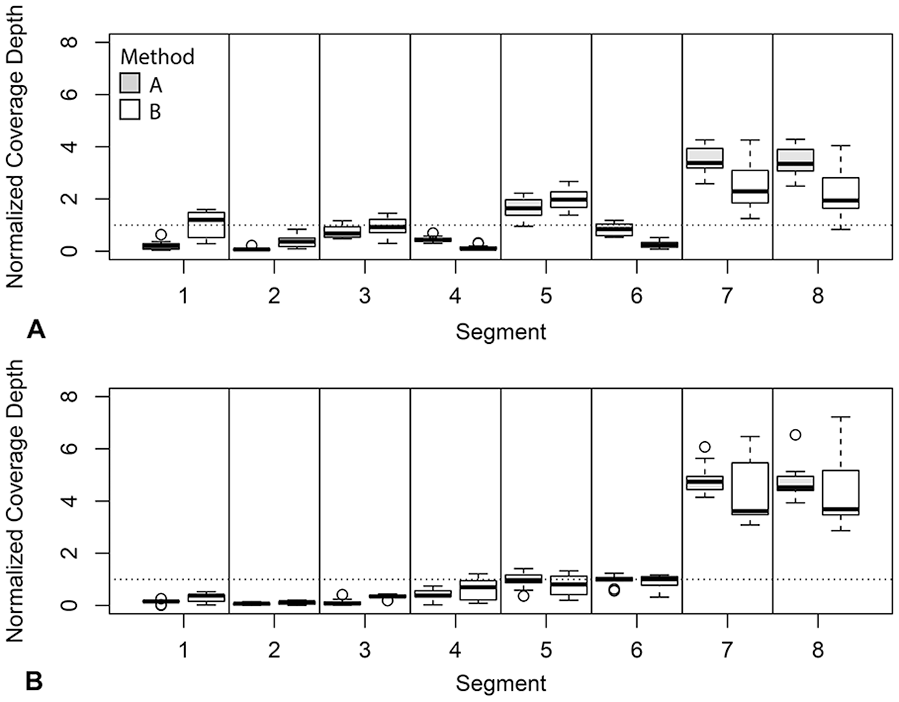
Boxplot of normalized coverage for each segment of influenza A virus using both M-RT-PCR methods for
Wilcoxon signed-rank test comparison of normalized coverage by segment between methods.
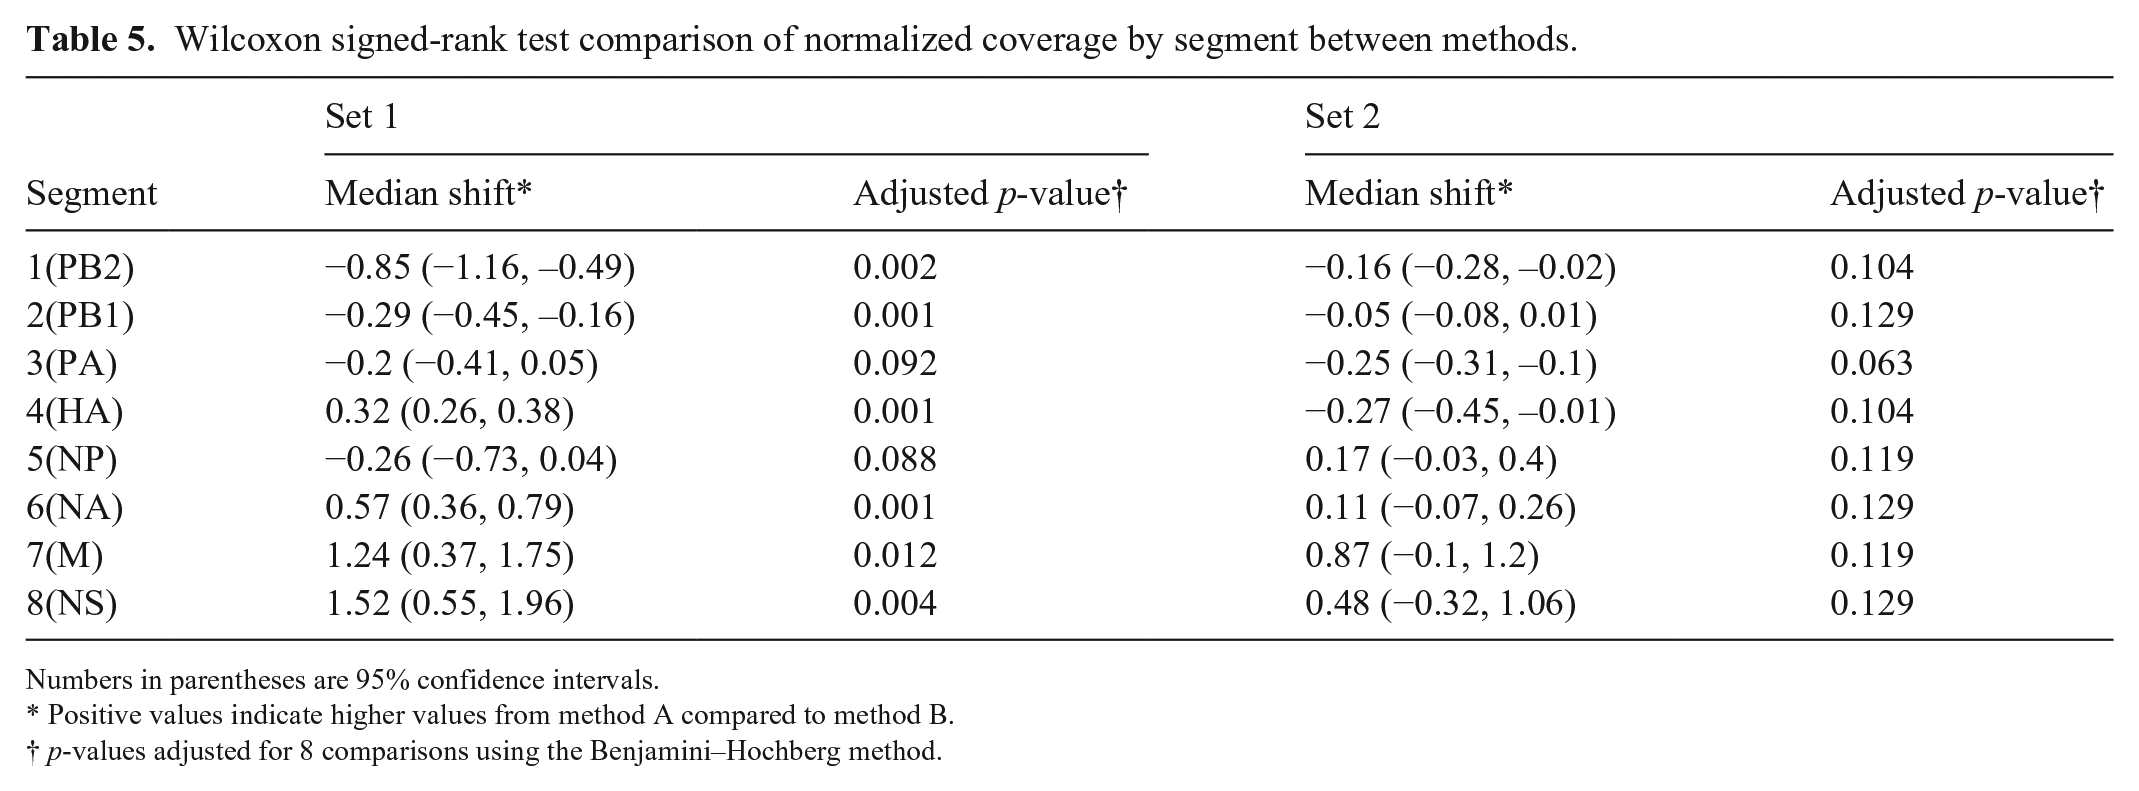
Numbers in parentheses are 95% confidence intervals.
Positive values indicate higher values from method A compared to method B.
p-values adjusted for 8 comparisons using the Benjamini–Hochberg method.
In H3N2 samples from set 1 and H3N8 samples from set 2, method A generally produced higher coverage at the ends of segments, with a drop in coverage in the middle section of the longer segments, whereas coverage for method B tended to be more consistent through the segment with drop-offs at the beginning and end. In set 1 samples, method A also produced a mid-segment jump in coverage for segment 3, starting at position 1,482. This effect was not seen using method B. A similar, although less pronounced, jump occurred at position 1,076 of segment 4. This jump was present in both methods but was of greater magnitude for method A (Fig. 5, Suppl. Fig. 1). Both jumps begin at regions with high similarity to the MBTuni-12 sequence, suggesting that the forward primer is binding at this site leading to additional amplification of a portion of the gene. A coverage jump was also evident in segment 3 of set 2 samples amplified by method B beginning at position 1,218; this jump did not correspond to a site region that was similar to MBTuni-12 (Suppl. Fig. 2).
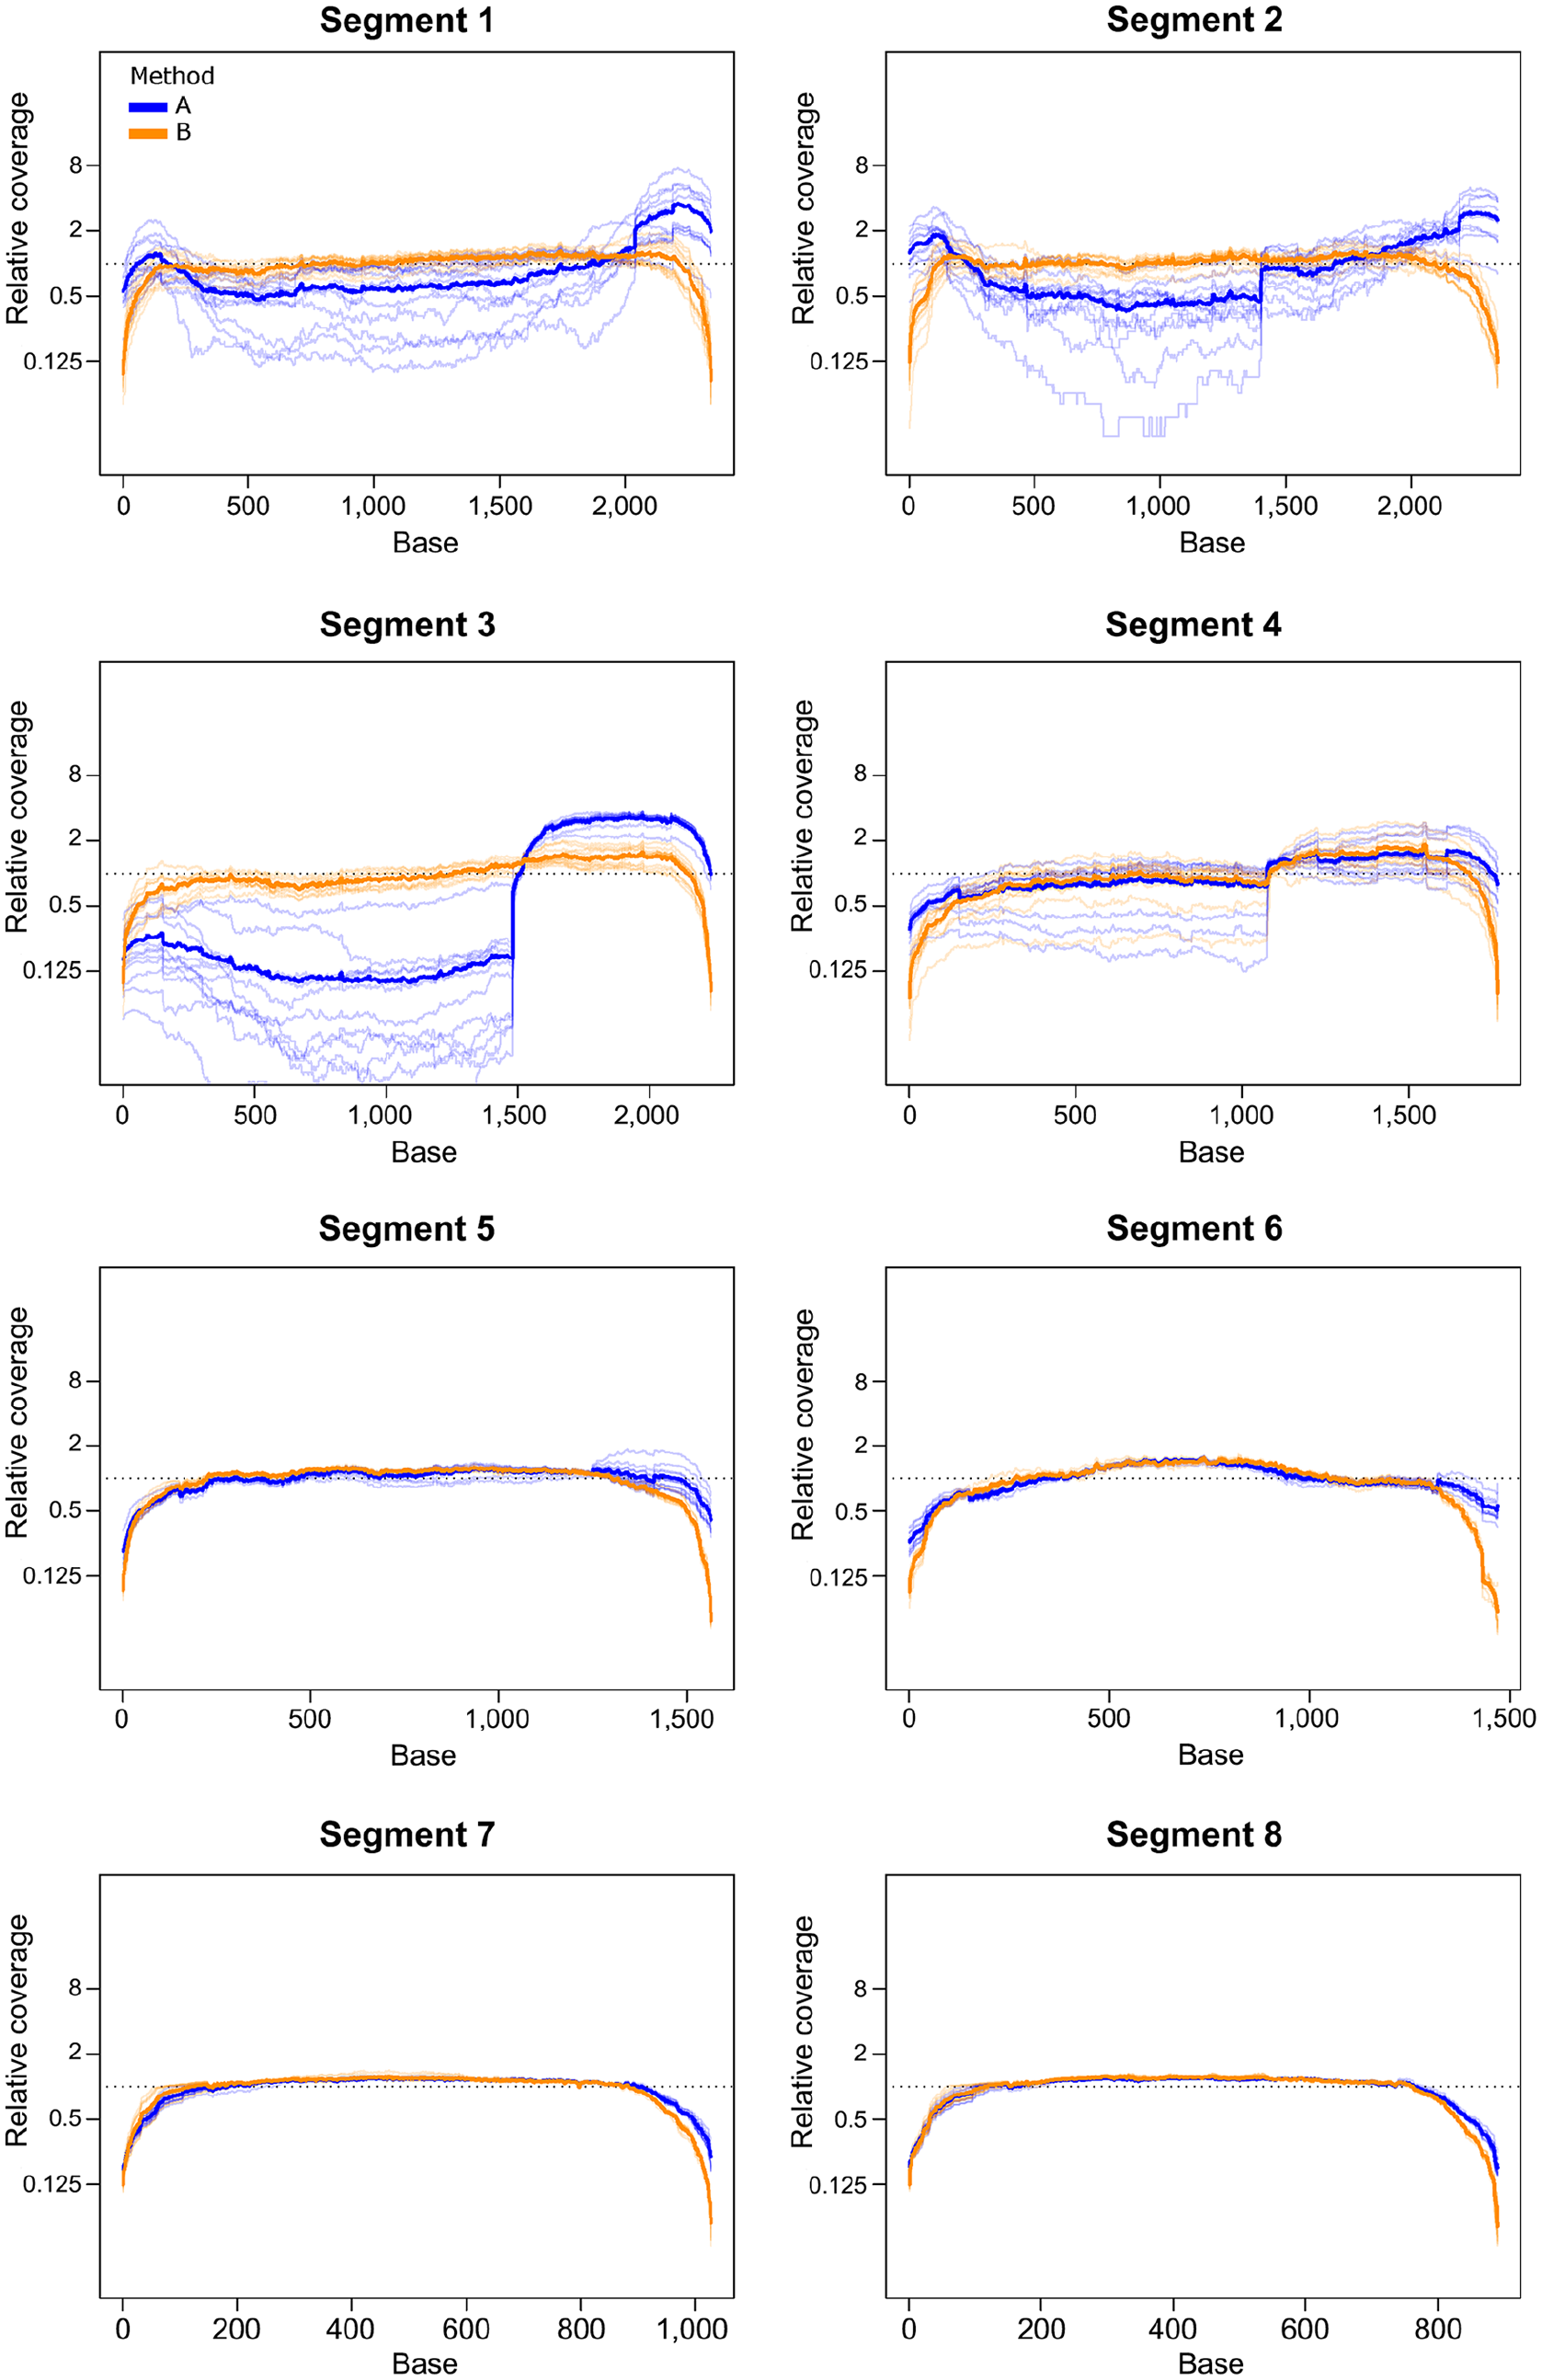
Relative coverage across each segment for set 1 H3N2 samples, with data for method A shown in blue and method B in orange. Each sample is represented by a light line, and the mean value for the method is shown as a dark line. The relative coverage for each base position is the number of reads at the base divided by the average coverage depth of the segment for a given sample.
Base calls
Considering all forms of variation (SNVs, indels, and uncalled sites), there were 27 alignment positions that varied in > 5 of the 12 set 1 H3N2 pairs. Of these, 16 are near the end (positions 1,445–1,460) of segment 6 (NA), which was uncalled in 5 sequences from method A and 1 from method B. An additional method A sequence called a deletion at position 1,446 but was identical to the reference and the rest of the samples over the rest of this span. This region overlaps with the longest single nucleotide repeat region in the reference genome and appears to correspond to a potential deletion or difficulties in accurately sequencing and mapping this region.
Another 3 positions correspond to the previously noted coverage jumps, suggesting ambiguity resulting from off-target primer binding rather than the template viral sequence. Position 1,482 of segment 3 was marked as ambiguous for all method A sequences, whereas it was called as an A for all method B sequences. The ambiguity in the method A sequences results from a split between A and G reads, with the Gs primarily being the first base in the read and likely corresponding to the last adapter base before the MBTuni-12 sequence in the primers. At position 1,489 of segment 3, there were 5 instances in which the base was ambiguous in the method A sequences and T in the method B sequences, 3 in which it was A in the method A sequences and T in the method B sequences, and 2 in which it was ambiguous in the method B sequences and A in the method A sequences. For the remaining 2 pairs, this position was ambiguous for both methods. This uncertainty was likely the result of homology with the MBTuni-12 sequence, which is identical to positions 1,483–1,494 of the reference sequence, aside from position 1,489, which is a T in the reference sequence and an A in MBTuni-12. Hence, some reads reflected the underlying viral sequence, whereas others corresponded to the primer sequence. Similarly, position 1,076 of segment 4 was called as a C in 7 sequences (1 in method A, 6 in method B), but was ambiguous in all others given conflict with the A at the beginning of the MBTuni-12 sequence.
The remaining 8 of these variable sites were position 4 of each segment, which varied in 10–12 of 12 pairs. These were also the only sites that varied among > 5 of the 9 H3N8 pairs from set 2 H3N8. At these positions, method A consistently called an A, whereas most sequences from method B marked these positions as ambiguous. For 3 set 1 samples, however, method B instead called a G at this position in segment 4. The differences in base calling at this site result from the 2 variations of the MBTuni-12 sequence used by method B.
Discussion
With WGS becoming more accessible to veterinary diagnostic laboratories, it is important to evaluate different methods and to assess their impact on downstream analysis, in order to establish well-characterized methods that can be shared more widely. Here, we compared 2 M-RT-PCR amplification methods. These methods differed in their thermocycling profiles, the oligonucleotide tails added to the conserved region of the amplification primers, and the presence (method B) or absence (method A) of a variable base at position 4 of the conserved region of the forward primer. Two sets of IAV samples were amplified using each of these methods, and the resulting PCR products were sequenced using 1 of 2 different library preparation kits and sequencing platforms.15,18 Set 1 consisted primarily of canine H3N2 samples; set 2 consisted of equine H3N8 samples. In set 1, although both methods produced adequate data, they differed in 2 key respects. First, analysis of fragment size following amplification with method A consistently showed peaks corresponding to empty adapters, which likely led to the lower read quality and mapping depth observed for this method. This difference was not apparent in set 2, suggesting that the difference in library preparation protocol led to more consistent fragment sizes. Second, method A appeared more prone to off-target amplification in the H3N2 samples from set 1, particularly in segments 3 and 4, resulting in dramatic variation in coverage depth across those segments. Method A also produced lower relative coverage in the middle of longer segments, corresponding to the increased number of low coverage and unaligned bases in the method A samples from set 1. However, method A generally produced less of a drop in coverage at the ends of segments in both the H3N2 and H3N8 sets. This did not result in base calling differences in these regions but could be more influential if coverage depth is low. Both methods had ambiguous base calls in regions with homology to the MBTuni-12 sequence, although, in method A, these were typically found in regions of off-target binding whereas in method B they were located consistently at the fourth base of each segment. Because of the higher quality sequencing output and more consistent ambiguity profile, method B may be preferable for routine testing and surveillance. Understanding these types of consistent features of different sequencing methods is critical for accurately interpreting comparisons with sequence data produced by other methods and developing an accurate picture of influenza viral dynamics.
Reliable subtyping is also a key component of influenza viral surveillance. We found that 5 of our 12 H3N2 samples had inconclusive PCR typing results, despite having strong matches to the N2 primers. Although these samples with inconclusive PCR results were ultimately found to match an expected subtype, PCR failures could also indicate the presence of an unexpected lineage. Sequencing allows these scenarios to be distinguished easily from one another and provides more detailed data to characterize the strains present. Furthermore, the time and costs associated with PCR subtyping rise as additional reactions are needed to identify a broader set of subtypes, whereas the cost of WGS remains constant. Given this increased resolution, reliability, and flexibility, M-RT-PCR and WGS for IAV characterization is more robust than PCR-based subtyping alone.
As new sequencing technologies gain wider usage in influenza viral surveillance, the effect of different amplification procedures and sequencing methods on the resulting data should be considered. Although our formal analyses were limited to comparisons between amplification methods, the differences in results between set 1, which was prepared using Nextera XT, and set 2, which was prepared using the Nextera DNA Flex kit (Illumina), suggest that the Flex kit may produce more consistent outcomes regardless of amplification method. Looking to the future, newer technologies such as nanopore sequencing may become more widely used for WGS in veterinary diagnostic laboratories. Several adaptations of the M-RT-PCR IAV amplification method have been published as a component of nanopore sequencing library preparation methods.12,14,32 Because of the long reads produced by nanopore sequencing, coverage variation across segments is likely to be less important than differences in the amplification between segments. However, further analyses will be needed to determine best practices.
Comprehensive genomic surveillance of veterinary IAV is necessary to characterize transmission of the virus in different host species and to understand the risk of species crossover events. Although our study focused primarily on canine H3N2 and equine H3N8 subtypes, the methods presented should be applicable to many hosts and viral lineages. However, issues such as inconclusive subtyping and within-segment coverage variation may differ in other host–virus systems. As WGS becomes more widely used in veterinary testing, the development of standardized methods and an understanding of the data produced by those methods are key to maximizing the animal and public health value of veterinary influenza viral surveillance.
Supplemental Material
sj-pdf-1-vdi-10.1177_1040638720933875 – Supplemental material for Method comparison of targeted influenza A virus typing and whole-genome sequencing from respiratory specimens of companion animals
Supplemental material, sj-pdf-1-vdi-10.1177_1040638720933875 for Method comparison of targeted influenza A virus typing and whole-genome sequencing from respiratory specimens of companion animals by Patrick K. Mitchell, Brittany D. Cronk, Ian E. H. Voorhees, Derek Rothenheber, Renee R. Anderson, Timothy H. Chan, Brian R. Wasik, Edward J. Dubovi, Colin R. Parrish and Laura B. Goodman in Journal of Veterinary Diagnostic Investigation
Footnotes
Acknowledgements
We thank A. Jarvis and N. Cavender Zylich for providing technical support. The Genomics Facility of the Biotechnology Resource Center at the Cornell University Institute of Biotechnology and the Cornell Veterinary Biobank assisted with fragment analyzer and sequencing instrumentation.
Declaration of conflicting interests
The authors declared no potential conflicts of interest with respect to the research, authorship, and/or publication of this article
Funding
The authors disclosed receipt of the following financial support for the research, authorship, and/or publication of this article: Sequencing capacity used for our study was supported by grants U18FD005144 and U18FD006448 from the Food and Drug Administration’s Veterinary Laboratory Investigation and Response Network (FDA Vet-LIRN).
Supplementary material
Supplementary material for this article is available online.
References
Supplementary Material
Please find the following supplemental material available below.
For Open Access articles published under a Creative Commons License, all supplemental material carries the same license as the article it is associated with.
For non-Open Access articles published, all supplemental material carries a non-exclusive license, and permission requests for re-use of supplemental material or any part of supplemental material shall be sent directly to the copyright owner as specified in the copyright notice associated with the article.