
Abstract
Flavobacterium columnare is the causative agent of columnaris disease in a variety of fish hosts. Using modifications to previously established protocols, a quantitative PCR (qPCR) assay was validated for the detection of 2 predominant F. columnare genomovars. The oligonucleotide primer and probe combination was designed to amplify a 203-bp region of the chondroitin AC lyase gene (GenBank AY912281) of F. columnare. There were no significant differences in amplification between genomovars. Comparable quantities of genomic DNA from 10 F. columnare strains, 5 representatives of each genomovar, produced similar results. Serial dilutions of purified PCR product demonstrated the limit of sensitivity for the assay was ~ 10 copies per reaction. The presence of gill and spleen tissue did not significantly affect the sensitivity of the assay. Comparably, bacterial DNA detected from the liver and kidney was less sensitive than pure bacterial DNA. However, detection from these tissues was within one order of magnitude of other tissues, indicating this reduction may have minimal analytic significance. This validated assay was used to approximate the minimum infectious dose for F. columnare isolate 94-081 in channel catfish and assess bacterial loads in gill and kidney tissues 48 h post-infection.
Introduction
Flavobacterium columnare, the causative agent of columnaris disease, is a globally distributed pathogen of fresh and brackish water fish. 14 A member of family Flavobacteriaceae, F. columnare produces spreading, rhizoid, discrete yellow-to-orange colonies on agar plates following 48-h incubation at 25–30°C. 14 Columnaris disease was first described from an outbreak in fingerling buffalo fish (Ictiobus sp.), with the most notable characteristic being the column-like masses of bacteria observed on wet mounts of affected tissue. 3 The commercial catfish industry in the southeastern United States has been particularly affected by F. columnare, and it is the second most common bacterial infection identified in catfish disease case submissions as compiled by the National Animal Health Monitoring System (USDA. Catfish 2010 Part II: Health and Production Practices for Foodsize Catfish in the United States, 2009. Available at: https://www.aphis.usda.gov/animal_health/nahms/aquaculture/downloads/catfish10/Cat10_dr_PartII_1.pdf).
Two major intraspecific genomovars of F. columnare were identified from cultured fish.1,19 F. columnare isolates were initially grouped into 2 genetic groups following analysis of the 16S ribosomal DNA by restriction-fragment length polymorphism. 1 Analysis using various molecular assays has led to some consensus, but there is no standard method used, to date, to determine F. columnare genomovars. There is limited correlation between genotypes assigned by rapid amplified polymorphic DNA analysis and virulence in channel catfish (Ictalurus punctatus) and golden shiners (Notemigonus crysoleucas). 18 Similarly, genomovar assignment based on pulsed-field gel electrophoresis (PFGE) profiles had some predictive value of the ability of an isolate to cause disease in juvenile channel catfish, but there was considerable variation in virulence within each genomovar. 15
Methods for identifying F. columnare can be hindered because of the slow growth of the bacteria in culture. 20 A preliminary diagnosis can be performed by observing characteristic “haystacks” formed by the bacteria in wet mount preparation of gills or other affected tissues, although isolation of the suspected pathogen is a more reliable method. Standard confirmatory tests require days to produce visible colonies on specialized media that typically have lower nutrient content than standard media.9,20 Isolation of F. columnare on agar plates can be complicated because diagnostic samples often contain numerous bacterial species that outcompete F. columnare. 14
Molecular detection using PCR is a rapid, more objective confirmatory test than conventional biochemical assays. 20 A PCR has been developed to detect F. columnare using the 16S-23S ribosomal DNA (rDNA) intergenic spacer region (ISR) of the rRNA operon. 20 Although specific for the pathogen, this standard PCR is semiquantitative and cannot give an accurate count of the bacteria present in a sample. A quantitative PCR (qPCR) assay amplifying the F. columnare chondroitin AC lyase gene was developed to determine quantities of F. columnare in fish tissues (blood, gills, and posterior kidney). 13 We describe a qPCR assay that was modified from the existing method 13 to improve specificity. The modified method was validated for the detection and quantification of F. columnare, and it was shown to detect strains from the 2 major genomovars affecting cultured fish.
Materials and methods
Bacteria
F. columnare isolates were chosen based on previous research that segregated strains into 2 distinct PFGE-designated groups. 15 Five isolates were chosen from each group (Table 1), one of which was reference strain F. columnare ATCC 49512. Genomovar A isolates tend to have moderate-to-high virulence in channel catfish, whereas genomovar B isolates tend to have lower virulence in channel catfish. 15 Archived isolates were revived from cryostocks by cultivation at 30°C for 48 h on F. columnare growth medium (FCGM) agar (Farmer BD. Improved methods for the isolation and characterization of Flavobacterium columnare [Master’s thesis]. Baton Rouge, LA: Louisiana State University, 2004. Available at: https://digitalcommons.lsu.edu/gradschool_theses/3590). FCGM contains tryptone (8.0 g/L), yeast extract (0.8 g/L), MgSO4.7H2O (1.0 g/L), CaCl2.2H2O (0.74 g/L), NaCl (5.0 g/L), and sodium citrate (1.5 g/L). Agar (8.0 g/L) is added for plates. Single colonies from each isolate were transferred and grown in 10 mL of FCGM broth incubated for 24 h at 30°C while shaking (200 rpm). In addition to the F. columnare strains, 5 isolates or strains of taxonomically related or environmentally significant non-target bacteria were included in the analysis to confirm specificity of the assay (Pseudomonas aeruginosa strain ATCC 27853, Flavobacterium johnsoniae ATCC 17061T, Edwardsiella piscicida C07-087, E. ictaluri 93-146, and Aeromonas salmonicida LKAS-1).
Flavobacterium columnare isolates or strains used in our study.
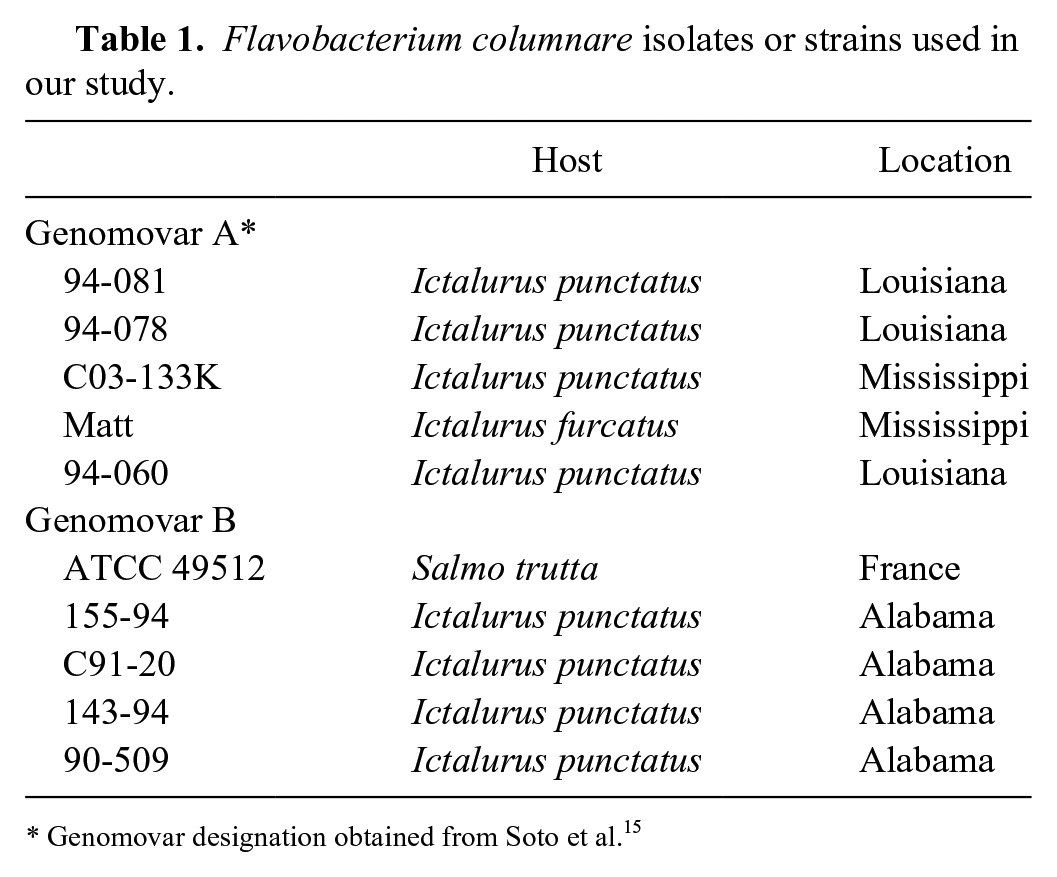
Genomovar designation obtained from Soto et al. 15
Each non-target isolate or strain was cultivated on brain-heart infusion (BHI; Bacto, Becton Dickinson, Franklin Lakes, NJ) agar plates and incubated for 24 h at 37°C (E. piscicida, P. aeruginosa) or at 30°C (A. salmonicida, E. ictaluri, F. johnsoniae). Individual colonies were grown in 10 mL of BHI broth overnight at 27°C. Aliquots (1 mL) from broth cultures of F. columnare and non-target species were pelleted by centrifugation at 5,000 × g for 10 min at 8°C. Genomic DNA (gDNA) was extracted from concentrated pellets (DNeasy blood and tissue kit; Qiagen, Hilden, Germany). Purified DNA was quantified spectrophotometrically (ND-1000 spectrophotometer; NanoDrop, Thermo Fisher Scientific, Waltham, MA) and diluted with DNA hydration solution (Qiagen) to 10 ng/µL. Aliquots of gDNA (10 ng/µL) isolated from broth cultures of all isolates or strains (F. columnare and non-target species) were used to determine variation in amplification from different F. columnare isolates or strains and determine specificity of the assay.
qPCR optimization
Modifications were made to a previously described qPCR assay 13 that amplified a 203-bp amplicon within the chondroitin AC lyase gene of F. columnare G4 (GenBank AY912281). 21 A modified reverse primer (5′-GTTGTATACACATCCGAAGTTCCAT-3′) was used because the original reverse primer sequence (5′-GCGGTTATGGCCTTGTTTATCATAGA-3′) had at least 1 bp mismatch with all of the sequenced F. columnare genomes, and had BLAST E values of 15 against all F. columnare genomes. The modified reverse primer had 100% identity with all sequenced F. columnare genomes except 2 that had 1 bp mismatch; BLAST E values for the modified primer with all F. columnare genomes were 0.001–0.25. The forward primer (5′-CCTGTACCTAATTGGGGAAAAGAGG-3′) and probe (5′-ACAACAATGATTTTGCAGGAGGAGTATCTGATGGG-3′) were as described previously. 13 Primers and probe were synthesized commercially (Eurofins MWG Operon, Huntsville, AL). The probe was labeled at the 5′-end with the reporter dye 6-carboxyfluorescein (FAM) and the 3′-end with 6-carboxy, N′-tetramethylrhodamine (TAMRA) quencher.
Optimal primer and probe combinations for the assay were identified using gDNA isolated from both F. columnare ATCC 49512 and 94-081. Reaction conditions were optimized in a series of 20-µL reactions with various combinatory quantities of primers (5, 10, 20 pmol/reaction) and probe (0.5, 1, 2 pmol/reaction) resulting in all possible combinations. The user-defined baseline threshold was set at 100 relative fluorescence units (RFUs) for all runs. Amplification reactions were performed (Stratagene Mx3005P instrument; Agilent Technologies, Santa Clara, CA) and analyzed using the accompanying software. Optimal conditions were determined to be 7.75 µL of PCR supermix (Environmental master mix, 2.0; Applied Biosystems, Carlsbad, CA), 10 pmol of each primer, 0.5 pmol of probe, and 5 µL of template DNA for a final concentration of 50 ng of gDNA in the reaction, and nuclease-free water to a total of 20 µL. Reactions were performed in triplicate using the following cycling conditions: 95°C for 10 min, followed by 40 cycles at 95°C for 15 s, and 60°C for 1 min.
Comparison of ExoSAP-IT and QIAquick PCR purification
For use as qPCR standards, target PCR amplicons were generated in 20-µL reactions consisting of 8 µL of PCR supermix (TaqMan environmental mastermix, 2.0; Applied Biosystems), 10 pmol of each primer, 5 µL of gDNA for a final concentration of 50 ng of gDNA in the reaction, and nuclease-free water to volume. Thermal cycling conditions were as above. Amplicons were visualized under ultraviolet light after electrophoretic migration in the presence of 1 mg/mL SYBR Safe (Invitrogen, Carlsbad, CA), to confirm the presence of the appropriately sized band. Amplicons were purified using 2 different commercial PCR purification kits: one utilizes an enzymatic reaction to degrade unused primers and dephosphorylate-free dNTPs (ExoSap-IT PCR product cleanup; Affymetrix, Santa Clara, CA), and one uses pH manipulation and salt precipitation to selectively bind DNA to a spin-column membrane (QIAquick PCR purification kit; Qiagen). We compared the 2 PCR product cleanup methods following a series of inconsistent results with standards created for our qPCR assay. PCR amplicons were quantified spectrophotometrically (NanoDrop ND-1000 spectrophotometer; Thermo Fisher Scientific). For each method of PCR purification, serial dilutions of the PCR amplicon (1 × 100–1 × 10⁵ copies) were analyzed in triplicate on 3 separate occasions to assess discrepancies between purification methods.
qPCR validation
Initial testing was performed to determine if copies of gDNA from 2 isolates from both genomovars could be accurately quantified using the qPCR assay. To determine sensitivity, linear dynamic range, repeatability, and reproducibility of the assay, serial dilutions of gDNA isolated from strain ATCC 49512 and isolate 94-081 were analyzed by qPCR. Dilutions ranged from 1 × 10⁶ to 1 × 101 copies of gDNA, estimated based on spectrophotometric quantification and a genome size of 3,162,432 bp for F. columnare ATCC 49512. 17 Dilution series were analyzed in triplicate on 3 separate occasions.
In addition, 10-fold serial dilutions of known quantities of bacteria were quantified for both ATCC 49512 and 94-081. First, the growth kinetics of each isolate or strain were determined to identify the logarithmic growth phase for F. columnare under these experimental conditions. Cultures were revived from cryostocks (−80°C) by streaking onto FCGM agar plates. After 48 h, isolated colonies were selected and placed in 10 mL of FCGM broth for 24 h with shaking (200 rpm). Dilution plate counts were performed at 8, 11, 12, 13, 15, and 16 h post-inoculation. This procedure was repeated twice.
Once growth kinetics were established, isolates were grown in 10 mL of FCGM broth for 12 h (late log-phase/early stationary phase) to an optical density of 0.8 at 600 nm, after which cultures were serially diluted 10-fold. Bacterial concentrations were determined by plate counts; aliquots (100 µL) from each dilution, with counts in the 100-µL aliquot ranging from 1.2 to 1.2 × 10⁷ colony-forming units (CFU) for 94-081 and 7.8 to 7.8 × 10⁷ CFU for ATCC 49512, were stored at −80°C until processing. Genomic DNA was isolated as described above, and gDNA from individual aliquots were analyzed in triplicate on 3 separate occasions.
Detection of F. columnare in fish tissues
All animal experiments were approved by the Mississippi State University Institutional Animal Care and Use Committee. Five fingerling catfish (I. punctatus) reared for disease research at the Mississippi State University College of Veterinary Medicine were euthanized by immersion in water containing tricaine methanesulfonate (300 mg/L). Biopsies (~ 25 mg) of gill, liver, spleen, and posterior kidney were collected aseptically, placed in 1.5-mL microcentrifuge tubes, and stored at −80°C until processing. At the time of autopsy, fish did not show any clinical signs of disease and were culture negative for F. columnare.
Broth cultures (10 mL) of F. columnare isolate 155-94 (genomovar B) were grown with shaking (200 rpm) for 12 h at 30°C. Each tissue biopsy was inoculated with 0.1 mL of F. columnare 155-94 culture, which was determined by standard plate counts to contain 7.42 × 10⁷ CFU/100 µL. For comparison, five 0.1-mL aliquots of the same F. columnare 155-94 broth culture were also processed. Genomic DNA was isolated from spiked tissues and broth aliquots (DNeasy blood and tissue kit; Qiagen, Venlo, Netherlands) and then analyzed by F. columnare qPCR using the reaction parameters described above. Samples were analyzed in triplicate, and quantities of target DNA in unknown samples were estimated by comparison to a concurrently run standard dilution series consisting of known quantities of target DNA (purified PCR amplicon) ranging from 1.0 × 100 to 1.0 × 10⁵ copies/reaction. Statistical analysis of tissues spiked with F. columnare was conducted (SAS v.9.4; Statistical Analysis Software, Cary, NC; alpha = 0.05).
Tissue concentrations following experimental infection
Experimental infections of channel catfish fingerlings (
Five fish from each tank were arbitrarily sampled 48 h post-infection and euthanized to determine F. columnare tissue concentrations. Gills and posterior kidneys were cultured on dilute Mueller–Hinton agar (a low nutrient medium containing 0.3% agar) 9 containing 5 mg/mL of neomycin sulfate and 200 units/mL polymyxin B. Gill and kidney tissue biopsies (~ 25 mg) were then placed in separate 1.5-mL tubes and stored cryogenically (−80°C) until processed for qPCR analysis. Moreover, the gills and kidneys from 17 fish that died during the trial were also cultured and the tissue stored for qPCR analysis. Genomic DNA was isolated from tissues, and qPCR was conducted as described above to determine tissue concentrations of F. columnare in gills and posterior kidneys.
Results
qPCR validation
Growth kinetics showed that both strain ATCC 49512 and isolate 94-081 were in logarithmic phase at 10–12 h post-inoculation (Suppl. Fig. 1). The qPCR assay was found to be highly repeatable and reproducible for both strains of F. columnare representing 2 different genomovars. Based on determined quantification cycle (Cq) values, 10-fold serial dilutions of gDNA from F. columnare ATCC 49512 and 94-081 were linear over 6 orders of magnitude (1 × 10⁶ to 1 × 101 copies), with the assay plateauing at ~ 10 copies of bacterial gDNA (Fig. 1). There were no significant differences in the sensitivity of the assay for isolate 94-081 (genomovar A) or strain ATCC 49512 (genomovar B). Based on the obtained Cq values, quantities of target DNA from the 2 cultures were within 1 order of magnitude of each other at each dilution. In addition, comparable amplification was observed from similar quantities of gDNA (50 ng) from all 10 F. columnare isolates (Table 2). Meanwhile, no amplification was observed from any of the non-target species.
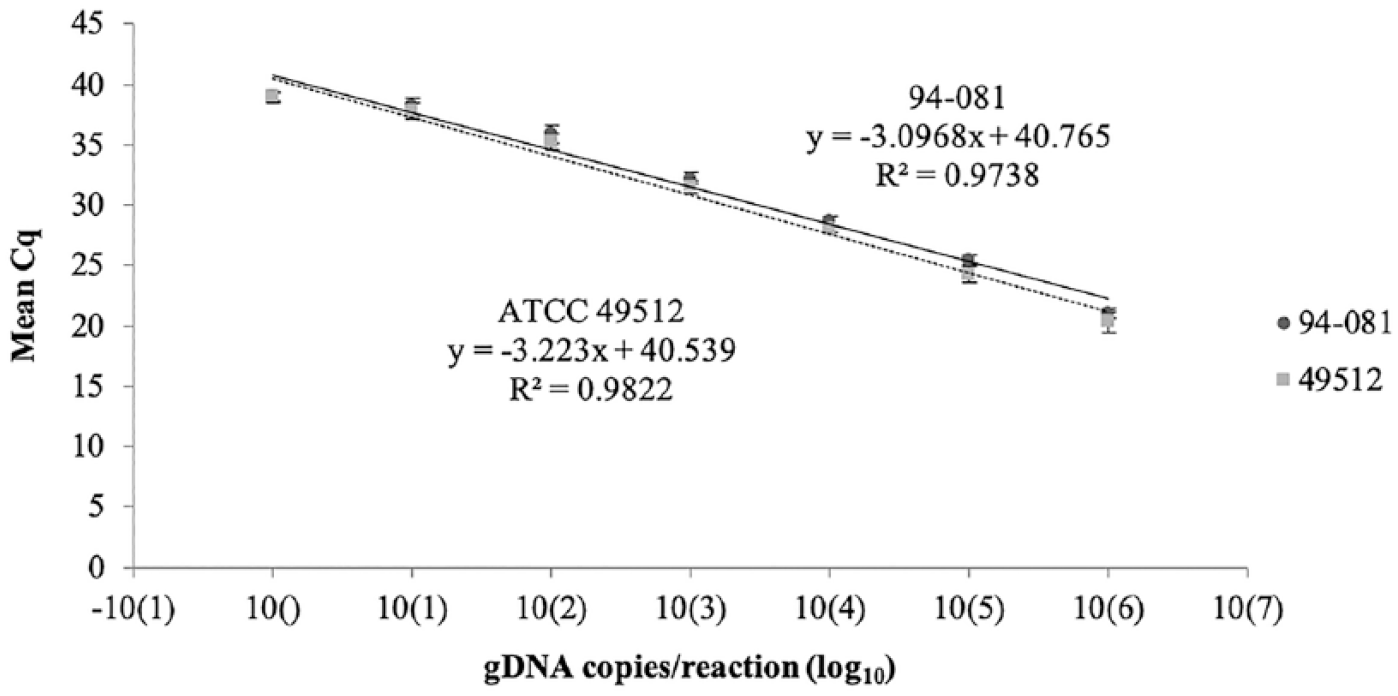
Quantitative PCR results for Flavobacterium columnare ATCC 49512 and 94-081: correlation between mean quantification cycles (Cq) and quantity of genomic DNA copies/reaction (expressed as log10). Values represent the mean of 3 independent runs (± SD).
Average quantification cycles of Flavobacterium columnare and other aquatic bacterial species.
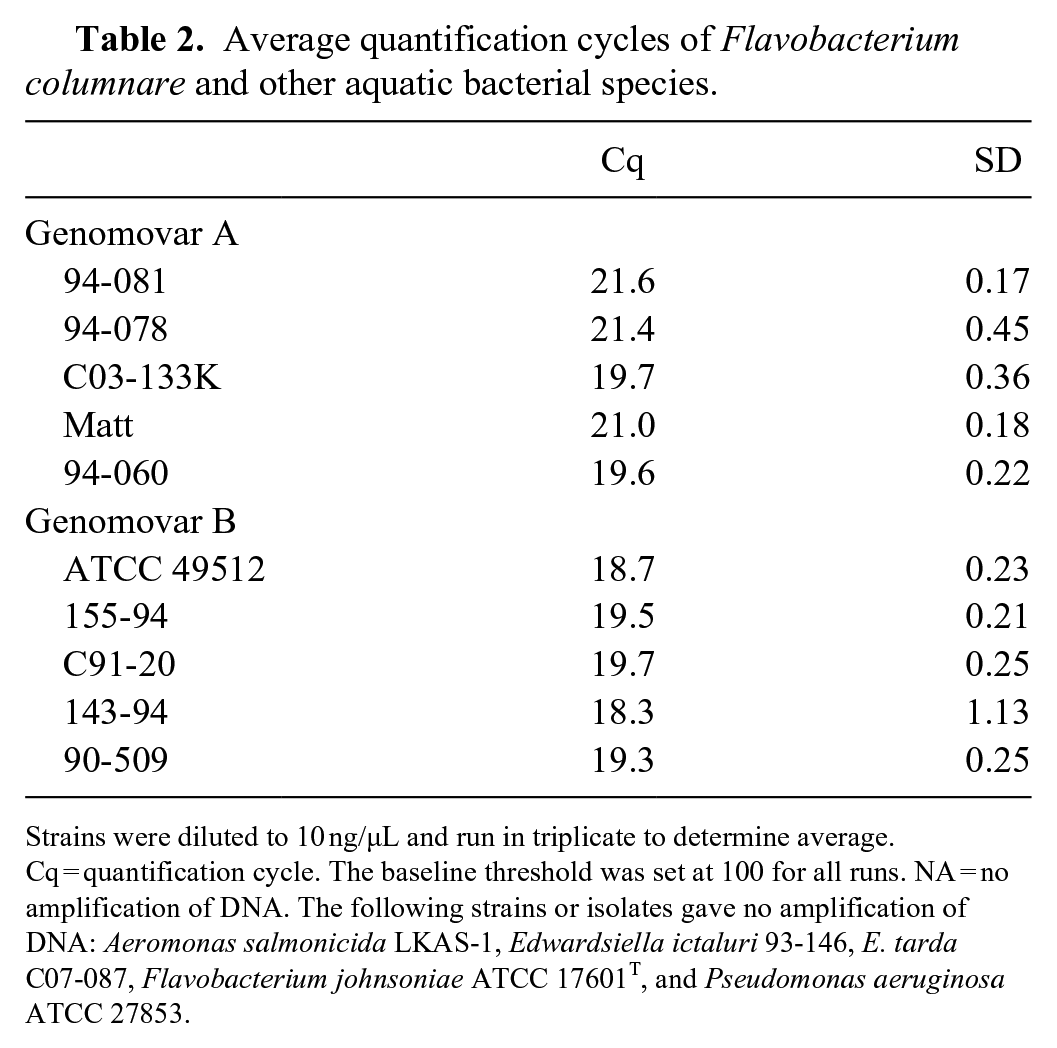
Strains were diluted to 10 ng/µL and run in triplicate to determine average. Cq = quantification cycle. The baseline threshold was set at 100 for all runs. NA = no amplification of DNA. The following strains or isolates gave no amplification of DNA: Aeromonas salmonicida LKAS-1, Edwardsiella ictaluri 93-146, E. tarda C07-087, Flavobacterium johnsoniae ATCC 17601T, and Pseudomonas aeruginosa ATCC 27853.
The relationship between Cq and CFU was determined from serial dilutions of 94-081 and ATCC 49512 broth cultures (Fig. 2). The efficiency (E) of the qPCR was calculated from the slope of the standard curve for each run using the equation E = 10(-1/slope) – 1. Values for all runs were within the accepted range of 90–110% 2 (94-081 range: 91.7–100%, mean: 95.8%; 49512 range: 96.8–103.1%, mean: 99.3%).
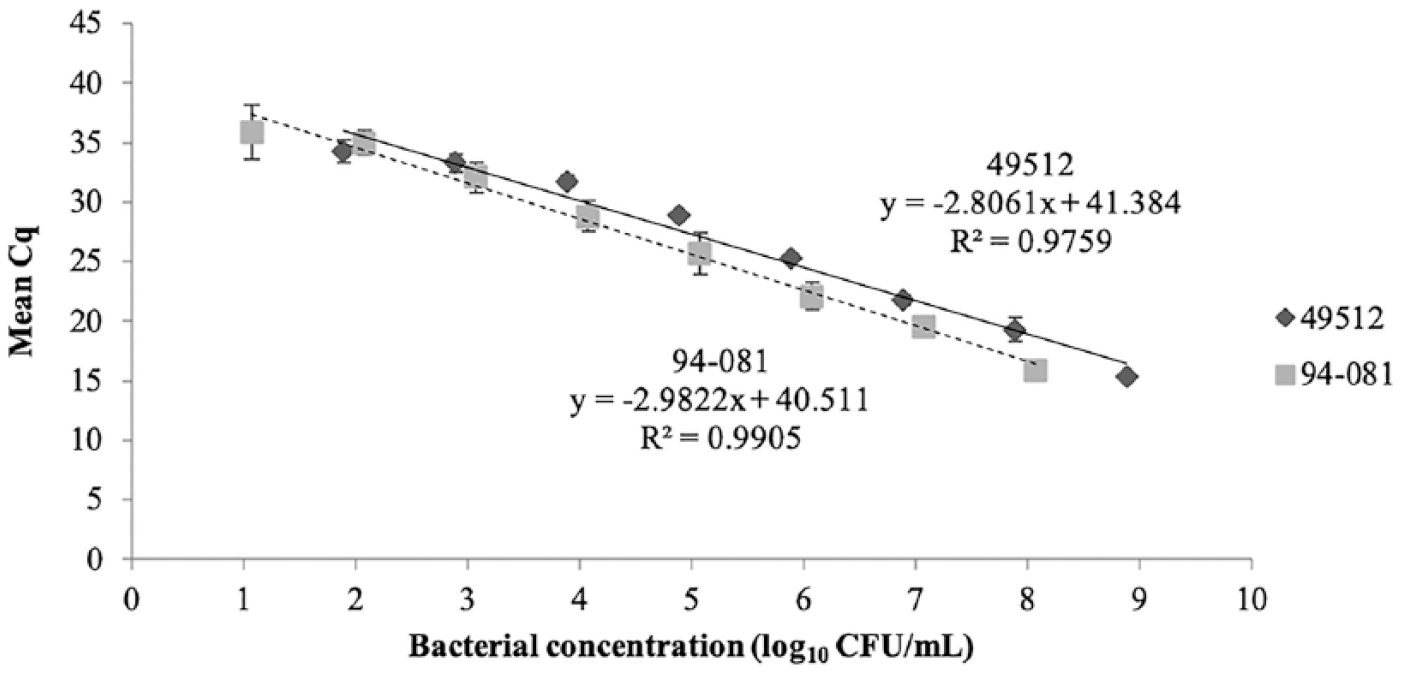
Mean quantification cycle (Cq) versus bacterial concentration (expressed as log10 CFU/mL) of Flavobacterium columnare ATCC 49512 and 94-081. Values represent the mean Cq (± SD) for known quantities of ATCC 49512 and 94-081 from 3 separate sample preparations, and each sample was run independently in triplicate. Error bars represent the SD.
Comparison of ExoSAP-IT and QIAquick PCR purification
Both purification methods resulted in a product that could be amplified by the F. columnare qPCR assay. However, spectrophotometric quantification of the PCR products purified by enzymatic reaction (ExoSAP-IT) led to an overestimation of copies of target DNA present. There was a discrepancy of nearly 1 order of magnitude between the theoretical estimations of purified PCR product and relative DNA quantities estimated by qPCR analysis, which indicated a sensitivity limit of ~ 100 copies of target DNA. Alternatively, serial dilutions of PCR amplicons purified using the spin-column method (QIAquick) corresponded well with theoretical estimations based on spectrophotometric quantification, indicating a linear dynamic range of at least 6 orders of magnitude and a sensitivity limit of ~ 10 copies of target DNA (Suppl. Fig. 2), which is consistent with similar qPCR assays.4,6,8,13
Detection of F. columnare in fish tissues
The assay detected F. columnare DNA from channel catfish gill, liver, spleen, and kidney biopsies spiked with 7.42 × 10⁷ CFU/100 µL of F. columnare isolate 155-94. The mean quantity of F. columnare DNA detected in spiked gill, spleen, kidney, and liver demonstrated < 1 order of magnitude between tissues. The quantity of target DNA detected was consistent in repeat runs, demonstrating minimal inter-run variability (Fig. 3). A significant difference between broth and tissue types was detected (F4 = 6.42, p = 0.0002). Means from broth culture, gill, and spleen tissue did not differ significantly from one another. Means from kidney and liver tissue differed significantly from broth culture, gill, and spleen tissue, but were not significantly different from one another.
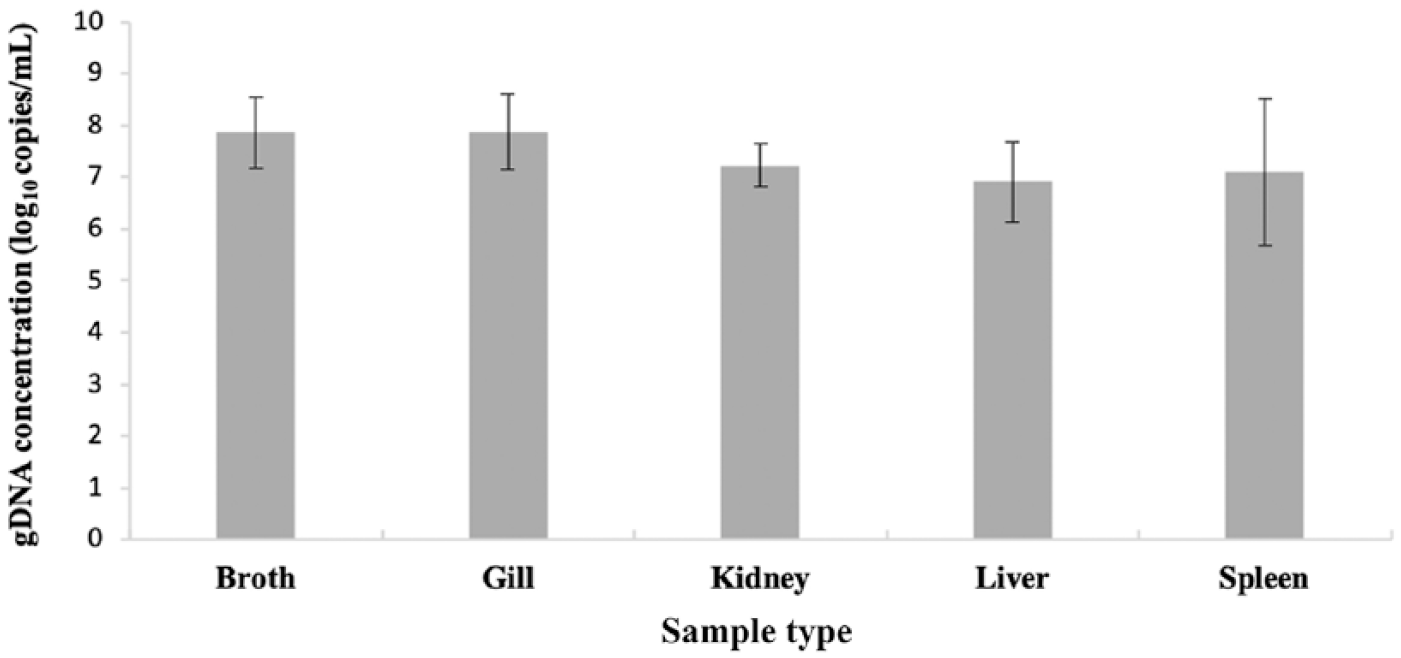
Genomic DNA (gDNA) copies of Flavobacterium columnare detected from broth culture and spiked catfish tissues (expressed as log10 copies/reaction) using quantitative PCR. Values represent the mean of 3 independent runs of 3 independent broth or tissue preparations. Error bars are ± 1 SD for the respective tissue.
Tissue concentration following experimental infection
During the experimental infection, there were no mortalities in the fish inoculated with sterile FCGM during the 7-d trial. Mortalities were observed within 48 h in the 1.9 × 10⁴ and 9.6 × 10³ CFU/L treatments. During the 7-d trial, 9 fish in the 1.9 × 10⁴ CFU/L treatment died within the first 48 h, leaving only 4 survivors at the 48-h sampling. Comparatively, 6 fish died in the 9.6 × 10³/L CFU treatment, 1 fish died in the 1.9 × 10³ CFU/L treatment, and 2 fish died in the 9.6 × 10² CFU/L treatment. The qPCR estimation of target DNA present in fish that died as a result of infection by F. columnare ranged from 8.9 × 10² to 7.6 × 10⁷ copies of target DNA/25 mg in gills, with an average of 1.0 × 10⁷ and a standard deviation (SD) of 2.1 × 10⁷ copies of target DNA/25 mg. The estimation of target DNA in the posterior kidney ranged from 1.3 × 10³ to 2.5 × 10⁵ copies of target DNA/25 mg, with an average of 5.0 × 10⁴ and SD of 8.4 × 10⁴ copies of target DNA/25 mg of tissue biopsy.
There was no consistent relationship between culture positive and PCR positive for either the gill or kidney tissue. Copy numbers were generally higher in gill tissue for the tanks that received a higher concentration of bacteria. After 48 h, 4 gill samples were positive for bacteria, whereas kidney samples were negative when using standard culture methods (Suppl. Table 1). Both the gill and kidney tissue from 3 of 19 fish sampled were culture and qPCR positive.
Discussion
F. columnare causes significant economic losses to commercial catfish producers.1,20 Rapid identification of the pathogen would allow early and cost-effective implementation of treatments. Our PCR primers and probe are specific to F. columnare, resulting in robust amplification from representatives of the 2 F. columnare genomovars most often associated with disease in farm-raised catfish. Our qPCR protocol can provide definitive detection of F. columnare infection within hours, as opposed to days using traditional culture methods.
F. columnare isolates display genetic variability that has been described using various molecular methods.1,15 Initial research divided the species into 3 distinct genomovars. 19 Two of these are major groupings; a third genetic group contains only a few known isolates. 19 The implications of the genetic differences between the genomovars are not completely understood, although virulence trials have shown a relationship between F. columnare genomovar and virulence in juvenile channel catfish. 15 The virulence of genomovar I isolates causes acute mortality in rainbow trout challenges with implications for possible host-specific association. 5 We validated a qPCR technique for the 2 primary genomovars of F. columnare.
Using our qPCR, detection of F. columnare DNA from spiked posterior kidney and liver tissue was less sensitive than detection from gill, kidney, and broth culture. This may be caused by compounds in the liver and kidney that are inhibitory to PCR, or it is possible that DNA isolation is less efficient from these tissues. The addition of an internal control might help to determine the presence of inhibitors in samples.
Although negligible mortality occurred in fish exposed to 9.6 × 10³ and 1.9 × 10⁴ CFU/L, F. columnare DNA was detected by qPCR in 3 of 5 fish sampled from both treatments, often in the absence of culturable bacteria. This suggests the qPCR assay can detect subclinical infections in apparently healthy fish or, alternatively, the qPCR detects residual nonviable bacteria from inactive infections. This is one limitation of PCR; it offers no information on the viability of the target bacteria. It is also noteworthy that all but 2 of the culture and qPCR results that did not match were at the threshold of clinical sensitivity for the qPCR assay.
Although the sensitivity of the qPCR is 10 copies of target DNA, the clinical sensitivity from tissues is closer to 1 × 10² CFU/reaction in each sample. Reducing the amount of elution buffer used in DNA isolation can increase sensitivity, but this also increases the risk of potential inhibitory components present in the DNA preparation. This is a general limitation to using PCR to detect a pathogen from tissues that may have inhibitory substances.
The reliability of standards is a critical issue in assays dependent on qPCR-based quantification. Purified PCR products are often employed for the generation of standard curves because it is relatively easy and affordable to generate large quantities of target DNA. 6 Purified PCR amplicons have been employed reliably in several assays developed for the molecular detection of fish pathogens.7,8,10,16 Although ancillary to the development of this assay, the differences in estimated copy number as a function of amplicon purification methodology is an important finding. Based on our data, it appears that purification based on enzymatic processes can cause overestimation of target DNA quantity compared to purification using a spin-column platform. This could be attributed to the presence of residual oligonucleotides and nucleotide monomers that would otherwise be removed by spin-column purification. As such, the method of purification should be considered if qPCR standards will be generated from purified PCR products.
The mortalities that occurred in the 2 highest doses (1.9 × 10⁵ and 9.6 × 10⁴/L) of our trial within 48 h emphasizes the need for a rapid and reliable assay. Completion of the 94-081 genome11,12 along with the completed genome of ATCC 49512 17 will enable future development of assays that discriminate between the 2 genomovars. Future research utilizing qPCR to explore the course of F. columnare infections might reveal better ways to manage F. columnare in cultured and wild fish populations.
Supplemental Material
Supplemental_material – Supplemental material for Validation of a quantitative PCR assay for the detection of 2 Flavobacterium columnare genomovars
Supplemental material, Supplemental_material for Validation of a quantitative PCR assay for the detection of 2 Flavobacterium columnare genomovars by Gordon D. Gibbs, Matthew J. Griffin, Michael J. Mauel and Mark L. Lawrence in Journal of Veterinary Diagnostic Investigation
Footnotes
Acknowledgements
We thank Michelle Banes for her technical assistance.
Declaration of conflicting interests
The authors declared no potential conflicts of interest with respect to the research, authorship, and/or publication of this article.
Funding
This research was supported by the National Institute of Food and Agriculture, US Department of Agriculture, Project MIS-371530; the U.S. Department of Agriculture/Agriculture Research Service–Catfish Health Initiative; the Mississippi State University College of Veterinary Medicine; and the Mississippi Agriculture and Forestry Experiment Station.
Supplementary material
Supplementary material for this article is available online.
References
Supplementary Material
Please find the following supplemental material available below.
For Open Access articles published under a Creative Commons License, all supplemental material carries the same license as the article it is associated with.
For non-Open Access articles published, all supplemental material carries a non-exclusive license, and permission requests for re-use of supplemental material or any part of supplemental material shall be sent directly to the copyright owner as specified in the copyright notice associated with the article.