
Abstract
Serum cobalamin and folate are often measured in cats and dogs as part of laboratory testing for intestinal disease, small intestinal dysbiosis, or exocrine pancreatic deficiency. We performed an analytical validation of human immunoassays for cobalamin and folate measurement (AIA-900 analyzer, Tosoh Bioscience) and compared results with those obtained using chemiluminescence assays (Immulite 2000 analyzer, Siemens Medical Solutions Diagnostics). Accuracy, precision, total observable error (TEobs%), and σ values were calculated for the immunoassays. Correlation and agreement were evaluated with Deming regression, Passing–Bablok regression, and Bland–Altman analysis. Cobalamin intra-assay and inter-assay CVs were 1.8–9.3% and 2.6–6.8%, respectively. Folate intra-assay and inter-assay CVs were 1.5–9.1% and 3.4–8.1%, respectively. TEobs (%) were ≤19 and ≤31 for cobalamin and folate, respectively. Sigma values were 3.60–11.50 for cobalamin and 2.90–7.50 for folate. Regression analysis demonstrated very high or high correlations for cobalamin [r = 0.98 (dogs), 0.97 (cats)] and folate [r = 0.88 (dogs), 0.92 (cats)] but Bland–Altman analysis revealed poor agreement for both. The immunoassays had good analytical performance for measuring cobalamin and folate in both species. Results obtained by the 2 analyzers cannot be used interchangeably and should be interpreted using instrument-specific reference intervals. Further studies are required to establish immunoassay-specific reference intervals and to evaluate the diagnostic performance and clinical utility of the analyzer for these analytes.
Introduction
Serum cobalamin and folate are commonly measured in cats and dogs as part of laboratory testing, primarily for the diagnosis of intestinal disease, small intestinal dysbiosis, or exocrine pancreatic deficiency. 6 Cobalamin (vitamin B12) is absorbed through specialized receptors in the ileum after binding to intrinsic factor (IF). IF is synthesized by the pancreas in cats, 19 and the stomach, pancreas, and salivary glands in dogs.4,44 Cobalamin acts as a cofactor for several enzymatic systems in mammals and plays an important role in the synthesis of amino acids and DNA.6,10 Diseases affecting the distal small intestine, the production of IF (e.g., exocrine pancreatic insufficiency) or the metabolism of cobalamin by bacteria (e.g., small intestinal dysbiosis), as well as certain metabolic diseases (e.g., feline hyperthyroidism) have been associated with decreased serum cobalamin concentrations.8,10 Folate (vitamin B9) is absorbed via specific carriers in the proximal small intestine and has major functions in the transfer of one-carbon units in several biosynthetic pathways involved in DNA and amino acid synthesis and cellular metabolism. 35 Decreased serum levels reflect proximal small intestinal disease, whereas increased concentrations can be associated with small intestinal dysbiosis, given that folate can be synthesized by bacteria. 6
In the human field, several commercial immunoassays are available for the measurement of cobalamin and folate; validation and method comparison studies have demonstrated these assays to have acceptable levels of precision, with good-to-moderate correlation but poor agreement between different methods.30,39 However, in veterinary medicine, analytical validation studies of cobalamin and folate assays are not only sparse5,22,43 but all available publications utilize the same human chemiluminescence immunoassays (Immulite, Siemens Healthineers, Erlangen, Germany).3,8,22,43 Although the publication of more in-depth validation studies on the chemiluminescence immunoassays would be welcome, these assays have been widely accepted as having satisfactory linearity, recovery, and precision. Published studies tend to corroborate precision data provided by the manufacturer [cobalamin CVs intra-assay: 13%, 7%, and 6.7%; inter-assay: 15%, 6%, and 7.9%; folate CVs intra-assay: 6.9%, 4.1%, and 2.4%; inter-assay: 8.8%, 5.7%, and 5.2%; each for low-, medium-, and high-quality control material (QCM), respectively]. However, no studies have reported total observed error (TEobs) values or utilized sigma (σ) metrics to evaluate the performance of these methods for veterinary use, to our knowledge.
The evaluation of total error and sigma metrics are accepted as part of quality control monitoring in human medical laboratories, and also as adjuncts to classic analytical validation studies.32,48,50 By quantifying the analytical performance of a method and comparing it to preset analytical quality specifications [total allowable error (TEa)], the quality of an analytical process can be evaluated objectively based on performance goals. In the context of immunoassays, these techniques are used and recommended in many human validation studies.14,25,37,45,51 Although not frequent elements of veterinary analytical validation studies, incorporation of these methods has been recommended,23,32 and they feature in several publications assessing the performance of veterinary biochemistry analyzers.13,27
Among the immunoassay analyzers available for use in human patients is the AIA-900 (Tosoh Bioscience, Tokyo, Japan), which can measure a variety of analytes,7,53 including serum cobalamin and folate. Three human Tosoh assays, namely thyroxine (T4), cortisol, and adrenocorticotropic hormone (ACTH), have been validated and are available for use in dogs, cats, and horses.26,29
We evaluated the accuracy, precision, TEobs, and σ values of the Tosoh immunoassays for measuring cobalamin and folate and compared the Tosoh results with those obtained by the Immulite chemiluminescence assays that are used routinely in dogs and cats.
Materials and methods
Our study took place at Langford Diagnostic Laboratories (Bristol, UK) between December 2015 and April 2017 after approval of the study protocol by the Animal Welfare and Ethical Review Board of the University of Bristol (VIN/17/040).
Immunoassays
Tosoh
Cobalamin and folate were measured in our laboratory on the AIA-900 analyzer (Tosoh Bioscience), which utilizes 2-site immunoenzymometric assays for serum. For cobalamin measurement, the serum sample is automatically pre-treated with dithiothreitol, sodium hydroxide, and potassium cyanide. This releases cyanocobalamin from serum-binding proteins, converting it into a stable, measurable form. Serum is placed in a test cup containing magnetic beads coated with murine monoclonal anti-fluorescein antibody. A set amount of porcine fluorescein-labeled IF and alkaline phosphatase–labeled cobalamin are added to the sample and incubated. During this time, the patient’s cobalamin competes with the labeled cobalamin for binding to fluorescein-labeled IF. The latter binds to the magnetic beads, which are then washed to remove any unbound cobalamin. The beads are incubated with a fluorogenic substance (4-methylumbelliferyl phosphate), which reacts with alkaline phosphatase, and the resulting fluorescence is measured. The amount of cobalamin in the patient sample is inversely proportional to the labeled cobalamin and can be calculated using concentration curves based on known amounts of labeled cobalamin. The measurement of folate uses the same principle and antibody type, except that the IF is replaced by a bovine folate-binding protein. Calibration, daily checks, and maintenance procedures were carried out as described by the manufacturer (Operator’s manual, automated enzyme immunoassay analyzer AIA-2000, AIA-360, AIA-900, AIA-600II, AIA-1800, CD-ROM, 2013; Tosoh Europe, Tessenderlo, Belgium). Daily checks included analyzing in duplicate the 3 manufacturer-supplied human QCM at 3 different concentration levels (QCMLow, QCMMedium, QCMHigh). A sample volume of 200 μL (cobalamin) and 160 µL (folate) was required. The manufacturer’s working ranges were 37–1,480 pmol/L for serum cobalamin and 1.1–45.3 nmol/L for serum folate concentrations.
Immulite
Cobalamin and folate were measured at an external referral veterinary laboratory (Axiom Veterinary Laboratories, Newtown Abbott, UK) on the Immulite 2000 analyzer (Siemens Medical Solutions Diagnostics, Flanders, NJ), which employs a solid-phase, 2-site, sequential chemiluminescence immunometric assay. The assay can be performed on serum or heparinized plasma but only serum was used in our study.
For cobalamin analysis, the serum or plasma sample is automatically pre-treated with dithiothreitol, sodium hydroxide, and potassium cyanide to release cobalamin from binding proteins and inactivate the binding proteins. The serum is then transferred to a test unit, which contains a cobalamin-coated polystyrene bead and a set amount of porcine IF, and the test unit is incubated. During this time, the patient’s cobalamin competes with the bead-bound cobalamin for binding to IF. Alkaline phosphatase–labeled murine monoclonal anti-porcine IF antibody is then added, which binds to IF, and any unbound cobalamin is washed off the beads. A chemiluminescent substrate is added and hydrolyzed in the presence of alkaline phosphatase, resulting in production of a chemiluminescent agent. The amount of light emitted reflects the amount of bound cobalamin and is inversely proportional to the amount in the patient’s sample. The folate assay uses the same principle and antibody type, except that the IF is replaced by folate-binding protein. The Immulite required a sample volume of 75 µL and 50 µL for cobalamin and folate measurement, respectively. The manufacturer’s working ranges for these immunoassays were 110–740 pmol/L for serum cobalamin and 2–54 nmol/L for serum folate concentrations.
Internal precision data supplied by the external referral laboratory performing the Immulite assays indicated inter-assay CVs of 5.8%, 5.5%, and 7.8% for cobalamin, and 8.7%, 7.6%, and 8.3% for folate, for low, medium, and high QCM, respectively (Skeldon N, Axiom Laboratories, pers. comm., 10 July 2018). Reference intervals (RIs) established at the external referral laboratory were 200–400 pmol/L and 220–500 pmol/L for canine and feline cobalamin, respectively, and 12–30 nmol/L and 19–37 nmol/L for canine and feline folate, respectively.
Sample selection and handling
Analytical validation
For the analytical validation of the Tosoh immunoassays, 3 manufacturer-supplied human QCM, 3 canine (CPLow, CPMedium, CPHigh), and 3 feline (FPLow, FPMedium, FPHigh) pooled serum samples were used. The QCM were reconstituted according to the manufacturer’s instructions (AIA-pack multi analyte control MAC kit insert, Tosoh Europe). Reconstituted QCM remains stable for 7 d at 2–8°C and up to 4 wk frozen at −20°C.
Pooled samples were created by mixing surplus serum from clinical samples submitted to our laboratory. Owner consent had been obtained at the time of blood sampling for use of surplus serum for research purposes. During investigation of the clinical cases, venous blood samples (2–3 mL) were collected and stored in plain tubes. Following clot retraction and centrifugation (1,751 × g for 5 min), serum was withdrawn from the tubes, used for biochemical assays requested by the clinician, and then the surplus serum was stored in plain tubes at −20°C. To select stored samples for the creation of the serum pools, a retrospective database search identified canine and feline clinical samples tested for cobalamin and folate between December 2015 and April 2016 at the external referral laboratory with the Immulite immunoassays. The selected serum samples had been stored at −20°C for up to 6 mo, and were thawed at room temperature for pooling. The pools were then frozen at −20°C in aliquots of 300 μL.
Method comparison
We used canine and feline serum samples submitted to our laboratory between May 2016 and April 2017. Samples from clinical cases were utilized to generate a wide range of values in order to provide more accurate information regarding the degree of correlation and agreement between the 2 analyzers. 32 The animals showed a variety of clinical signs, and all had been referred to Langford Small Animal Referral Hospital (Bristol, UK) for further investigation of their illnesses. Clinical samples were included in the study when sufficient surplus serum was deemed available for analysis. All samples were split into 2 aliquots of 500 µL. One aliquot was refrigerated at 4°C and analysed that day or the following morning at our facility using the Tosoh AIA-900 (CobalaminTosoh, FolateTosoh). The other was sent by overnight courier to the external referral laboratory and analysed the following day using the Immulite 2000 (CobalaminImmulite, FolateImmulite).
Analytical validation
Analytical validation of both the cobalamin and folate Tosoh immunoassays included the determination of accuracy and precision.16,17,23,32
Accuracy
Accuracy was assessed by performing linearity (dilutional parallelism) and spiking-recovery studies. Linearity was determined by serial dilution of the CPHigh and FPHigh samples using diluent buffer (AIA-pack B12 and AIA-pack folate sample diluting solution, Tosoh Europe). Specifically, 6 levels of dilution were tested, with dilution factors ranging from 1 (neat serum) to 28 based on respective serum-to-buffer volumes in microliters of 400/0, 300/100, 200/200, 100/300, 50/350, etc. Neat and diluted samples were then measured once sequentially within the same assay run. A curve representing the measured versus expected cobalamin or folate concentration was constructed. Three or 4 replicate samples for each dilution are recommended to avoid false rejection of a method, but if linearity can be demonstrated using single measurements, it is sufficient for analysis.15,48
The spiking-recovery study was performed by mixing the serum pools (PHigh + PMedium, PHigh + PLow, PMedium + PLow) and measuring these mixed samples sequentially within the same assay run. Measured and expected cobalamin and folate concentrations for each diluted sample were then compared and the recovery percentages calculated.
Precision
Precision was assessed by evaluating the intra- and inter-assay variability using the 3 QCM, and the 3 canine and feline serum pools. Intra-assay variability (repeatability) was determined by measuring cobalamin and folate in the same sample 10–13 times sequentially within a single run. Inter-assay variability (reproducibility) was determined by analyzing the same sample in duplicate once on 15 consecutive working days.
Quality requirements
The analytical performance of the Tosoh assays was assessed by calculating TEobs(%) and σ values. TEobs(%) was determined by the following formula: TEobs(%) = 2 × CV + bias (%). 23 Bias was calculated using the formula: bias (%) = [(target – measured) ÷ target] × 100%, wherein “target” is the mean analyte concentration reported by the manufacturer, and “measured” is the mean analyte concentration measured by the Tosoh over a 15-d period. 16
TEobs(%) was determined for the QCM and serum pools, as follows. For each QCM, TEobs(%) was calculated using the inter-assay CV and bias (%) for QCMLow, QCMMedium, and QCMHigh, respectively. For each pool, TEobs(%) was calculated using the inter-assay CV for the respective species pools and the bias(%) derived from the QCMLow, QCMMedium, or QCMHigh (for the low, medium, and high pools, respectively).
Sigma values for each QCM and each serum pool were calculated using the formula: σ = [TEa (%) – bias (%)] ÷ CV.42,48 The bias and inter-assay CV used were as defined above.
Because TEa is not available for dogs or cats, the TEa (%) employed in human studies (cobalamin: 30%; folate: 39%) were used (Desirable biological variation database specifications, 2014. Available from https://www.westgard.com/biodatabase1.htm, accessed 2018.11.17). A method was considered acceptable if TEobs < TEa. 23 Interpretation of the σ values was performed as follows: >2: poor, >3: marginal, >4: good, >5: excellent, and >6: world class.38,49 A 6-sigma result indicates that a process is nearly defect-free, with <4 defects per million outcomes; 3-sigma is considered the minimally acceptable performance level of an analytical process, equivalent to ~67,000 defects per million outcomes. 50
Statistical analysis
Data were recorded (Excel 2016, Microsoft, Redmond, WA) and analyzed (Prism 4 software, GraphPad, La Jolla, CA). For clinical samples generating results beyond the lower (<L) or upper (>H) limits of detection, the value that was used for statistical analysis was calculated by subtracting 1 pmol/L (cobalamin) or 1 nmol/L (folate) from the lowest measurable limit, and by adding 1 pmol/L or 1 nmol/L to the highest measurable limit, as performed in another study. 40 Normal distribution was evaluated using the D’Agostino and Pearson omnibus normality test. Statistical significance was set at p ≤ 0.05.
Linearity (dilutional parallelism) was evaluated by plotting the measured against the expected concentrations and determining the slope and intercept using simple linear regression. Inter- and intra-assay variability were expressed as the CV following calculation of the mean and SD for each set of results.
Correlations for the method comparison (Tosoh vs. Immulite) were selected based on parametric or nonparametric data distribution (Pearson and Spearman correlations, respectively). Correlation coefficients were interpreted as 0.90–1.00: very high correlation, 0.70–0.89: high correlation, 0.50–0.69: moderate correlation, 0.30–0.49: low correlation, and <0.30: little, if any, correlation (Zady M. Z-12: correlation and simple least square regression, 2000. Available from https://www.westgard.com/lesson42.htm, accessed 2018.11.17). Following published recommendations, 32 r values were used as a guide for selection of appropriate regression analysis. Deming or Passing–Bablok regression analysis was selected for parametric and nonparametric data, respectively. Although the correlation and regression analysis help to determine the association between 2 methods, Bland–Altman analysis is regarded as a more robust means to assess agreement.1,20 Bland–Altman plots were generated to assess the degree of agreement between the 2 analyzers (Tosoh vs. Immulite). Agreement was considered good when there was no real bias or the bias (mean of the differences, Tosoh minus Immulite) was subjectively small, the 95% confidence intervals (CIs) for the bias were subjectively narrow, and no outliers were present [i.e., values did not fall outside the limits of agreement (mean of difference ± 2 SD)]. 32 No real bias was indicated when the 95% CI for the bias included zero.1,21,31
Results
Analytical validation
Accuracy
Dilution of the CPHigh and FPHigh samples resulted in linear regression equations with r2 values of 0.99 and nonsignificant deviation from linearity over the range of diluted samples used in our study (CobalaminCanine 60–1,050 pmol/L; CobalaminFeline 46–1360 pmol/L; FolateCanine 1.8–26.6 nmol/L; FolateFeline 1.4–39.3 nmol/L). The Tosoh assays demonstrated proportional errors of 0.99–1.03 and constant errors of −6.81 to 14.83 (Figs. 1A–1D). Recoveries of cobalamin were 97–101% for the canine serum pools (mean: 99%) and 95–106% for the feline pools (mean: 100%). Recoveries of folate were 100–102% for the canine pools (mean: 101%) and 96–102% for the feline pools (mean: 98%; Table 1).
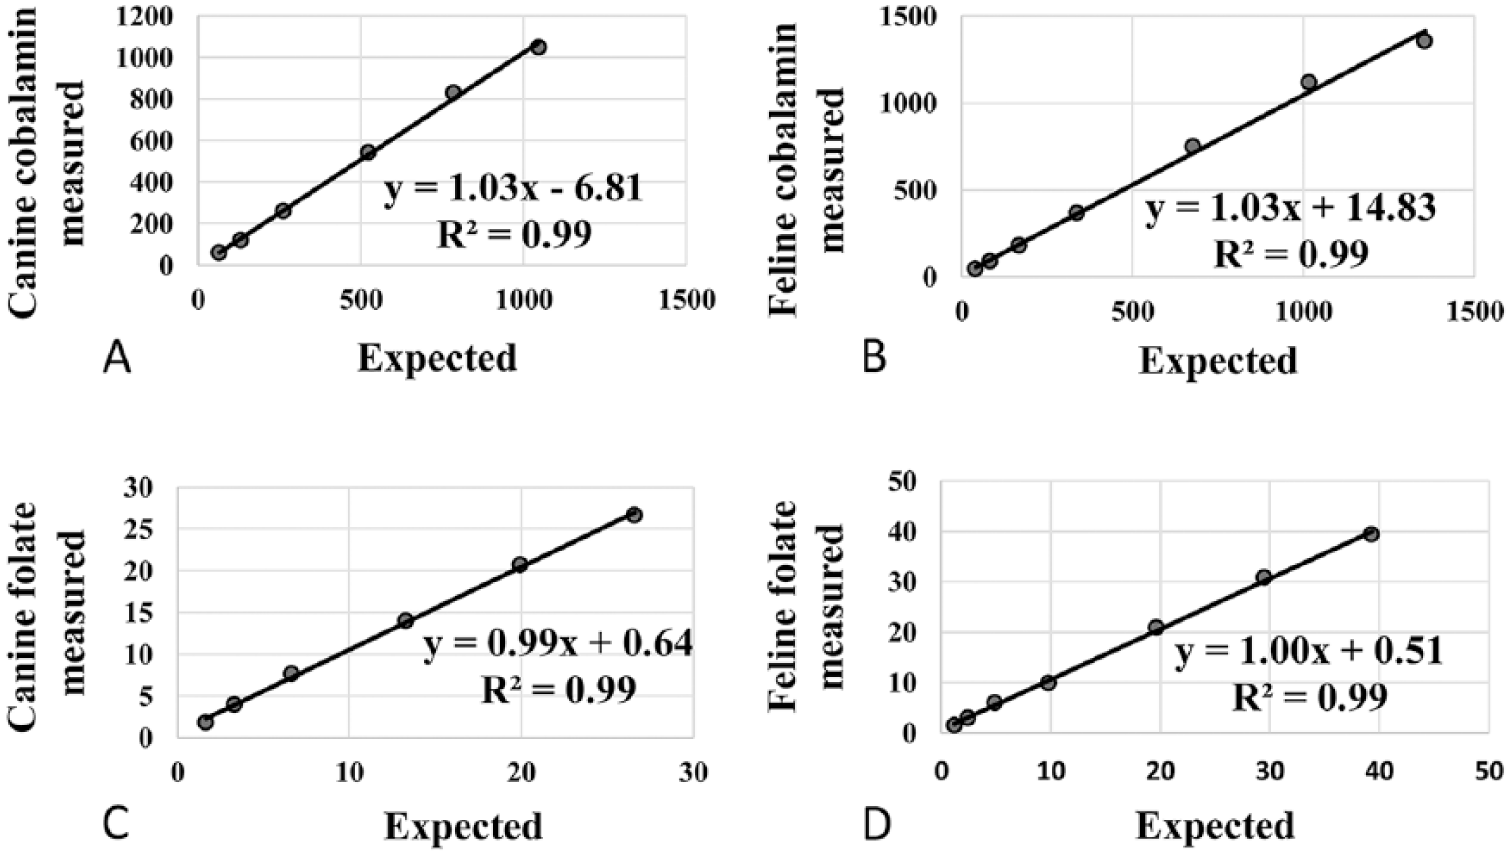
Evaluation of linearity (dilutional parallelism): linear regression for measured vs. expected cobalamin and folate concentrations using the AIA-900 Tosoh Bioscience analyzer.
Spiking-recovery of cobalamin and folate from pooled canine and feline serum samples measured using the AIA-900 Tosoh Bioscience analyzer immunoassays.
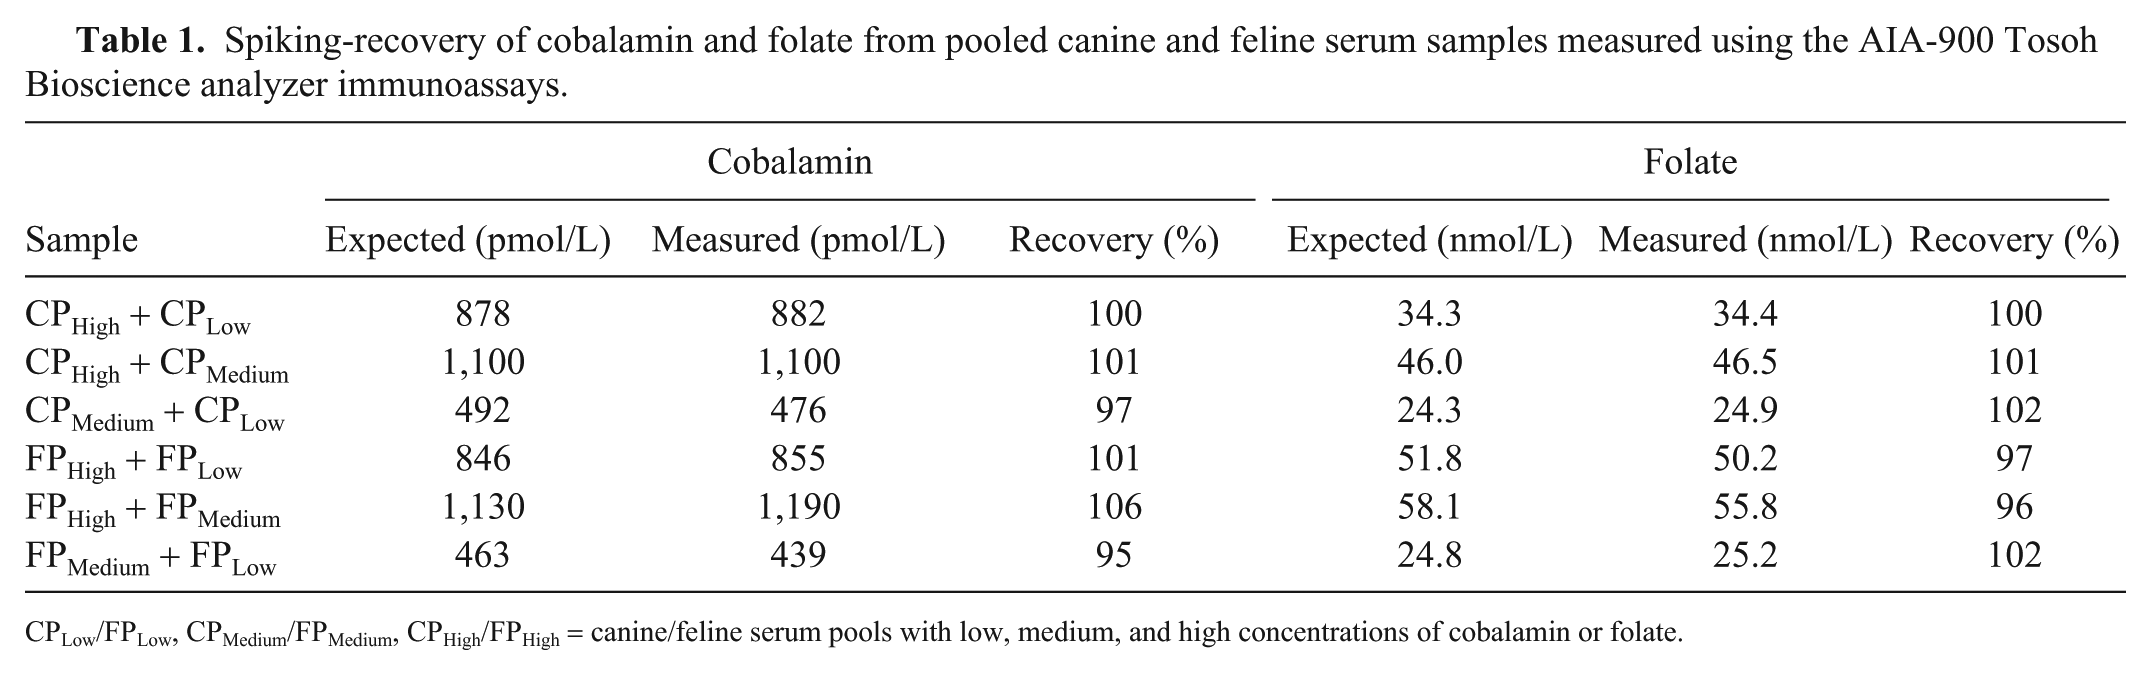
CPLow/FPLow, CPMedium/FPMedium, CPHigh/FPHigh = canine/feline serum pools with low, medium, and high concentrations of cobalamin or folate.
Precision
The mean intra- and inter-assay CV values with low, medium, high QCM and serum pools were all <10% for the CobalaminTosoh and FolateTosoh assays (Tables 2, 3).
Cobalamin precision data using quality control material and canine and feline serum pools with low, medium, and high concentrations of cobalamin measured using the AIA-900 Tosoh Bioscience analyzer immunoassays.
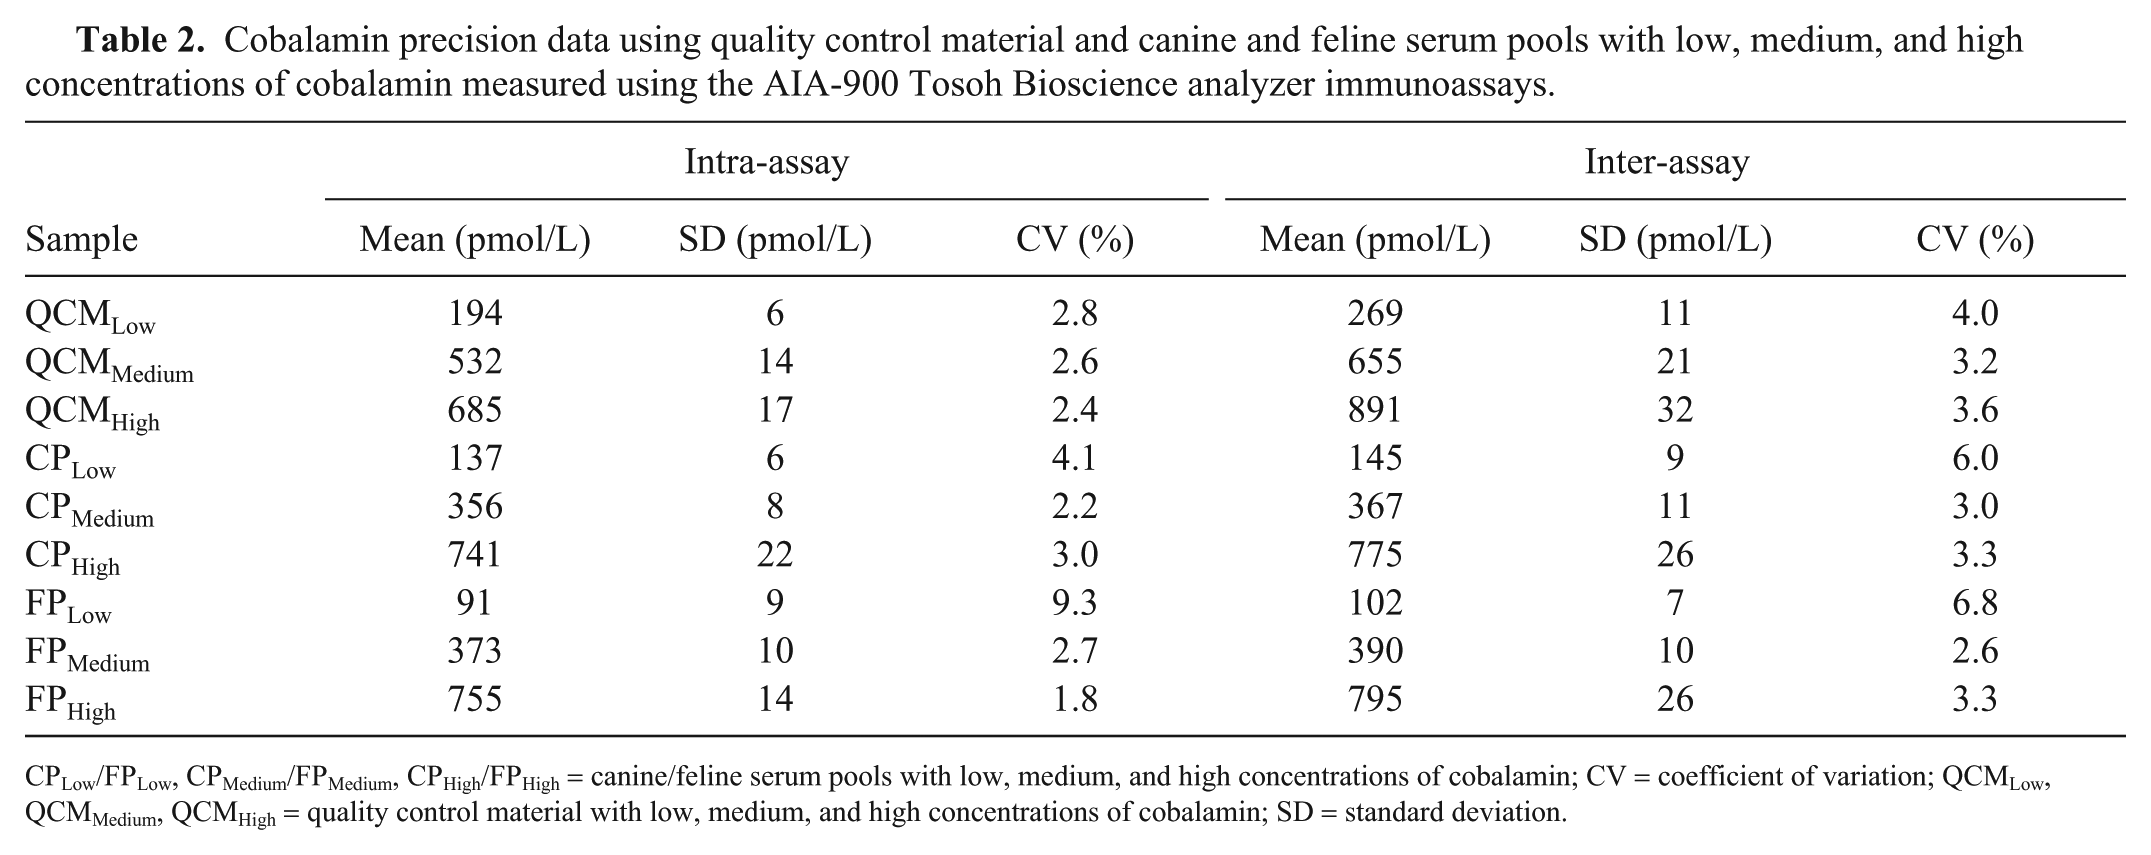
CPLow/FPLow, CPMedium/FPMedium, CPHigh/FPHigh = canine/feline serum pools with low, medium, and high concentrations of cobalamin; CV = coefficient of variation; QCMLow, QCMMedium, QCMHigh = quality control material with low, medium, and high concentrations of cobalamin; SD = standard deviation.
Folate precision data using quality control material and canine and feline serum pools with low, medium, and high concentrations of folate measured using theAIA-900 Tosoh Bioscience analyzer immunoassays.
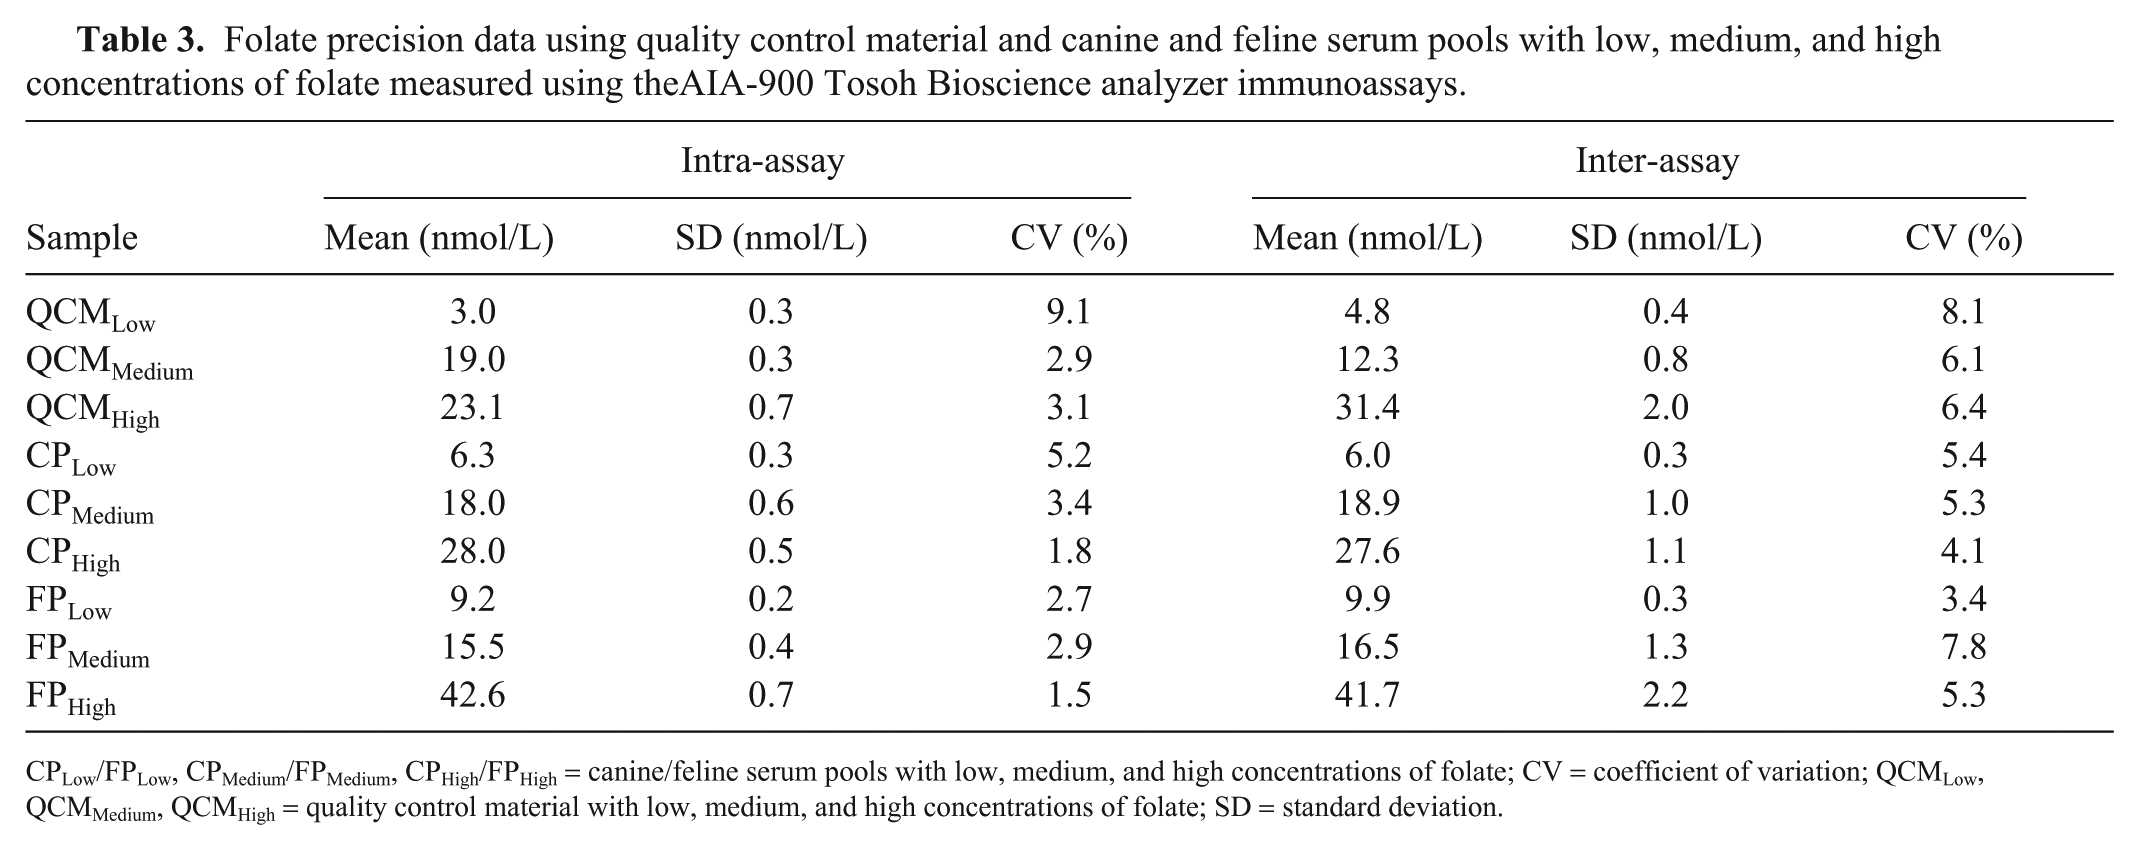
CPLow/FPLow, CPMedium/FPMedium, CPHigh/FPHigh = canine/feline serum pools with low, medium, and high concentrations of folate; CV = coefficient of variation; QCMLow, QCMMedium, QCMHigh = quality control material with low, medium, and high concentrations of folate; SD = standard deviation.
Quality requirements
Bias values for cobalamin QCMLow, QCMMedium, and QCMHigh were 5.4%, −0.6%, and −2.3%, respectively. For the folate assay, bias values for QCMLow, QCMMedium, and QCMHigh were 15.2%, 7.7%, and 8.5%, respectively. TEobs for cobalamin (range: 4–19%) and folate (range: 17–31%) were all lower than the TEa published in human studies (cobalamin: 30%, folate: 39%). All σ values for cobalamin were >4, except for the FPLow σ value, which was 3.6 (Table 4). For folate, all σ values were ≥4, except for the QCMLow σ value, which was 2.9 (Table 4).
Total observable error and sigma (σ) values for the 3 levels of quality control material and canine and feline serum pools analyzed for cobalamin and folate using the AIA-900 Tosoh Bioscience analyzer immunoassays.
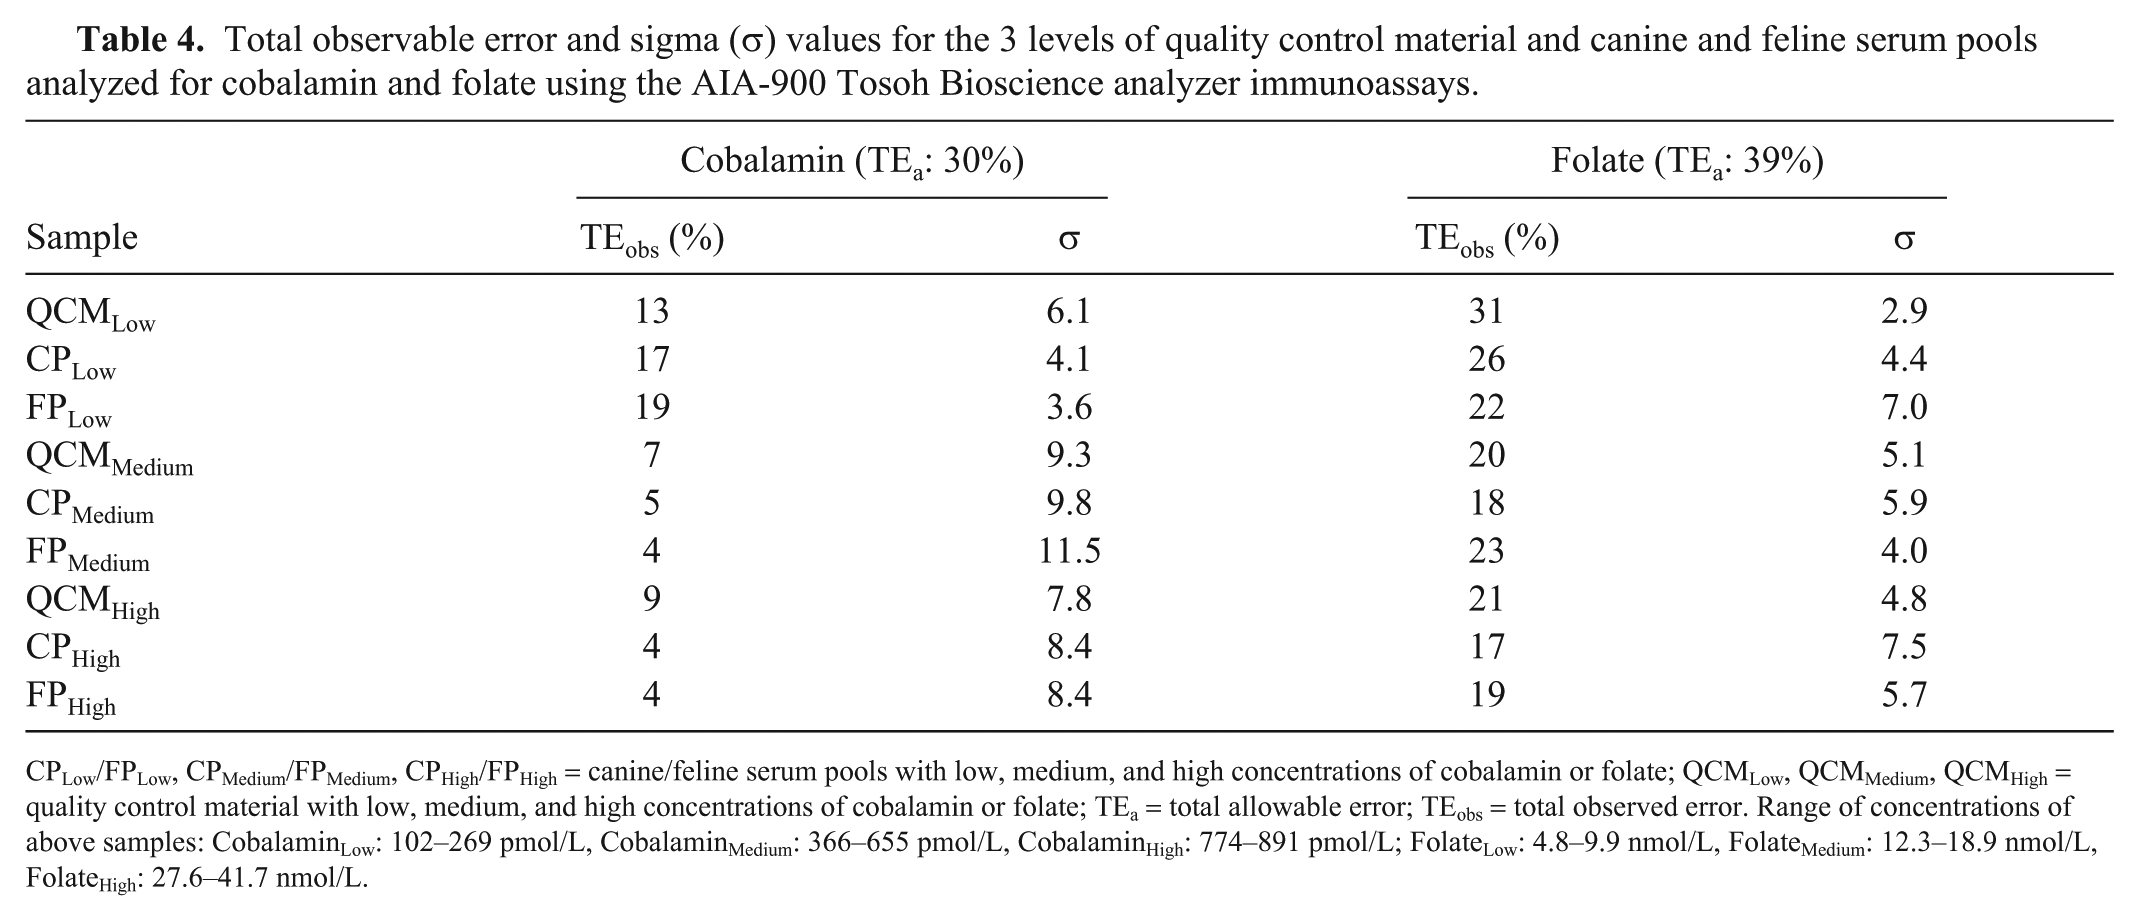
CPLow/FPLow, CPMedium/FPMedium, CPHigh/FPHigh = canine/feline serum pools with low, medium, and high concentrations of cobalamin or folate; QCMLow, QCMMedium, QCMHigh = quality control material with low, medium, and high concentrations of cobalamin or folate; TEa = total allowable error; TEobs = total observed error. Range of concentrations of above samples: CobalaminLow: 102–269 pmol/L, CobalaminMedium: 366–655 pmol/L, CobalaminHigh: 774–891 pmol/L; FolateLow: 4.8–9.9 nmol/L, FolateMedium: 12.3–18.9 nmol/L, FolateHigh: 27.6–41.7 nmol/L.
Method comparison
Surplus serum samples from 68 clinical cases (39 dogs, 29 cats) were included in our study, although for the folate method comparison in dogs, surplus serum from only 37 of the 39 cases was available. Regarding cobalamin measurements, 6 samples (1 canine, 5 feline) produced CobalaminTosoh results above the Tosoh assay’s working range. For CobalaminImmulite, 6 (4 canine, 2 feline) and 16 (7 canine, 9 feline) samples generated results below and above the Immulite assay’s working range, respectively. Regarding folate measurements, 4 samples (1 canine, 3 feline) generated results above the working ranges of both the Tosoh and Immulite.
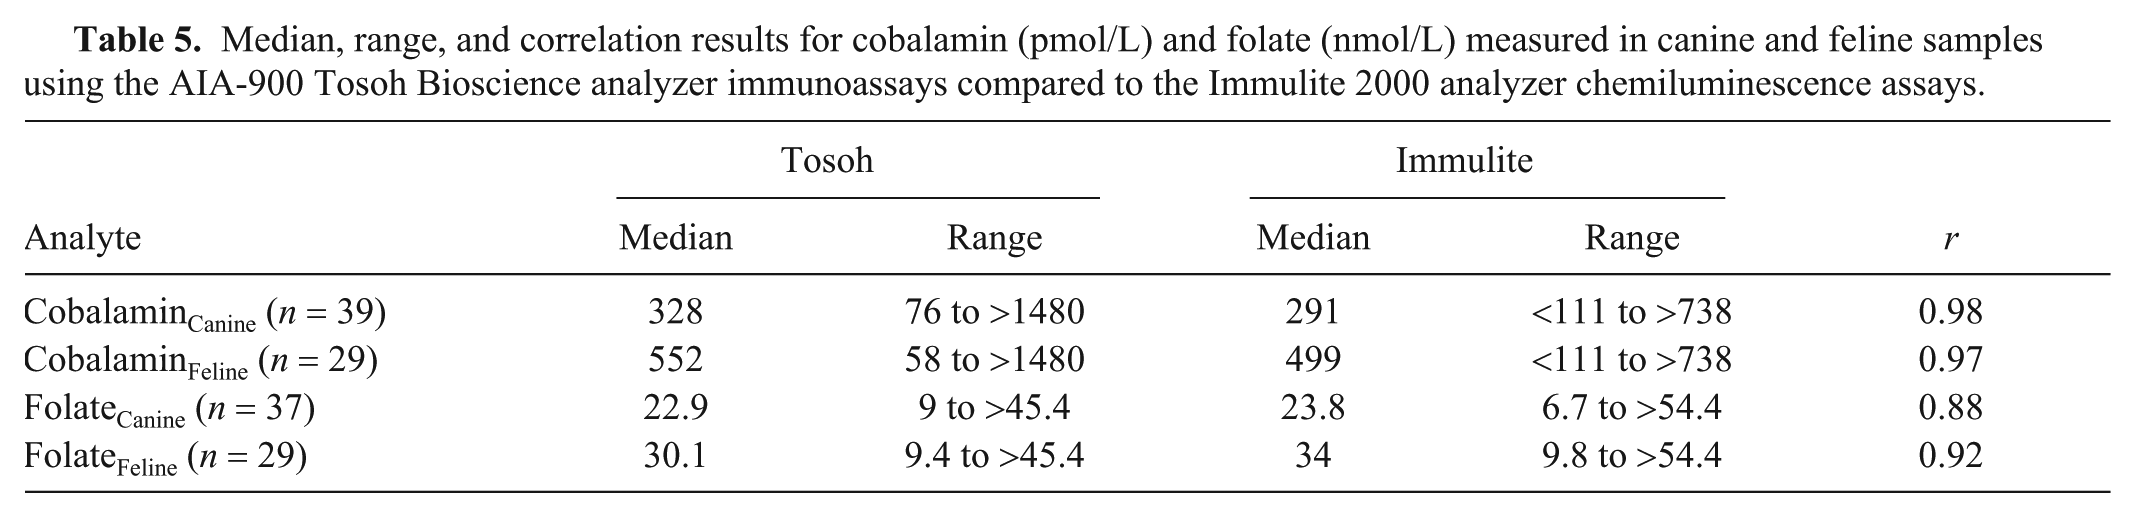
Correlations (r) between the Tosoh and Immulite results were very high for cobalamin (dogs: 0.98 and cats: 0.97; both p < 0.001) and folate (0.92; p < 0.001) in cats, and high for folate in dogs (0.88; p < 0.001; Table 5). Examination of the Bland–Altman plots revealed that there was large bias for cobalamin (canine: 75 pmol/L, feline: 184 pmol/L) and folate (canine: –1.3 nmol/L, feline: –4.5 nmol/L); the 95% CIs were wide. Seven cobalamin (2 canine, 5 feline) and 3 folate (2 canine, 1 feline) results were identified as outliers (Table 6, Fig. 2).
Median, range, and correlation results for cobalamin (pmol/L) and folate (nmol/L) measured in canine and feline samples using the AIA-900 Tosoh Bioscience analyzer immunoassays compared to the Immulite 2000 analyzer chemiluminescence assays.
Proportional error (slope), constant error (y-intercept), and bias for cobalamin (pmol/L) and folate (nmol/L) measured in canine and feline samples using the AIA-900 Tosoh Bioscience analyzer immunoassays compared to the Immulite 2000 analyzer chemiluminescence assays.
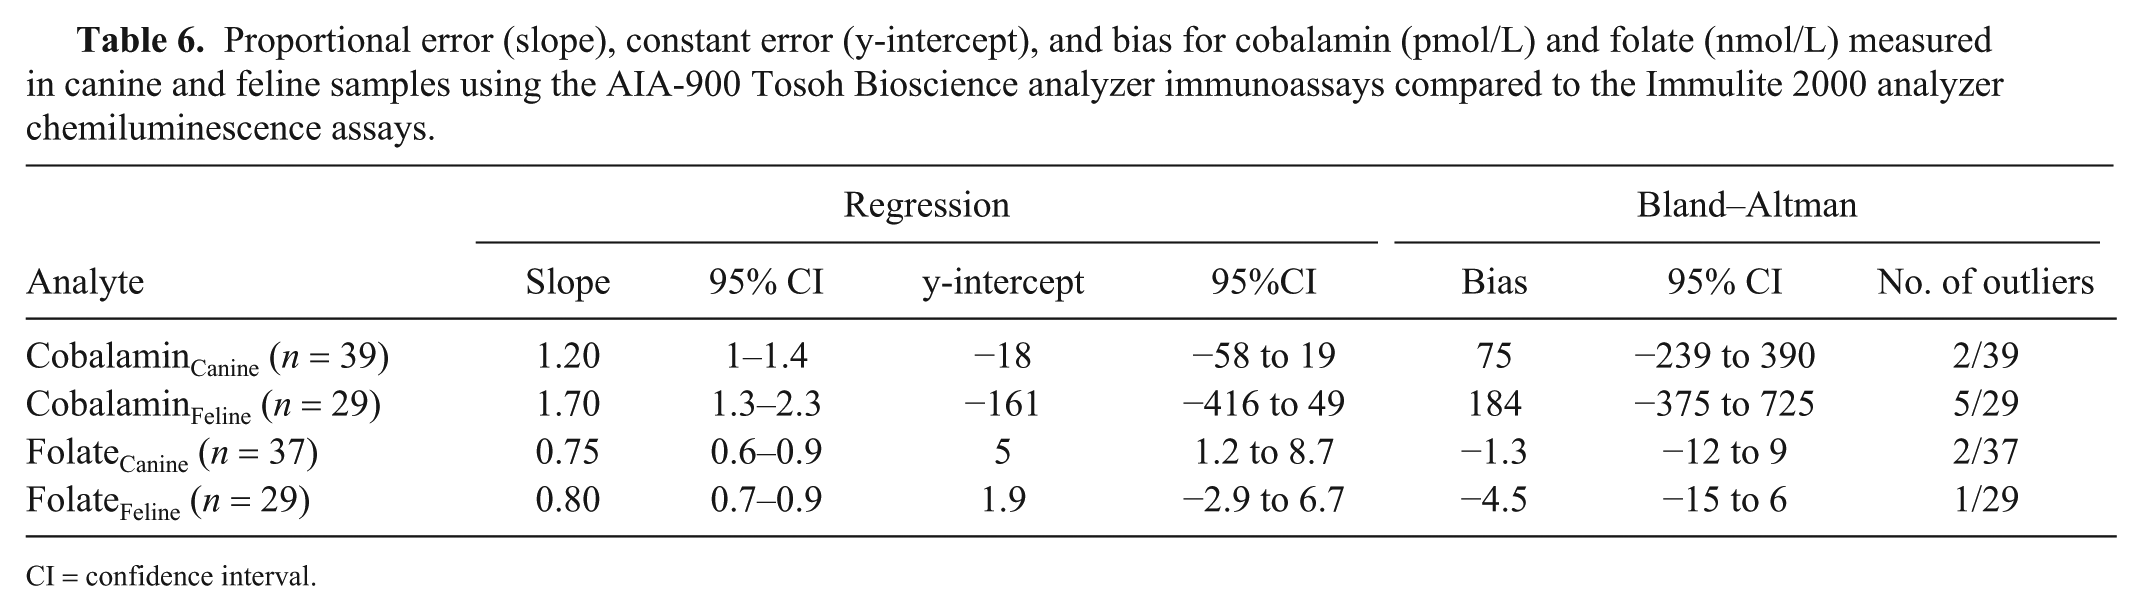
CI = confidence interval.
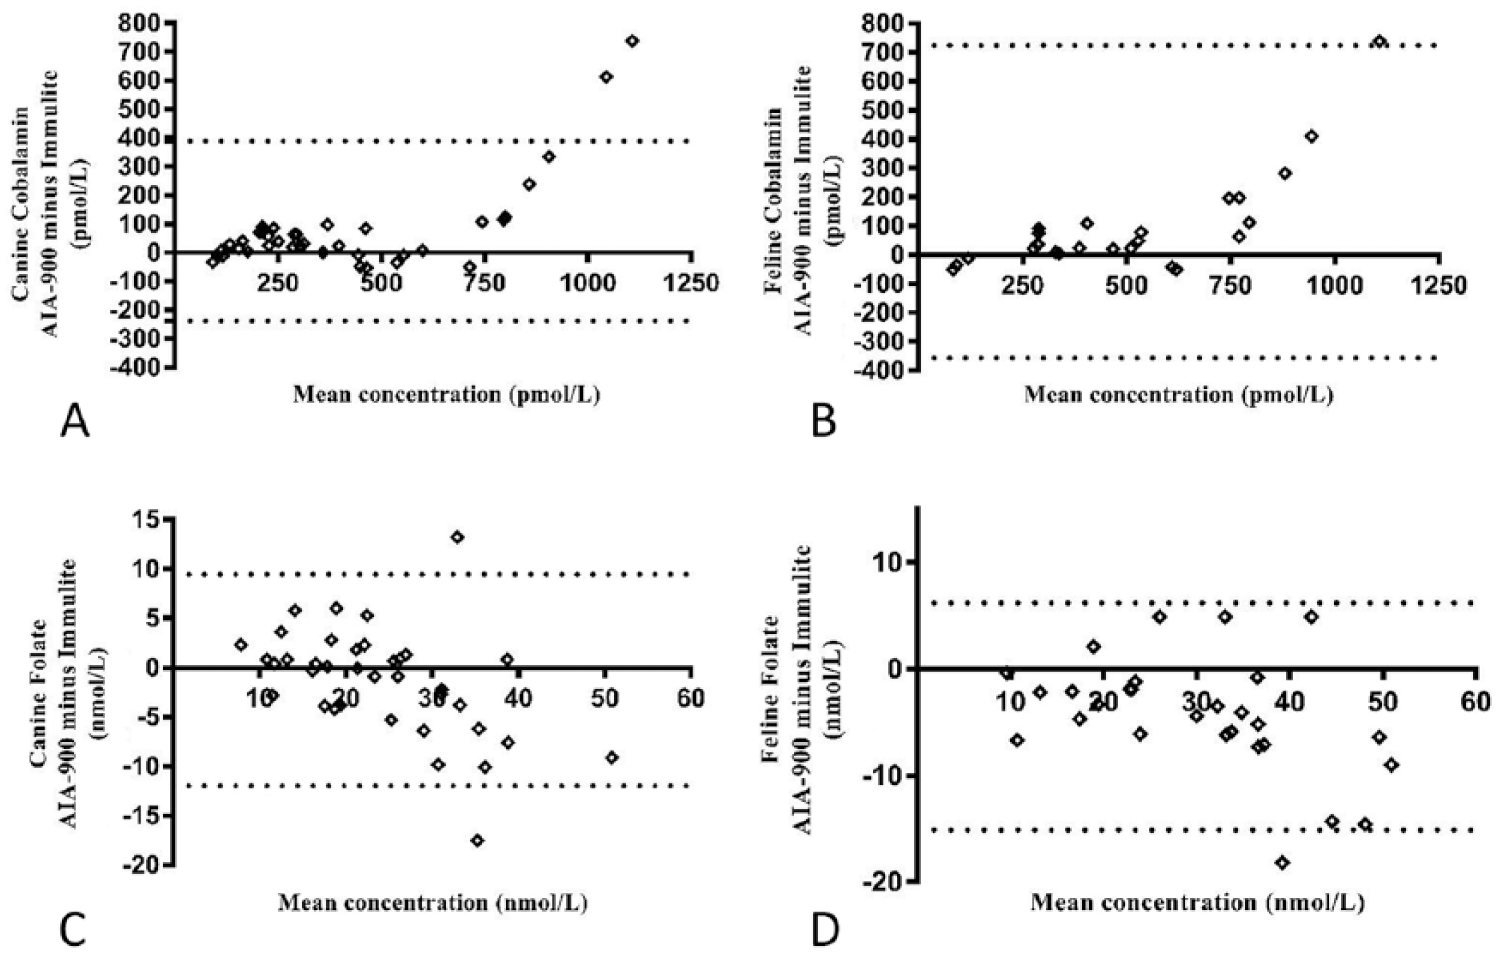
Bland–Altman difference plots of the AIA-900 Tosoh Bioscience analyzer immunoassays compared to the Immulite 2000 analyzer chemiluminescence assays for
Discussion
Although we could not find publications comparing the cobalamin and folate assays that we evaluated in our study, other veterinary validation studies involving Tosoh and Immulite assay comparisons have reported a high degree of correlation but wide limits of agreement between the assays.26,29 In the human field, one study comparing Tosoh and Immulite assays for the measurement of thyroid, fertility, and tumor markers found them to have similar degrees of precision, 53 whereas another publication assessing 4 different analytes demonstrated satisfactory analytical performance by the Tosoh assays, high levels of correlation, and variable degrees of agreement with the Immulite. 9
Because commercial reference materials are not available and gold standard methods for quantifying cobalamin and folate in canine and feline samples do not exist, the accuracy of the Tosoh assays was assessed indirectly using linearity (dilutional parallelism) and spiking-recovery studies, as reported in previous publications.12,22,29 Very high coefficients of determination (r2 > 0.99) were generated for both analytes in serially diluted samples, with cobalamin and folate recoveries of 95–106% and 96–102%, respectively. These results were not only within recommended ranges (80–120%, 75–125%)2,47 but also similar to those reported by others using Immulite immunoassays in pigs (92–123% and 85–115% for cobalamin and folate, respectively) 22 and in cats (96–122% for cobalamin). 43
Compared to published studies using Immulite assays, the Tosoh CVs were similar to those generated for pigs (CVs ≤6.1% and ≤8.7% for cobalamin and folate, respectively) 22 and lower than for cats (cobalamin CV 11.3%). 3 Inter-assay CVs were lower than those generated by the Immulite for pigs (CV ≤9.6% and ≤12.5% for cobalamin and folate, respectively) 22 and cats (cobalamin CV 15.2%). 3 In addition, intra- and inter-assay CVs indicated good precision as they were markedly <15%, the maximum acceptable CV recommended by various bioanalytical guidelines, demonstrating acceptable repeatability and reproducibility of these assays 47 (Guideline on bioanalytical method validation, EMEA/CHMP/EWP/192217/2009 Rev. 1 Corr. 2, Guidance for the industry: bioanalytical method validation, U.S. Department of Health and Human Services, FDA, 2001, https://www.fda.gov/downloads/Drugs/Guidance/ucm070107.pdf).
Acceptability of a method’s analytical performance is ideally determined using preset analytical quality specifications, such as the TEa, with a method being considered acceptable when TEobs < TEa 23 . Based on TEa published for humans, the Tosoh immunoassays were found to be acceptable for measuring low, medium, and high concentrations of cobalamin and folate (using QCM and serum pools).
Using sigma metrics, performance of the CobalaminTosoh method was determined as good for measuring samples with low concentrations of cobalamin (mean σ: 4.60) and world class for medium or high concentration samples (mean σ: 10.20 and 8.20, respectively). Performance of the FolateTosoh assay was good for low concentration serum samples (mean σ: 4.80) and excellent (mean σ: 5) or world class (mean σ: 18) for samples with medium and high folate concentrations, respectively. Only one set of results, for the folate QCMLow sample (4.75 nmol/L), generated a σ value between 2 and 3 (σ = 2.90). A result <3 indicates marginal performance and requires the application of multiple rules because of potential instability of the method. Examination of the inter-assay QCMLow data used to calculate this σ value did not reveal any outliers and, because the same batch of QCM was used throughout the study, it is proposed that this finding most likely represents instability of folate in the QCMLow matrix during storage rather than suboptimal performance of the method. Indeed, the CV and bias values for this sample were the highest generated in our study, and the same method for measuring folate in the low concentration serum samples (canine: 6 nmol/L, feline: 10 nmol/L) generated σ values indicating good to world class analytical performance. In addition, the lowest published folate concentration in clinically healthy animals using the Immulite assays is 11 nmol/L in dogs18,24 and 22 nmol/L in cats;41,52 therefore, the marginal performance of FolateTosoh using QCMLow is unlikely to affect clinical decision-making.
Results of the method comparison for the cobalamin immunoassays demonstrated very high correlations between the 2 analyzers [r = 0.98 (canine), r = 0.97 (feline)] that were similar to those reported in another veterinary study comparing Tosoh and Immulite T4 and cortisol assays [T4 r = 0.94/0.97 (canine/feline), cortisol r = 0.97 (canine and feline)]. 26
Examination of the Bland–Altman graph for cobalamin identified a large positive bias (canine: 75 pmol/L, feline: 184 pmol/L) and the presence of 7 outliers (2 canine, 5 feline). For these outliers, CobalaminTosoh values were higher than the CobalaminImmulite values, and the results were above the upper working limits of both assays (>1,480 pmol/L for Tosoh vs. >738 pmol/L for Immulite) and/or above the Immulite reference intervals established at the external laboratory or reported in published studies (canine: <332 pmol/L, feline <1,110–1,240 pmol/L).24,41,46 Regarding the feline cases, it has been proposed that, in cats with no history of vitamin supplementation, high serum cobalamin concentrations similar to those reported for the outliers may indicate underlying hepatic or neoplastic disease. 46 We concluded that the degree of disagreement between the Tosoh and Immulite values would not have affected the clinical decision-making in these cases, because such high concentrations would be likely to prompt further investigations, regardless of the precise numerical value. Even so, the limits of agreement between the 2 methods were very wide, extending >630 pmol/L in dogs and 1,100 pmol/L in cats. We propose that the markedly different upper limits of the working ranges are the main reason for this finding. Indeed, 22 of the 68 canine and feline clinical samples generated >H values (Immulite: 16 samples, Tosoh: 6 samples). Given the lack of accurate quantification of these samples, the decision to arbitrarily allocate a +1 pmol/L above the upper limit of quantification may have led to inaccuracies and is likely to have created or accentuated proportional error for these samples with high cobalamin concentrations. Ideally, the samples would have been diluted and re-analyzed to obtain a concentration within the assays’ working range. Because the Immulite assay was performed at an external laboratory and there were sample volume and financial restrictions, this was not done. Another approach could have been to exclude all samples with >H and <L results from the analysis, but this would have resulted in a narrower range of concentrations and a much lower number of paired values available for examining the agreement of canine and feline results. Indeed, repeated data analysis after exclusion of all >H and <L values generated 46 pairs of combined data with concentrations of 58–1,350 pmol/L for CobalaminTosoh and 120–690 pmol/L for CobalaminImmulite. The correlation between the 2 assays was still very high (r = 0.97). Bland–Altman analysis revealed 2 outliers and a small positive bias (38 pmol/L), but the limits of agreement were still considered wide (−69 to 145 pmol/L) extending over 194 pmol/L, and not indicative of good agreement.
For folate measurement, correlations between the Immulite and Tosoh were high [r = 0.88 (canine)] and very high [r = 0.92 (feline)] and similar to those reported in other studies comparing these analyzers [r = 0.94 (canine T4), r = 0.97 (feline T4), r = 0.97 (canine and feline cortisol), r = 0.88 (equine ACTH)].26,29
Examination of the Bland–Altman graph for folate identified a negative bias (canine: −1.3 nmol/L, feline: –4.5 nmol/L) and the presence of 3 outliers (2 canine, 1 feline). For two of these, the Tosoh gave lower folate values than the Immulite (canine: 26.5 vs. 44 nmol/L, feline: 30.1 vs. 48.3 nmol/L) and for the other case, the Tosoh value was higher (canine: 39.5 vs. 26.3 nmol/L). The limits of agreement between the 2 methods were very wide and extended over 22 nmol/L in dogs and 21 nmol/L in cats. It is proposed that the markedly different upper limits of the working ranges are the main reason for this finding. Indeed, 8 of the 66 canine and feline clinical samples generated >H values, 4 with each instrument. As with cobalamin, given the lack of accurate quantification of these samples, the decision to arbitrarily allocate a +1 nmol/L above the upper limit of quantification could have led to inaccuracies and accentuated the proportional error. Repeated data analysis after exclusion of all >H and <L values generated 61 pairs of combined data (canine: 36, feline: 25) with concentrations of 7.4–44.8 nmol/L and 6.7–51.7 nmol/L for FolateTosoh and FolateImmulite, respectively. The correlation between the 2 assays was still high (r = 0.87). Bland–Altman analysis revealed 4 outliers and a small negative bias (−2.1 nmol/L) but the limits of agreement remained wide (−12.8 to 8.6 nmol/L) extending over 21 nmol/L, and indicative of poor agreement.
We propose that the poor agreement between the Tosoh and Immulite methods may be explained by 2 differences: 1) inherent variations in methodology, for example pertaining to the monoclonal antibodies employed in each assay, or binding affinities of the porcine/bovine binding proteins to canine and feline cobalamin/folate, 36 and 2) differences in sample storage conditions, which could have affected cobalamin and/or folate stability before sample analysis by the 2 instruments. Published studies into the stability of these analytes indicate that overall, cobalamin is a stable analyte at 4°C, room temperature, and frozen for 2 wk to >20 y.11,28,33,34 In contrast, storage studies on folate have produced variable results, with some indicating stability at 4°C for 1 wk and at 11°C for 10 d,33,34 whereas another study demonstrated a 50% decrease in concentrations after 8 d at room temperature or at −25°C. 28 In our study, although all analyses took place on the same day or following storage for up to 24 h, the samples analyzed with the Tosoh were stored at 4°C (Diagnostic Laboratories), whereas those analyzed with the Immulite were exposed to different temperatures during transportation to the external laboratory before storage at 4°C. This may have had some effects on the results used for the comparison study.
A limitation of our study is the employment of a relatively low number of clinical samples for assessing the correlation and agreement of the results obtained from the 2 tested instruments. Because a minimum of 40 samples is recommended for such assessments, 48 the number of samples was considered satisfactory for dogs (n = 39/37 for cobalamin/folate, respectively) but suboptimal for cats (n = 29). The latter is the result of the difficulty in recruiting samples with sufficient volume to perform all analyses. Studies using a higher number of patient samples would be worth performing in the future.
The Tosoh immunoassays have good analytical performance and can be used to accurately measure cobalamin and folate in dogs and cats. The correlation between the Tosoh and Immulite is high; however, the agreement is poor, indicating that the results obtained by the 2 analyzers cannot be used interchangeably and should therefore be interpreted using reference intervals established separately for each instrument. Further studies are required for the establishment of Tosoh-specific reference intervals, which will enable evaluation of the diagnostic performance and clinical utility of the Tosoh analyzer for the measurement of cobalamin and folate in dogs and cats.
Footnotes
Declaration of conflicting interests
The authors declared no potential conflicts of interest with respect to the research, authorship, and/or publication of this article.
Funding
The Tosoh analyzer and reagents were provided to Langford Diagnostic Laboratories by the manufacturer for the duration of the study.