
Abstract
The applications of data on biological variation include assessment of the utility of population-based reference intervals, evaluation of the significance of change in serial results, and setting of analytical quality specifications. We investigated the biological variation of 19 biochemistry analytes and total T4, measured in serum from 7 clinically healthy domestic cats sampled once weekly for 5 weeks. Samples were frozen and analyzed in random order in the same analytical run. Results were analyzed for outliers, and the components of variance, subsequently generated by restricted maximum likelihood, were used to determine within-subject and between-subject variation (CVI and CVG, respectively), as well as analytical variation (CVA) for each analyte. Indices of individuality, reference change values, and analytical performance goals were calculated. The smallest CVI and CVG were found for calcium, chloride, and sodium, whereas the largest values were calculated for bile acids. Nine analytes (albumin, alkaline phosphatase, alanine aminotransferase, aspartate aminotransferase, cholesterol, creatinine, phosphate [phosphorus], total protein, total T4) demonstrated high individuality, indicating limited utility of population-based reference intervals. Individuality was low, and population-based reference intervals were thereby considered appropriate for 5 analytes (bile acids, calcium, fructosamine, glucose, potassium). The intermediate individuality observed for 4 analytes (creatine kinase, iron, magnesium, urea) indicated that population-based reference intervals should be used with caution.
Introduction
Biological variation is defined as the random fluctuation of an analyte around a homeostatic setting point, and it is composed of within-subject variation (CVI), reflecting changes occurring in the same individual over time, and between-subject variation (CVG), representing the difference between individuals.5,6 The applications of data on biological variation include setting of analytical quality specifications, assessment of the utility of population-based reference intervals, and evaluation of the significance of change in serial results. 6
Assessment of analytical performance is of importance to ensure that only results with acceptable quality for the given clinical purpose are reported from a diagnostic laboratory. Setting analytical performance goals based on biological variation is an approach with a high level of objectivity and clinical relevance, according to a hierarchy of models proposed at a conference on “Strategies to set global quality specifications in laboratory medicine” held in Stockholm in 1999.12,13
Population-based reference intervals have traditionally been used in veterinary practice,7,8 although subject-based reference values, based on repeated sampling of the same animal, are preferred for many analytes. An individual’s test results may remain within the population-based reference intervals even though the results are statistically different from its usual values, and this may lead to difficulties in detection and monitoring of disease progress as well as response to therapy.5–7,11,20 Subject-based reference values such as the reference change value (RCV), calculated from data on biological variation, can be used to determine whether the difference between 2 consecutive measurements may be attributable to natural variation or if other causes such as disease or therapy may be responsible for the difference. The utility of population-based reference intervals can be assessed by comparing the degree of within-subject variation to the degree of between-subject variation and calculating an analyte’s index of individuality (INDI).5–7,20 We investigated the biological variation of 19 biochemistry analytes and thyroxine (total T4) measured in serum from clinically healthy domestic cats, and calculated indices of individuality and RCVs as well as analytical performance goals based on the generated data.
Material and methods
Animals
Ten client-owned cats were enrolled in the study, which was approved by the Swedish Animal Ethics Committee (C282/11). To be included in the study, the cats had to be >1 year of age, healthy based on information from their owner, not pregnant, and not under treatment with any medication. Weekly physical examinations and interviews of the owners about the health of their cat over the time between the current and previous sampling occasions were performed throughout the study. The physical examination included determinations of general condition, appearance of mucous membranes, amount of dental calculus, heart and lung auscultation, palpation of peripheral lymph nodes, thyroid gland, and abdomen, and examination of the mammary glands, as well as determination of body weight and body condition score (BCS). Cats were excluded from the study if abnormalities were found on clinical examinations or interviews with their owner, or if they showed signs of stress during sampling.
Three cats were excluded from the study, 1 because of a heart murmur and 2 because of stress during sampling. Of the remaining 7 cats, there were 4 Domestic Shorthairs, 1 Balinese, 1 Bengal, and 1 mixed-breed cat (50% Domestic Shorthair, 50% Norwegian Forest Cat). The cats were 2.2–12.1 years old (median: 8.1 years; mean: 6.9 years), 3 were spayed females, and 4 were neutered males, and they weighed 3.4–6.7 kg (median: 5.2 kg; mean: 5.0 kg). Five cats had a BCS of 3, and 2 cats had a BCS of 4, on a 5-degree scale where 1 is emaciated, 3 is ideal, and 5 is obese. Four of the cats were kept strictly indoors; the other 3 were allowed to be both indoors and outdoors.
Study design
Seven client-owned cats were sampled once weekly for 5 weeks. Samples were collected in the morning after an overnight fast (~12 h), at approximately the same time for each cat. Venous blood was collected from the cephalic vein by the same phlebotomist, using a tourniquet, and all cats were sampled in a sitting position. A 20-gauge needle a was used, and blood was collected directly into a 4-mL serum tube. b Blood samples were centrifuged c at 3,000 × g for 5 min within 30–60 min of collection; the separated serum samples were immediately frozen at −20°C and transferred to −80°C within 7 days. All specimens were stored at −80°C until they were thawed and analyzed within 8 months. Serum samples for analysis of total T4 had been thawed once prior to analysis. The stability of total T4 after 2 freeze–thaw cycles has previously been verified as part of a method validation study performed at the Clinical Pathology Laboratory, Uppsala, Sweden (data not shown). Sampling was performed from December 2013 to February 2014.
Analytical methods
Nineteen biochemistry analytes (albumin, alkaline phosphatase [ALP], alanine aminotransferase [ALT], aspartate aminotransferase [AST], bile acids, calcium [total], chloride, cholesterol, creatine kinase [CK], creatinine, fructosamine, glucose, iron, magnesium, phosphate (phosphorus), potassium, sodium, total protein, urea) were analyzed using an automated chemistry analyzer d (Table 1). Total T4 was measured on an automated immunoassay system e using a solid-phase chemiluminescent competitive immunoassay. f Analyses were performed in duplicate, in random order, in a single run, using the same reagent batch. Two levels of control material were run for each analyte, prior to analysis of the samples in this study.
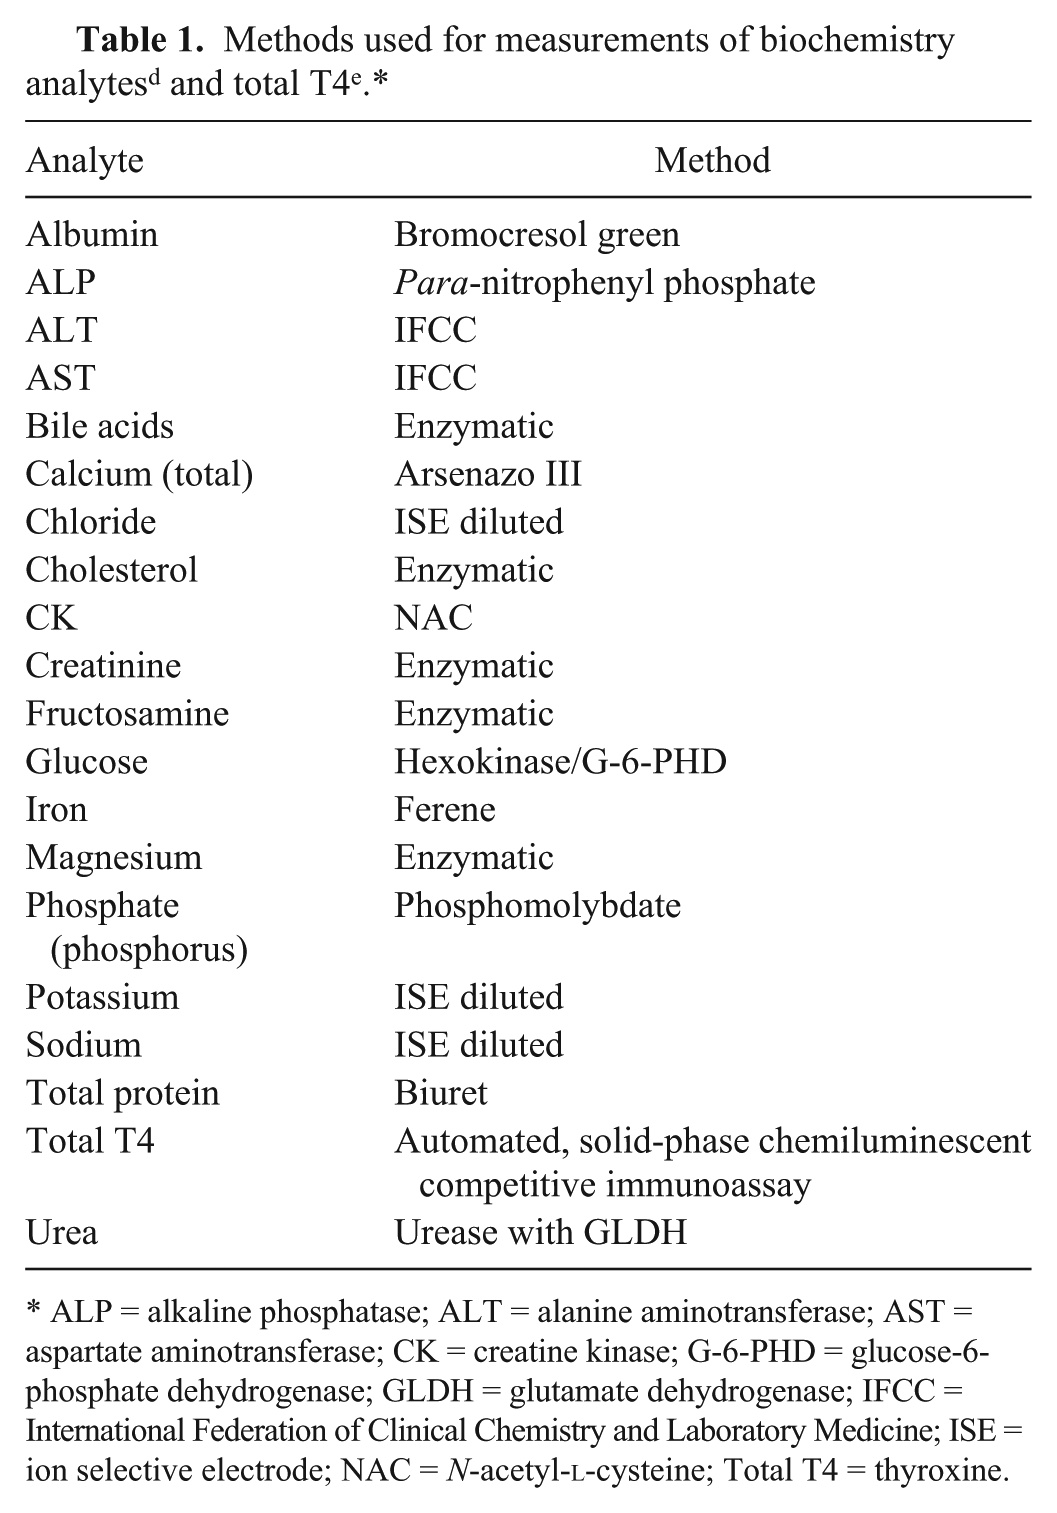
ALP = alkaline phosphatase; ALT = alanine aminotransferase; AST = aspartate aminotransferase; CK = creatine kinase; G-6-PHD = glucose-6-phosphate dehydrogenase; GLDH = glutamate dehydrogenase; IFCC = International Federation of Clinical Chemistry and Laboratory Medicine; ISE = ion selective electrode; NAC = N-acetyl-
Statistical methods
Data were examined for outliers on 3 levels. The Cochran test was used to detect outliers in sets of duplicate results and among within-subject variances, and Reed criterion was used to detect outliers among mean values of subjects. 6
Variance components for replicates as well as within-subject and between-subject were estimated by a mixed-effect model using the command “proc mixed” using commercial software. g Restricted maximum likelihood was used as an estimation method for the covariance parameters. Analytes were specified as outcome variables, and subject ID, sample number, and replicate number were specified as random effects. The normality of residuals was evaluated by visual inspection of histograms and QQ-plots of residuals. The generated variance components were converted to their corresponding analytical precisions (CVA), within-subject variations (CVI), and between-subject variations (CVG), using the overall mean value.
Index of individuality (INDI) was calculated using the formula INDI = [CVA2 + CVI2]1/2/CVG to assess the utility of a population-based reference interval. Low INDI indicates limited use of population-based reference intervals.5,6,20 RCVs were calculated for uni- and bidirectional changes in concentration, according to the formula RCV = Z[2(CVA2 + CVI2)]1/2, where Z scores for 95% probability were used. Z = 1.65 was used for unidirectional analyses (when decreased or increased concentrations are of interest), and Z = 1.96 was used for bidirectional analyses (when both decreased and increased concentrations are of interest). 4 Quality specifications for minimum, desirable, and optimum performance regarding analytical variation were calculated as CVMIN < 0.75 CVI, CVDES < 0.50 CVI, and CVOPT < 0.25 CVI, respectively. Desirable goals for bias (BDES) and allowable total error (TEa) were defined as BDES < 0.250(CVI2 + CVG2)1/2 and TEa < 1.65(0.50 CVI) + 0.250(CVI2 + CVG2)1/2.4,15
Results
Outlier variances were detected and excluded from 10 analytes (Table 2). Results from analysis of total T4 from 1 cat at 1 sampling occasion (cat 7, sample 1) were missing as a result of insufficient sample volume. Within-subject, between-subject, and analytical variation were established for each analyte (Table 3) and thereafter used to determine indices of individuality and RCVs for uni- and bidirectional changes. Nine analytes (albumin, ALP, ALT, AST, cholesterol, creatinine, phosphate [phosphorus], total protein, total T4) had an INDI of ≤0.6, indicating limited use of population-based reference intervals.1,6,20 The index of individuality was >1.4 for 5 analytes (bile acids, calcium, fructosamine, glucose, potassium), indicating suitability of population-based reference intervals, whereas 4 analytes (CK, iron, magnesium, urea) showed intermediate indices of individuality, suggesting that population-based reference intervals should be used with caution.6,20 For 17 of 20 analytes, the RCVs were 7.5–64.2% for unidirectional changes and 8.9–76.3% for bidirectional changes in analyte concentration, with calcium having the smallest value and CK the largest. The RCVs for bile acids were 303.3% for unidirectional changes and 360.2% for bidirectional changes. Analytical performance goals for imprecision, BDES, and TEa are shown in Table 4. The within-subject variances for sodium and chloride were 0.0, precluding calculation of INDI, RCVs, and analytical performance goals.
Outlier variances identified and excluded from 10 analytes. The Cochran test was used to detect outliers in sets of duplicate results and among within-subject variances, and Reed criterion was used to detect outliers among mean values of subjects (between-subject variances). No outliers were found among within-subject variances.*
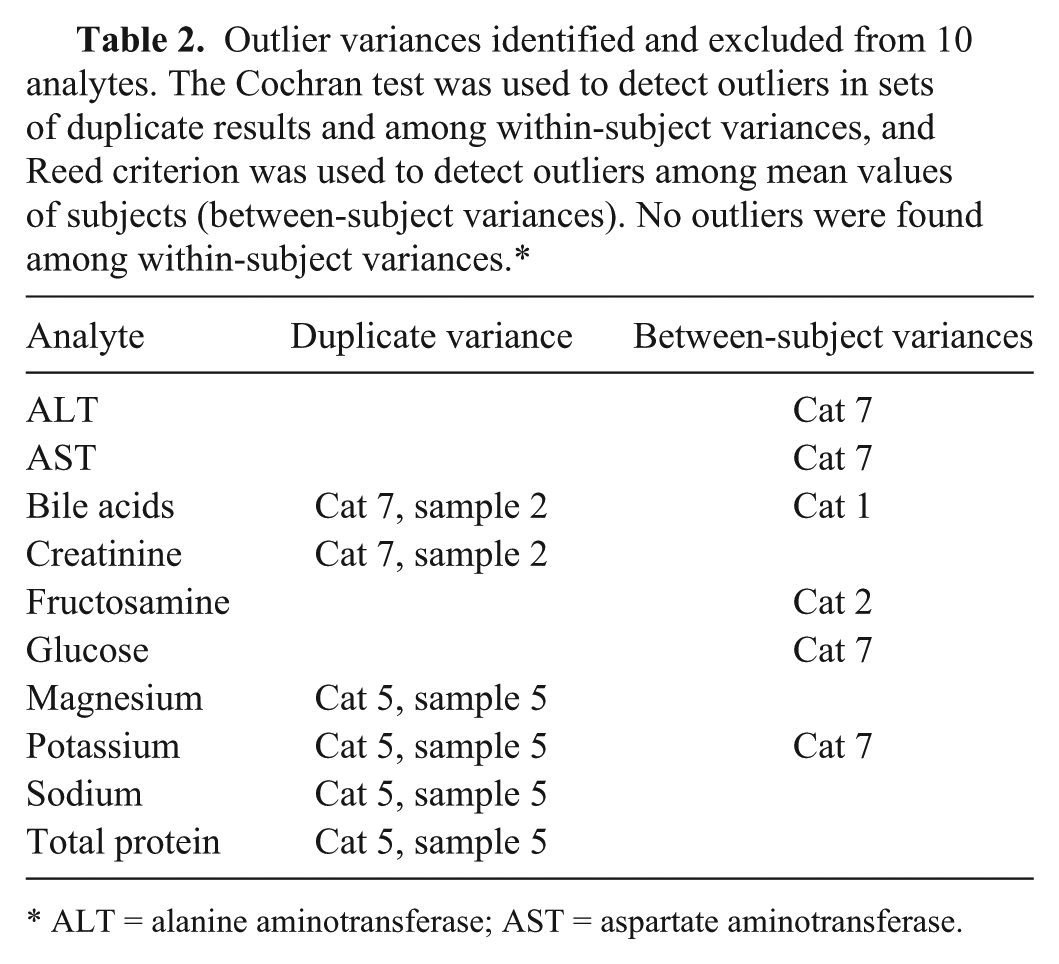
ALT = alanine aminotransferase; AST = aspartate aminotransferase.
Biological variation data and applications thereof for 20 analytes measured in feline serum.*
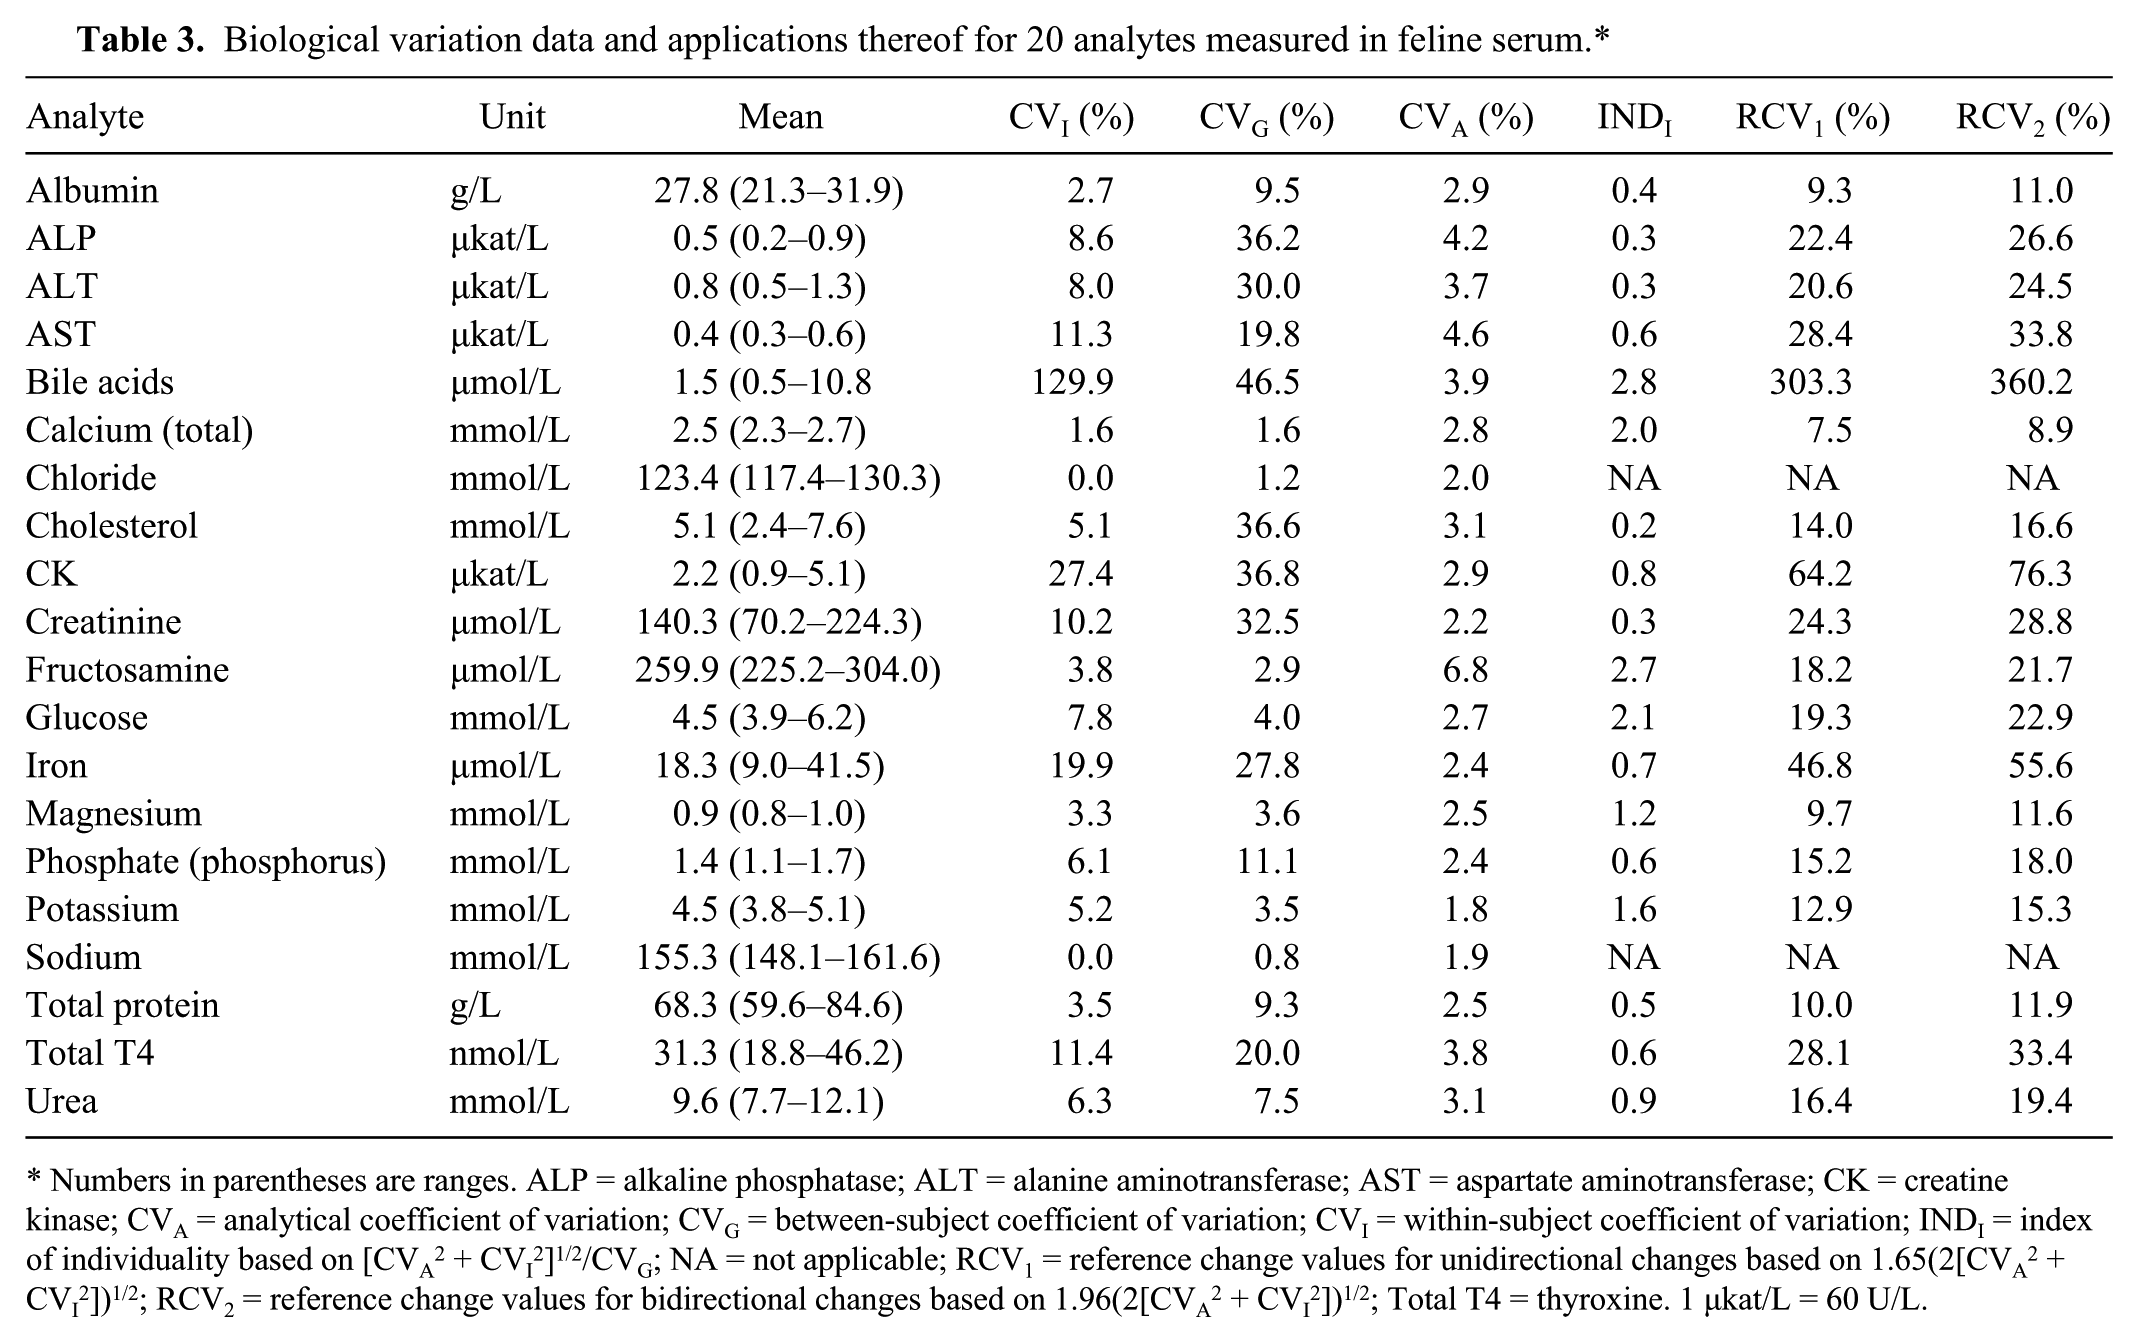
Numbers in parentheses are ranges. ALP = alkaline phosphatase; ALT = alanine aminotransferase; AST = aspartate aminotransferase; CK = creatine kinase; CVA = analytical coefficient of variation; CVG = between-subject coefficient of variation; CVI = within-subject coefficient of variation; INDI = index of individuality based on [CVA2 + CVI2]1/2/CVG; NA = not applicable; RCV1 = reference change values for unidirectional changes based on 1.65(2[CVA2 + CVI2])1/2; RCV2 = reference change values for bidirectional changes based on 1.96(2[CVA2 + CVI2])1/2; Total T4 = thyroxine. 1 μkat/L = 60 U/L.
Analytical performance goals, based on biological variation, for 18 analytes measured in feline serum. Data for chloride and sodium are missing because their within-subject variances were zero.*
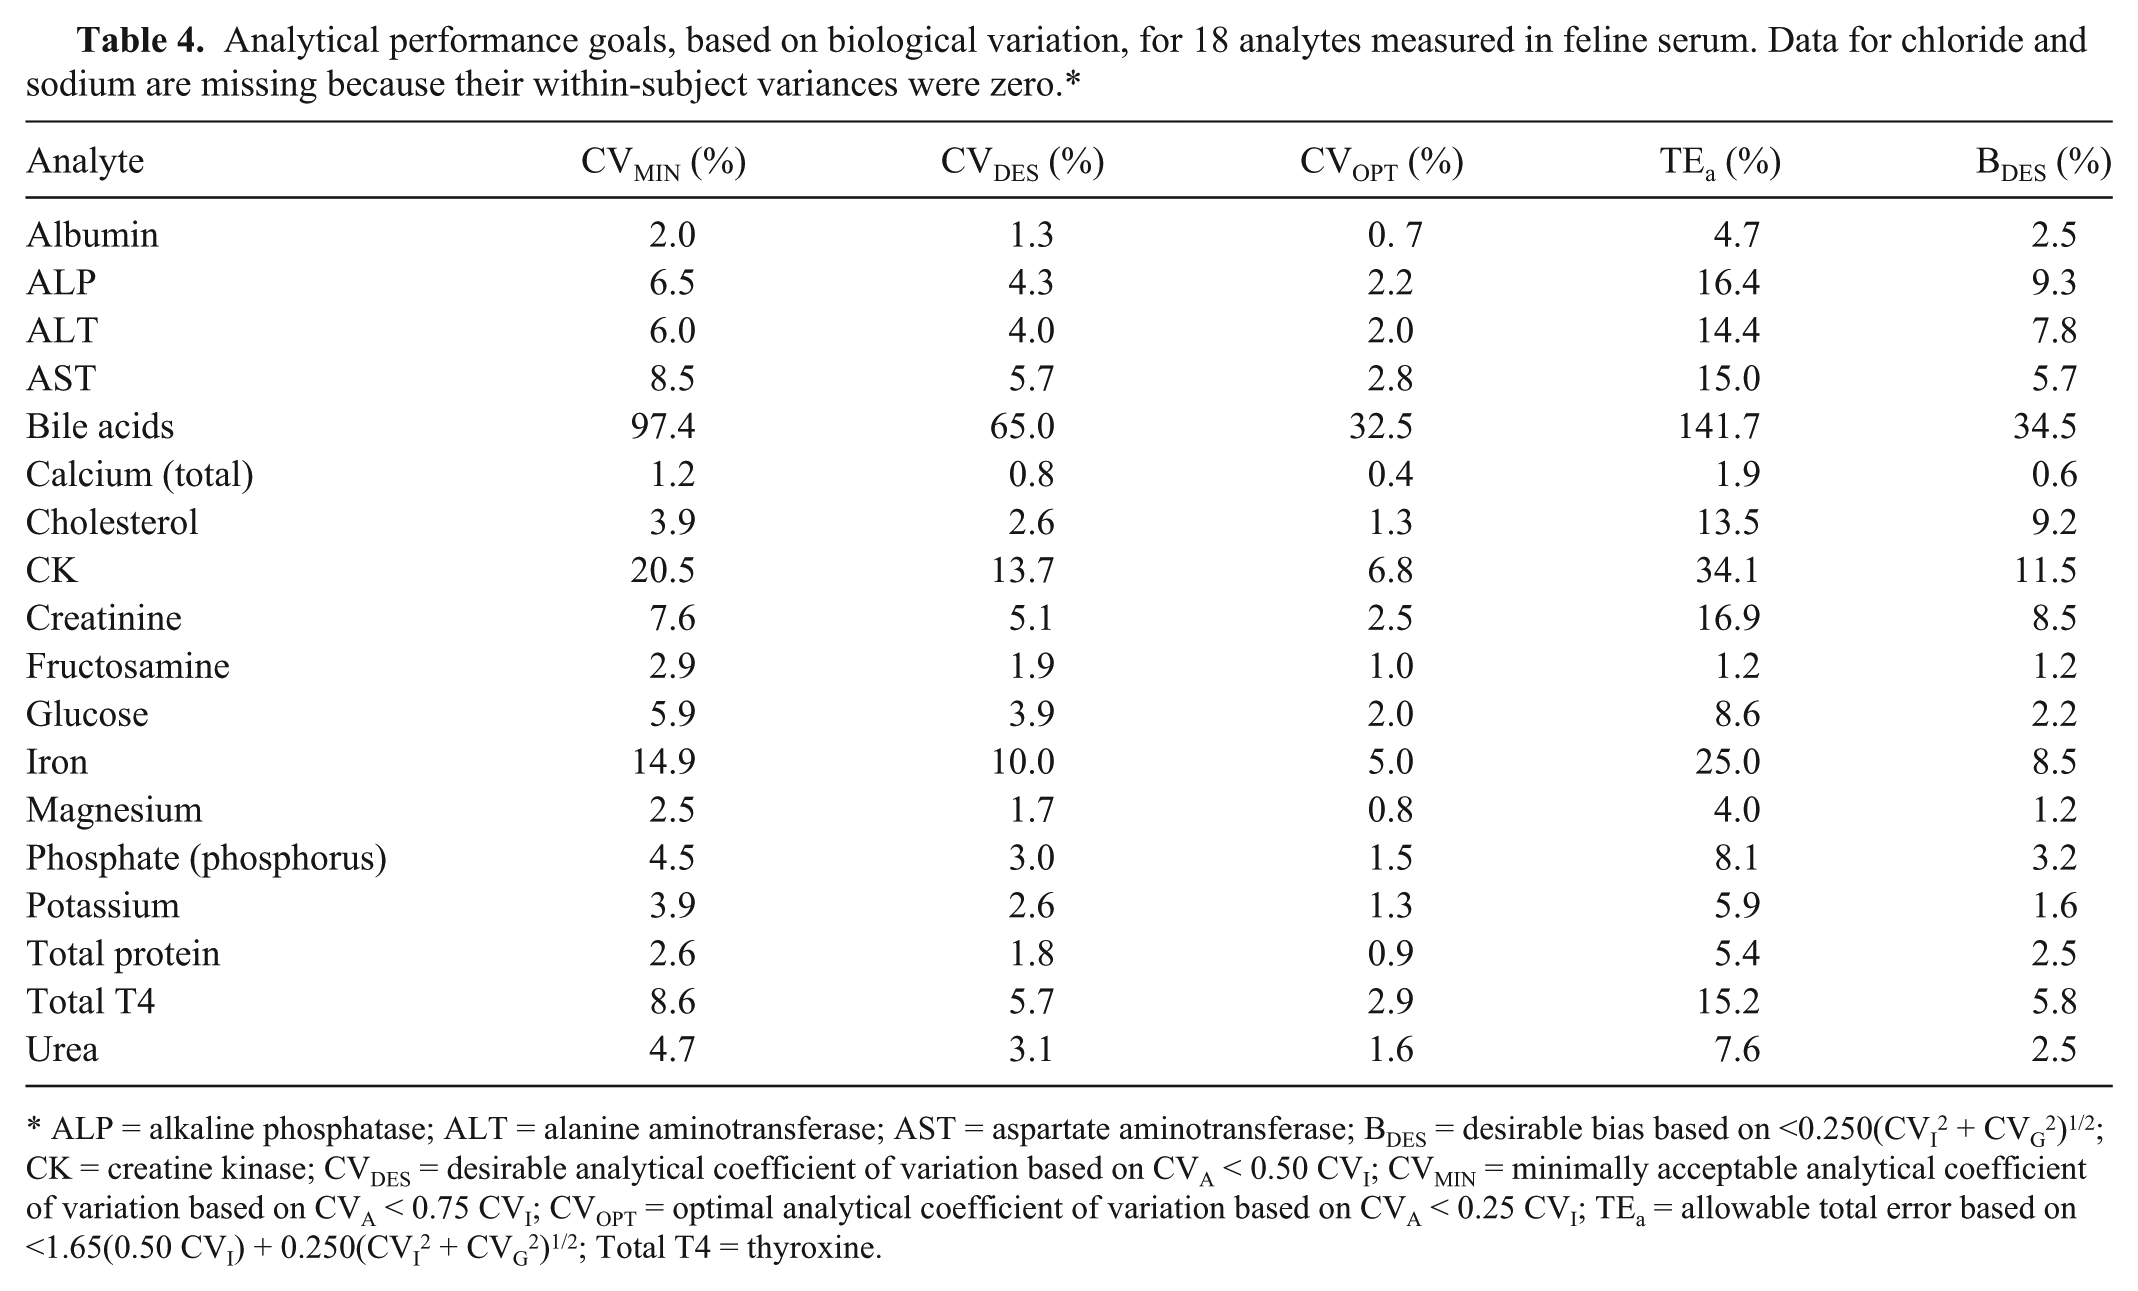
ALP = alkaline phosphatase; ALT = alanine aminotransferase; AST = aspartate aminotransferase; BDES = desirable bias based on <0.250(CVI2 + CVG2)1/2; CK = creatine kinase; CVDES = desirable analytical coefficient of variation based on CVA < 0.50 CVI; CVMIN = minimally acceptable analytical coefficient of variation based on CVA < 0.75 CVI; CVOPT = optimal analytical coefficient of variation based on CVA < 0.25 CVI; TEa = allowable total error based on <1.65(0.50 CVI) + 0.250(CVI2 + CVG2)1/2; Total T4 = thyroxine.
Discussion
The data on biological variation for 20 analytes measured in feline serum described in our study can be used for interpretation of clinical results and setting of objective analytical quality specifications. Assessment of outliers is important in studies on biological variation as the decision of including or excluding outliers from data sets can have an effect on summary statistics, especially variances, and thus, different approaches to treatment of outliers may lead to differences in the derived components of biological variation. 6 In the present study, assessment of outliers was performed according to a commonly used method, described previously, 6 whereas different approaches have been used in other studies of biological variation.1,2,10,14,17 The correct classification of outliers is not always obvious, and erroneous exclusion of results can have great effects when subjects and sampling occasions are few.
All specimens were stored at −80°C until they were thawed and analyzed in a single run within 8 months (serum samples for analysis of total T4 had an additional freeze–thaw cycle prior to analysis). This approach eliminates the between-run analytical variation and is the ideal option provided that analytes are stable under the storage conditions. 4 One drawback of this study design is that the storage time at −80°C is longer for samples collected at the beginning of the study than for samples collected in the end of the study period. In our study, residual plots were evaluated for differences in variability between sampling occasions, but no such patterns were detected.
Chloride, sodium, calcium, albumin, magnesium, and total protein showed the lowest CVI, and sodium, chloride, and calcium also showed the lowest CVG. This is in agreement with previously published data from studies on humans and cats, where the lowest values for CVI and CVG were found for analytes important for the homeostatic regulation of extracellular and intravascular fluids.1,3 Bile acids had a remarkably higher CVI than the other analytes. This great variability may, in part, be caused by spontaneous contraction of the gallbladder in some of the cats during the prolonged fast. 18
The within-subject variances for sodium and chloride were 0.0, precluding calculation of INDI, RCVs, and analytical performance goals. The higher analytical and between-subject variations of these analytes masked their within-subject variances, which were very small, and the results might have been different if other methods of analysis were used or if more subjects were included in the study. Based on intra-assay CV derived from the mixed-effect model, 6 of 18 analytes in our study (albumin, calcium, cholesterol, fructosamine, magnesium, total protein) did not meet the goal for desirable imprecision, CVDES < 0.5 CVI, and 4 of them (albumin, calcium, fructosamine, magnesium) did not achieve the goal for minimum imprecision, CVMIN < 0.75 CVI. Quality requirements based on biological variation data may, however, be difficult to achieve considering the analytical performance possible with most current instruments. 9
For analytes measured in both our study and a previously published study on biological variation of biochemical analytes in heparin plasma from cats, 1 the CVI differed with a maximum of 5.6% (range: –5.6 to +4.2%); cholesterol differed the most. Differences in CVG were maximally 21.1% (range: –8.0 to +21.1%), with creatinine demonstrating the largest difference. Differences observed may in part be reflective of the differences in breed and age of the cats included in the studies. Type of anticoagulant, site of venipuncture, and position and use of a tourniquet may have effects on measured analyte concentrations in humans, 4 but more studies are needed to determine the possibility of similar effects in cats. Differences may also be attributable to the different number of subjects and sampling occasions included in the studies.
The large difference in CVG for creatinine may partly be caused by the high creatinine concentrations observed for 2 cats in the present study (mean creatinine concentration of 216 and 183 µmol/L, respectively). Serum creatinine varies with amount of muscle mass, and these were the 2 largest cats with the highest body weights. There were no abnormal findings on the weekly clinical examinations or interviews of the owners, but presence of renal disease cannot be excluded in these cats. Diseases may affect biological variation, and this should be taken into account when using RCVs as they are often calculated based on components of biological variation derived from healthy subjects. 16 No studies of the effect of analyte concentrations or disease status on biological variation in cats have been reported, and this needs to be evaluated in future studies.
For 9 of 18 analytes measured in our study, population-based reference intervals were determined to be of limited use. Population-based reference intervals may be stratified in order to increase their utility, and the effect of stratification is greatest when INDI is low for the whole group but high for a subgroup.5,20 In humans, population-based reference intervals are often stratified by factors such as age and sex, 5 but cofactors suitable for stratification may differ between humans and cats 19 and need to be carefully evaluated before any recommendations can be made.
Footnotes
Acknowledgements
We thank all staff at the Clinical Pathology Laboratory, University Animal Hospital, Uppsala, Sweden for their assistance in this project.
Authors’ contributions
U Falkenö and C von Brömssen contributed to analysis and interpretation of data. A Hillström and EM Strage contributed to conception and design of the study, and contributed to acquisition, analysis, and interpretation of data. All authors drafted the manuscript, critically revised the manuscript, gave final approval, and agreed to be accountable for all aspects of the work in ensuring that questions relating to the accuracy or integrity of any part of the work are appropriately investigated and resolved.
a.
BD Microlance (0.9 × 40 mm), BD Diagnostics, Oxford, United Kingdom.
b.
Vacuette, Greiner Bio-One, Kremsmünster, Austria.
c.
EBA 20, Andreas Hettich GmbH & Co. KG, Tuttlingen, Germany.
d.
Architect c4000, Abbot Diagnostics, Lake Forest, IL.
e.
Immulite 2000, Siemens Healthcare GmbH, Erlangen, Germany.
f.
Immulite 2000 canine Total T4 assay, Siemens Healthcare GmbH, Erlangen, Germany.
g.
SAS 9.3, SAS Institute Inc., Cary, NC.
Declaration of conflicting interests
The author(s) declared no potential conflicts of interest with respect to the research, authorship, and/or publication of this article.
Funding
The author(s) disclosed receipt of the following financial support for the research, authorship, and/or publication of this article: Financial support was kindly provided by the Stina Johansson Fund and the Linnea and Axel Ericsson Fund.