
Abstract
Culture of Mycobacterium avium subsp. paratuberculosis (MAP) is the definitive antemortem test method for paratuberculosis. Microbial overgrowth is a challenge for MAP culture, as it complicates, delays, and increases the cost of the process. Additionally, herd status determination is impeded when noninterpretable (NI) results are obtained. The performance of PCR is comparable to fecal culture, thus it may be a complementary detection tool to classify NI samples. Our study aimed to determine if MAP DNA can be identified by PCR performed on NI environmental samples and to evaluate the performance of PCR before and after the culture of these samples in liquid media. A total of 154 environmental samples (62 NI, 62 negative, and 30 positive) were analyzed by PCR before being incubated in an automated system. Growth was confirmed by acid-fast bacilli stain and then the same PCR method was again applied on incubated samples, regardless of culture and stain results. Change in MAP DNA after incubation was assessed by converting the PCR quantification cycle (Cq) values into fold change using the 2−ΔCq method (ΔCq = Cq after culture − Cq before culture). A total of 1.6% (standard error [SE] = 1.6) of the NI environmental samples had detectable MAP DNA. The PCR had a significantly better performance when applied after culture than before culture (p = 0.004). After culture, a 66-fold change (SE = 17.1) in MAP DNA was observed on average. Performing a PCR on NI samples improves MAP culturing. The PCR method used in our study is a reliable and consistent method to classify NI environmental samples.
Introduction
Mycobacterium avium subsp. paratuberculosis (MAP) is the etiologic agent of paratuberculosis, an incurable chronic contagious enteritis of ruminants that causes significant economic losses to the dairy industry,14,20,22 and has been associated with Crohn’s disease in humans.5,15,30 Bacterial culture and identification of MAP is considered the definitive antemortem test to confirm Johne’s disease. 37 Culture of MAP can be performed on individual fecal samples (collected directly from the animal) or environmental samples (collected from sites of manure accumulation in the farms). Environmental sampling is the most cost-effective method to determine herd status. 35 Whether samples are from individual animals or from the environment, the bacterial culture process remains the same. It includes a purification process (or decontamination) to reduce microbial overgrowth, a long incubation period in a selective culture medium (solid or liquid) to promote the growth of MAP, and, finally, identification of MAP by phenotypic or genotypic methods. 37
There are some differences between the culture media used for MAP isolation. Solid medium is less costly than liquid medium, it requires less instrumentation, and MAP identification is simpler. 37 However, MAP growth is slower on a solid medium (10–20 weeks) than in a liquid medium (8–12 weeks). The latter is more sensitive but MAP identification by phenotypic or genotypic methods is required by acid-fast bacilli [AFB] stain or polymerase chain reaction [PCR] assay. As a consequence of microbial overgrowth, non-interpretable (NI) or contaminated samples can be reported with both media. 37
Microbial overgrowth is one of the challenges of mycobacterial culture regardless of which medium is used. In the literature, this phenomenon is referred to as contamination, but this term may be misleading. Often, contamination refers to an inappropriate technique during collection of a specimen or during laboratory procedures. When microbial overgrowth is observed in MAP culture, it reflects the growth of the microorganisms normally present in the feces but not relevant to detection of MAP. This overgrowth of normal gut flora may inhibit MAP growth (fermentation has been proven to inhibit MAP growth in vitro 17 ) or reduce the overall ability to recover and identify MAP. This phenomenon is different from typical sample contamination that can be caused by inadequate sampling, shipping, or laboratory process, as has been described for other substrates such as milk 23 or blood. 9 It has been suggested that microbial overgrowth should be reported as an outcome in methodologic assessments together with isolation rates.10,25,34
Several purification protocols have been developed and studied to reduce microbial overgrowth and to improve MAP recovery. 36 However, neither is the proportion of overgrown cultures always reported in MAP publications nor is there a consistent definition of a NI sample among published studies.10,37 Often, NI samples are assumed negative or excluded from the statistical analysis. The proportion of overgrown cultures reported in the literature is highly variable, 38 as in bovine feces where it has been reported to be from 7% to 44%.7,8 Several factors have been mentioned as having an impact on microbial overgrowth. One study 38 found clustering of NI cultures within submissions and within farms, suggesting seasonal and environmental factors such as the type of feed given to livestock. Microbial overgrowth complicates, delays, and increases the cost of MAP culture 37 and may affect culture sensitivity. Additionally, it may be difficult to correctly assess herd status when NI results are obtained from environmental samples.
Another tool for MAP detection that has been available for several years is PCR. The accuracy of a PCR assay may be different depending on the target, the DNA extraction method used, or the substrate on which the assay is performed. One study 21 evaluated the sensitivity and specificity of 6 DNA extraction kits and several target genes for the detection of MAP DNA from fecal samples collected from infected cows with different levels of shedding. The authors underlined the importance of using the correct methodology in order to have an accurate result. The IS900 DNA insertion sequence is present in 14–20 copies in the MAP genome and is the most common target for MAP PCR and typing because of the high sensitivity of the assay.1,6,24 The performance of PCR has been compared with fecal culture and serum enzyme-linked immunosorbent assay (ELISA) in several studies. In one study, comparing the accuracy of direct PCR on environmental samples with the accuracy of culture in liquid and solid media and serum ELISA, the sensitivity and specificity of real-time PCR were estimated to be 60% and 97%, respectively. 1 In another study, 2 the results of quantitative PCR and culture of pooled and environmental samples were correlated. Whether it is performed directly on fecal specimens or as a confirmatory method, PCR is useful for identifying MAP-infected herds.1,18 Detection of MAP DNA in environmental or individual samples confirms the presence of the microorganism on the farm. On the other hand, a positive PCR on individual fecal cultures may or may not reflect a true infection with a viable microorganism. Overall, PCR performed on NI environmental samples may be a useful complementary tool for classification and improving the detection of MAP infected herds without necessitating additional sampling.
The main objective of our study was to determine if MAP DNA can be detected by a PCR method performed on NI environmental samples overgrown by other microorganisms. A secondary objective was to evaluate the performance of the PCR before and after incubation in an automated system. a
Materials and methods
Sample selection
Environmental samples from a previous study 3 were purposively selected. Samples were collected using a standardized technique, 3 between June 20 and November 24, 2011 from different environmental sites of manure accumulation in tie-stall dairy herds with known MAP status. Herds were located in 4 regions of Québec, Canada. The median herd size was 59 lactating cows (30–211 cows). Most of the herds were exclusively Holstein, 1 herd was exclusively Jersey, and, in the other herds, other breeds were also present (Brown Swiss and Jersey). 3 Samples were kept frozen at −70°C until cultured at the Québec Animal Disease Surveillance Laboratory (LEAQ) in Saint-Hyacinthe, Québec, Canada, which is a laboratory accredited for MAP culture by the United States Department of Agriculture (USDA).
Study groups
Samples were divided into groups according to the bacterial culture result obtained in 2011. A total of 62 NI environmental samples (NI group) were included and matched by farm, season, and environmental site with 62 negative environmental samples (negative group). All positive environmental samples obtained in 2011 were also included (positive group; n = 30).
Culture of MAP
Initial isolation of MAP was achieved using liquid medium b and an automated system. a Samples were processed as previously described, 3 following the recommendations of the manufacturer. The initial decontamination, culture, AFB stain, and PCR confirmation were performed as a part of another study, and full details are provided in that study. 3 A brief summary of the methodologies used in this prior work is set out below.
After decontamination, 3 tests were performed in series: 1) incubation in the automated system, a 2) AFB staining, c and 3) confirmatory PCR d applied on incubated samples. The results of these tests were interpreted according to USDA recommendations. 13 A sample was considered positive for MAP culture if flagged positive by the automated system, the AFB stain, and the PCR. Mycobacteria other than MAP were confirmed if the sample was flagged positive by the automated system and positive by the AFB stain but negative by PCR. When a positive signal was flagged by the automated system and the AFB was negative, no PCR was performed, and the sample was declared NI. When no signal was flagged by the automated system, neither AFB nor PCR were applied and the sample was declared negative to MAP culture.
AFB stain c was performed on incubated samples following the recommendations of the manufacturer. The incubated sample was applied to a slide, heat-fixed between 65°C and 75°C for 2 h, stained with auramine–rhodamine for 15 min, washed with distilled water, destained with alcohol-acid for 10 min, washed with distilled water, and counterstained with potassium permanganate. The slide was then washed, dried, and examined by fluorescence microscopy by a trained technician.
Confirmatory PCR d was performed following the instructions of the manufacturer. DNA extraction was performed with a commercial kit, e and amplification was achieved using the reagents recommended by the manufacturer. A quantification cycle (Cq) value was used to establish a cutoff value to discriminate positive from negative samples. For descriptive purposes, samples were declared positive if Cq < 37, suspect if Cq was 37–40, and negative if no signal was detected, as suggested by the manufacturer. d However, for statistical analysis, only 2 categories were considered: positive if Cq < 37 and negative if no signal was detected or Cq ≥ 37.
Study protocol
For our study, all analyses were performed at LEAQ between January and April 2014. After the first culture in 2011, the remaining inoculum of all samples was kept frozen at −70°C for an average of 802 days (range: 610–971 days). These samples were thawed and cultured with the same protocol previously described, 3 except for the following modifications. First, a PCR d was applied directly on all the inocula, which were then incubated in the automated system. a Growth was confirmed by AFB stain c and finally, all the samples were analyzed by PCR d regardless of the outcome of the previous incubation and AFB stain.
Statistical analysis
Descriptive statistics were used to characterize the freezing time and microbial growth variables such as the time to detection (defined as the number of days to flag a positive signal in the automated system a ) and the microbial growth index units (which is a measure of the fluorescence emitted caused by oxygen consumption by the microorganisms in the tube) within the groups. Distribution of the results by group was also described. Kruskal–Wallis rank test was used to compare mean growth units and mean time to detection between the study groups (NI, negative, and positive) within each incubation time. The t-test for paired data was used to compare mean growth units and mean time to detection between incubations for each group of samples. Normality distribution of the differences was evaluated using the normality probability plot. McNemar test for paired data was used to compare the performance of PCR within the groups when applied before and after culture. PCR Cq values were converted into fold change using the 2−ΔCq method, 31 where ΔCq = (Cq after the culture − Cq before the culture), in order to assess the relative change in the amount of MAP DNA after incubation.
Results
A total of 154 environmental samples from 23 Québec dairy herds were studied. The NI samples and negative samples were matched by farm, site, and season when possible. Absence of duplicate or negative samples from the same site were the 2 reasons why matching was not always possible. Final matching was as follows: out of the 62 samples from the NI group, 36 were matched by farm, site, and season, 17 samples by farm and season, and 9 samples by farm and site.
Samples experienced 2 freeze–thaw cycles before being processed for the present study. From collection and before the first culture, samples were frozen for 66 days on average (standard error [SE] = 4.0; range, 3–167 days). After the decontamination process for the first culture, the remaining inoculum was frozen for 802 days on average (SE = 8.0; range, 610–971 days). Before processing for the present study, samples had a mean total freezing time of 868 days (SE = 4.5; range, 777–974 days).
The time to detection and growth index of the samples for both incubation times are presented in Table 1. For the first incubation performed in 2011, growth units were significantly higher for NI samples than for positive samples (p = 0.0009); however, there was no statistical difference between the time to detection for these groups of samples (p = 0.6). For the second culture performed in 2014, as with the first culture, growth units were significantly higher for the NI samples compared with the negative and positive samples (p = 0.004), whereas no difference was observed on the time to detection between the groups (p = 0.1). Comparing the first incubation with the second incubation for the samples that were flagged by the automated system at both times within the NI (n = 36) and positive (n = 26) groups, there was no difference for the NI group on either the growth units (p = 0.2) or the time to detection (p = 0.2). For the positive group, no difference was observed on the growth units at both incubation times (p = 0.6); however, time to detection was significantly lower in 2011 than 2014 (p < 0.0001).
Growth units and days to detection of environmental samples collected from Québec dairy herds cultured for Mycobacterium avium subsp. paratuberculosis detection at 2 different times.*
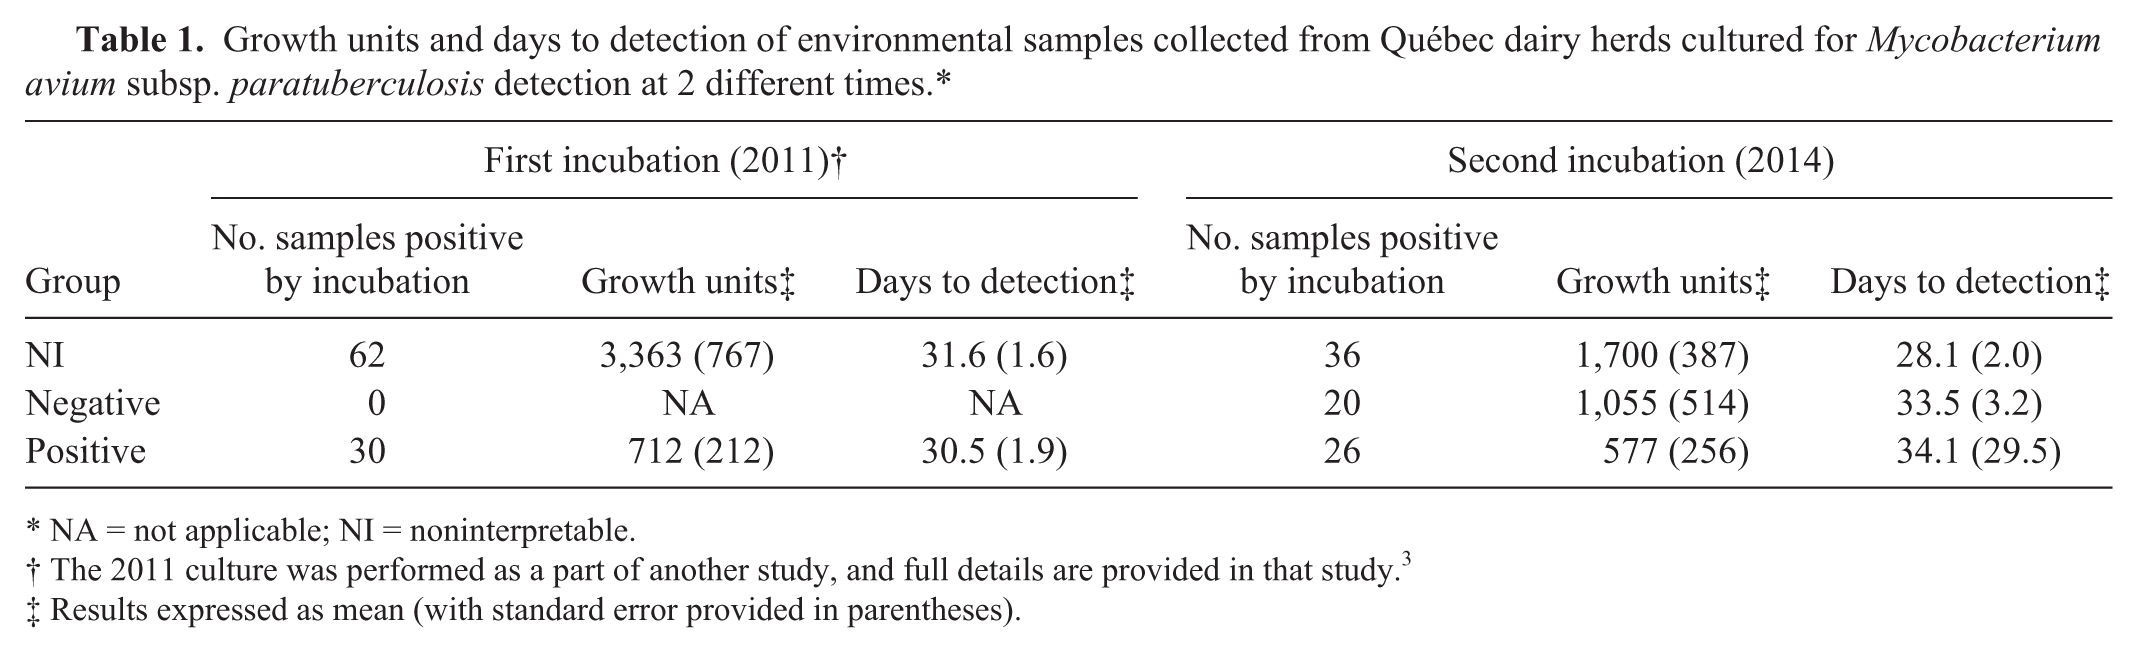
NA = not applicable; NI = noninterpretable.
The 2011 culture was performed as a part of another study, and full details are provided in that study. 3
Results expressed as mean (with standard error provided in parentheses).
PCR on NI samples
Out of the 62 NI samples, MAP DNA was identified from 1 sample (Table 2), which tested positive on all of the tests performed (PCR before culture, incubation, stain, and PCR after culture). This sample was taken from a highly infected herd (concurrent apparent within-herd fecal culture prevalence: 28.6%; number of positive environmental samples: 7/10). 3
Results of a PCR method to detect Mycobacterium avium subsp. paratuberculosis when applied before and after the incubation of environmental samples collected from Québec dairy herds in a commercial automated culture system.*
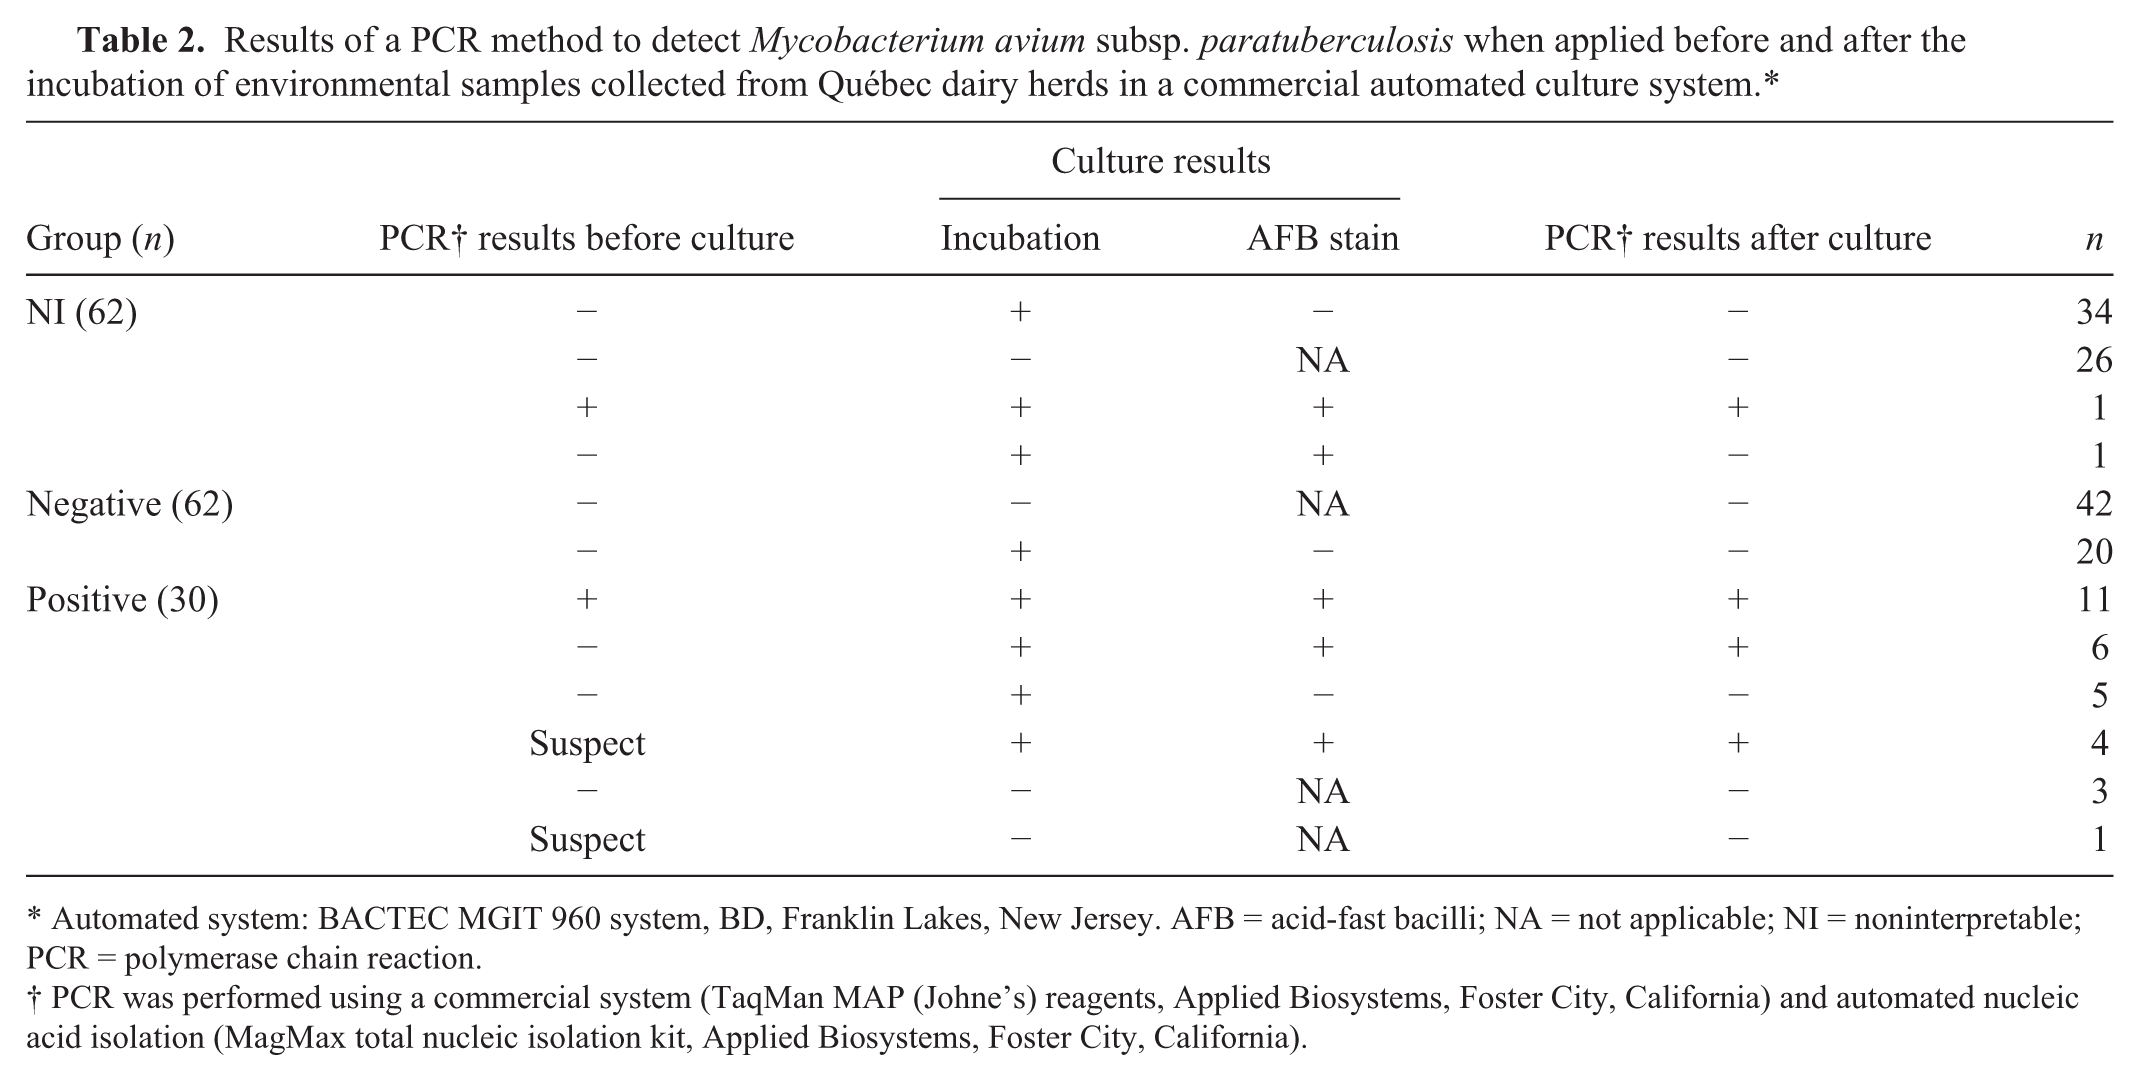
Automated system: BACTEC MGIT 960 system, BD, Franklin Lakes, New Jersey. AFB = acid-fast bacilli; NA = not applicable; NI = noninterpretable; PCR = polymerase chain reaction.
PCR was performed using a commercial system (TaqMan MAP (Johne’s) reagents, Applied Biosystems, Foster City, California) and automated nucleic acid isolation (MagMax total nucleic isolation kit, Applied Biosystems, Foster City, California).
In the remaining 61 NI samples, MAP DNA was not detected by PCR either before or after incubation. In 26 of these samples, the incubation was negative. Microbial growth was detected in the remaining 35 samples by a positive incubation (flagged positive by the automated system), but in only 1 sample was the AFB stain also positive (Table 2). Among the negative samples, MAP DNA was not detected; however, 20 of the 62 negative samples were flagged positive by the automated system (Table 2). These samples would be classified as NI with the 2011 serial testing interpretation.
Performance of PCR before and after culture
All the samples from the positive group that were positive by PCR before culture were positive to PCR after culture (n = 11). Also, 4 of 5 suspect samples by PCR before culture were positive by PCR after culture. These samples were also flagged positive by the automated system and AFB stain. The remaining suspect PCR sample before culture (Cq = 39.09) was negative by incubation (not flagged by the automated system), the AFB stain, and PCR after culture. Fourteen samples were negative by PCR before culture. Among them, 6 samples were flagged positive by the automated system, AFB, and PCR after culture. Five samples were only flagged positive by the automated system, and the 3 remaining samples were negative to all serial tests.
Overall, no difference was observed between the number of samples found positive by PCR before and after culture among the NI group (1 sample was positive both before and after) and negative group (none of the samples were positive). However, PCR yielded more positive results when applied after culture than before culture (p = 0.004) within the positive group.
The PCR Cq values before culture ranged from 29.38 to 39.86, whereas after culture these values ranged from 28.03 to 33.07 (Table 3). The MAP DNA increased after the culture was assessed with the 2−ΔCq method for 16 samples (1 from the NI group and 15 from the positive group), which had Cq values both before and after the culture. On average, a 66-fold increase (SE = 17.1; 95% confidence interval, 29.9–102.8) on MAP DNA was observed after the culture.
Comparative quantification cycle (Cq) values of a PCR method when applied before and after the culture of Mycobacterium avium subsp. paratuberculosis from environmental samples collected from Québec dairy herds.*
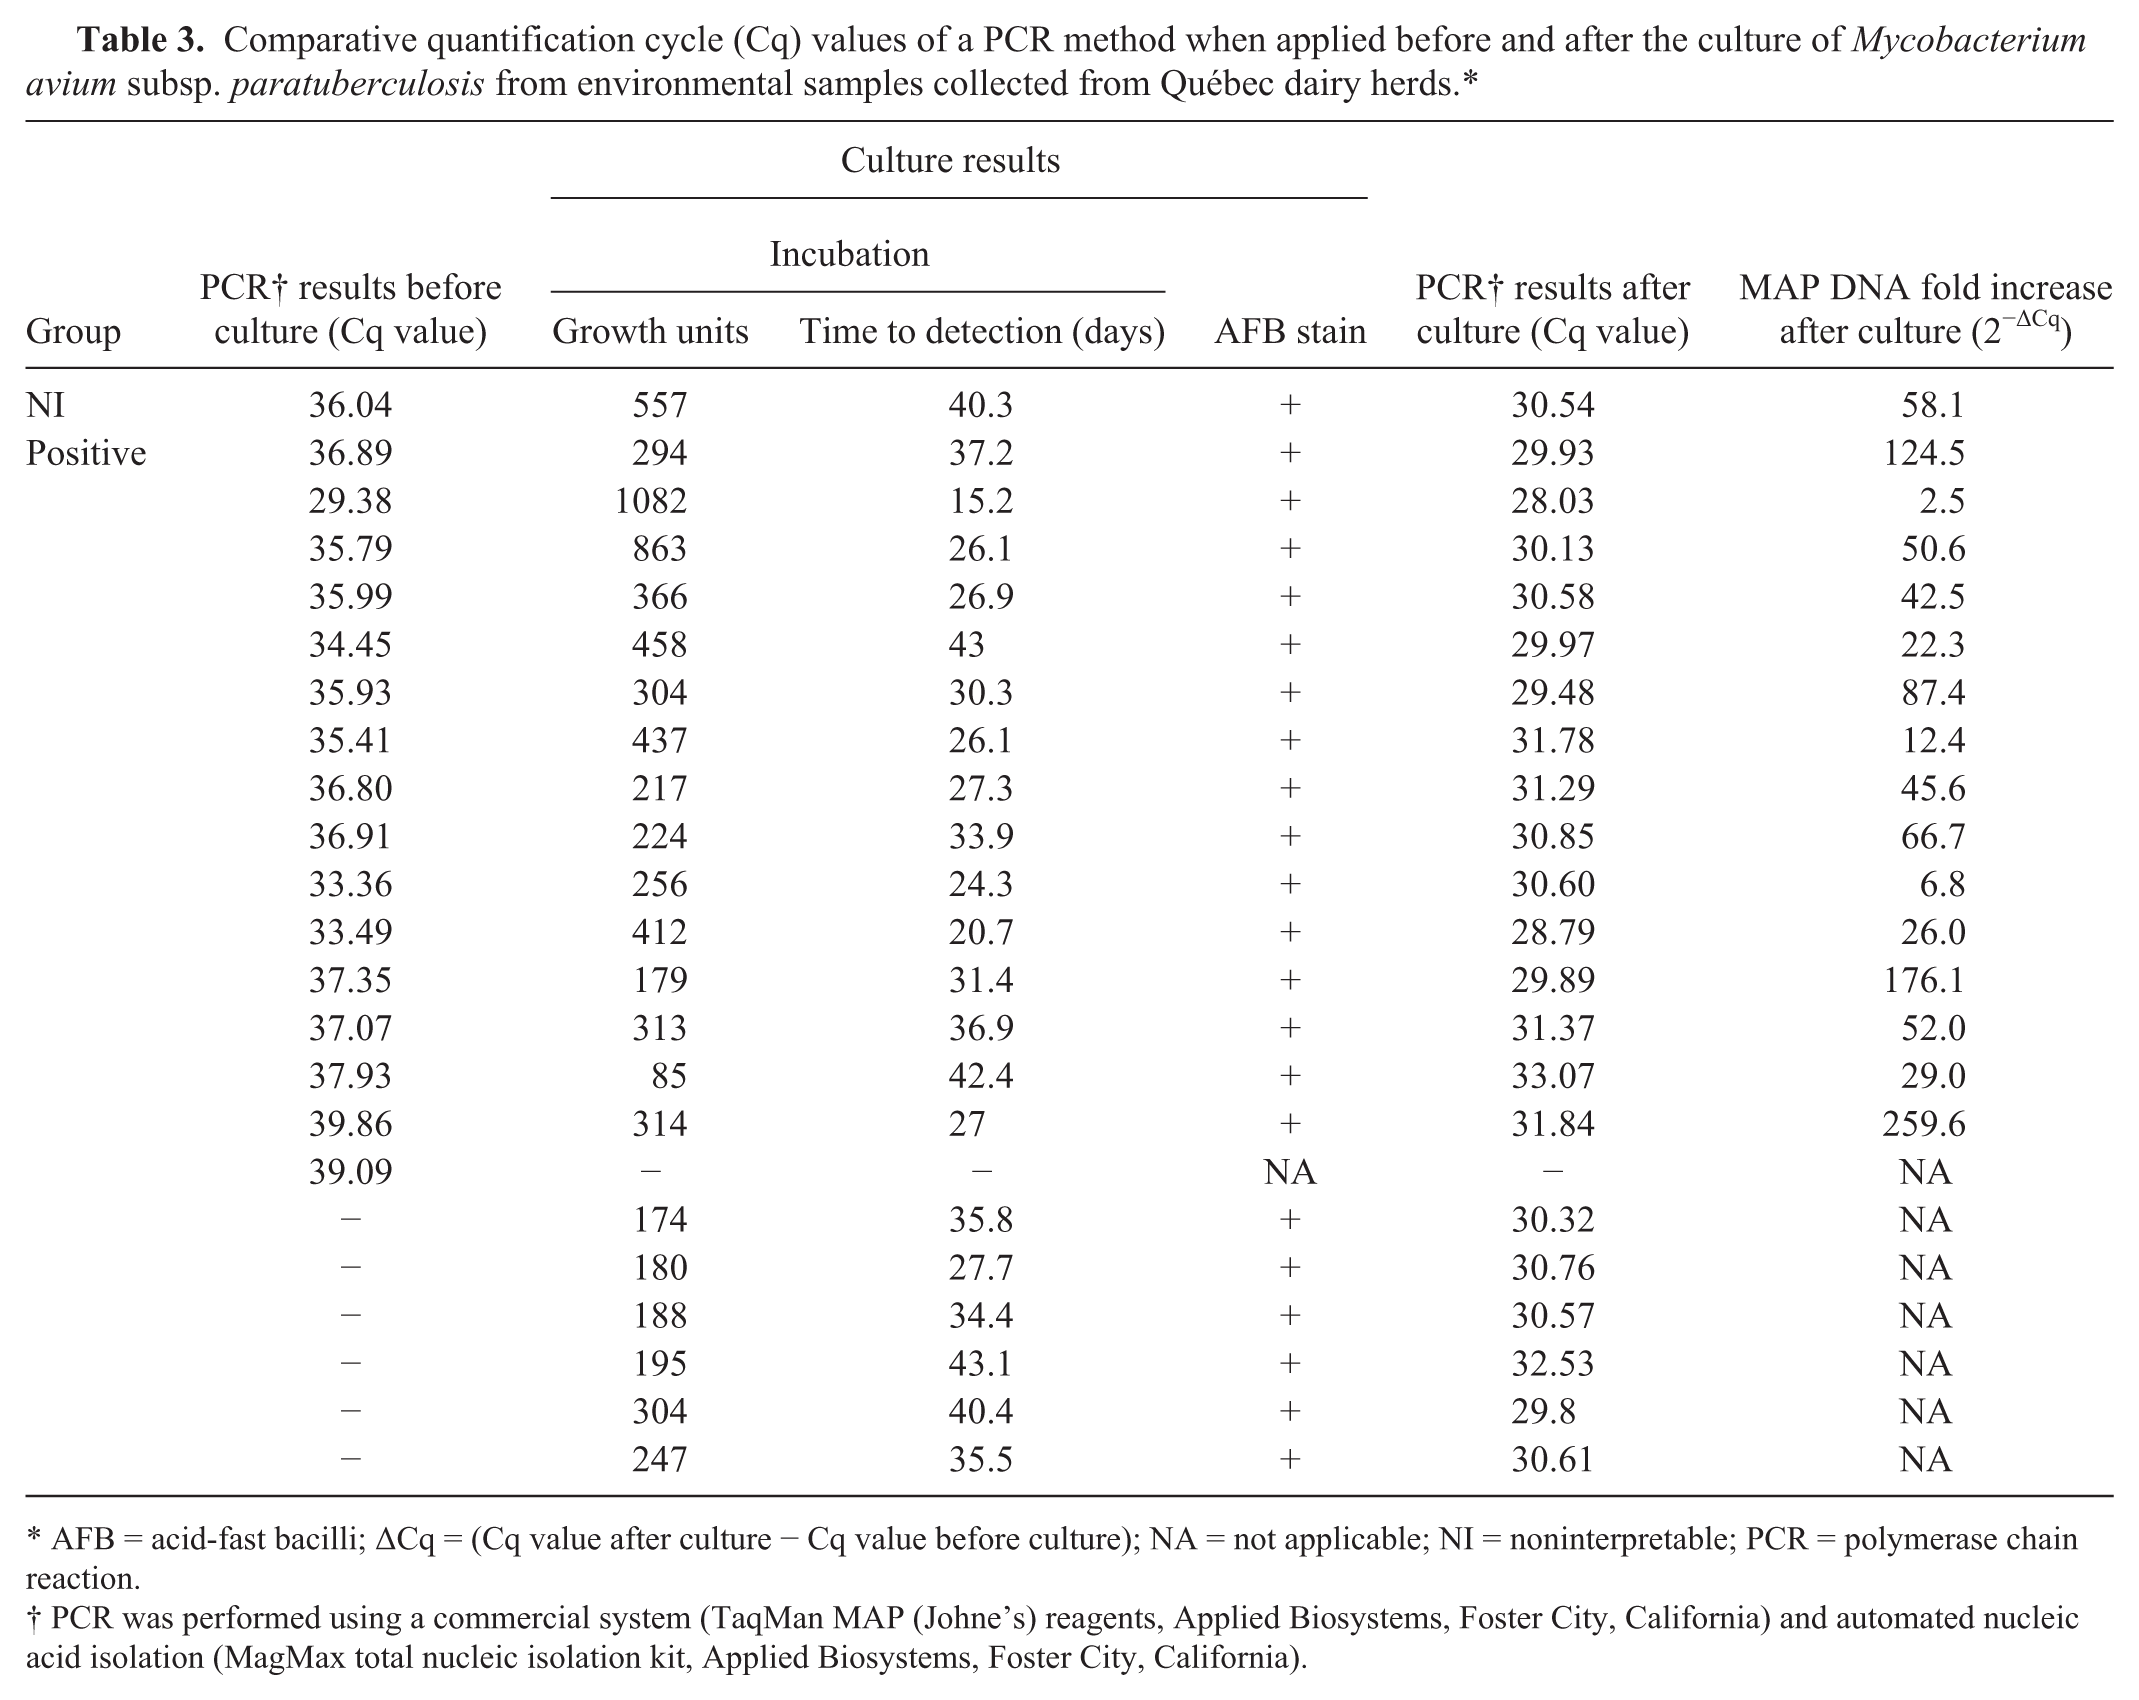
AFB = acid-fast bacilli; ΔCq = (Cq value after culture − Cq value before culture); NA = not applicable; NI = noninterpretable; PCR = polymerase chain reaction.
PCR was performed using a commercial system (TaqMan MAP (Johne’s) reagents, Applied Biosystems, Foster City, California) and automated nucleic acid isolation (MagMax total nucleic isolation kit, Applied Biosystems, Foster City, California).
Discussion
Application of a PCR to NI environmental samples identified only 1 NI sample (1.6%) as positive when applied before or after culture. This sample was most likely a true positive sample, based on the positive results after incubation and AFB stain performed in the present study. Moreover, the sample was collected from an infected herd with a high within-herd fecal culture prevalence in addition to other positive environmental samples collected during the same visit.
NI samples are not commonly mentioned in scientific publications; they are likely assumed MAP culture negative or excluded from the analysis. According to our study, considering NI samples as negative would misclassify a small percentage of samples (1.6% of the NI samples), which was coherent with the workflow of a positive sample (flagged positive by the automated system, AFB stain, and PCR).
Use of PCR after culture in known positive samples yielded a significantly higher number of positives than prior to incubation. In our study, the same PCR method had a significantly better performance when applied after culture (as a confirmatory method) than when applied before culture. An almost 2-fold increase in the number of positive samples was observed. This finding is in accordance with a previous report that suggested a greater sensitivity of PCR when used to confirm MAP from previously cultured samples.
6
The incubation process increased the amount of MAP as expected, increasing as well the chance of detection of MAP DNA by PCR. In 45% of the PCR-positive samples after culture, the amount of MAP DNA was not detectable or was in very low levels before culture. The mean increase in MAP DNA of 66 fold after culture (calculated as
A previous study 21 evaluated the ability of 6 fecal DNA extraction kits to obtain MAP DNA from feces. In that study, 21 the sensitivity and specificity of these kits for different target genes were assessed, and the results highlighted the importance of using the correct methodology in order to have a reliable result. According to the results, the PCR method used in our study had one of the greatest sensitivity (88.2%) and specificity (100%) values. In the prior study, 21 a direct PCR was performed on individual fecal samples (instead of environmental) without a decontamination treatment collected from known status cows housed at the National Animal Disease Center in Ames, Iowa. Our results support those findings, although the sensitivity observed in the present study appeared to be lower after the decontamination process and the freezing period of the samples. The PCR method used in our study seems to be a reliable and consistent method to confirm MAP for 3 reasons: 1) every positive result after culture was preceded by a positive signal from the automated system and a positive AFB stain, 2) results were always negative after a negative AFB stain, and finally, 3) there were no positives found in the negative group.
The identification of MAP by either genotypic or phenotypic methods has been suggested by the manufacturer a and the literature. 37 In the MAP culture process, 3 serial tests are applied to confirm a positive sample (incubation, AFB stain, and PCR). For the purpose of our study, we included a confirmatory PCR regardless of the results obtained by incubation and AFB stain. However, we observed that every negative result for the AFB stain was in agreement with a negative result by PCR (100% of the time). It seems that performing a PCR on incubation- and AFB-negative samples does not provide additional useful information. In the same way, a positive AFB was PCR positive 95.7% of the time, suggesting that the AFB step has important value in the whole MAP culture process. This finding supports the recommendation of the manufacturer a who proposes performing either an AFB stain or a PCR after a positive signal flagged by the automated system in order to identify MAP. An AFB stain performed on incubated culture medium by trained laboratory personnel is an economical method to confirm MAP from samples flagged positive by the automated system.
The freezing periods may have an impact on the number and survival of other microorganisms and MAP. In our study, no statistical difference was observed on the growth units and detection time between the 2 incubations within the NI group despite the long freezing period. One would expect that growth units would be higher if the study was performed on fresh fecal samples. However, within the positive group, the mean time to detection was significantly lower in the first incubation compared to the second, suggesting that freezing may reduce the amount of MAP. Time to detection has been suggested as an approximate measure of shedding level, 13 with the suggestion being that the automated system will flag a signal before 21 days for a heavy shedder and after 30 days for low shedders. The freeze–thaw cycles may reduce microbial overgrowth, add several days to detection, and reduce MAP recovery of samples from low shedders. 13
In our study, viable MAP was detected by automated culture in 70% of the samples from the positive group. Previous studies assessing the impact of freezing on MAP viability concluded that storage of samples at −70°C causes a less harmful effect on MAP viability, varying from none (if kept for 3 months) to 14% monthly loss of MAP bacterial load.19,27,28 In theory, if MAP is not viable, PCR should be able to detect its DNA unless it is present in too small a quantity, not evenly distributed in the samples (lack of homogeneity), or inhibitors are present. It has been reported that microbial overgrowth can interfere with PCR assays that target IS900, and the samples with this feature require further DNA purification in order to obtain a positive result. 38 Inhibitors can vary according to the type of sample. Polysaccharides are one of the most common inhibitors found in feces. They change the chemical properties of nucleic acids. 32 Environmental samples may contain proteins, polyphenols, polysaccharides, metal ions, and RNases, 29 as well as humic and fulminic acids that are able to inhibit PCR reactions even at low concentrations. 16
Samples from the NI group had the highest growth units at both incubations. Even though there was not a statistical difference on mean growth units between both incubations, we observed that mean growth units halved at the second incubation, possibly by a reduction of bacterial load as a result of the long freezing period. The similarity in the average time to detection within the NI group may be attributed to the absence of available nutrients caused by consumption by growing bacteria. In our study, no microbial growth was observed on almost half of the samples from the NI group. Surprisingly, microbial growth (as detected by a positive signal of the automated system) was confirmed on approximately one-third of the samples from the negative group (microbial growth was not detected on the first culture, as they were considered negative by MAP culture). Several hypotheses may explain this phenomenon: lack of homogeneity of the sample, 27 survival of spore-forming bacilli and fungus beyond the freezing period, cross-contamination, and/or high sensitivity of automated liquid systems. Spore-forming bacilli have been proven to survive extreme conditions.4,33 It may be possible that bacteria that were in spore form may have passed to a vegetative form under the favorable conditions of the enrichment broth and the incubation performed in this study. In addition, false-positive readings caused by cross-contamination have been reported when using automated liquid culture systems for the isolation of M. tuberculosis and M. avium. 11 These culture systems are considered too sensitive as they can flag growth of any bacterial species, 26 which necessitates further MAP confirmation. The enrichment of the culture tubes for the automated system may contribute to microbial overgrowth, as found by a previous study that compared 2 automated systems for MAP culture. 12
The PCR method used in our study detected MAP from NI environmental samples. Performing a PCR on NI samples may contribute to improving the MAP culture process, eliminating the NI outcome, and thus increasing the certitude of culture results. However, the associated costs need to be taken into account, as only a small percentage of positive results may be obtained. Bacterial culture significantly increased PCR performance. This study underlines the value of AFB stain, as the results from this test were strongly correlated with PCR outcome. The PCR method used in our study was highly specific, as it was always negative after a negative AFB stain, and no positive results were obtained on the samples from the negative group. Thus, performing a PCR when no signal is flagged by the automated system and when the AFB stain is negative does not provide additional useful information. A positive AFB stain, when performed by trained laboratory personnel, is highly suggestive of a positive MAP culture result. The PCR method used in our study is a reliable confirmatory method, as all PCR-positive results were always preceded by a positive incubation and a positive AFB stain.
Footnotes
Authors’ contributions
JC Arango-Sabogal contributed to conception and design of the study; contributed to acquisition, analysis, and interpretation of data; and drafted the manuscript. O Labrecque contributed to design of the study; contributed to analysis of data; and critically revised the manuscript. J Paré contributed to conception and design of the study; contributed to interpretation of data; drafted the manuscript; and critically revised the manuscript. JH Fairbrother contributed to analysis and interpretation of data, and critically revised the manuscript. JP Roy contributed to conception and design of the study; contributed to analysis and interpretation of data; and critically revised the manuscript. V Wellemans contributed to conception and design of the study; contributed to interpretation of data; and critically revised the manuscript. G Fecteau contributed to conception and design of the study; contributed to acquisition, analysis, and interpretation of data; drafted the manuscript; and critically revised the manuscript. All authors gave final approval, and agreed to be accountable for all aspects of the work in ensuring that questions relating to the accuracy or integrity of any part of the work are appropriately investigated and resolved.
a.
BACTEC MGIT 960 system, BD, Franklin Lakes, NJ.
b.
BD MGIT Para TB culture media, BD, Franklin Lakes, NJ.
c.
TB fluorescent stain kit, Fisher Scientific, Ottawa, Ontario, Canada.
d.
TaqMan MAP (Johne’s) reagents, Applied Biosystems, Foster City, CA.
e.
MagMax total nucleic isolation kit, Applied Biosystems, Foster City, CA.
Declaration of conflicting interests
The author(s) declared no potential conflicts of interest with respect to the research, authorship, and/or publication of this article.
Funding
The author(s) disclosed receipt of the following financial support for the research, authorship, and/or publication of this article: This study was funded by Pfizer-Zoetis and the Ministry of Agriculture, Fisheries and Food of Québec.