
Abstract
The objectives of this study were to establish feline references intervals for 3 commercial whole blood platelet function test analyzer systems: Multiplate analyzer (MP; Roche Diagnostics International Ltd., Rotkreuz, Switzerland), Platelet Function Analyzer-100 (PF: Siemens Canada, Mississauga, Ontario, Canada), and Plateletworks Combo-25 kit (PW; Helena Laboratories, Beaumont, TX). Venipuncture was performed on 55 healthy sedated cats, and platelet aggregation in response to adenosine diphosphate (ADP), collagen (COL), and arachidonic acid (AA; MP only) was assessed using citrated blood. For the MP analyzer, median (95% confidence intervals [CIs]) area under curve (Units) for ADP, COL, and AA agonists were 87 (11–176), 81 (32–129), and 91 (59–129), respectively. For the PF analyzer, median (95% CIs) closure time, using COL–ADP cartridges, was 69 (46–89) sec. For the PW assay, median (95% CIs) percent aggregations for ADP and COL agonists were 71 (18–92) and 49 (9–96), respectively, using impedance hematology analyzer platelet counts, and 94 (25–98) and 68 (14–119), respectively, using flow cytometry hematology analyzer platelet counts. There were low correlations between the PF analyzer (COL–ADP cartridge) and MP analyzer (COL agonist; ρ = 0.11), and between the PF analyzer (COL–ADP cartridge) and PW assay (COL agonist using impedance platelet counts; ρ = 0.14). The PW assay percent aggregations using impedance and flow cytometric platelet counts were correlated for both ADP (ρ = 0.64) and COL (ρ = 0.64) agonists. Platelet function testing using these tests are feasible in cats, but 95% CIs are wide, so single results may be difficult to interpret. Platelet counting by impedance or flow cytometry may be used for the PW assay but are not interchangeable.
Introduction
Normal hemostasis requires a highly complex series of coordinated interactions between endothelial cells, platelets, and hemostatic proteins. Tests of hemostasis are commonly used in the diagnosis of hemostatic disorders and are also important in the monitoring of anticoagulant therapy. With respect to primary hemostasis, optical aggregometry using platelet-rich plasma (PRP) has historically been used as the standard for assessment of platelet function.11,21 Optical aggregometry evaluates platelet function based on the ability of platelets to aggregate on addition of platelet agonists, such as adenosine diphosphate (ADP), collagen (COL), and arachidonic acid (AA). When an agonist is added to PRP, light transmission patterns are altered, which reflect platelet activity. Unfortunately, the preparation of PRP is operator intensive and is too cumbersome for routine clinical application.11,14,21 It is also operator dependent, and may activate platelets and possibly alter their function.11,14,21 Although template bleeding time is a readily available test of primary hemostasis, it does not reflect the function of platelets exclusively, is also subject to operator variation, and may be displeasing to owners.1,21
More convenient point-of-care methods for assessing platelet function in whole blood have been developed for humans, specifically analyzer systems that have been coded as MP, a PF, b and PW. c These tests assess platelet aggregation in response to agonists using different methods, and may be used to assess congenital and acquired platelet function defects, to monitor antiplatelet therapy for cardiac conditions, and to assess for risk of hemorrhage and the need for blood products prior to cardiac surgery.11,28 Platelet function has been variably evaluated with these tests in dogs, pigs, sheep, and horses.3,20,29 Studies have also used these tests to evaluate platelet function in cats; however, the literature is limited.17,22,26
Whole blood aggregometry using electrical impedance has gradually become preferred over PRP-based optical aggregometry as the standard test in some laboratories.9,20,33 Similar to optical aggregometry, impedance aggregometry measures platelet function by determining aggregation after addition of an agonist. However, instead of aggregating freely in liquid phase, the platelets aggregate on 2 electrodes within a test cell, subsequently decreasing the electrical conduction between them.11,21
Impedance whole blood aggregometry requires a smaller sample volume and less manipulation of platelets, thereby decreasing the risk of platelet activation prior to analysis.11,20,33 Furthermore, it may be more representative of platelet aggregation in vivo as cellular components are present. The MP analyzer incorporates the principles of impedance whole blood aggregometry in an automated user-friendly device. This device reports the change in electrical impedance as platelets aggregate in proprietary aggregation units over time, and calculates the area underneath the platelet aggregation curve (AUC). Use of this device in animals has been evaluated in dogs, sheep, and in cats.3,12,26 In the feline study, blood from 10 healthy cats was combined with eptifibatide or abciximab in vitro, and reduced platelet function was demonstrated for the former drug but not the latter. 26
The PF analyzer is a point-of-care platelet function test that has been evaluated more extensively in animals. 21 It is designed to be an in vitro substitute for template bleeding time. Platelet function is measured in terms of closure time (CT). The CT represents the duration of time, in sec, which is required for a platelet plug to form and prevent flow of blood through an aperture under high shear stress conditions in the presence of agonist combinations of either COL and ADP or COL and epinephrine. This analyzer was used in a previous feline study, where platelet function between 42 healthy cats and 30 cats affected with hypertrophic cardiomyopathy was compared. 21 There was no difference in platelet function between the groups, but the study did not compare the results of the assay with optical or impedance aggregometry.
The PW assay is approved for use in human medicine to monitor the use of the anti-platelet drugs aspirin and clopidogrel.28,37 This assay is potentially more readily available than other platelet function tests as it makes use of standard hematology analyzers. By measuring and comparing platelet counts between an ethylenediamine tetra-acetic acid (EDTA)–anticoagulated blood sample and a blood sample mixed with a platelet agonist, which decreases the number of individual platelets available for counting, the percentage of aggregated platelets can be calculated.28,37 Use of the PW assay has been described in a previous feline study, which demonstrated that platelet function was impaired in healthy cats that had been given 18.75 mg/cat of clopidogrel. 18 However, the PW assay has only been validated for use on impedance-based hematology analyzers, and its utility on analyzers that use flow cytometry is unknown. As hematology analyzers based on flow cytometry are becoming more commonplace in research, reference, and point-of-care laboratories, compatibility with PW could make platelet function testing even more accessible.
Cats with hypertrophic cardiomyopathy are at risk for thromboembolism and are therefore prescribed anti-platelet drugs.16,34 Evaluating anti-platelet drug effect in these animals in the past has been problematic because of the aforementioned problems with platelet function testing. Less cumbersome platelet function testing is now potentially available for this purpose; however, evaluation in cats is limited. The objectives of our study were therefore to establish institutional feline references intervals (RIs) using 3 tests that assess platelet function in whole blood by different principles: MP by electrical impedance, PF by mechanical aperture closure, and PW by platelet counting. A secondary objective was to compare results of PW when platelet counting is performed using an impedance-based analyzer d and flow cytometry. e
Material and methods
Cat selection
Healthy cats belonging to staff and students at the Ontario Veterinary College, University of Guelph (Canada), were recruited with informed consent. Cats were considered healthy based on history, physical examination, complete blood cell count,
e
serum biochemical profile,
f
and tests for Feline leukemia virus and Feline immunodeficiency virus.
g
Activated clotting timeh,i was performed if sufficient whole blood was available at the time of collection. A coagulation profile, including prothrombin time,j,k activated partial thromboplastin time,j,l fibrinogen concentration,j,m and
Blood collection
In a quiet and controlled environment, fasted cats were sedated with ketamine o (2 mg/kg) and butorphanol p (0.2 mg/kg) intravenously, via a saphenous vein, for atraumatic jugular venipuncture performed using a 21-gauge butterfly catheter. q All venipunctures were performed by a single investigator (KK Ho). Blood was collected directly into vacuum blood collection tubes in the following order: one 4.0-mL serum tube r (1 mL collected), one 4.5-mL 3.2% sodium citrate (0.105 M) tube s ensuring a 9:1 blood-to-citrate ratio, and one 2.0-mL K2EDTA tube t ; followed by indirect blood collection of 2–3 mL through the butterfly catheter using a 6-mL plastic syringe u for transfer of 1 mL of blood into each of 2 PW tubes (which do not have a vacuum), containing either ADP c or COL, c to ensure a consistent blood-to-agonist ratio. All blood collection tubes and syringes were handled by a single investigator (ACG Abrams-Ogg). Blood collection tubes were gently inverted during and after blood collection to mix the blood and anticoagulant. For logistical reasons and to standardize time of platelet function analysis for the various tests after blood collection, equilibration at room temperature was limited to 10–15 min on a blood tube rocker v prior to analysis of the first replicate. Patient compliance during venipuncture, venipuncture score, and flow of blood during blood collection were documented. 4 Blood smears were made from EDTA-anticoagulated blood samples and evaluated microscopically for platelet clumps. All blood collections and tests were performed during two 3-week periods, 1 month apart. All samples were collected between 9:00 and 15:00.
The MP analyzer
Analysis with the MP analyzer was performed on citrated blood samples using ADP, w COL, x and AA y as agonists. Each agonist was prepared as instructed by the manufacturer by adding 1 mL of distilled water to lyophilized stock. Reconstituted agonists were stored in 200-µL aliquots at −20°C for a maximum of 28 days (ADP and AA) or 4°C for a maximum of 7 days (COL) and allowed to warm to room temperature just prior to analysis. The MP analysis was carried out as instructed by the manufacturer. Using the automated pipette system on the instrument, 300 μL of isotonic NaCl, prewarmed to 37°C, was mixed with 300 μL of citrated whole blood in the test cell z and allowed to incubate for 3 min at 37°C prior to the addition of 20 μL of reconstituted AA agonist. For ADP and COL analyses, 300 μL of isotonic NaCl with 3 mM CaCl2 aa was used in place of isotonic NaCl alone for sample re-calcification. The final agonist concentrations used in each analysis were 6.5 µM ADP, 3.2 µg/mL COL, and 0.5 mM AA. Each test cell performed 2 measurements for a total analysis time of 6 min, and mean AUC were reported and used for analysis.
The PF analyzer
Analysis with the PF analyzer was performed using 800 µL of each citrated blood sample with cartridges containing COL–ADP-coated membranes for platelet activation (PF-COL/ADP). bb Cartridges were allowed to warm to room temperature prior to use. Each sample was analyzed in duplicate or in triplicate if a sample error (flow obstruction) was encountered in 1 or both of the first 2 replicates. The mean CT values, in sec, for each cat were used for analysis.
The PW assay
Baseline platelet counts from the EDTA-anticoagulated samples and platelet counts from the PW assay agonist tubes c containing either ADP or COL (PW-ADP and PW-COL, respectively) were analyzed using 2 automated hematology analyzers that use different methods for platelet enumeration. Platelet counts were obtained in either duplicate or triplicate by an impedance analyzer, d and a single platelet count was obtained by a flow cytometry analyzer. e The percent platelet aggregation was calculated using the following formula:
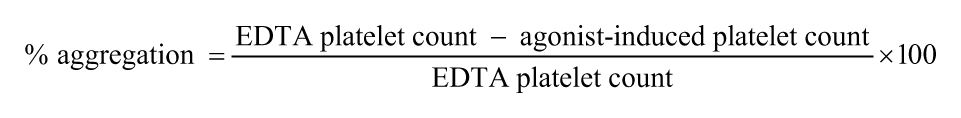
Mean percent aggregation (% Agg) values calculated using impedance-based platelet counts, and single % Agg values calculated using flow cytometric–based platelet counts, were used for analysis.
Reference interval generation and statistical analysis
Data were analyzed using commercial software cc unless otherwise indicated. The distribution of data for each platelet function test was assessed using Anderson–Darling and Shapiro–Wilk tests of normality. Additional software programsdd,17 were used to calculate the lower and upper reference limits (2.5th and 97.5th percentile of each data set, respectively) and their associated 90% confidence intervals (CIs) if possible. Robust or parametric methods of RI generation were used for data, which were normally distributed or log-transformed, based on a sample size (N), 40 ≤ N ≤ 120. When data were not normally distributed or transformed, nonparametric methods of RI generation were used without 90% CI.
Outliers in each data set were identified as values less than the lower quartile (Q1) minus 1.5 × IQR or greater than the upper quartile (Q3) minus 1.5 × IQR, where IQR is the interquartile range. Outliers were removed and RIs recalculated as above.
To assess for analytic variation of PF-COL/ADP, PW-ADP, and PW-COL, intraindividual and interindividual coefficients of variation (CVa and CVg, respectively) and intraclass correlation coefficients (ICC) were calculated. Spearman rank correlation coefficients were calculated to assess for associations between MP (ADP, COL, AA), PF-COL/ADP, and PW (ADP, COL) results. Spearman rank correlation coefficients were also calculated to assess for associations between baseline platelet counts, as performed on the impedance or flow cytometry analyzers, and results of the 3 platelet function tests. Pearson correlation coefficients were calculated to assess for a relationship between PW performed on the 2 hematology analyzers. Linear regression models were used to assess for correlations between results of platelet counts, with or without agonists, and % Agg calculated from values acquired by the impedance and flow cytometry analyzers. The level of significance was set at P < 0.05 for all tests.
Results
Sixty cats were enrolled; however, only 55 cats met inclusion criteria. Four cats were excluded due to behavior and 1 was excluded due to azotemia. The 55 cats included 28 female (27 spayed, 1 intact) and 27 males (all neutered) with an age range of 1–15 years, mean of 5.51 years, and median of 4 years. Forty-eight of 55 cats had coagulation profiles performed; all were normal except for 1 cat with FXII deficiency (Hageman trait). Cats without coagulation profiles had normal activated clotting times. 4 Blood smear evaluations revealed minimal-to-no platelet clumping in all but 4 samples. Subjective scoring of venipuncture technique and flow of blood during blood collection was similar among all cats.
The RIs for the 3 platelet function tests, after removal of outlier data, are summarized in Table 1. The 90% CI for each upper and lower reference limit are included if the RI was calculated using parametric or Robust methods. For MP, CVg ranged from 0.30 to 0.46 using the various agonists. Values for CVa and ICC could not be calculated, as the instrument reports only mean values. For PF-COL/ADP, CVa, CVg, and ICC values were 0.16, 0.11, and 0.66, respectively. For PW-ADP and PW-COL, CVa, CVg, and ICC were 0.31, 0.11, and 0.88, and 0.38, 0.11, and 0.93, respectively, when platelet counts were acquired by impedance. Values for CVa and ICC for PW could not be calculated when platelet counts were acquired by flow cytometry as only 1 value was obtained.
Means, medians, ranges, 95% confidence interval (CI) and associated 90% CI for each upper and lower reference limit (excluding outliers), for whole blood platelet function testing in 55 cats using 3 analyzer systems.*
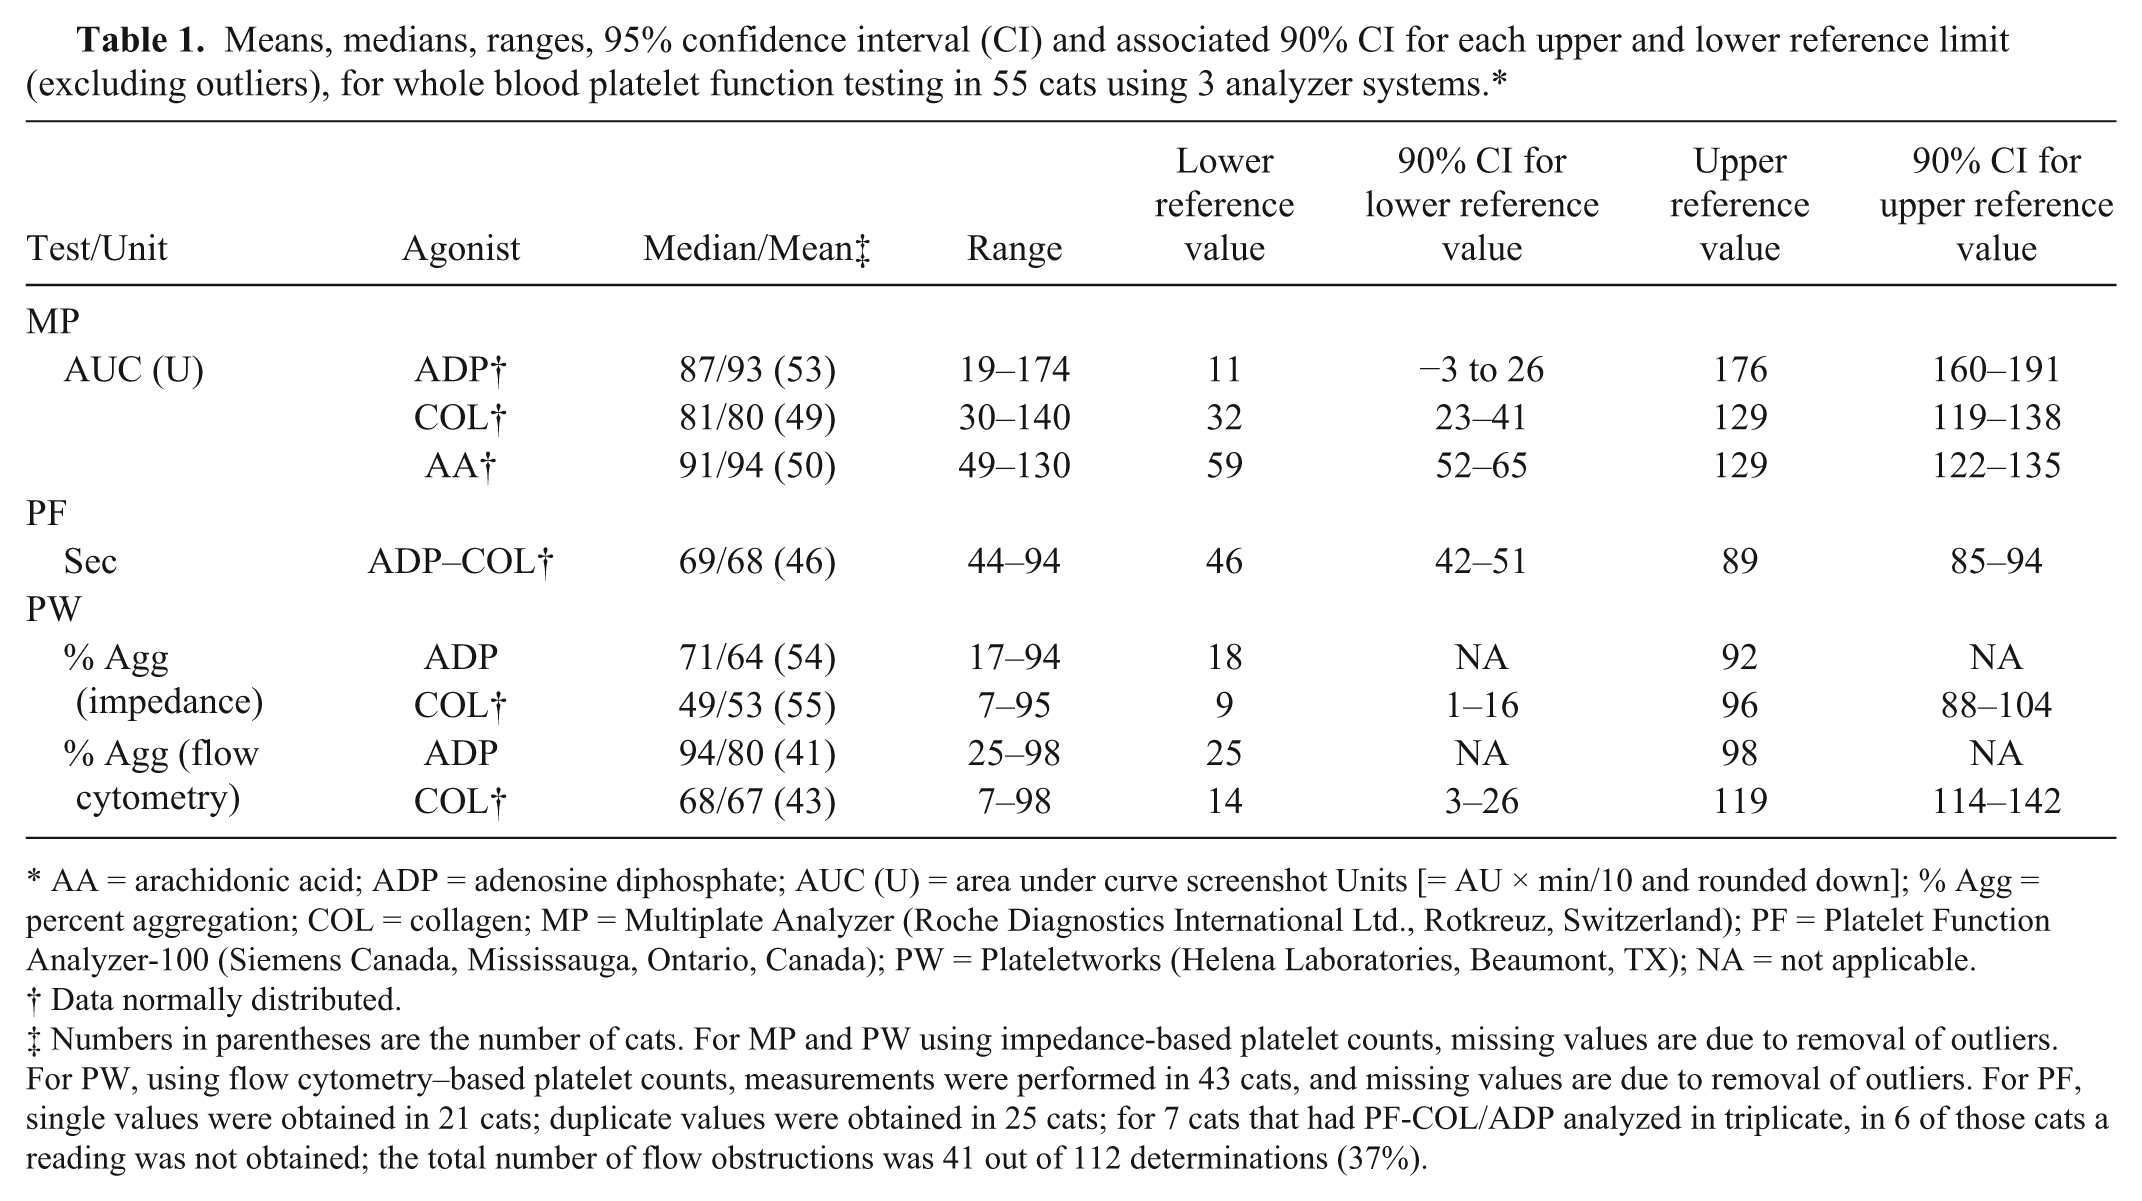
AA = arachidonic acid; ADP = adenosine diphosphate; AUC (U) = area under curve screenshot Units [= AU × min/10 and rounded down]; % Agg = percent aggregation; COL = collagen; MP = Multiplate Analyzer (Roche Diagnostics International Ltd., Rotkreuz, Switzerland); PF = Platelet Function Analyzer-100 (Siemens Canada, Mississauga, Ontario, Canada); PW = Plateletworks (Helena Laboratories, Beaumont, TX); NA = not applicable.
Data normally distributed.
Numbers in parentheses are the number of cats. For MP and PW using impedance-based platelet counts, missing values are due to removal of outliers. For PW, using flow cytometry–based platelet counts, measurements were performed in 43 cats, and missing values are due to removal of outliers. For PF, single values were obtained in 21 cats; duplicate values were obtained in 25 cats; for 7 cats that had PF-COL/ADP analyzed in triplicate, in 6 of those cats a reading was not obtained; the total number of flow obstructions was 41 out of 112 determinations (37%).
There were low but significant correlations between PF-COL/ADP and MP-COL (ρ = 0.11, P = 0.017), and between PF-COL/ADP and PW-COL using impedance platelet counts (ρ = 0.14, P = 0.009). There were no other significant correlations between tests.
Platelet counts and % Agg determined using impedance and flow cytometry for PW are compared in Table 2. Baseline platelet counts measured by both methods were significantly highly correlated, as were PW-ADP and PW-COL platelet counts, but values obtained by impedance were consistently higher than those obtained by flow cytometry. Calculated % Agg from each of these platelet counting methods were significantly moderately correlated, and overall impedance-based % Agg was significantly lower than flow cytometry–based % Agg.
Comparison of PW results using impedance-based and flow cytometry–based hematology analyzers: mean (range) platelet counts; bias between platelet counts (mean [95% confidence interval]); and correlation of platelet counts and % aggregation.*
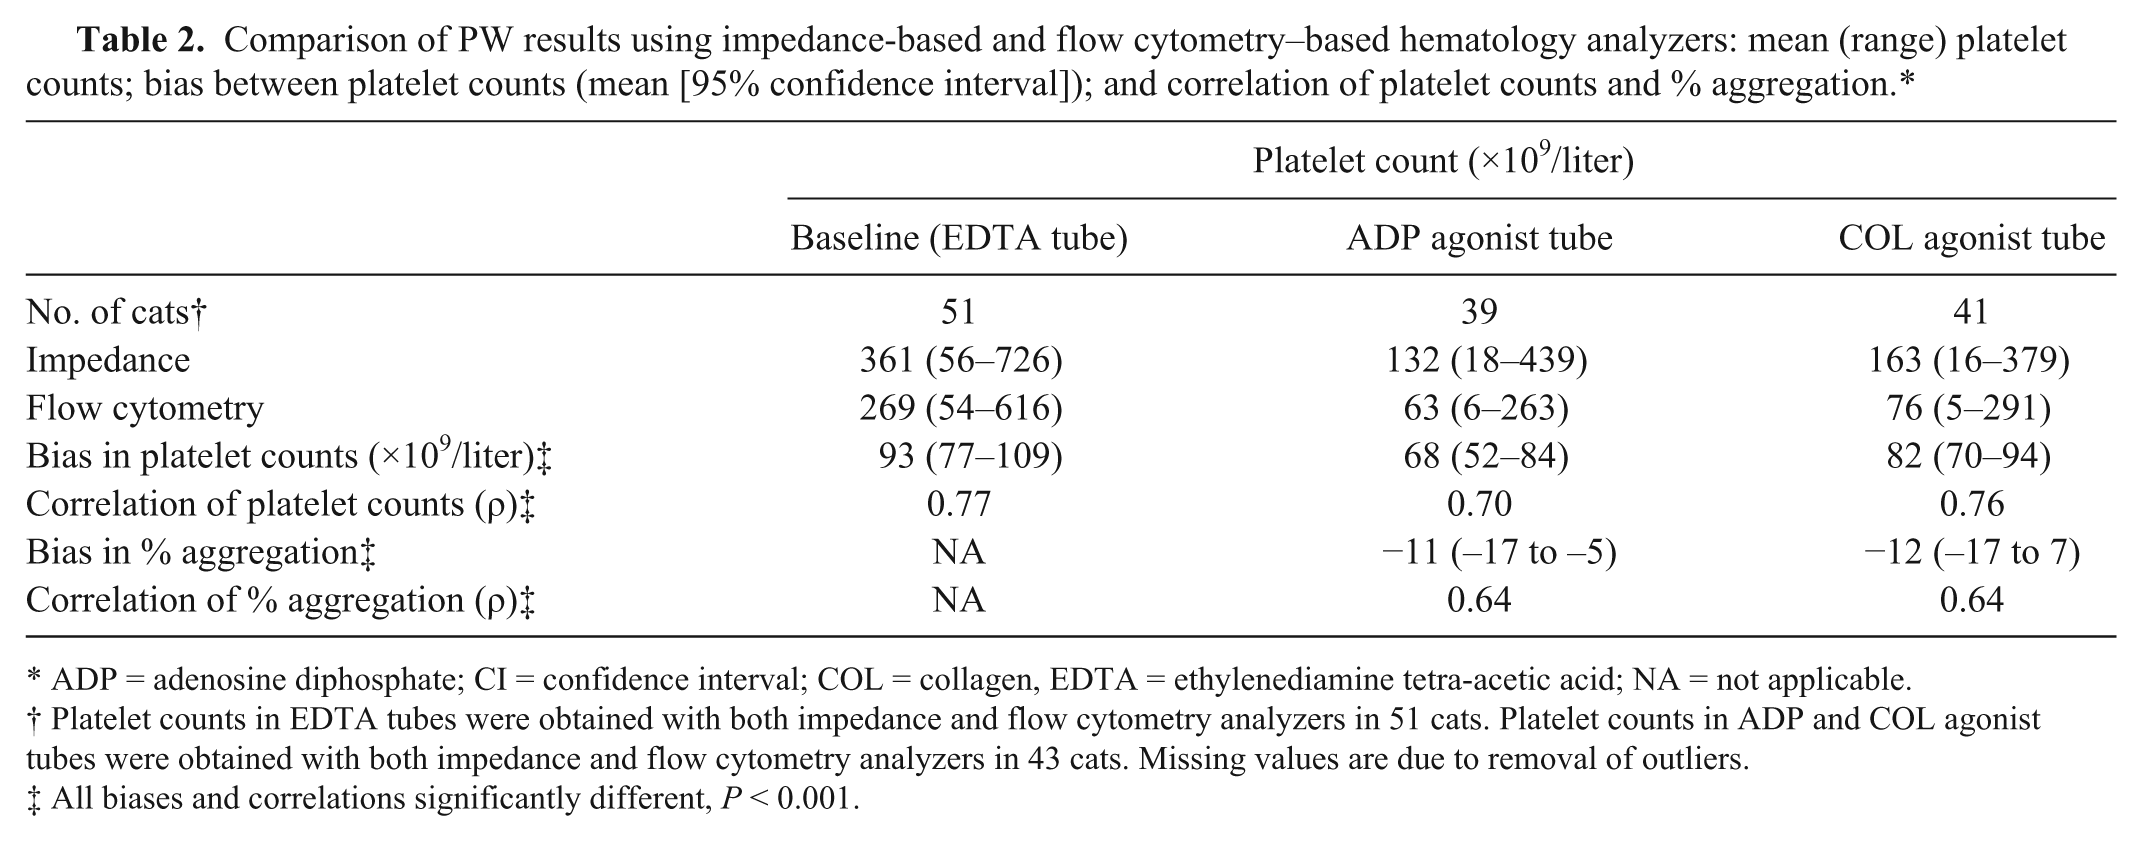
ADP = adenosine diphosphate; CI = confidence interval; COL = collagen, EDTA = ethylenediamine tetra-acetic acid; NA = not applicable.
Platelet counts in EDTA tubes were obtained with both impedance and flow cytometry analyzers in 51 cats. Platelet counts in ADP and COL agonist tubes were obtained with both impedance and flow cytometry analyzers in 43 cats. Missing values are due to removal of outliers.
All biases and correlations significantly different, P < 0.001.
There were low but significant correlations between baseline platelet counts obtained by impedance and MP-COL (ρ = 0.19, P = 0.002) and MP-AA (ρ = 0.13, P = 0.009). There were also low but significant correlations between baseline platelet counts obtained by flow cytometry and MP-COL (ρ = 0.02, P = 0.002) and MP-AA (ρ = 0.17, P = 0.004). There were no other significant correlations between baseline platelet counts and tests.
Discussion
In our study, 3 whole blood platelet function tests were investigated for use in cats. The study confirmed that methods other than optical aggregometry using PRP are feasible for assessment of feline platelet function.
The first feline study of the MP analyzer was reported in 2014. 26 In that study, hirudin was used as the anticoagulant, and ADP and thrombin receptor activator peptide were used as agonists, in concentrations recommended by the manufacturer. In the current study, MP analysis was performed using citrated whole blood with agonists ADP, COL, and AA in concentrations recommended by the manufacturer. The median (87) and range (155) of AUC values with ADP in citrated blood were lower than the previously reported median (306) and range (534) for the same concentration of ADP agonist (6.5 μM) in hirudinized blood. 26 The lower aggregation responses using citrated blood, in comparison to hirudinized blood, is consistent with findings in sheep, dogs, and humans.3,13,23,27,32 Citrate was used in our study to facilitate blood collection for, and comparison between, the 3 platelet function tests.
There were no differences in the MP analyzer aggregation responses with the different agonists (Table 1). This finding is different from humans, where responses to ADP were lower than responses to COL and AA, and for dogs, where responses to AA appear to have been lower than responses to ADP and COL.27,33 Furthermore, aggregation responses in our study appear to be lower than responses in dogs and sheep, and only marginally greater than responses in humans, using the same or comparable agonist concentrations.3,27,32 Cats are considered to have highly aggregable platelets,35,40 so it was surprising that platelet aggregation responses were not higher compared to other species. Studies in dogs and sheep have demonstrated that aggregation responses can be enhanced by changing agonist concentrations, and similar studies in cats may identify optimal agonist concentrations.3,13,25
Sample collection methods were similar in the previous 26 and current study of the MP analyzer in cats, but, in the previous study, samples were allowed to sit for 30 min prior to analysis, 26 while in our study samples were gently rocked for 15 min because of sample handling methods for the PF analyzer and PW assay. Optimum sample handling for cats for the MP analyzer is not known, but it is possible that rocking the samples affected the results. Based on the findings of our study, further examination of preanalytic and analytic variables of the MP analyzer for cats should be pursued.
The use of the PF analyzer with COL–ADP was previously reported in cats. 22 The mean CT was 64 sec for healthy cats in the previous report, 22 while the median CT was 69 sec in our study. The CT range for healthy cats in the previous report was 43–176 sec (and 10th and 90th percentiles ~50 and 120 sec, respectively), which is wider than the range (44–106 sec) and 2.5th and 97.5th percentiles (45 and 104 sec, respectively) reported herein. 22 This appears to be largely due to 4 values in the previous study with values >120 sec. 22 These differences may be attributed to natural variation not captured in our study, but may also be due to preanalytical variables in sample collection, as this has been reported in humans. 25 Sample handling after collection was not reported in the previous study, but in our study, samples were gently rocked for 10–15 min prior to analysis. This was done in part because, during pilot studies, flow obstructions occurred more frequently with samples that were left undisturbed for 30 min then gently remixed prior to analysis than with samples that were continually rocked for 10–15 min (data not shown).
Assay failure due to flow obstruction was encountered with the PF analyzer. Although the number of flow obstructions was not reported in the previous study, 22 it appears to have been less than in our study. The manufacturer indicates that flow obstruction errors are most likely attributable to blood clots in the sample. b Of the 55 samples included in the study, 6 were analyzed in triplicate without producing a result. On EDTA-anticoagulated blood smear evaluation of these 6 cats, only 1 showed moderate-to-marked platelet clumping. Thus, flow obstruction errors may either not be all attributable to microscopic blood clots within the sample, or evaluation of the EDTA-anticoagulated blood smears may not have been a good surrogate for evaluation of microscopic clot formation in the citrated blood samples. It is also possible that rocking of samples prior to analysis contributed to platelet activation and flow obstruction.
Based on similar CT of the 2 studies, the PF analyzer may be a platelet function test that can be performed with relative consistency in healthy cats. However, biological variation was not assessed in the current study, and the wide RI of the PF analyzer with the COL–ADP cartridges may limit its clinical utility in assessing whether a cat has altered platelet function based on a single assessment.
The use of the PW assay using ADP was previously reported for healthy cats. 18 The median % Agg in our study was 71%, while the mean % Agg was 70.55% in the previous feline study when impedance (using a different analyzer) was used as the method for platelet counting. 18 The maximum allowable time until sample analysis was reported to be 30 min. 18 Normal human RIs of 80–100% and 70–100% for ADP and COL, respectively, are provided by the manufacturer. As with the findings for the MP analyzer, the discrepancies between the lower limits of RIs for humans and those developed in our study for cats are surprising given the aggregability of feline platelets.35,40 This may represent an underestimation of the baseline platelet count in some feline samples, which would result in underestimation of percent aggregation. Following the manufacturer’s instructions and the previous study in cats, 18 baseline platelet counts in our study were performed using EDTA-anticoagulated blood. Automated platelet counting in feline EDTA-anticoagulated blood is inherently less accurate than platelet counting in human EDTA-anticoagulated blood and is attributed to platelet aggregation.36,40 The “two-syringe collection method” and prompt analysis used in the current study should have minimized platelet aggregation, and platelet clumping was only readily apparent on blood smear evaluation in 4 cases, but this does not preclude that some degree of aggregation occurred.31,38 The PW assay ADP and COL tubes use citrate as anticoagulant, and it is also possible that feline platelet aggregates in citrate-anticoagulated blood subsequently disaggregate more rapidly than human platelet aggregates. Less stable aggregates would increase platelet counts in the PW assay ADP and COL tubes and thereby underestimate % Agg. Any effect of time, however, should have been minimal as the first replicates were assayed within 10–15 min and the duplicates assayed within 15–20 min (sample analysis time was 4 min).18,37 The upper limit of COL-induced aggregation in our report was >100%, which likely reflects inherent error in platelet enumeration.
The use of the PW assay has only been validated for impedance-based analyzers. Platelet counts vary with the method, therefore it is not surprising that baseline platelet counts and ADP- and COL-induced % Agg determined by impedance and flow cytometry were different.2,7 Specifically, baseline and post-agonist platelet counts using flow cytometry were consistently lower than counts acquired by impedance. The mean (range) baseline platelet counts by flow cytometry in our study were similar to previous studies on a similar analyzer, which reported a mean of 281 × 109/liter, with 2.5th and 97.5th percentile of 42 and 630 × 109/liter, respectively, and a mean (range) of 289 (16–858) × 109/liter, using EDTA-anticoagulated blood.5,30 The RI provided by the manufacturer of the impedance analyzer is 300–800 × 109/liter. In previous studies comparing impedance and flow cytometry–based platelet counts in cats, both comparatively higher and lower impedance-based counts have been reported.2,5,24 Correlations for baseline and postagonist platelet counts between the 2 analyzers ranged from 0.70 to 0.77 (Table 2), likely reflecting some imprecision of platelet counts by both analyzers. A limitation of our study is that only 1 value with the flow cytometry–based analyzer was obtained. This occurred because, logistically, replicates could not be analyzed in <30 min. 18
Although platelet counts obtained by impedance were higher than those obtained by flow cytometry, % Agg was consistently higher when calculated from the latter compared with the former. Mathematically, higher baseline platelet counts will result in higher % Agg, while higher post-agonist platelet counts will result in lower % Agg. The lower flow cytometric counts in the PW assay ADP and COL tubes therefore had a strong enough mathematical effect to increase % Agg values despite the lower flow cytometry–based baseline platelet counts. The % Agg values for the 2 platelet counting methods showed significant but only moderate correlation (Table 2). This is nonetheless promising in supporting the clinical utility of the PW assay in veterinary hospitals, where hematology analyzers using flow cytometry technology are becoming more commonplace. However, we emphasize that the PW assay results for the 2 types of analyzers are not interchangeable.
Thrombocytopenia may influence the results of platelet function tests, including for the MP and PF analyzers.8,19,29 The influence of lower and higher platelet counts within the RI has not been well documented, but is probably low. 19 Platelet counts had a minimal influence on the assays used in the current study, which is attributed to platelet counts remaining within RIs. To further elaborate the effect of platelet count on the MP, PF, and PW analyzer systems in cats, platelet dilution studies would be necessary.
Correlations between results of the 3 platelet function tests were poor. This is perhaps surprising because, although each assay was using a different method, each assay was evaluating platelet aggregation in fresh citrated whole blood using the same agonists (except for the MP analyzer also using AA). The poor correlation may be partially attributed to variable agonist concentrations across the tests. Furthermore, each of the methods inherently have different degrees of variation as demonstrated by ICC values ranging from 0.66 to 0.94, and CVa values ranging from 0.16 to 0.38 for the PF analyzer and the PW assay using COL, respectively. The wide variation within each test and unequal variation between tests probably lowered correlations. Correlations between point-of-care platelet function test results in humans are also generally poor.10,12,28
To minimize the variability of sample collection and release of tissue factor due to traumatic venipuncture, cats in our study were sedated. Mild sedation has been recommended for studies of feline hemostasis and, in some previous studies, cats were sedated with ketamine, acepromazine, and opioids.20,22,39 Nonetheless, the effect of ketamine on feline platelet function is not known, and these results should not be extended to nonsedated cats. Another consideration is that blood samples were not obtained at the same time each day. A diurnal variation has been reported with the PF analyzer in humans. 12 If a diurnal variation in platelet function exists in cats, this could widen RIs. However, this would also make such RIs more clinically relevant as patients would most likely be tested at various times throughout the day.
Two of 8 RIs were generated using nonparametric methods, as the data for these intervals could not be transformed to achieve Gaussian distribution. Recommendations are that RIs generated by nonparametric methods should incorporate >120 reference individuals, as using smaller sample sizes may result in less accurate values. 15 While the number of animals used in our study was a conventional number used for generating RIs for veterinary studies, with the knowledge that nonparametric methods are likely to be needed in the analysis of platelet function tests, future studies should ideally incorporate larger sample sizes (>120 cats) in order to calculate more accurate RIs.
Ideal RIs help identify abnormal values that have clinical implications. Given that RIs developed in our study are not synonymous with the upper and lower thresholds of platelet function required for normal hemostasis, the tendency toward clinical bleeding or thrombosis cannot be inferred from where an individual animal’s values lie relative to the RIs. A study to examine this issue would require a larger sample population with a range of variable platelet function including animals with evidence of clinical bleeding or thrombosis. Cats in our study were also considered to be healthy; however, echocardiograms were not performed, which may have resulted in inadvertent recruitment of cats with subclinical heart disease, potentially altering RIs toward states of increased platelet activity.6,22,34 As such, the platelet function tests for which RIs were developed in our study may be better suited for monitoring the effects of antithrombotic therapy, as they are in humans, and may be more beneficial when using an animal’s own pretreatment values for comparison.10,28 However, for this purpose, biologic variation must also be accounted for in the interpretation of results, and the effects of biological variation on these tests have not yet been investigated.
Platelet function in cats can be assessed with the MP, PF, and PW analyzer systems. However, prior to the routine clinical use of these tests, further evaluation of preanalytical variables (e.g., sample collection and handling) and analytic variables (e.g., anticoagulant and agonist concentrations) are necessary.
Footnotes
Acknowledgements
We thank Dr. William Sears, Department of Population Medicine, and Gabrielle Monteith, Department of Clinical Studies, for assistance with study design and statistical analysis; the veterinary and laboratory technicians, Health Sciences Centre, Department of Clinical Studies; and the Clinical Pathology Laboratory, Animal Health Laboratory, for assistance with blood collection and platelet function testing.
a.
Multiplate analyzer, Roche Diagnostics International Ltd., Rotkreuz, Switzerland.
b.
Platelet Function Analyzer-100, Siemens Canada, Mississauga, Ontario, Canada.
c.
Plateletworks Combo-25 kit (catalog no. 5852), Helena Laboratories, Beaumont, TX.
d.
Vetscan HM5, Abaxis Veterinary Diagnostics, Union City, CA.
e.
ADVIA 2120, Siemens Canada, Mississauga, Ontario, Canada.
f.
Cobas C 501, Roche Diagnostics Canada, Laval, Quebec, Canada.
g.
SNAP FIV/FeLV Combo Test, IDEXX Laboratories Canada Corp., Toronto, Ontario, Canada.
h.
Actalyke MINI II, Helena Laboratories, Beaumont, TX.
i.
MAX-ACT (catalog no. 003054), Helena Laboratories, Beaumont, TX.
j.
Stago STA Compact CT coagulation analyzer, Diamond Diagnostics, Holliston, MA.
k.
STA Neoplastine CI Plus 5 (catalog no. 00606), Diagnostica Stago SAS, Asnières sur Seine, France.
l.
STA C.K. Prest 5 (catalog no. 00597), Diagnostica Stago SAS, Asnières sur Seine, France.
m.
STA Fibrinogen 5 (catalog no. 00674), Diagnostica Stago SAS, Asnières sur Seine, France.
n.
STA Liatest D-Di (catalog no. 00515), Diagnostica Stago SAS, Asnières sur Seine, France.
o.
Vetalar, Bioniche Animal Health Canada, Belleville, Ontario, Canada.
p.
Torbugesic, Zoetis Canada, Kirkland, Quebec, Canada.
q.
BD Vacutainer Safety-Lok blood collection set, BD Canada, Mississauga, Ontario, Canada.
r.
BD Vacutainer serum tube (catalog no. 367812), BD Canada, Mississauga, Ontario, Canada.
s.
BD Vacutainer sodium citrate tube (catalog no. 366415), BD Canada, Mississauga, Ontario, Canada.
t.
BD Vacutainer K2EDTA tube (catalog no. 367841), BD Canada, Mississauga, Ontario, Canada.
u.
Monoject 6-mL syringe with regular Luer tip (catalog no. 8881516911), Tyco Healthcare Group LP, Mansfield, MA.
v.
Coulter blood mixer, Coulter Electronics Inc., Hialeah, FL.
w.
Multiplate ADP test kit (catalog no. MP0220), Verum Diagnostica GmbH, Munich, Germany.
x.
Multiplate COL test kit (catalog no. MP0230), Verum Diagnostica GmbH, Munich, Germany.
y.
Multiplate ASPI test kit (catalog no. MP0210), Verum Diagnostica GmbH, Munich, Germany.
z.
Multiplate test cells (catalog no. MP0027), Verum Diagnostica GmbH, Munich, Germany.
aa.
Multiplate NaCl/CaCl2 (catalog no. MP0530), Verum Diagnostica GmbH, Munich, Germany.
bb.
Dade PFA Collagen/ADP test cartridge (catalog no. B4170-21A), Siemens Healthcare Diagnostics Products GmbH, Marburg, Germany.
cc.
SAS v. 9.1, SAS Institute Inc., Cary, NC.
dd.
Analyze it for Excel v. 2.24, Analyse-It Software Ltd, Leeds, United Kingdom.
Declaration of Conflicting Interests
The author(s) declared the following potential conflicts of interest with respect to the research, authorship, and/or publication of this article: Two Plateletworks Combo-25 kits were generously donated by Ryan Medical, Burlington, Ontario, Canada.
Funding
The author(s) disclosed receipt of the following financial support for the research, authorship, and/or publication of this article: Funding for this work was provided by the Ontario Veterinary College Pet Trust.