
Abstract
Members of the S100 family of calcium-binding proteins (S100A8, A9, and A12; calgranulins) have been associated with inflammation and cancer in human beings. Proteins S100A8 and A9 were overexpressed in human patients with transitional cell carcinoma (TCC) and prostate carcinoma (PCA), suggesting their potential as biomarkers for diagnosing and/or predicting the progression of such neoplasms. Calgranulins have not been studied in dogs with TCC or PCA. Established in-house immunoassays were validated and found suitable for measuring S100A8/A9 and S100A12 in canine urine samples to allow the study of the role of these biomarkers in dogs with TCC or PCA. Urinary calgranulin concentrations were not affected by blood contamination (e.g., due to cystocentesis), and should be normalized against urine specific gravity or urinary creatinine concentration. Urinary calgranulin concentrations were significantly increased in 11 dogs with TCC or PCA (untreated) compared to 42 healthy dogs, and the ratio between S100A8/A9 and S100A12 was significantly higher in 11 dogs with TCC or PCA than in 10 dogs diagnosed with a urinary tract infection, suggesting that calgranulins are potential biomarkers for TCC or PCA in canine patients. The clinical utility of measuring urinary calgranulins in dogs with suspected TCC or PCA warrants further investigation.
Introduction
Canine transitional cell carcinoma (TCC) is the most common naturally occurring primary tumor of the urinary bladder in dogs. 33 Clinically, dogs with TCC usually present with nonspecific signs of lower urinary tract disease of varying chronicity. A caudal abdominal mass, thickened urethra, or enlarged sublumbar and/or intrapelvic lymph nodes may be palpable in patients with advanced stages of disease, 33 but normal physical examination findings do not rule out TCC. Thus, diagnosing TCC requires a complete blood cell count, serum biochemistry profile, urinalysis, urine culture (to rule out concurrent lower urinary tract infection), thoracic and abdominal radiographs, specific diagnostic imaging of the bladder and perivesicular tissues, and finally, histologic confirmation of the TCC. Criteria for the diagnosis of TCC based on evaluation of a urine sample are currently lacking. Traditional diagnostic modalities (i.e., urine cytology) have a low sensitivity (approximately 30%) 35 and specificity, and the veterinary bladder tumor antigen test has been shown to be sensitive but of limited clinical value due to a high false-positive rate.1,17 Thus, the search continues for novel biomarkers that could be used to screen canine patients with suspected TCC or even dogs without a high index of clinical suspicion of bladder and/or prostate carcinoma (PCA) to facilitate early diagnosis.
Calgranulins (S100A8, A9, and A12) are innate antimicrobial proteins that have been proposed as biomarkers for inflammatory diseases, 24 and the understanding of the role of S100A8/A9, secreted as a heterodimeric complex, in tumor biology is also emerging. 6 Rearrangement of the S100 gene cluster on human chromosome 1 has been observed in human epithelial tumors, 32 and the expression and/or function of several S100 proteins was shown to be altered in patients with different cancers, 38 such as bladder39,41 or prostate cancer.18,19 The S100A8/A9 proteins were overexpressed in the bladder urothelium in human patients with TCC 39 and experimental rodents with bladder tumors, and were identified as part of a 4-gene signature whose expression was strongly predictive of disease progression in patients with invasive bladder cancer. 27 The S100A8/A9 complex (i.e., calprotectin) has been associated with the regulation of cell proliferation, 18 tumor metastasis, and tumor invasion.20,37 In vitro, S100A8/A9 showed antineoplastic activity,3,8 while other studies found that the proteins promote cancerogenesis and tumor cell migration,18,20,40 a functional dichotomy that appears to be concentration dependent. S100A12 was not significantly expressed in various human tumor tissues, 23 but S100A12 has not been investigated extensively in cancer patients, probably attributable to the fact that rodent models cannot be utilized to study S100A12 owing to its lack in rodents. 5
Bladder epithelial cells are important in innate immune responses due to the expression of Toll-like receptors (TLR), 10 and thus in infections and sterile lesions. Studies suggest a central role of the pattern recognition receptors RAGE (receptor for advanced glycation end products) and TLR4 in mediating the effects of S100A8/A9 in cancer,6,9,18,40 and RAGE was shown to be overexpressed in patients with prostate cancer. 19 With calgranulins representing ligands of RAGE 22 and TLR4, 3 their expression may be linked to a microenvironment that promotes growth, invasion, and/or metastasis of the primary tumor similar to the “field effect” proposed in human beings. 26
Despite differences in sex predisposition and tumor location within the urinary bladder, canine TCC bears close resemblance to human invasive bladder cancer in terms of histology, metastasis, response to treatment, and prognosis.16,28 Thus, studying S100A8/A9 and A12 in dogs with TCC contributes to comparative oncology research involving the calgranulins for diagnosing bladder cancer, assessing disease progression, and as potential novel therapeutic strategies in patients with bladder cancer. Although their functions may be species specific, the fact that homologs of all 3 calgranulins exist in dogs while rodents lack S100A12 5 (and S100A8 appears to functionally resemble S100A12)4,24 would render a canine TCC model superior to rodent models for studying calgranulins in human bladder cancer. Future studies into the function of calgranulins in tumor progression and metastasis, and their proposed use as novel selective therapeutic targets in cancer 7 should therefore benefit from studies in dogs. The aim of the current study was 1) to analytically validate established immunoassays for the measurement of canine (c)S100A8/A9 and cS100A12 for the use with urine samples from dogs, and 2) to measure urinary cS100A8/A9 and cS100A12 concentrations in a small group of dogs diagnosed with TCC or PCA and also a group of dogs diagnosed with a urinary tract infection (UTI), as a first step to investigate the role of calgranulins in dogs with TCC or PCA.
Materials and methods
Sample population
Group A was composed of 42 healthy dogs of varying ages, sexes, and breeds (breeds that represented more than 1 dog included Labrador Retrievers, Dachshunds, Miniature Schnauzers, and mixed breeds) with no clinical signs of lower urinary tract disease, normal results on urinalysis (urine dipstick test a and refractometer b –urine specific gravity [USG]), and no other conditions or medications given that are known to affect the urogenital tract. Group B included 11 dogs of varying ages, sexes, and breeds (3 Labrador Retrievers, 2 Scottish Terriers, 4 mixed breeds, 1 Beagle, and 1 Boston Terrier) that were diagnosed with TCC or PCA of the bladder (n = 7), urethra (n = 7), and/or prostate (n = 1) based on clinical signs of lower urinary tract disease (disease duration: median [range] = 1.0 [0.1–5.0] months), abdominal ultrasound findings, and confirmation of TCC or PCA by either cytology (n = 7) or histology (n = 4). None of these dogs had received any treatment for TCC or PCA. Group C included 10 dogs of varying ages, sexes, and breeds (2 Dachshunds, 2 Pugs, and 1 each of Cocker Spaniel, fox terrier [type not specified], French Bulldog, Golden Retriever, Scottish Terrier, and Siberian Husky) diagnosed with a UTI based on a urinalysis and a quantified urine culture with sensitivity testing.
Collection of urine specimens
Spot urine samples were collected from 42 healthy dogs (group A) during natural voiding (n = 32) or by cystocentesis (n = 8). Urine samples from 11 dogs that were newly diagnosed with TCC or PCA (group B) were obtained during natural voiding (n = 4), following urethral catheterization (n = 2), or by cystocentesis (n = 3); for the remaining samples (n = 2), the method of collection was unknown. Urine specimens were obtained from 10 dogs diagnosed with UTI (group C) by cystocentesis (n = 9) or during natural voiding (n = 1). Diagnosis of a UTI was based on the results of a quantified urine culture, with a single isolate in 6 dogs and a polymicrobial UTI in 4 dogs. Escherichia coli was most frequently isolated (n = 6), followed by Proteus mirabilis (n = 3), Streptococcus canis (n = 2), and Pseudomonas aeruginosa, Klebsiella spp., Enterococcus, Staphylococcus pseudintermedius, and Actinobacillus spp. (each n = 1). The protocol for collection of urine samples from healthy dogs and dogs with urinary tract disease was reviewed and approved by the Clinical Research Review Committee at Texas A&M University (CRRC#2006-26 and #2010-43). A quantified urine culture (including sensitivity testing) was performed for 7 of the 11 dogs (64%) in group B, but for none of the dogs in group A.
Processing and analysis of urine specimens
Debris was separated from the soluble urine protein fraction by centrifugation for 3 min at 1,000 × g and at approximately 23°C. The supernatants were placed into cryovials and stored frozen at −80°C until further analysis.
Urine samples were then thawed and an aliquot diluted 1:2 in 0.05 M sodium phosphate, 0.02% (weight/volume [w/v]) sodium azide, and 0.5% (w/v) bovine serum albumin (pH 7.5) for urinary canine calgranulin analysis. Previously developed radioimmunoassays (RIAs) were used to measure cS100A8/A9 13 and cS100A12 concentrations 12 in urine samples. Specific gravity (USG) was measured refractometrically, b urine creatinine concentration (U-CRE) was measured using a commercial assay on a clinical chemistry analyzer, c and urine protein concentration (U-PROT) was estimated by a Bradford assay.d,34
To address variances due to urine dilution, USG, U-CRE, and U-PROT were used in a ratio format. Concentrations of cS100A8/A9 and cS100A12 in urine were USG-normalized by calculating cS100A8/A9USG = (cS100A8/A9 [µg/l] ÷ 100 × [USG − 1]) and cS100A12USG = (cS100A12 [µg/l] ÷ 100 × [USG − 1]), respectively. Normalization against U-CRE was obtained as cS100A8/A9U-CRE = (100 × cS100A8/A9 [µg/l] ÷ U-CRE [mg/l]) and cS100A12U-CRE = (100 × cS100A12 [µg/l] ÷ U-CRE [mg/l]), respectively. Finally, normalization against U-PROT was calculated as cS100A8/A9U-PROT = (100 × cS100A8/A9 [µg/l] ÷ U-PROT [mg/l]) and cS100A12U-PROT = (100 × cS100A12 [µg/l] ÷ U-PROT [mg/l]), respectively. The cS100A8/A9-to-cS100A12 ratio was calculated as cS100A8/A9-A12 = (cS100A8/A9 [µg/l]) ÷ (cS100A12 [µg/l]).
Analytical validation of the immunoassays
For analytical validation of the immunoassays, surplus urine samples from dogs (i.e., age, sex, breed, and health status were unknown) were obtained. Established in-house RIAs validated for the measurement of cS100A8/A9 and cS100A12 in canine serum and fecal extracts were validated for use with urine specimens by determining the parameters described previously.12,13
Briefly, lower detection limits of the RIAs were calculated for urine samples taking into account the dilution factor. Assay linearity was evaluated by dilutional parallelism for 5 different urine samples each at serial 2-fold dilutions from 1:1 to 1:8. One urine specimen each with a higher cS100A8/A9 and cS100A12 concentration, respectively, was diluted 1:8–1:128. Assay accuracy was tested by spiking 6 different urine samples each with known concentrations of cS100A8/A9 (0, 7.8, 15.6, 31.3, 62.5, 125, 250, and 500 µg/l) and cS100A12 (0, 1, 2, 5, 10, 20, 50, and 100 µg/l), respectively. Percentage of standard antigen recovery (spiking recovery) was calculated as (observed value [µg/l] × 100 ÷ expected value [µg/l]). Precision of the assays was evaluated by assaying 6 different canine urine samples each 10 times within the same assay followed by calculating the intra-assay coefficient of variation (%CV) = ([SD × 100] ÷ mean). Reproducibility of the assays was determined by analyzing 6 different urine specimens from dogs in 10 consecutive assay runs and calculating interassay CVs. Analytical specificity of the cS100A8/A9 RIA was determined by assessing cross-reactivity of the assay with 10−100,000 µg/l of cS100A12, the closest structural analog of cS100A8/A9 available. Analytical specificity of the cS100A12 assay has been demonstrated previously. 12
Effect of blood content on urine cS100A8/A9 and S100A12 concentrations
The effect of blood contamination or hematuria on the results for urine cS100A8/A9 and cS100A12 concentrations was tested by spiking 5 canine urine samples each (with low and moderate cS100A8/9 and cS100A12 concentrations, respectively) with fresh canine whole blood 1 (without an anticoagulant) to final dilutions of 0, 1.4 × 10⁻⁶, 3.6 × 10⁻⁶, 7.1 × 10⁻⁶, 3.6 × 10⁻⁵, 1.1 × 10⁻⁴, 1.1 × 10⁻³, 1.1 × 10⁻², and 1.1 × 10⁻¹. The dilutions correspond to urine samples without (grade 0), with trace (grade 1), + (grade 2), ++ (grade 3), +++ (grade 4), as well as 3-fold, 30-fold, 300-fold, and 3,000-fold that of +++ blood based on a commercial urine dipstick test. a After spiking, samples were stored frozen at −80°C, and were then thawed, centrifuged at 1,000 × g at approximately 23°C for 3 min, and analyzed for cS100A8/A9 and cS100A12 as described.
Statistical analyses
Data was investigated for normality and equal variances by use of a Shapiro–Wilk W test and a Brown–Forsythe test, respectively. A Wilcoxon rank-sum test was used for 2-group comparisons and the summary statistics reported as medians [ranges] if the assumptions of normality and/or equal variances did not hold. A Spearman correlation coefficient was used to assess the relation between cS100A8/A9 and cS100A12 in urine samples. A Friedman test with a Dunn post hoc test (unspiked samples used as controls) served to test for an effect of blood on cS100A8/A9 and cS100A12 in urine samples. A receiver operating characteristic (ROC) curve analysis was used to determine the sensitivity and specificity of urine cS100A8/A9–A12 ratio to distinguish dogs with TCC or PCA from dogs with UTI; the Youden index and the likelihood ratio were used to determine the optimal cutoff ratio for the diagnosis of TCC or PCA. Differences were considered significant if P < 0.05. Statistical softwaree,f was used for data analysis.
Results
Analytical validation of the immunoassays
Lower detection limits of the cS100A8/A9 and the cS100A12 assay were calculated as 14.5 and 1.3 µg/l, respectively. Observed-to-expected values for the serial dilution of 6 different urine samples each with a wide range of cS100A8/A9 and cS100A12 concentrations correlated closely (Table 1), indicating linearity of both assays for canine urine samples. For cS100A12, dose–response curves for 3 out of 5 urine samples diluted 1:2–1:32 paralleled the standard curve indicating a matrix effect if samples (especially those with abnormally low USG) were analyzed undiluted. Observed-to-expected ratios for spiking 6 different urine samples each with 7 different cS100A8/A9 concentrations and 8 different cS100A12 concentrations, respectively, demonstrated accuracy of both assays for the evaluation of urine samples (Table 2). Intra- and interassay CVs for 6 different urine samples indicated precision and reproducibility of both assays for evaluation of canine urine samples (Table 3).
Results for dilutional parallelism of urine samples for the canine (c)S100A8/A9 and cS100A12 radioimmunoassays.*
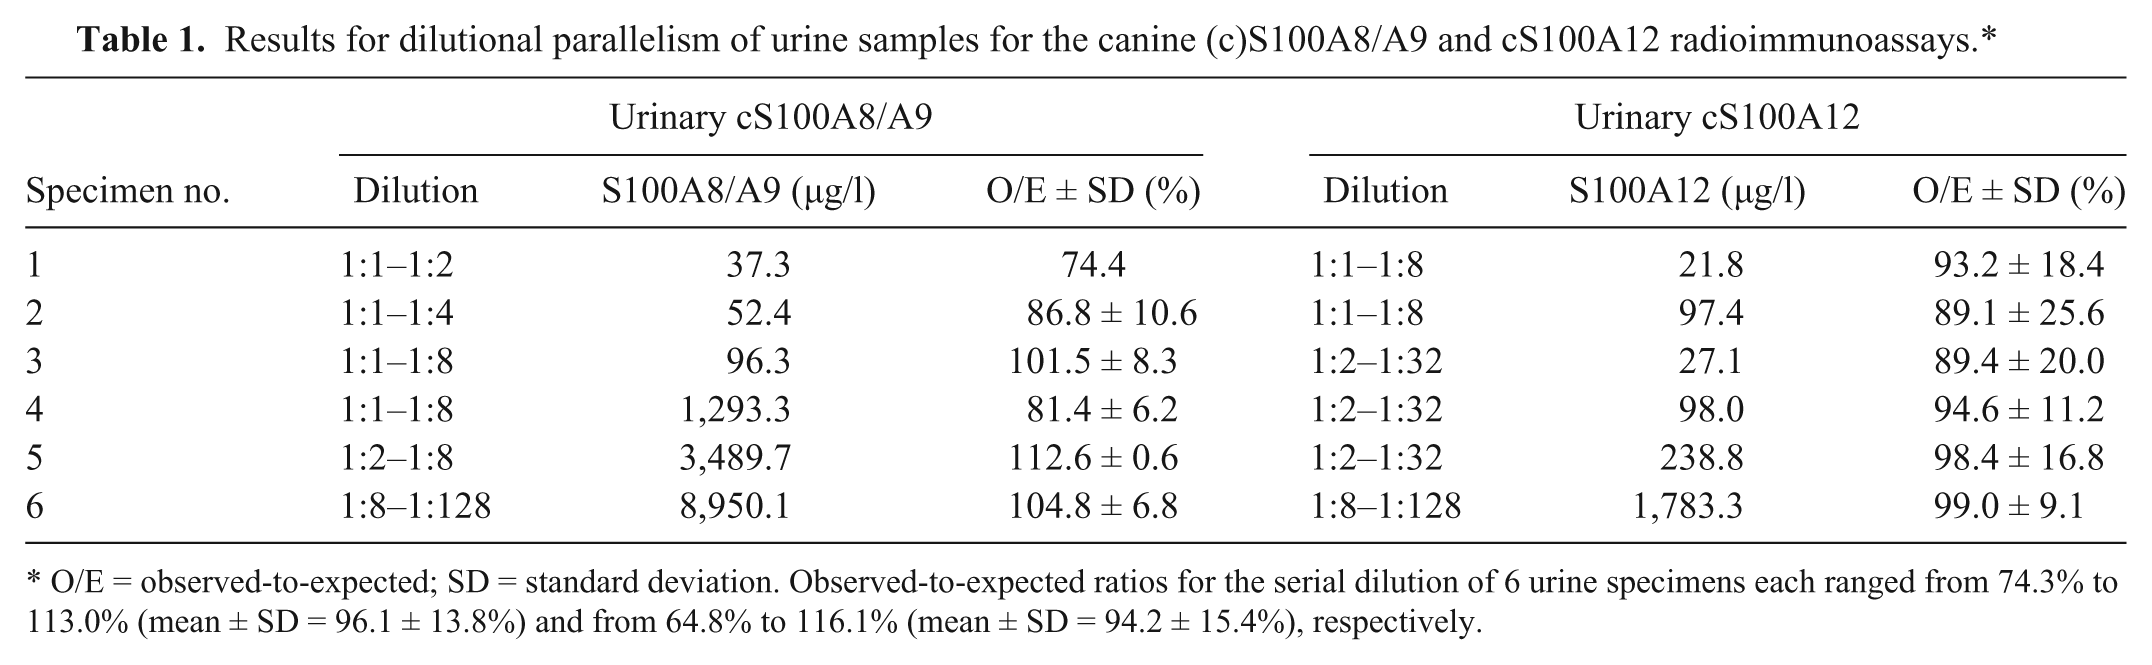
O/E = observed-to-expected; SD = standard deviation. Observed-to-expected ratios for the serial dilution of 6 urine specimens each ranged from 74.3% to 113.0% (mean ± SD = 96.1 ± 13.8%) and from 64.8% to 116.1% (mean ± SD = 94.2 ± 15.4%), respectively.
Results for spiking recovery of urine samples with canine (c)S100A8/A9 and cS100A12.*
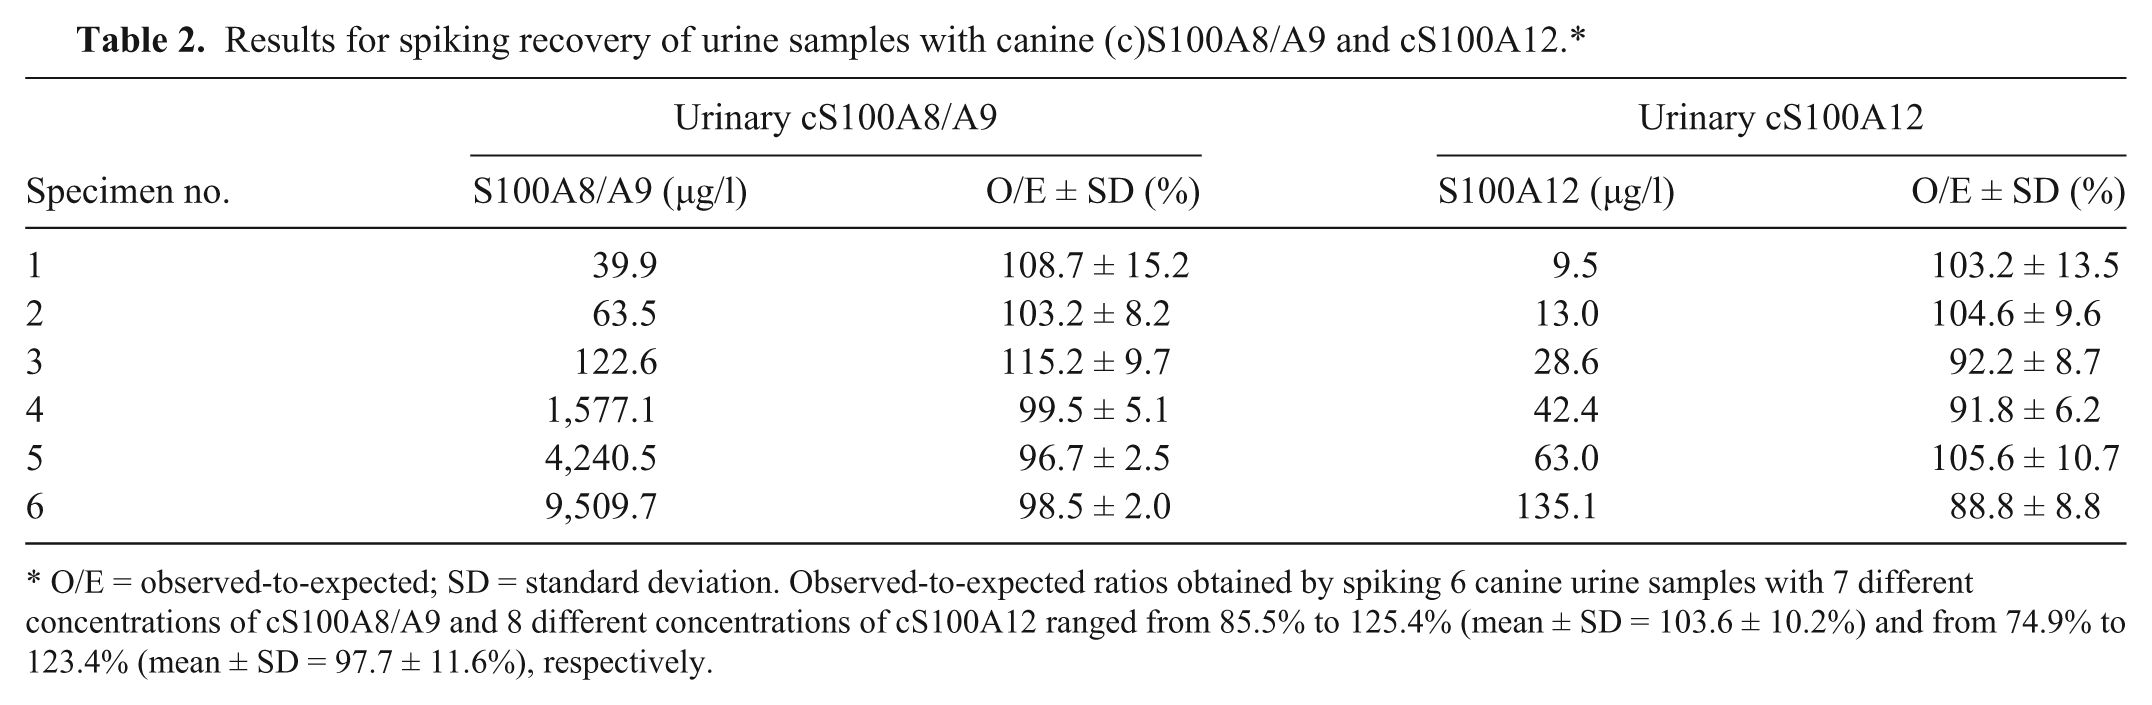
O/E = observed-to-expected; SD = standard deviation. Observed-to-expected ratios obtained by spiking 6 canine urine samples with 7 different concentrations of cS100A8/A9 and 8 different concentrations of cS100A12 ranged from 85.5% to 125.4% (mean ± SD = 103.6 ± 10.2%) and from 74.9% to 123.4% (mean ± SD = 97.7 ± 11.6%), respectively.
Precision and reproducibility of the radioimmunoassays for measurement of canine (c)S100A8/A9 and cS100A12 in urine specimens from dogs.*
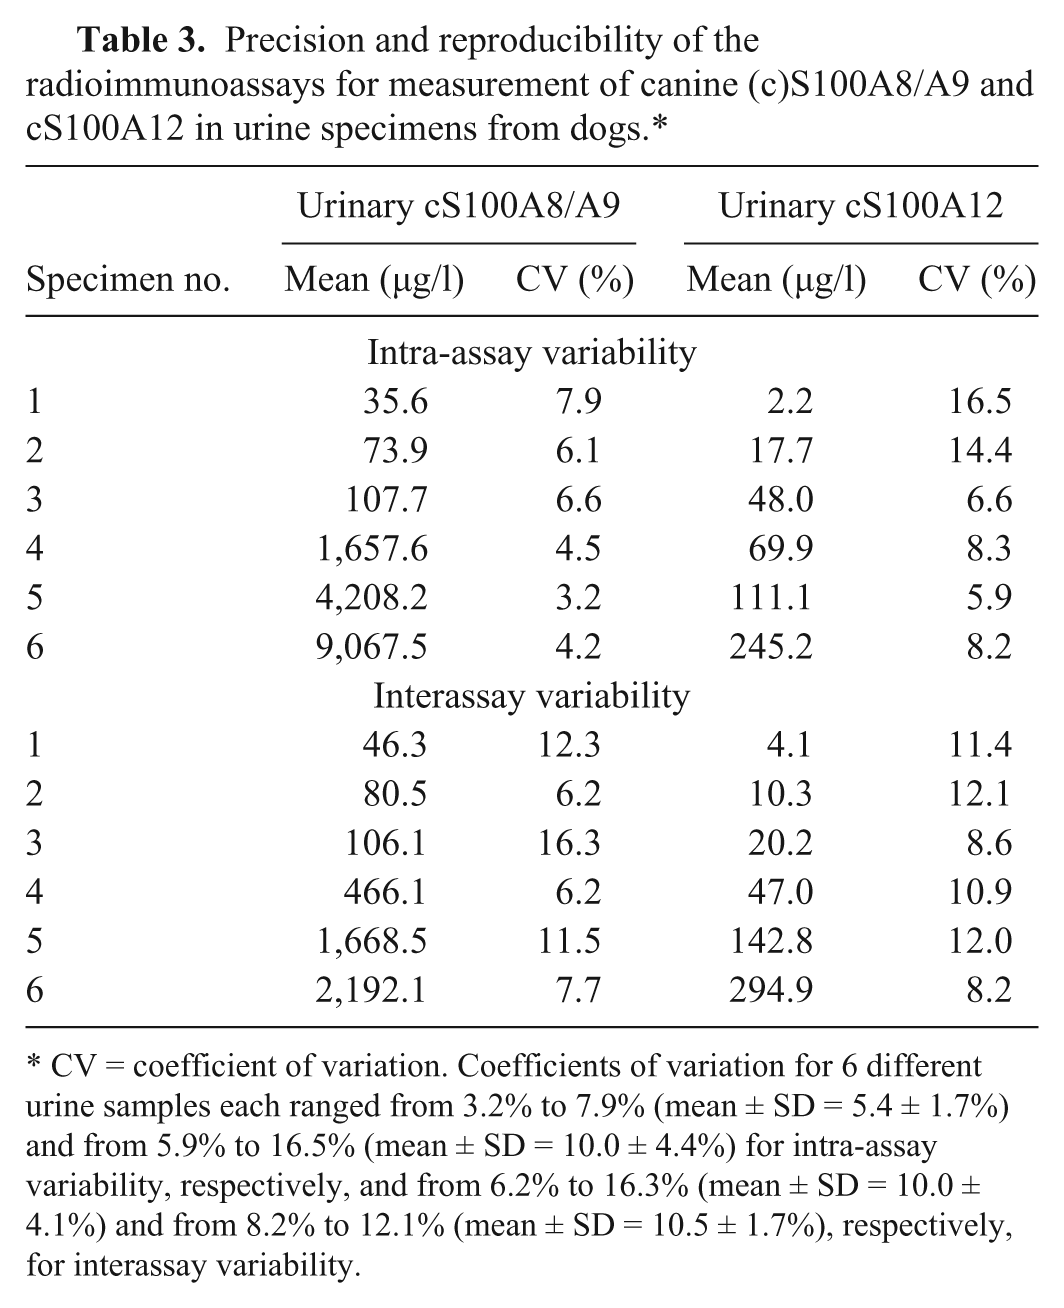
CV = coefficient of variation. Coefficients of variation for 6 different urine samples each ranged from 3.2% to 7.9% (mean ± SD = 5.4 ± 1.7%) and from 5.9% to 16.5% (mean ± SD = 10.0 ± 4.4%) for intra-assay variability, respectively, and from 6.2% to 16.3% (mean ± SD = 10.0 ± 4.1%) and from 8.2% to 12.1% (mean ± SD = 10.5 ± 1.7%), respectively, for interassay variability.
Because of the previous lack of structural analogs, analytical specificity of the cS100A8/A9 RIA was shown by dilutional parallelism and spiking recovery. 13 Their closest analog and third member of the canine calgranulin family, the cS100A12 protein, has been purified 15 and was used to further evaluate the analytical specificity of the cS100A8/A9 RIA. No cross-reactivity of the RIA for cS100A8/A9 was found with the cS100A12 protein up to a concentration exceeding that of the top standard of the assay by 100-fold (Fig. 1).
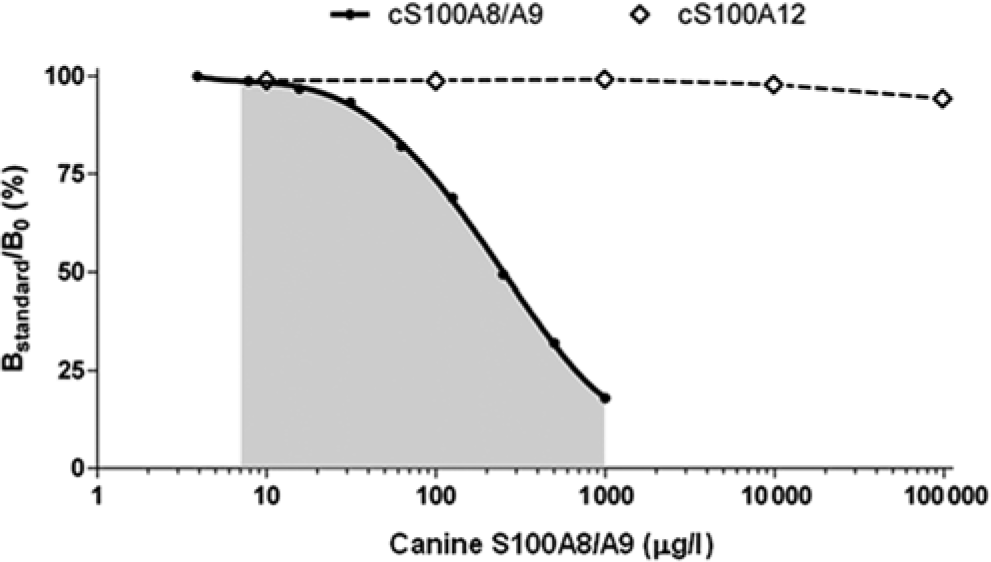
Representative standard curve for the measurement of the canine (c)S100A8/A9 protein complex (●) by radioimmunoassay. The gray shaded area represents the working range of the assay. No cross-reactivity was observed with up to 100,000 µg/l cS100A12 protein (⃟).
Effect of blood on urine cS100A8/A9 and cS100A12 concentrations
Increasing amounts of blood spiked into urine had no significant effect on cS100A8/A9USG (P = 0.1310) or cS100A8/A9U-CRE (P = 0.0928). Statistical significance was found overall but not in post hoc tests for either cS100A12USG (P = 0.0033) or cS100A12U-CRE (P = 0.0011), whereas cS100A8/A9U-PROT (P = 0.0001) and cS100A12U-PROT (P < 0.0001) significantly decreased with macroscopically evident blood contamination (i.e., 1.1 × 10⁻² and 1.1 × 10⁻³ dilution, respectively; Supplementary file). The low number of samples collected by each method limited the ability to test for differences among urine samples collected free-catch, by cystocentesis, or by catheterization for either urinary cS100A8/A9 or cS100A12 concentrations.
Urine cS100A8/A9 and cS100A12 concentrations in dogs with TCC or PCA, healthy controls, and dogs with UTI
Urine cS100A8/A9USG and cS100A8/A9U-CRE were significantly higher in dogs with TCC or PCA (group B) when compared to healthy controls (group A; P = 0.0008 and P = 0.0005, respectively). Also, urine cS100A8/A9USG and cS100A8/A9U-CRE were significantly higher in dogs with UTI (group C) when compared with healthy controls (group A; P = 0.0084 and P = 0.0003, respectively; Table 4; Fig. 2A). Urine cS100A8/A9U-PROT was numerically higher in group B than in group A and group C, but the difference was not statistically significant.
Urine canine (c)S100A8/A9 and cS100 A12 concentrations (normalized against urine specific gravity [USG], urine creatinine concentration [U-CRE], and urine protein concentration [U-PROT]) and the cS100A8/A9-to-cS100A12 ratio in canine patients with transitional cell carcinoma (TCC) or prostate carcinoma (PCA), dogs with urinary tract infection (UTI), and healthy control dogs.*
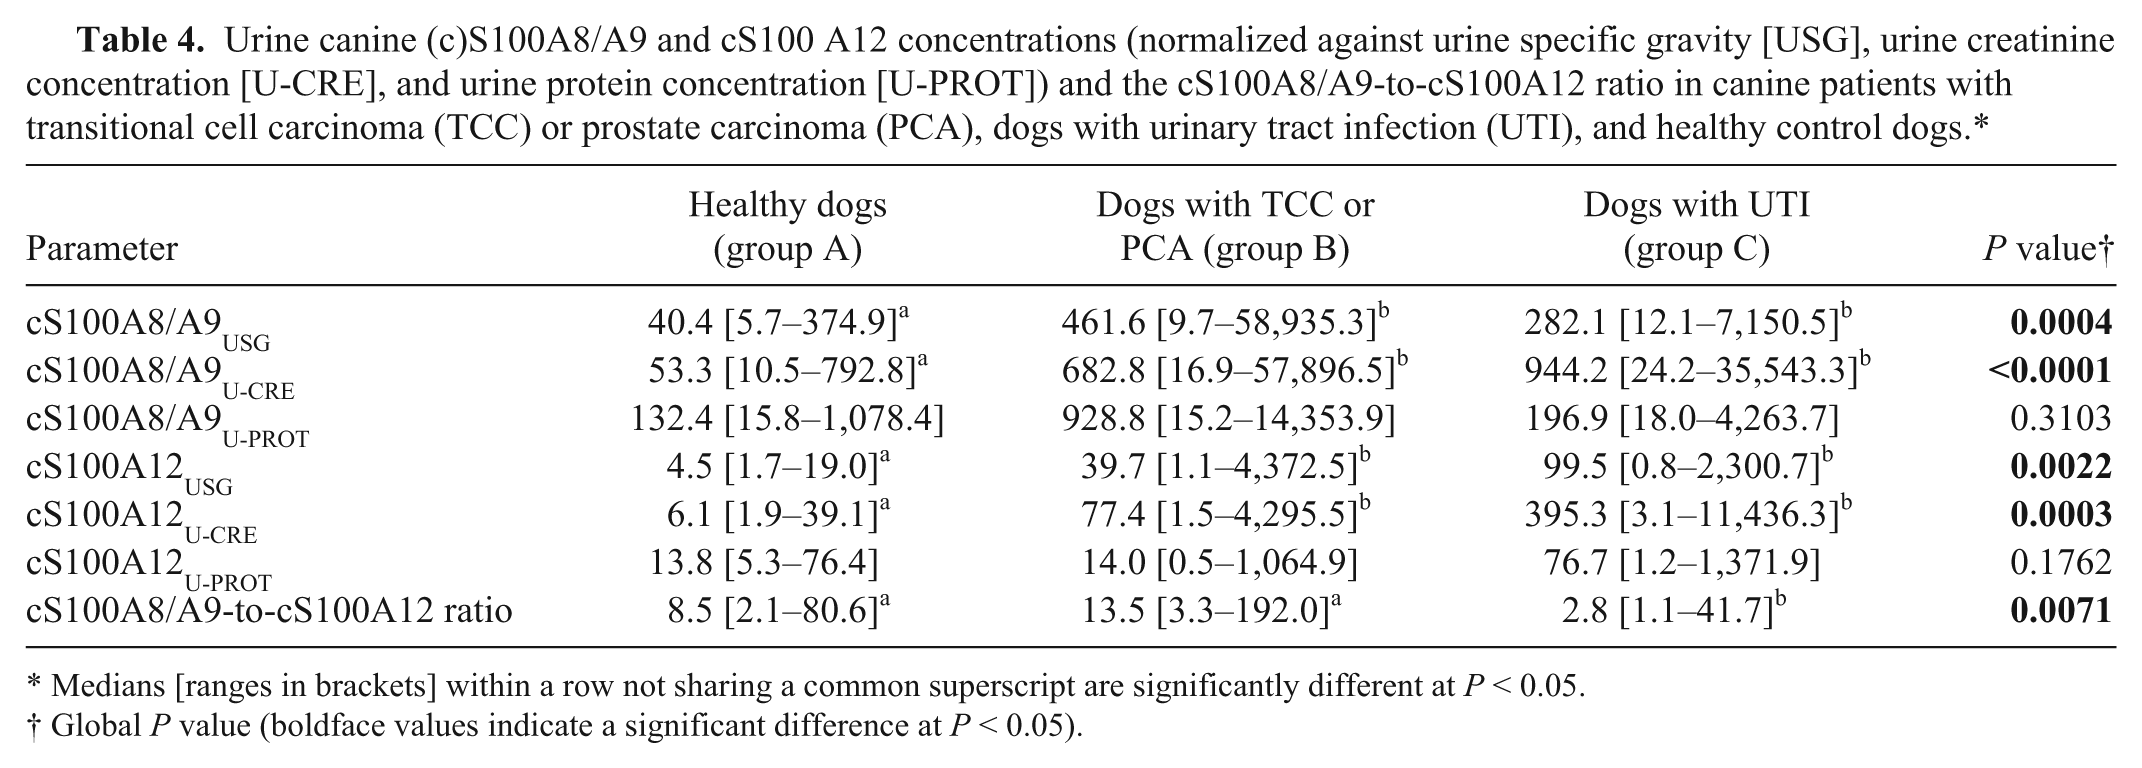
Medians [ranges in brackets] within a row not sharing a common superscript are significantly different at P < 0.05.
Global P value (boldface values indicate a significant difference at P < 0.05).
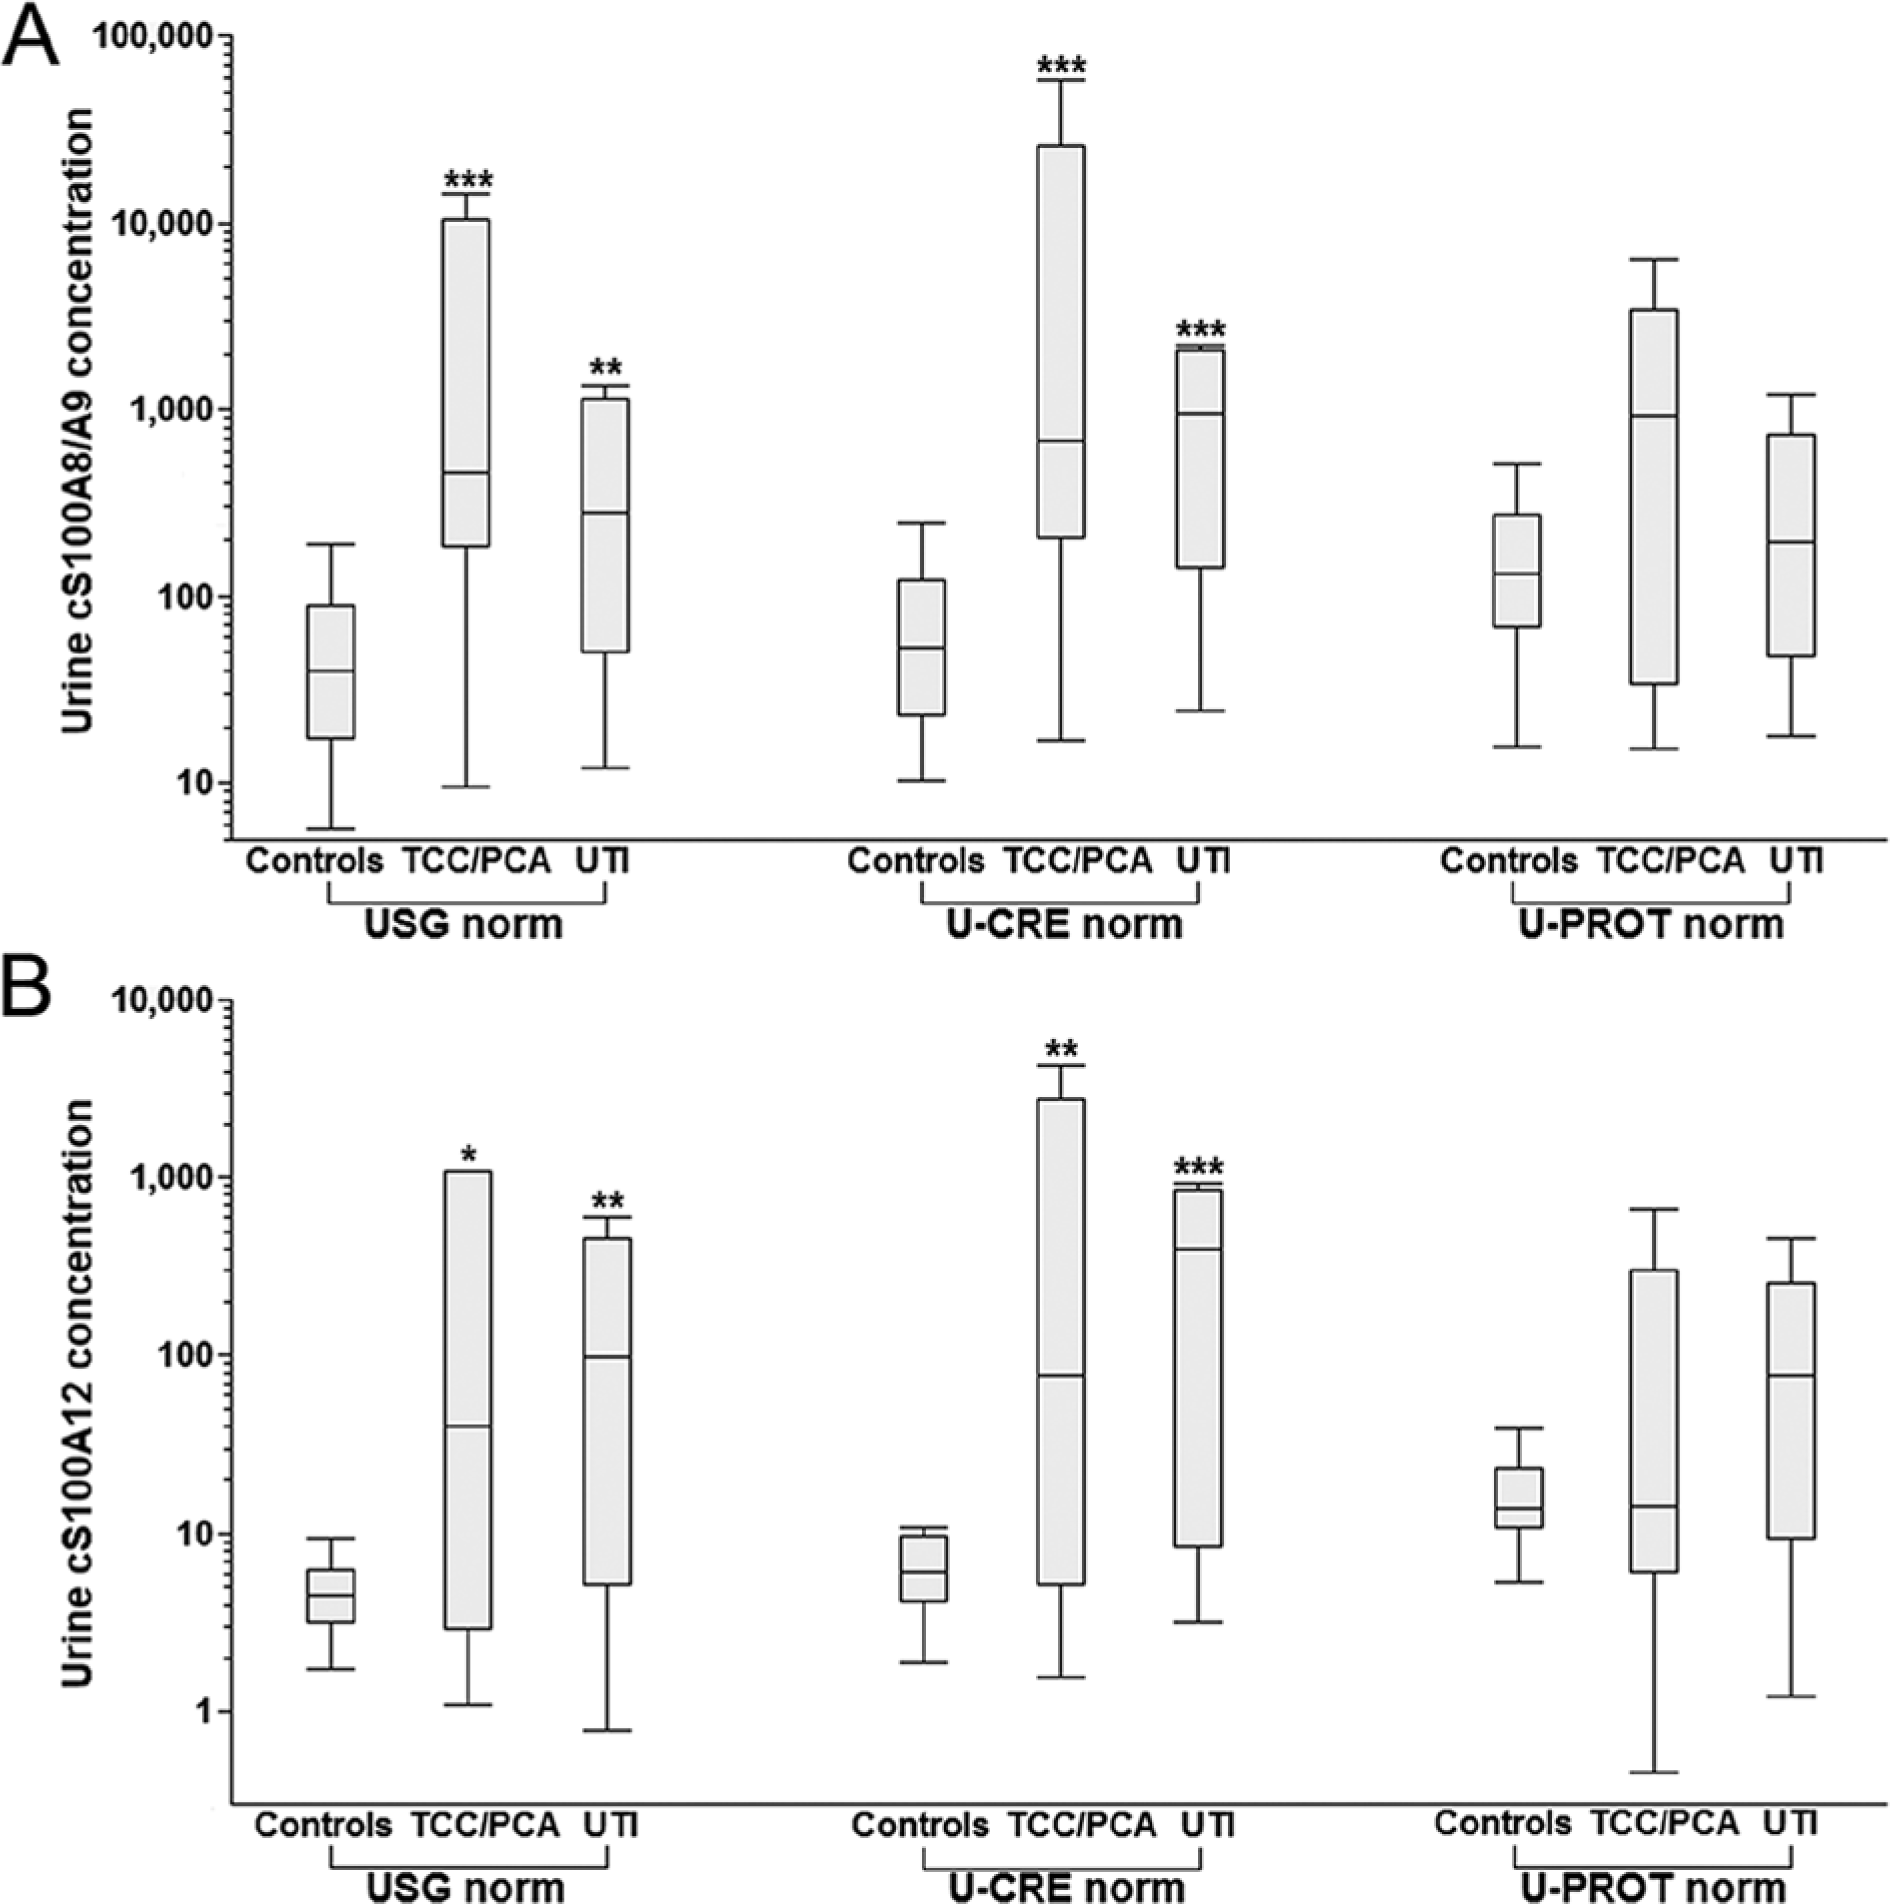
Box plots showing urine canine (c)S100A8/A9 and cS100A12 concentrations normalized against urine specific gravity (USG), urine creatinine (U-CRE), and urine protein concentration (U-PROT) in healthy dogs, dogs with transitional cell carcinoma (TCC) or prostate carcinoma (PCA), and dogs with urinary tract infection (UTI).
Urine cS100A12USG and cS100A12U-CRE were significantly higher in group B than in group A (P = 0.0154 and P = 0.0068, respectively), and were also significantly higher in group C than in group A (P = 0.0033 and P = 0.0007, respectively; Table 4; Fig. 2B). Urine cS100A12U-PROT was numerically higher in group C than in group A and group B, but the difference did not reach statistical significance.
The cS100A8/A9-A12 ratio was significantly lower in dogs with UTI (group C) compared to dogs with TCC (group B; P = 0.0124) or healthy controls (group A; P = 0.0096), but did not differ between dogs with TCC (group B) and healthy controls (group A; P = 0.1070; Table 4). Although the sample size was small, using a cutoff ratio of 3.3, the sensitivity and specificity of the cS100A8/A9–A12 ratio to distinguish dogs with TCC or PCA from dogs with UTI were 100% (95% confidence interval [CI]: 72–100%) and 70% (95% CI: 35–93%), respectively, with an area under the ROC curve (AUC) of 83% (95% CI: 63–100%) and a misclassification rate of 14% (Fig. 3). Urine pH was measured in 62 out of 63 urine samples and ranged from 5 to 9 (median: 6.5), which was considered appropriate for measuring calgranulin concentrations if samples were assayed 1:2 diluted in a buffer with a pH of 7.5.
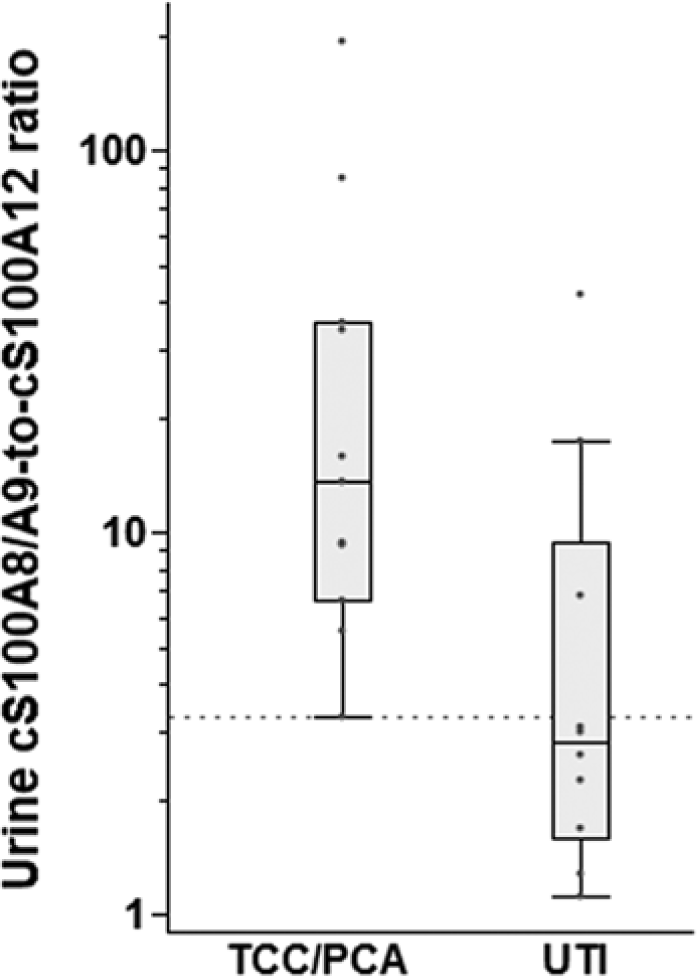
Box plots showing the urine canine (c)S100A8/A9-to-cS100A12 ratio in dogs with transitional cell carcinoma (TCC) or prostate carcinoma (PCA) and dogs with urinary tract infection (UTI). Dogs with TCC or PCA had significantly higher cS100A8/A9-to-cS100A12 ratios than dogs with UTI (P = 0.0124), and a ratio ≥3.3 (dotted line) distinguished dogs with TCC or PCA from dogs with UTI with moderate accuracy (area under the curve: 83%; 95% confidence interval: 63–100%). Box plots show the median and interquartile range for cS100A8/A9-to-cS100A12 ratios, and the whiskers represent the inner Tukey fences.
Normalized urine cS100A8/A9 and cS100A12 concentrations were not significantly different between healthy male and female dogs (data not shown), and the gender distribution was not different among the 3 groups of dogs (P = 0.0994). Because of the small number of sexually intact dogs in the current study, a possible correlation between reproductive status and calgranulin concentrations in urine could not be investigated.
Dogs with TCC or PCA (group B) and dogs with UTI (group C) were significantly older than healthy controls (group A; P < 0.0001 and P = 0.0025, respectively), but age was not associated with urinary cS100A8/A9 or cS100A12 concentration in any group of dogs (data not shown). Dogs with TCC or PCA and dogs with UTI also had significantly lower USG (P = 0.0045 and P = 0.0184, respectively) and U-CRE (P = 0.0403 and P = 0.0002, respectively), but significantly higher U-PROT (P = 0.0009 and P = 0.0028, respectively) and U-PROT/U-CRE ratios (both P < 0.0001) than dogs in group A.
Urine cS100A8/A9 and cS100A12 concentrations were strongly correlated in dogs with TCC or PCA (ρ = 0.836; P = 0.0013) and dogs with UTI (ρ = 0.830; P = 0.0029) but were only moderately correlated in healthy controls (ρ = 0.629; P < 0.0001). A very strong correlation was evident between USG and U-CRE normalized cS100A8/A9 and cS100A12 (ρ = 0.950 and 0.909, respectively; both Ps < 0.0001) while U-PROT normalized concentrations correlated strongly with USG and U-CRE normalized cS100A8/A9 (ρ = 0.853 and 0.744, respectively; both Ps < 0.0001) and cS100A12 (ρ = 0.842 and 0.728, respectively; both Ps < 0.0001). Although the number of dogs was small, urine cS100A8/A9 and cS100A12 concentrations were not found to be different between dogs with TCC or PCA with a positive (n = 4) or a negative (n = 3) urine culture result (data not shown).
Discussion
Results for the analytical validation of the assay (Tables 1–3) indicated that both the cS100A8/A9 and the cS100A12 assay are sufficiently linear, accurate, precise, and reproducible for use with canine urine samples diluted 1:2. The lower detection limits for both assays appear to be adequate, considering the 0.90 fractile for nonnormalized concentrations measured in healthy dogs (780.8 and 37.4 µg/l, respectively) and the aim to identify dogs with increased urinary calgranulin concentrations.
Measuring urinary biomarkers in dogs with TCC or PCA has the advantage of easy access to naturally voided samples, representing a body fluid in direct contact with the tumor tissue and thus likely to contain tumor-specific proteins. Consistent with findings in human beings19,39,41 and the tissue- and differentiation-specific distribution of S100A8/A9 in epithelial neoplasias,29,31 both cS100A8/A9 and cS100A12 (USG and U-CRE normalized) were markedly increased in dogs with TCC or PCA. This suggests that calgranulins may potentially be clinically useful markers of lower urinary tract neoplasia in canine patients. Histologic grading, complete staging, or survival times were not investigated in the current study, and future studies will need to correlate calgranulin concentrations in urine and at the tissue level with the stage and grade of TCC or PCA in dogs.
Measuring urinary analytes of postrenal origin depends on the analytes’ expression and extracellular secretion as well as their intravesicular dilution, and requires relative quantification using an endogenous standard. Urine creatinine concentration is commonly used to normalize concentrations of urinary biomarkers, but may not be best suited if the mechanism of renal excretion of the marker (e.g., proteins expressed in the bladder urothelium) is not identical with that of creatinine 36 or where glomerular hyperfiltration may be expected (e.g., neoplastic diseases with a high amino acid turnover 21 ). Thus, USG and U-PROT were tested as alternative approaches to normalize urinary calgranulin concentrations. Urine specific gravity and U-CRE, both of which indicate urine dilution but can be affected independently by other factors (e.g., glucosuria), yielded comparable results for urinary calgranulin concentrations and were very strongly correlated, suggesting that both USG and U-CRE normalization may be used interchangeably. Urine protein concentration is expected to correct for renal losses, leakage from the intravascular space, and locally produced metabolites, but appears to be an inferior normalization parameter for canine calgranulins as it did not yield a significant difference between healthy dogs and patients with TCC or PCA. Construction of ROC curves and comparison of the AUCs for the 3 endogenous standards (i.e., USG, U-CRE, and U-PROT) would identify the optimum normalization approach for urine calgranulins, 25 but requires a larger sample size and thus, further investigation.
Glomerular filterability of a molecule depends on its molecular size and charge. Although cS100A8/A9 and cS100A12 are small molecules14,15 expected to pass the glomerular membrane freely, 11 due to their anionic charge at physiologic pH14,15 and their estimated size (due to higher order complex formation) and hydrophobicity at physiologic Ca2+ concentrations, a significant contribution of serum cS100A8/A9 and cS100A12 to concentrations detected in urine (physiologic conditions and absence of renal pathology provided) can be reasonably excluded. However, further studies in healthy dogs, dogs with increased serum cS100A8/A9 and/or cS100A12 concentrations associated with systemic disease, and in dogs with glomerular, interstitial, or tubular renal proteinuria are needed to test this assumption.
The collection of naturally voided urine is usually preferred over cystocentesis in patients with suspected bladder cancer to avoid penetrating the mass and seeding the needle tract with viable tumor cells. However, cystocentesis or urethral catheterization sometimes cannot be avoided due to urethral obstruction, and, in some patients, urine sampling will be performed during transurethral cystoscopy. 2 All these procedures bear the risk of contaminating the urine sample with blood. If the possibility for blood contamination of the sample collected by cystocentesis, urethral catheterization, or during cystoscopy were to have a significant effect on calgranulin concentrations in urine, samples for the measurement of calgranulin concentrations could only be collected by voiding. Therefore the effect of increasing amounts of blood spiked into urine specimens was investigated and it was found that a blood content of up to 11% does not interfere with USG and U-CRE normalized urine calgranulin concentrations as measured by RIA. The decrease in U-PROT normalized urine cS100A8/A9 and cS100A12 concentrations with macroscopically evident blood contamination (1.1% and 0.1%, respectively) presumably reflects the increasing proportion of serum proteins, indicating that U-PROT normalization is the normalization most affected by proteinuria. Samples collected by cystocentesis or urethral catheterization therefore are expected to yield similar results for calgranulins as naturally voided urine.
Concentrations of urine cS100A8/A9 relative to cS100A12, which is not affected by the degree of urine concentration, were higher in dogs with TCC or PCA than in dogs with UTI, but similar to those in healthy controls. In contrast, compared to healthy controls, USG and U-CRE normalized urine cS100A8/A9 and cS100A12 were significantly increased in both groups of dogs. Similar to a previous theory 30 in people with acute and chronic lung disease, predominance of cS100A12 in inflammatory disease (UTI) would suggest a differential role of the calgranulins in the pathogenesis of TCC or PCA versus UTI. Both TCC or PCA and UTI share characteristics of chronic inflammation, but cS100A12 may be more associated with inflammation and/or infection. Further research is warranted to evaluate calgranulins at the tissue level and also in urine samples from dogs with other urinary tract diseases (e.g., urolithiasis). Studies are also needed to evaluate the urinary calgranulin signature in dogs with TCC or PCA after treatment (e.g., laser ablation or chemotherapy).
In conclusion, both the cS100A8/A9 and the cS100A12 RIAs are suitable for use with urine specimens, and have the potential to distinguish healthy dogs from dogs with neoplastic diseases of the lower urinary tract. Dogs with TCC or PCA had a different calgranulin signature than dogs with a UTI, suggesting that calgranulins are potential biomarkers for TCC or PCA in canine patients. Urinary calgranulin concentrations should be normalized against USG or U-CRE. Future studies into the calgranulin pathways involved in canine TCC or PCA, the clinical utility of calgranulins as biomarkers for the diagnosis, prognosis, and therapeutic management of dogs with TCC or PCA, and the differentiation of TCC or PCA from other benign diseases (e.g., urolithiasis or benign polyps of the bladder) or other conditions of the urinary tract (e.g., chronic renal failure) are warranted.
Footnotes
Acknowledgements
The authors acknowledge the help of Dr. Mary Nabity, Dr. Stephanie Smith, Ms. Kelly Salgado, Ms. Katja Weber, and Dr. Niels Grützner with the collection of urine samples.
a.
Multistix, Siemens Healthcare Diagnostics Inc., Deerfield, IL.
b.
Clinical refractometer, Atago USA Inc., Bellevue, WA.
c.
Sirrus Creatinine LiquiColor, Stanbio Laboratory, Boerne, TX.
d.
Coomassie protein assay kit, Thermo Fisher Scientific Inc., Rockford, IL.
e.
JMP v10.0, SAS Institute Inc., Cary, NC.
f.
Prism v5.0, GraphPad Software Inc., La Jolla, CA.
Declaration of conflicting interests
The author(s) declared the following potential conflicts of interest with respect to the research, authorship, and/or publication of this article: Romy M. Heilmann, Jan S. Suchodolski, and Jörg M. Steiner have filed a patent application involving the immunoassay for the measurement of cS100A12 described in this article.
Funding
The author(s) declared that they received no financial support for their research, authorship, and/or publication of this article.